chapter four (the project ... · web viewthe curve indicates the characteristic parameters of the...
TRANSCRIPT
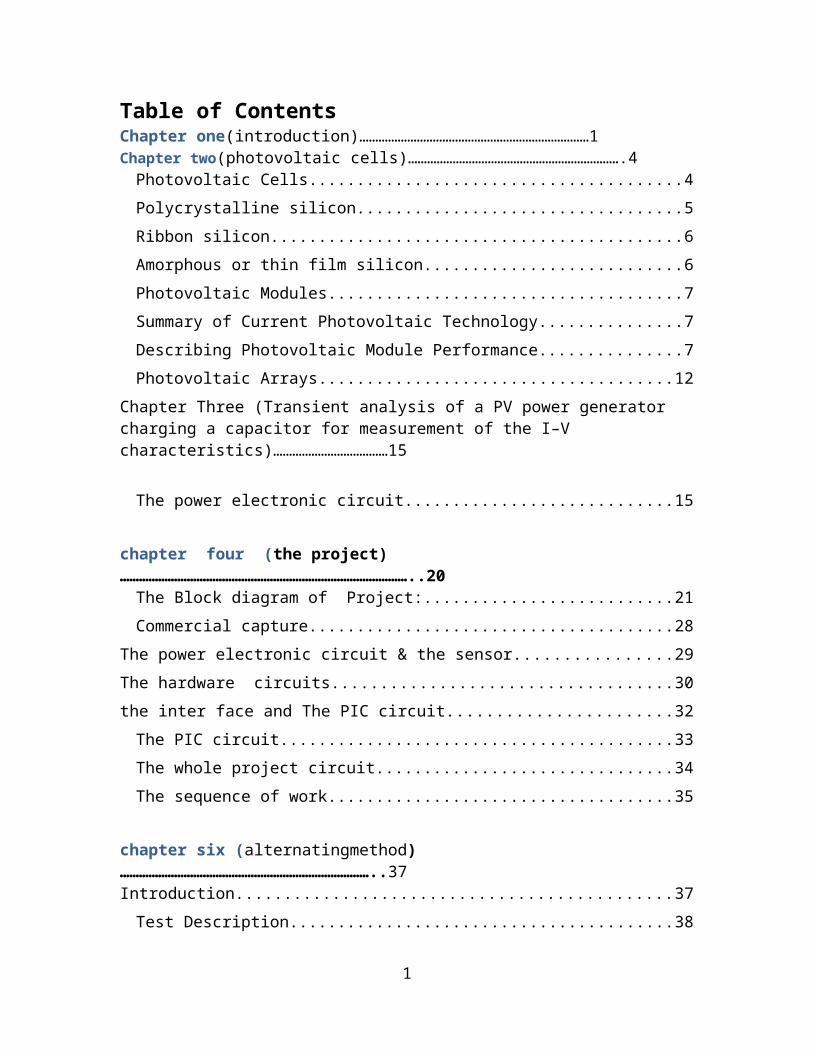
Table of ContentsChapter one(introduction)………………………………………………………………1Chapter two(photovoltaic cells)………………………………………………………….4
Photovoltaic Cells......................................................................................................4Polycrystalline silicon..............................................................................................5Ribbon silicon..............................................................................................................6Amorphous or thin film silicon.............................................................................6Photovoltaic Modules...............................................................................................7Summary of Current Photovoltaic Technology...............................................................7Describing Photovoltaic Module Performance................................................................7Photovoltaic Arrays................................................................................................12
Chapter Three (Transient analysis of a PV power generator charging a capacitor for measurement of the I–V characteristics)………………………………15
The power electronic circuit................................................................................15
chapter four (the project)………………………………………………………………………………..20
The Block diagram of Project:...........................................................................21Commercial capture...............................................................................................28
The power electronic circuit & the sensor.........................................................29The hardware circuits.......................................................................................................30the inter face and The PIC circuit..........................................................................32
The PIC circuit...........................................................................................................33The whole project circuit......................................................................................34The sequence of work...........................................................................................35
chapter six (alternatingmethod)……………………………………………………………………..37Introduction...................................................................................................................37
Test Description.......................................................................................................38Forward Bias I-V (Illuminated)............................................................................39Reverse Bias I-V (Dark).........................................................................................39Test System and Configuration.........................................................................40Programming the 2420 forCell Characterization........................................41Equipment List.........................................................................................................41
References.....................................................................................................................42
1

Chapter One
Introduction
easuring the I–V characteristics is of high importance since it can be considered as a quality and performance certificate for each PV generator. The most precise and inexpensive measuring
method is represented in capacitor charging by the PV generator. Using the equivalent circuit of the PV generator with a capacitor as load and applying transient analysis on the circuit, we obtain the capacitor charging voltage and current as a function of time, as well as their differentials as a function of short circuit current and capacitor size.
M
The I- V characteristics (or I- V curve) of a PV cell, module or array (PV generator) is the important key for identifying its quality and performance as a function of varying environmental parameters such as solar radiation and ambient temperature. The curve indicates the characteristic parameters of the PV generator represented in short circuit current, open circuit voltage and the point of maximum power at which the generator would work at its peak efficiency. These parameters are indispensable for designing any small or large PV power system. Moreover, the curve render determining the equivalent circuit components of the PV generator represented in the series resistance and shunt resistance, which are disclosure parameters for classifying the quality of the generator substrate material.
Therefore, it is of prime importance to measure the I- V characteristics with high accuracy under natural environmental conditions. The easiest method is to use variable resistor as a load to the PV generator and measure the stepwise voltage and current. The I- V curve obtained by this method is deficient in accuracy, uniformity and smoothness, due to manual change of the load resistor and slowness of the measuring process.
The second measuring method is to load the PV generator by a capacitor and to charge it fully from short circuit to open circuit, and to record the
2

respective voltage and current by X- Y recorder or a computerized data acquisition system (CDAS).
The I-V curve obtained by this method is much more accurate and uniform since it is measured in a very short time. In addition, it surpasses the first method by enabling the measurement of the I-V curve of PV generators of higher power with reasonable capacitor values.
The I- V characteristics (or I- V curve) of a PV cell, module or array (PV generator) is the important key for identifying its quality and performance as a function of varying environmental parameters such as solar radiation and ambient temperature. The curve indicates the characteristic parameters of the PV generator represented in short circuit current, open circuit voltage and the point of maximum power at which the generator would work at its peak efficiency. These parameters are indispensable for designing any small or large PV power system. Moreover, the curve render determining the equivalent circuit components of the PV generator represented in the series resistance and shunt resistance, which are disclosure parameters for classifying the quality of the generator substrate material.
System since the solar cell is still expensive. This thesis proposes the development of IV Curve tester for photovoltaic module, which is capable to measure the Maximum Power of 80 watts. This test set is also able to measure other electric important features of the solar cell; Open Circuit Voltage, Short Circuit Current, Maximum Voltage, Maximum Current and Fill Factor which show the measurement on the computer monitor. The IV Curve from the experiment by measuring and collecting current and voltage data of the solar cell should be good enough to be analyzed to find the electric features of the solar cell.
3

Chapter Two
Photovoltaic Cells
Photovoltaic Cells. At the present time, most commercial photovoltaic cells are manufactured from silicon, the same material from which sand is made. In this case, however, the silicon is extremely pure. Other, more exotic materials such as gallium arsenide are just beginning to make their way into the field. The four general types of silicon photovoltaic cells are:
Single-crystal silicon. Polycrystalline silicon (also known as multicrystal silicon). Ribbon silicon. Amorphous silicon (abbreviated as "aSi," also known as thin film
silicon). Single-crystal siliconMost photovoltaic cells are single-crystal types. To make them, silicon is purified, melted, and crystallized into ingots. The ingots are sliced into thin wafers to make individual cells. The cells have a uniform color, usually blue or black
Typically, most of the cell has a slight positive electrical charge. A thin layer at the top has a slight negative charge. The cell is attached to a base called a "backplane." This is usually a layer of metal used to physically reinforce the cell and to provide an electrical contact at the bottom.Since the top of the cell must be open to sunlight, a thin grid of metal is applied to the top instead of a continuous layer. The grid must be thin enough to admit adequate amounts of sunlight, but wide enough to carry adequate amounts of electrical energy
4

Light, including sunlight, is sometimes described as particles called "photons." As sunlight strikes a photovoltaic cell, photons move into the cell. When a photon strikes an electron, it dislodges it, leaving an empty "hole". The loose electron moves toward the top layer of the cell. As photons continue to enter the cell, electrons continue to be dislodged and move upwards If an electrical path exists outside the cell between the top grid and the backplane of the cell, a flow of electrons begins. Loose electrons move out the top of the cell and into the external electrical circuit. Electrons from further back in the circuit move up to fill the empty electron holes.Most cells produce a voltage of about one-half volt, regardless of the surface area of the cell. However, the larger the cell, the more current it will produce.Current and voltage are affected by the resistance of the circuit the cell is in. The amount of available light affects current production. The temperature of the cell affects its voltage. Knowing the electrical performance characteristics of a photovoltaic power supply is important, and is covered in the next section.
Polycrystalline siliconPolycrystalline cells are manufactured and operate in a similar manner. The difference is that a lower cost silicon is used. This usually results in slightly lower efficiency, but polycrystalline cell manufacturers assert that the cost benefits outweigh the efficiency losses.
5

The surface of polycrystalline cells has a random pattern of crystal borders instead of the solid color of single crystal cells (Figure 2-1 3).
Ribbon siliconRibbon-type photovoltaic cells are made by growing a ribbon from the molten silicon instead of an ingot. These cells operate the same as single and polycrystal cells.The anti-reflective coating used on most ribbon silicon cells gives them a prismatic rainbow appearance.
Amorphous or thin film siliconThe previous three types of silicon used for photovoltaic cells have a distinct crystal structure. Amorphous silicon has no such structure. Amorphous silicon is sometimes abbreviated "aSi" and is also called thin film silicon.Amorphous silicon units are made by depositing very thin layers of vaporized silicon in a vacuum onto a support of glass, plastic, or metal.Amorphous silicon cells are produced in a variety of colors (Figure 2-1 4).Since they can be made in sizes up to several square yards, they are made up in long rectangular "strip cells." These are connected in series to make up "module”.
Because the layers of silicon allow some light to pass through, multiple layers can be deposited. The added layers increase the amount of electricity the photovoltaic cell can produce. Each layer can be "tuned" to accept a particular band of light wavelength. The performance of amorphous silicon cells can drop as much as 15% upon initial exposure to sunlight. This drop takes around six weeks. Manufacturers generally publish post-exposure performance data, so if the module has not been exposed to sunlight, its performance will exceed specifications at first.The efficiency of amorphous silicon photovoltaic modules is less than half that of the other three technologies. This technology has the potential of being much less expensive to manufacture than crystalline silicon technology. For this reason, research is currently under way to improve amorphous silicon performance and manufacturing processes.
6

Photovoltaic Modules For almost all applications, the one-half volt produced by a single cell is inadequate. Therefore, cells are connected together in series to increase the voltage. Several of these series strings of cells may be connected together in parallel to increase the current as well. These interconnected cells and their electrical connections are then sandwiched between a top layer of glass or clear plastic and a lower level of plastic or plastic and metal. An outer frame is attached to increase mechanical strength, and to provide a way to mount the unit. This package is called a "module" or "panel" (Figure 2-15). Typically, a module is the basic building block of photovoltaic systems. Table 2-1 is a summary of currently available modules.
Summary of Current Photovoltaic Technology Groups of modules can be interconnected in series and/or parallel to form an "array." By adding "balance of system" (BOS) components such as storage batteries, charge controllers, and power conditioning devices, we have a complete photovoltaic system.
Describing Photovoltaic Module Performance. To insure compatibility with storage batteries or loads, it is necessary to know the electrical characteristics of photovoltaic modules. As a reminder, "I" is the abbreviation for current, expressed in amps. "V" is used for voltage in volts, and "R" is used for resistance in ohms.A photovoltaic module will produce its maximum current when there is essentially no resistance in the circuit. This would be a short circuit between its positive and negative terminals.This maximum current is called the short circuit current, abbreviated I(sc). When the module is shorted, the voltage in the circuit is zero.Conversely, the maximum voltage is produced when there is a break in the circuit. This is called the open circuit voltage, abbreviated V(oc). Under this condition the resistance is infinitely high and there is no current, since the circuit is incomplete.These two extremes in load resistance, and the whole range of conditions in between them, are depicted on a graph called a I-V (current-voltage) curve. Current, expressed in amps, is on the vertical Y-axis. Voltage, in volts, is on the horizontal X-axis.
7

As you can see in Figure 2-16, the short circuit current occurs on a point on the curve where the voltage is zero. The open circuit voltage occurs where the current is zero. The power available from a photovoltaic module at any point along the curve is expressed in watts. Watts are calculated by multiplying the voltage times the current (watts = volts x amps, or W = VA).At the short circuit current point, the power output is zero, since the voltage is zero.At the open circuit voltage point, the power output is also zero, but this time it is because the current is zero.There is a point on the "knee" of the curve where the maximum power output is located. This point on our example curve is where the voltage is 17 volts, and the current is 2.5 amps. Therefore the maximum power in watts is 17 volts times 2.5 amps, equaling 42.5 watts.The power, expressed in watts, at the maximum power point is described as peak, maximum, or ideal, among other terms. Maximum power is generally abbreviated as "I (mp)." Various manufacturers call it maximum output power, output, peak power, rated power, or other terms.The current-voltage (I-V) curve is based on the module being under standard conditions of sunlight and module temperature. It assumes there is no shading on the module.Standard sunlight conditions on a clear day are assumed to be 1000 watts of solar energy per square meter (1000 W/m2or lkW/m2). This is sometimes called "one sun," or a "peak sun." Less than one sun will reduce the current output of the module by a proportional amount. For example, if only one-half sun (500 W/m2) is available, the amount of output current is roughly cut in half
8

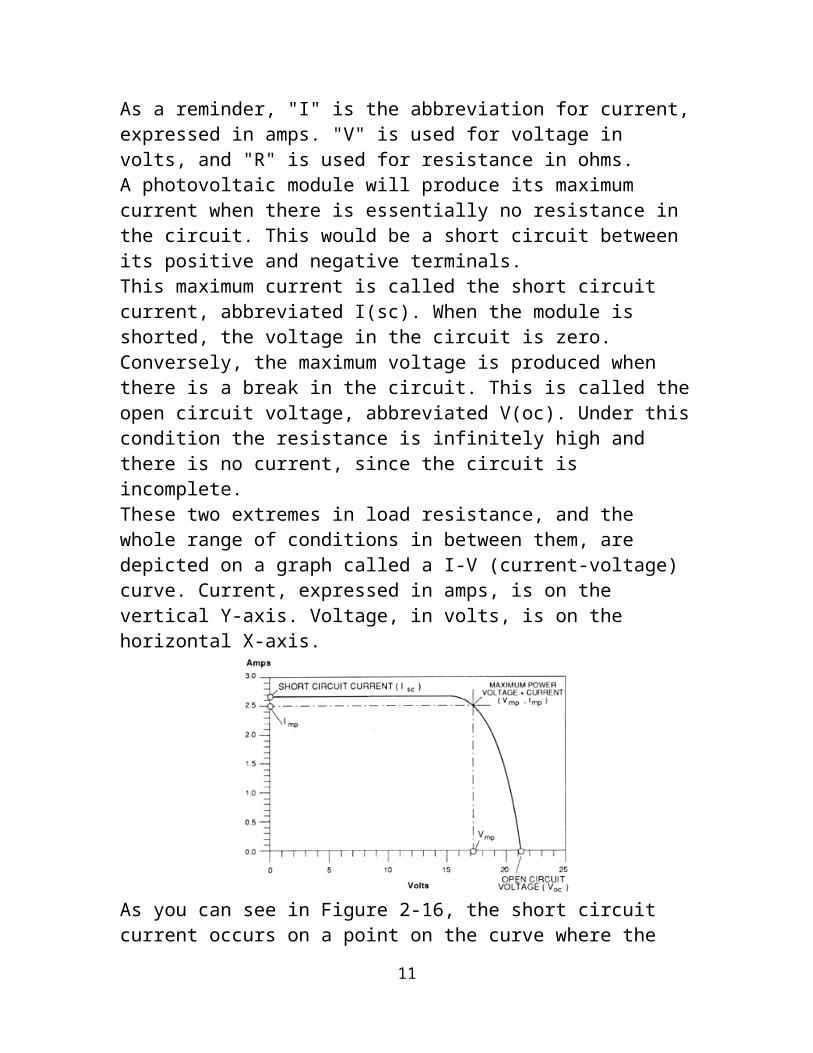
For maximum output, the face of the photovoltaic modules should be pointed as straight toward the sun as possible. Section 2.3.5 contains information on determining the correct direction and module tilt angle for various locations and applications. Because photovoltaic cells are electrical semiconductors, partial shading of the module will cause the shaded cells to heat up. They are now acting as inefficient conductors instead of electrical generators. Partial shading may ruin shaded cells.Partial module shading has a serious effect on module power output. For a typical module, completely shading only one cell can reduce the module output by as much as 80%. One or more damaged cells in a module can have the same effect as shading.
9

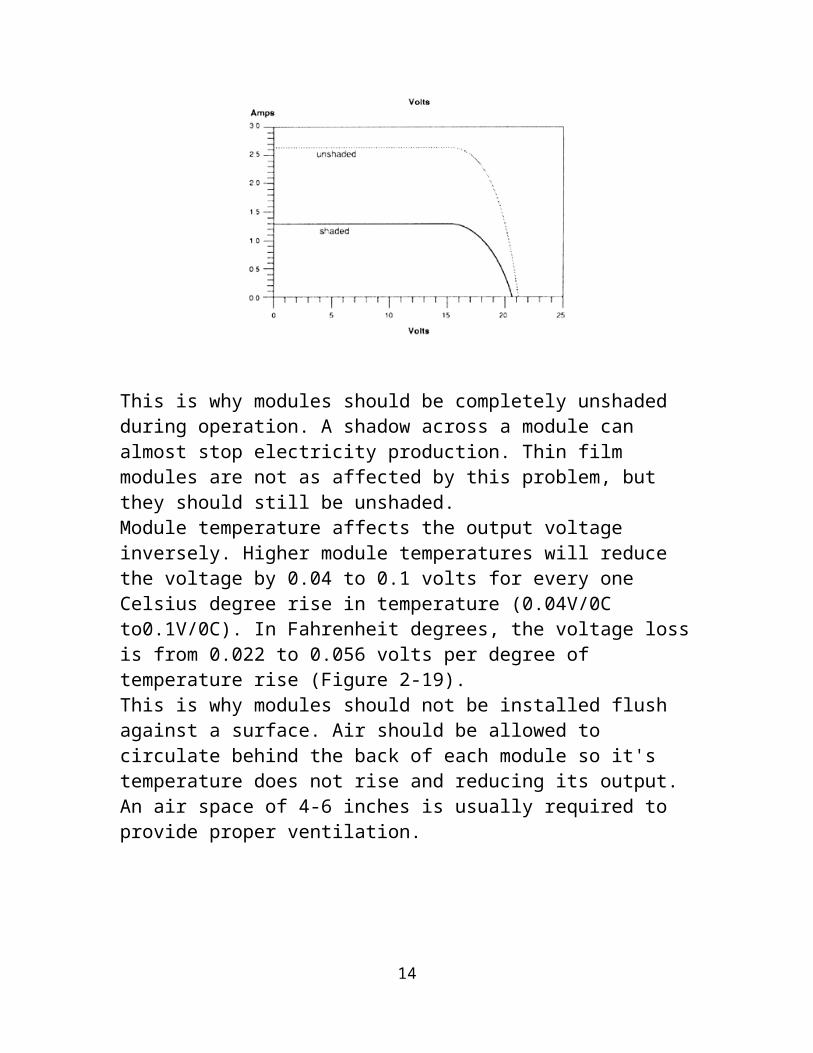
This is why modules should be completely unshaded during operation. A shadow across a module can almost stop electricity production. Thin film modules are not as affected by this problem, but they should still be unshaded. Module temperature affects the output voltage inversely. Higher module temperatures will reduce the voltage by 0.04 to 0.1 volts for every one Celsius degree rise in temperature (0.04V/0C to0.1V/0C). In Fahrenheit degrees, the voltage loss is from 0.022 to 0.056 volts per degree of temperature rise (Figure 2-19).This is why modules should not be installed flush against a surface. Air should be allowed to circulate behind the back of each module so it's temperature does not rise and reducing its output. An air space of 4-6 inches is usually required to provide proper ventilation.
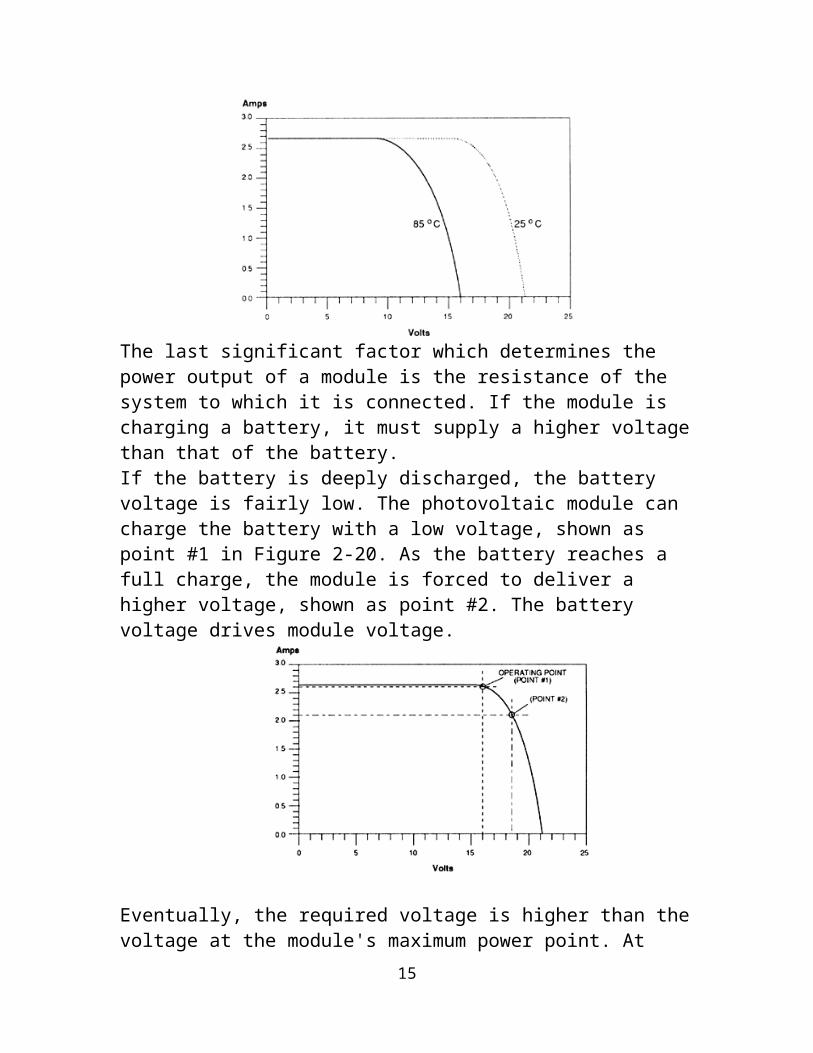
The last significant factor which determines the power output of a module is the resistance of the system to which it is connected. If the module is charging a battery, it must supply a higher voltage than that of the battery. If the battery is deeply discharged, the battery voltage is fairly low. The photovoltaic module can charge the battery with a low voltage, shown as point #1 in Figure 2-20. As the battery reaches a full charge, the module is forced to deliver a higher voltage, shown as point #2. The battery voltage drives module voltage.
10
Eventually, the required voltage is higher than the voltage at the module's maximum power point. At this operating point, the current production is lower than the current at the maximum power point. The module's power output is also lower. To a lesser degree, when the operating voltage is lower than that of the maximum power point (point #1), the output power is lower than the maximum. Since the ability of the module to produce electricity is not being completely used whenever it is operating at a point fairly far from the maximum power point, photovoltaic modules should be carefully matched to the system load and storage.Using a module with a maximum voltage which is too high should be avoided nearly as much as using one with a maximum voltage which is too low.The output voltage of a module depends on the number of cells connected in series. Typical modules use either 30, 32, 33, 36, or 44 cells wired in series.The modules with 30-32 cells are considered self regulating modules. 36 cell modules are the most common in the photovoltaic industry. Their slightly higher voltage rating, 16.7 volts, allows the modules to overcome the reduction in output voltage when the modules are operating at high temperatures.Modules with 33 - 36 cells also have enough surplus voltage to effectively charge high antimony content deep cycle batteries. However, since these modules can overcharge batteries, they usually require a charge controller.Finally, 44 cell modules are available with a rated output voltage of 20.3 volts. These modules are typically used only when a substantially higher voltage is required.As an example, if the module is sometimes forced to operate at high temperatures, it can still supply enough voltage to charge 1 2 volt batteries.
11

Another application for 44 cell modules is a system with an extremely long wire run between the modules and the batteries or load. If the wire is not large enough, it will cause a significant voltage drop. Higher module voltage can overcome this problem.It should be noted that this approach is similar to putting a larger engine in a car with locked brakes to make it move faster. It is almost always more cost effective to use an adequate wire size, rather than to overcome voltage drop problems with more costly 44 cell modules. Section 2.5.5 discusses maximum power point trackers. These devices are used to bring the module to a point as close as possible to the maximum power point. They are used mostly in direct DC systems, particularly with DC motors for pumping.
Photovoltaic Arrays. In many applications the power available from one module is inadequate for the load. Individual modules can be connected in series, parallel, or both to increase either output voltage or current. This also increases the output power. When modules are connected in parallel, the current increases. For example, three modules which produce 15 volts and 3 amps each, connected in parallel, will produce 15 volts and 9 amps
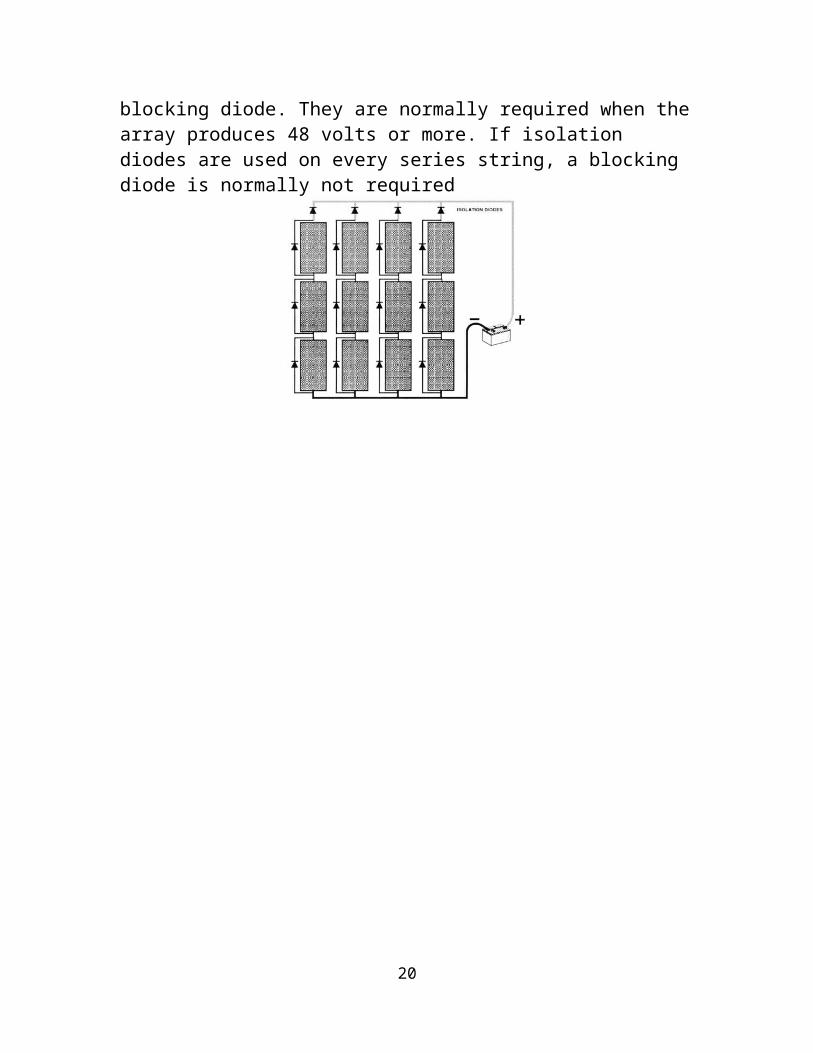
If the system includes a battery storage system, a reverse flow of current from the batteries through the photovoltaic array can occur at night. This flow will drain power from the batteries. A diode is used to stop this reverse current flow. Diodes are electrical devices which only allow current to flow in one direction. A blocking diode is shownDiodes with the least amount of voltage drop are called schottky diodes, typically dropping .3 volts instead of .7 volts as in silicon diodes.
12

Because diodes create a voltage drop, some systems use a controller which opens the circuit instead of using a blocking diode. If the same three modules are connected in series, the output voltage will be 45 volts, and the current will be 3 amps.If one module in a series string fails, it provides so much resistance that other modules in the string may not be able to operate either. A bypass path around the disabled module will eliminate this problem (Figure 2-23). The bypass diode allows the current from the other modules to flow through in the "right" direction.Many modules are supplied with a bypass diode right at their electrical terminals. Larger modules may consist of three groups of cells, each with its own bypass diodeBuilt in bypass diodes are usually adequate unless the series string produces 48 volts or higher, or serious shading occurs regularly.Combinations of series and parallel connections are also used in arrays (Figure 2-24). If parallel groups of modules are connected in a series string, large bypass diodes are usually required.
13
Isolation diodes are used to prevent the power from the rest of an array from flowing through a damaged series string of modules. They operate like a blocking diode. They are normally required when the array produces 48 volts or more. If isolation diodes are used on every series string, a blocking diode is normally not required
14
Chapter ThreeTransient analysis of a PV power generator charging a capacitor for measurement of the I–V characteristics
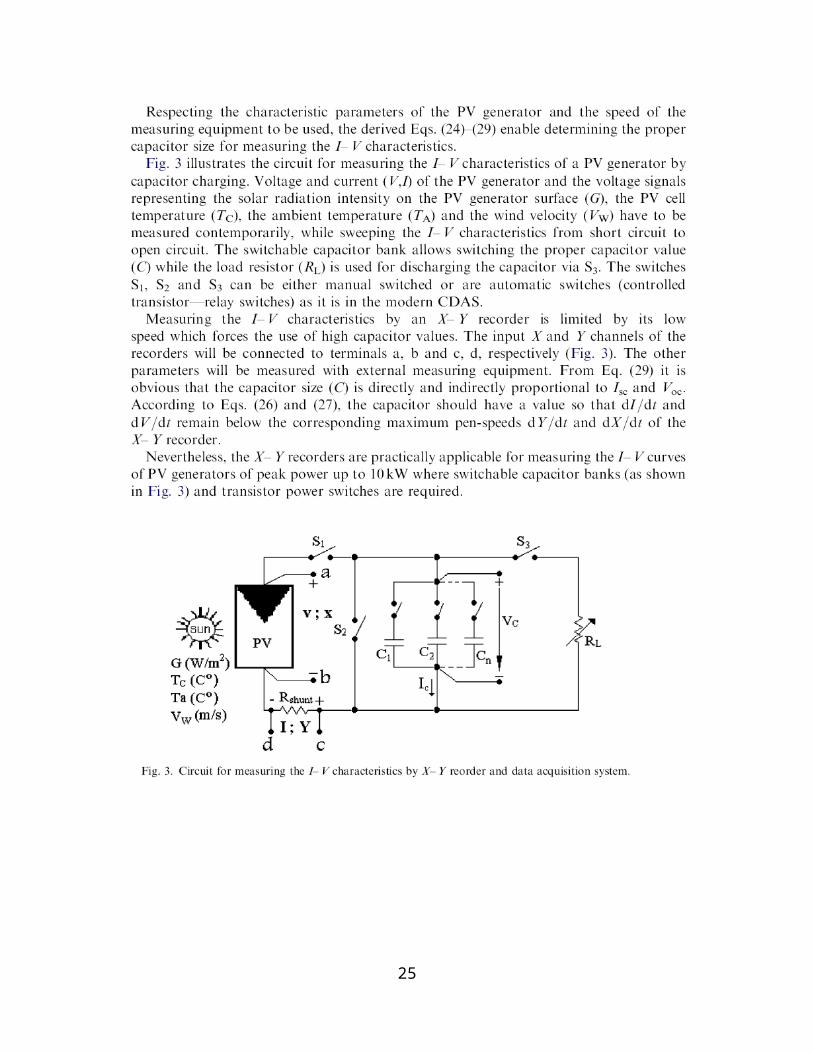
The power electronic circuit
15

16

17

18

19
Chapter Four
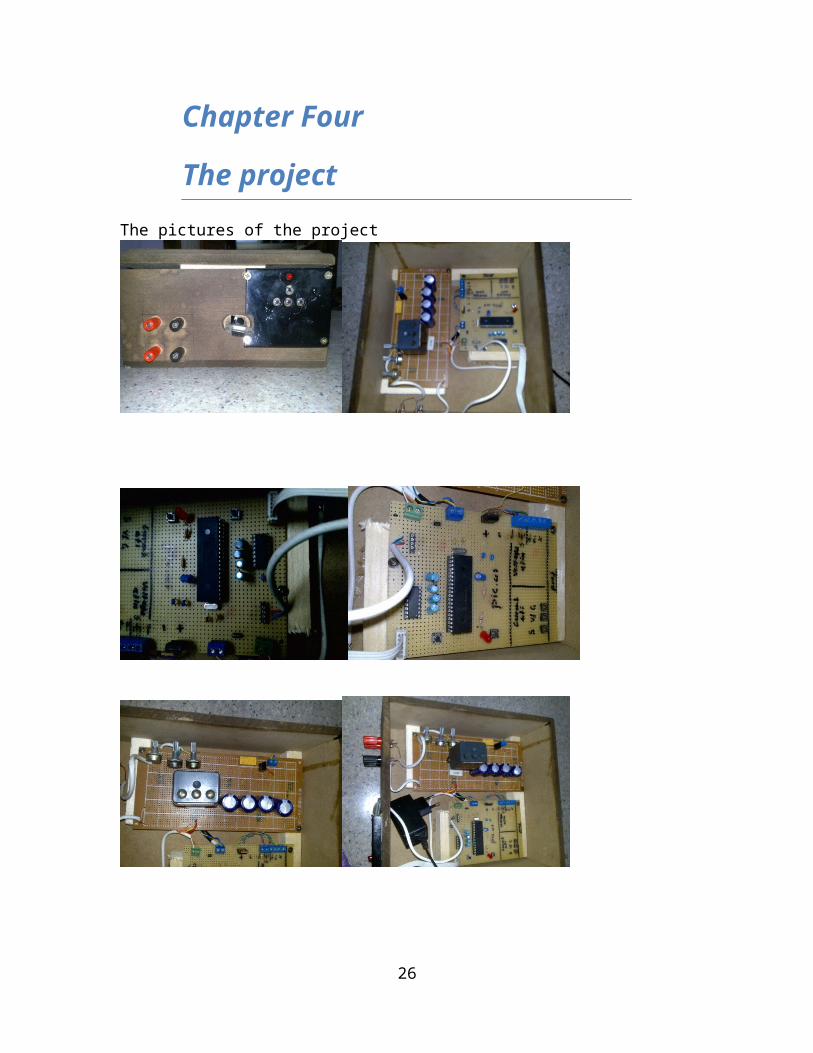
The projectThe pictures of the project
20

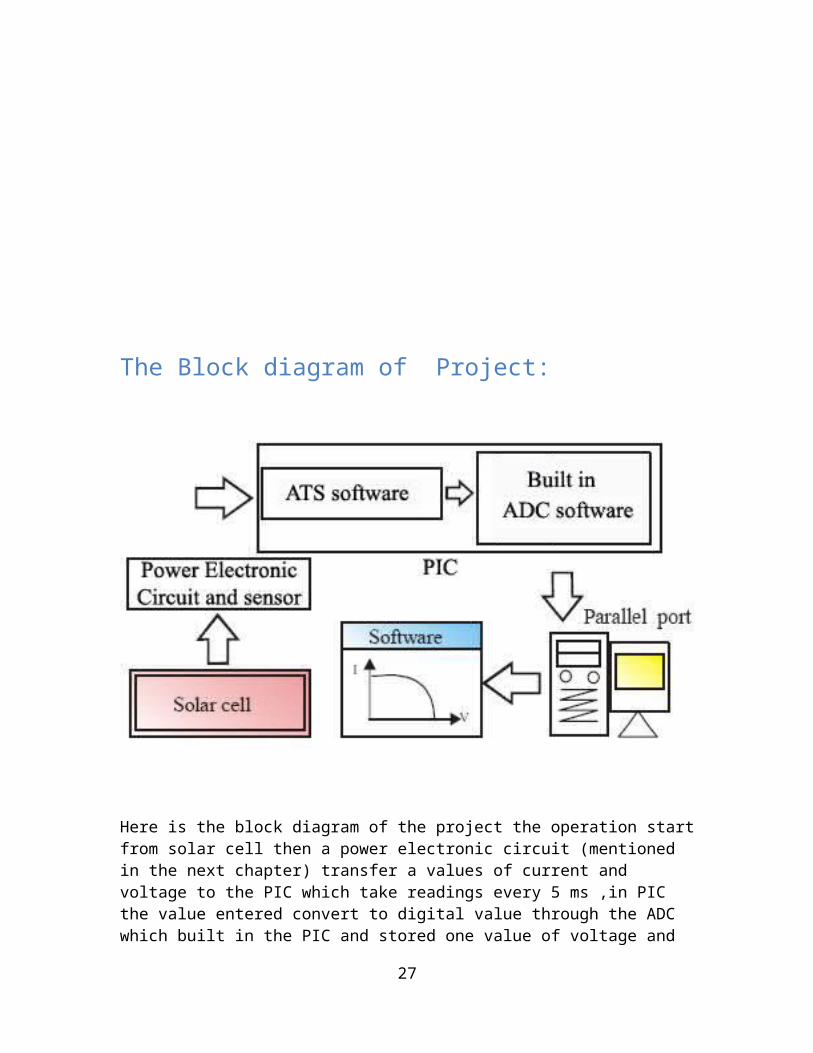
The Block diagram of Project:
Here is the block diagram of the project the operation start from solar cell then a power electronic circuit (mentioned in the next chapter) transfer a values of current and voltage to the PIC which take readings every 5 ms ,in PIC the value entered convert to digital value through the ADC which built in the PIC and stored one value of voltage and one value of current in temporary memory wile them transferred through the parallel port using a software written in C#. In this system we use a pic16f877 as microcontroller connected to a max232 with a serial to the computer to show the output data for the voltage values and the current and so foe the power and other values.
21

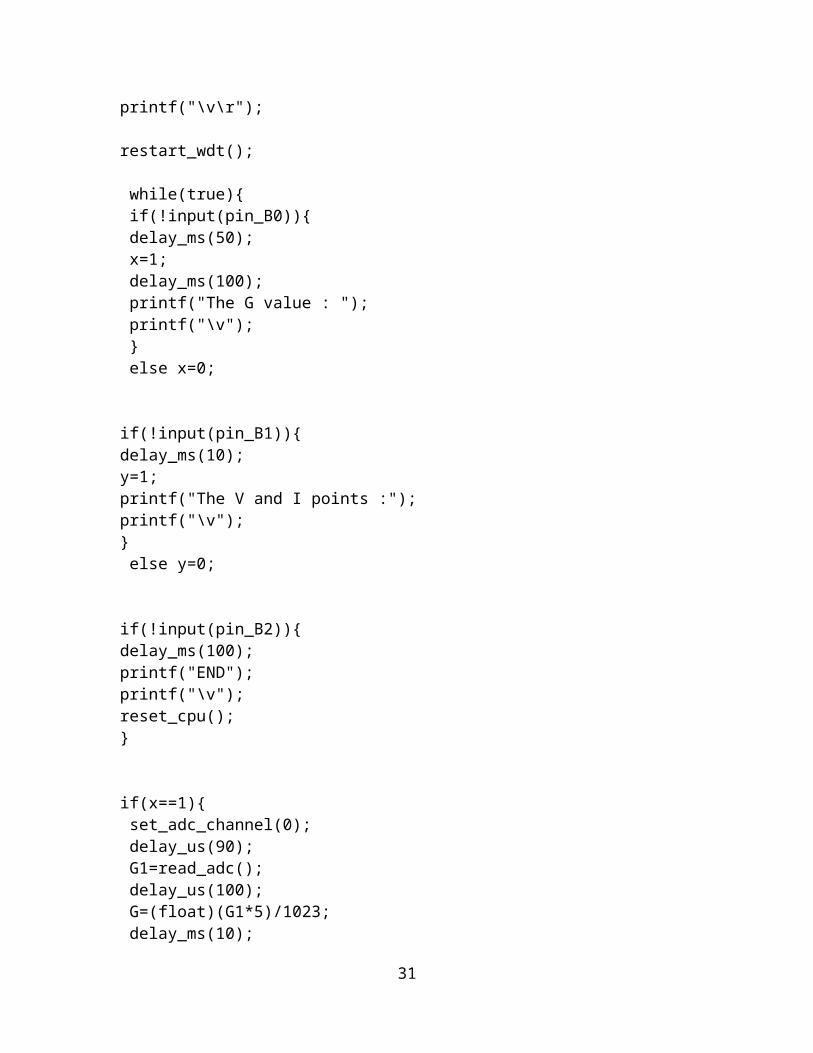
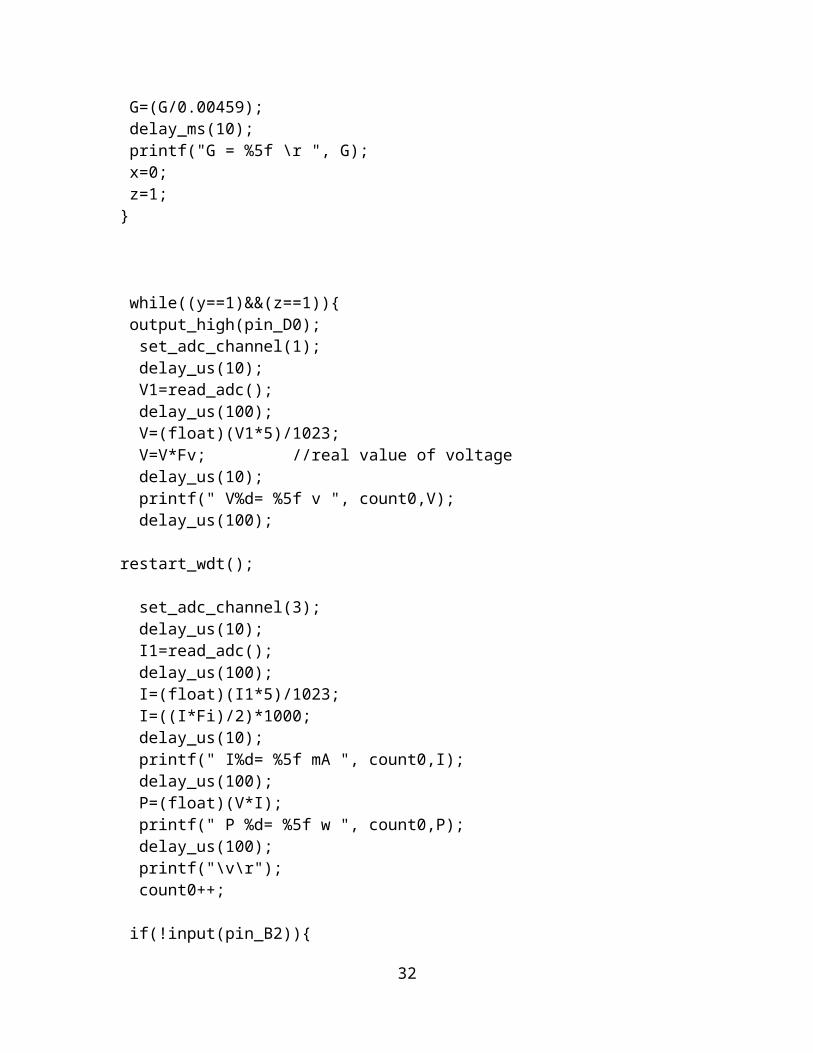
First the system is designed by the computer use protos programe as shown in the images in the pic, file the system is constructe from a capasitor in parallel 1000uf,50v and with a resistor 2//3.3 ohm to measure the voltage on the resistor and transter it to the value of the current by the microcontroller pins on the A0,A1,A3 is set to be an adcs to measure the value of the voltage on the pins with the level of 5v that will be attenuate by use the variable resistor to make sure the pic, will not damage .B0,B1,B2,is set to be an input to the system as B0 is the g cell value, B1 is the v&I points taker, B2 is the loop . the pic. Is work on a crystal of 4MHz .Start:After plug in electricity the pic will start by flash the led 10 flashers , after that the system will be ready to start the test. Press the G bottom to take the value of the g cell the pic. Will do all the math. In his own . now press the V&I bottom the system will start to take the values of V, and I with 100 sample, after 100 sample the pic will shut off retarning to the inatial state to take the data again.The data will transferred by the serial port to the hyper .tarminal then to your softwear
The components of the circuit are:
pic16f877 1max232 1DB-9 14Mhz 1switch 6ver.rese 31K 21uf 6330R 11000uf,50v 4relay,5v 1buz812 1power jack 1lm7805 11K,ver 15K,ver 22R 13R3 1leds 36.8uf 133K 1oic base 1
22
max base 1input jack 9
The pic.code :#include "D:\project's\picc\liala GP -code00\code04.h"int x=0;int y=0; // input arrangmentsint z=0;int count0=0;
long G1=0;long V1=0;long I1=0;
float G=0.0;float V=0.0;float I=0.0;float P=0.0;
int Fv=10; //voltage fractionint Fi=1; //current fraction
void main()
setup_adc_ports(AN0_AN1_AN3); setup_adc(ADC_CLOCK_INTERNAL); setup_psp(PSP_DISABLED); setup_spi(FALSE); setup_timer_0(RTCC_INTERNAL|RTCC_DIV_1); setup_timer_1(T1_DISABLED); setup_timer_2(T2_DISABLED,0,1); setup_comparator(NC_NC_NC_NC); setup_vref(FALSE);
// TODO: USER CODE!!set_tris_b (0xff);
loop1:x=0;y=0;z=0;G1=0;V1=0;I1=0;G=0;V=0;I=0;P=0;
23

printf("Wellcome To My Software");delay_ms(1000);printf("\v\r");printf("press G botom to take the G value:");delay_ms(1000);printf("\v\r");delay_ms(1000);printf("press V&I bottom to take the V&I points:");printf("\v\r");
restart_wdt();
while(true) if(!input(pin_B0)) delay_ms(50); x=1; delay_ms(100); printf("The G value : "); printf("\v"); else x=0;
if(!input(pin_B1))delay_ms(10);y=1;printf("The V and I points :");printf("\v"); else y=0;
if(!input(pin_B2))delay_ms(100);printf("END");printf("\v");reset_cpu();
if(x==1) set_adc_channel(0); delay_us(90); G1=read_adc(); delay_us(100); G=(float)(G1*5)/1023;
24
delay_ms(10); G=(G/0.00459); delay_ms(10); printf("G = %5f \r ", G); x=0; z=1;
while((y==1)&&(z==1)) output_high(pin_D0); set_adc_channel(1); delay_us(10); V1=read_adc(); delay_us(100); V=(float)(V1*5)/1023; V=V*Fv; //real value of voltage delay_us(10); printf(" V%d= %5f v ", count0,V); delay_us(100);
restart_wdt();
set_adc_channel(3); delay_us(10); I1=read_adc(); delay_us(100); I=(float)(I1*5)/1023; I=((I*Fi)/2)*1000; delay_us(10); printf(" I%d= %5f mA ", count0,I); delay_us(100); P=(float)(V*I); printf(" P %d= %5f w ", count0,P); delay_us(100); printf("\v\r"); count0++;
if(!input(pin_B2)) y=0; z=0;
if(count0==100) count0=0;
25
delay_ms(1000); printf("\v\v"); delay_ms(1000); output_low(pin_D0); goto loop1; restart_wdt();
The c- sharp codeusing System;using System.Collections.Generic;using System.ComponentModel;using System.Data;using System.Drawing;using System.Linq;using System.Text;using System.Windows.Forms;using System.IO.Ports;using System.Collections;
namespace Laila public partial class Form1 : Form string StopBits = "One"; string Parity = "None"; int flag = 0; // ArrayList Points; PointF[] Points = new PointF[100]; int Counts = 0; float MaxV = 0; float MaxI = 0; float MaxP = 0; float G = 0; System.Drawing.Graphics formGraphics; System.Drawing.Pen myPen; public Form1() InitializeComponent(); richTextBox3.Clear(); richTextBox2.Clear(); richTextBox1.Clear(); serialPort1.BaudRate = 9600; serialPort1.DataBits = 8; serialPort1.StopBits = (StopBits)Enum.Parse(typeof(StopBits), StopBits); serialPort1.Parity = (Parity)Enum.Parse(typeof(Parity), Parity);
26
serialPort1.PortName = "COM5"; serialPort1.Open();
private void serialPort1_DataReceived(object sender, System.IO.Ports.SerialDataReceivedEventArgs e) float v = 0; float I = 0; if (flag == 0) G = (int)serialPort1.ReadByte(); flag = 1; while(Counts <100) if (flag == 1) v =(float) serialPort1.ReadByte(); flag = 2; richTextBox1.Text += v.ToString(); if (v > MaxV) MaxV = v;
if (flag == 2) I = (float)serialPort1.ReadByte(); // Points.Add(new Point(v,I)); Points[Counts] = new PointF(I, -1*v); // 3ashan el curve y3kes el V Counts++; flag = 3; richTextBox2.Text += I.ToString(); if (I > MaxI) MaxI = I;
if (flag == 3) float P = (float)serialPort1.ReadByte(); flag = 1; richTextBox3.Text += P.ToString(); if (P > MaxP) MaxP = P;
Point pt1 = new Point(20, 12),pt2 = new Point(88, 246),pt3 = new Point(364, 192),pt4 = new Point(250, 48);
27

myPen = new System.Drawing.Pen(System.Drawing.Color.Black); // formGraphics.DrawBezier(myPen, pt1, pt2, pt3, pt4); myPen.Dispose(); formGraphics.Dispose();
private void button1_Click(object sender, EventArgs e) float PInput = G * (float.Parse(textBox1.Text));
private void button2_Click(object sender, EventArgs e)
formGraphics = this.CreateGraphics(); label5.Text = MaxV.ToString(); label7.Text = MaxI.ToString();
formGraphics.DrawBeziers(myPen, Points);
private void Form1_Load(object sender, EventArgs e)
Commercial capturehere we just show the I-V tester ready to sell by WACOM Electric CO the tester is available in different modules depend on the range of voltage and current.
28

And here is the software which provided with the model
The power electronic circuit & the sensorThe power electronic circuit of this device consists of capacitors, resistors, special resistors and switches as shown in the figure below
29

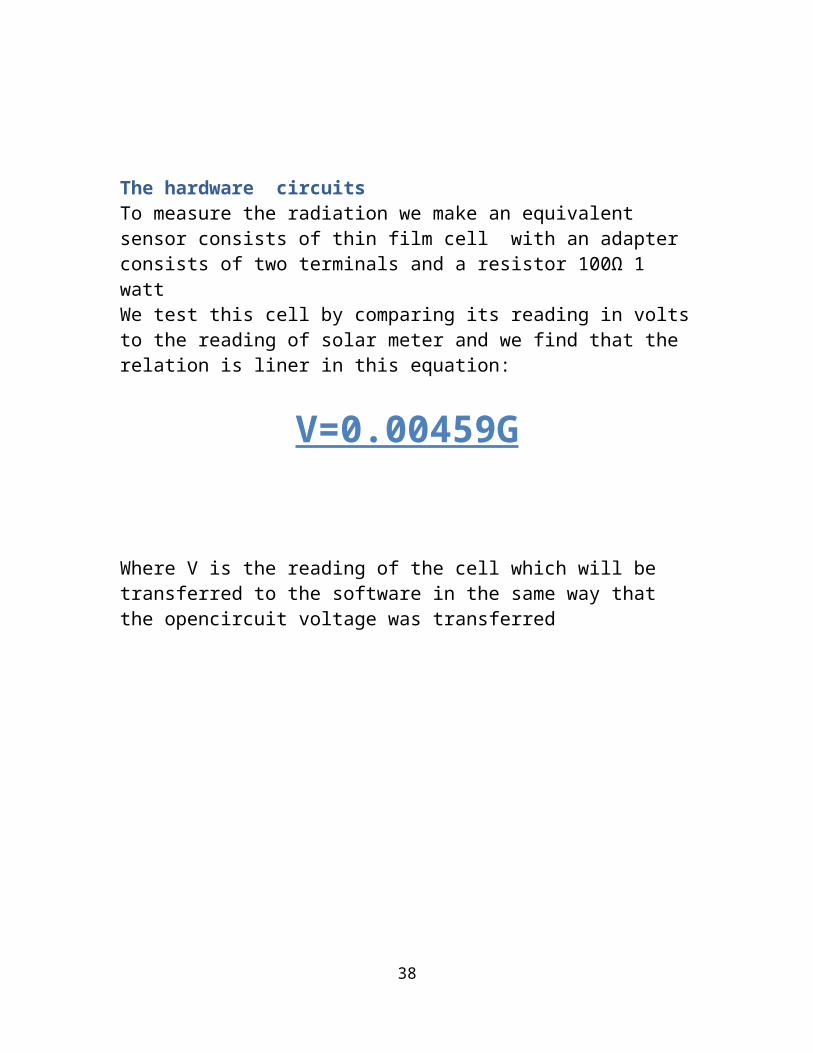
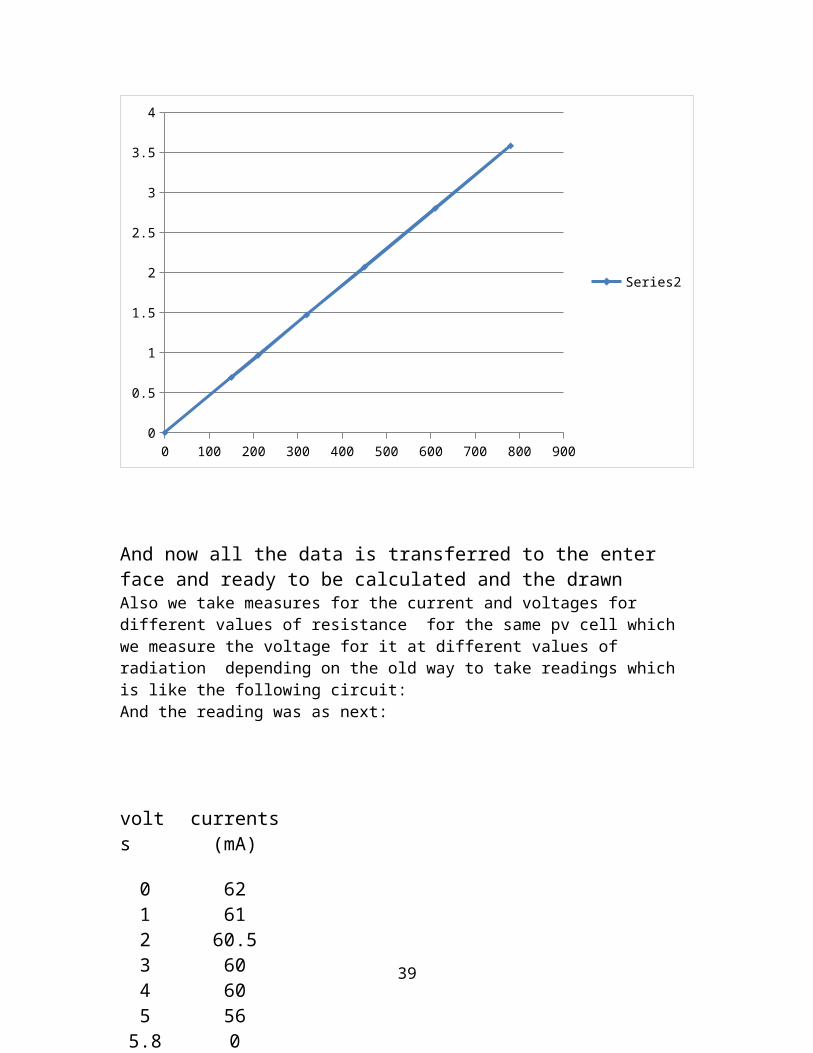
The hardware circuitsTo measure the radiation we make an equivalent sensor consists of thin film cell with an adapter consists of two terminals and a resistor 100Ω 1 wattWe test this cell by comparing its reading in volts to the reading of solar meter and we find that the relation is liner in this equation:
V=0.00459G
Where V is the reading of the cell which will be transferred to the software in the same way that the opencircuit voltage was transferred
0 100 200 300 400 500 600 700 800 9000
0.5
1
1.5
2
2.5
3
3.5
4
Series2
And now all the data is transferred to the enter face and ready to be calculated and the drawnAlso we take measures for the current and voltages for different values of resistance for the same pv cell which we measure the voltage for it
30
at different values of radiation depending on the old way to take readings which is like the following circuit:
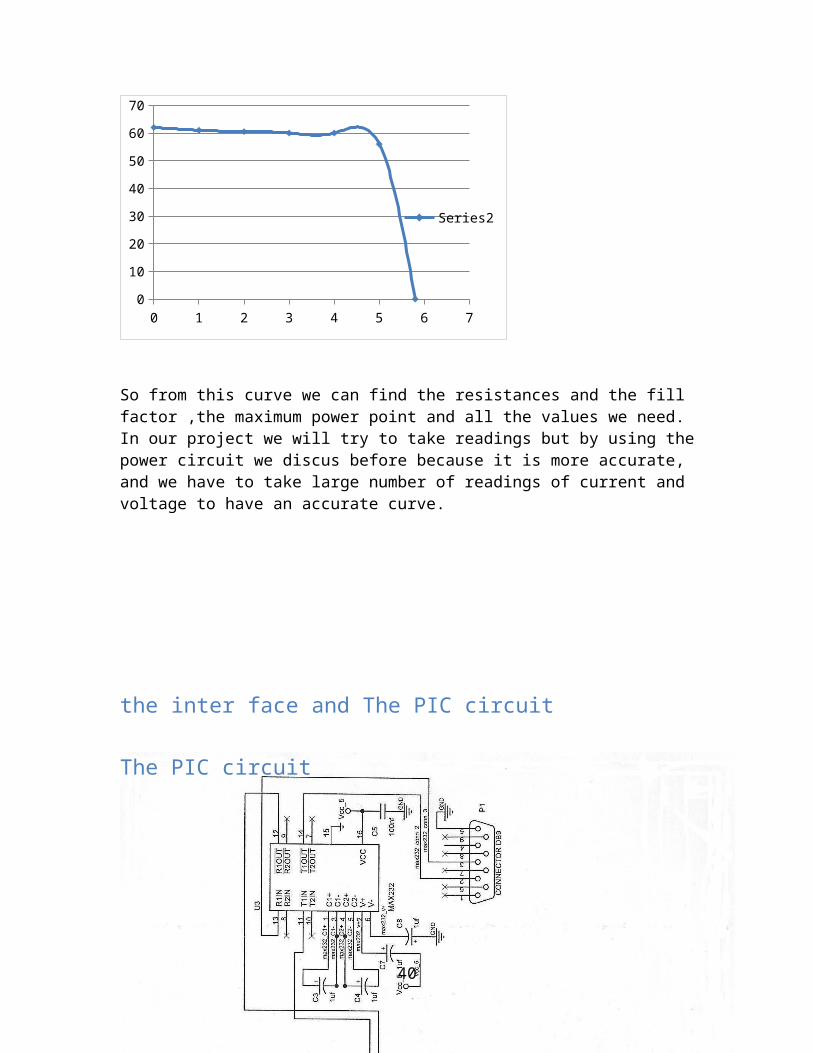
And the reading was as next:
0 1 2 3 4 5 6 70
10
20
30
40
50
60
70
Series2
So from this curve we can find the resistances and the fill factor ,the maximum power point and all the values we need. In our project we will try to take readings but by using the power circuit we discus before because it is more accurate, and we have to take large number of readings of current and voltage to have an accurate curve.
31
volts currents(mA)
0 621 612 60.53 604 605 56
5.8 0
the inter face and The PIC circuit
The PIC circuit
32

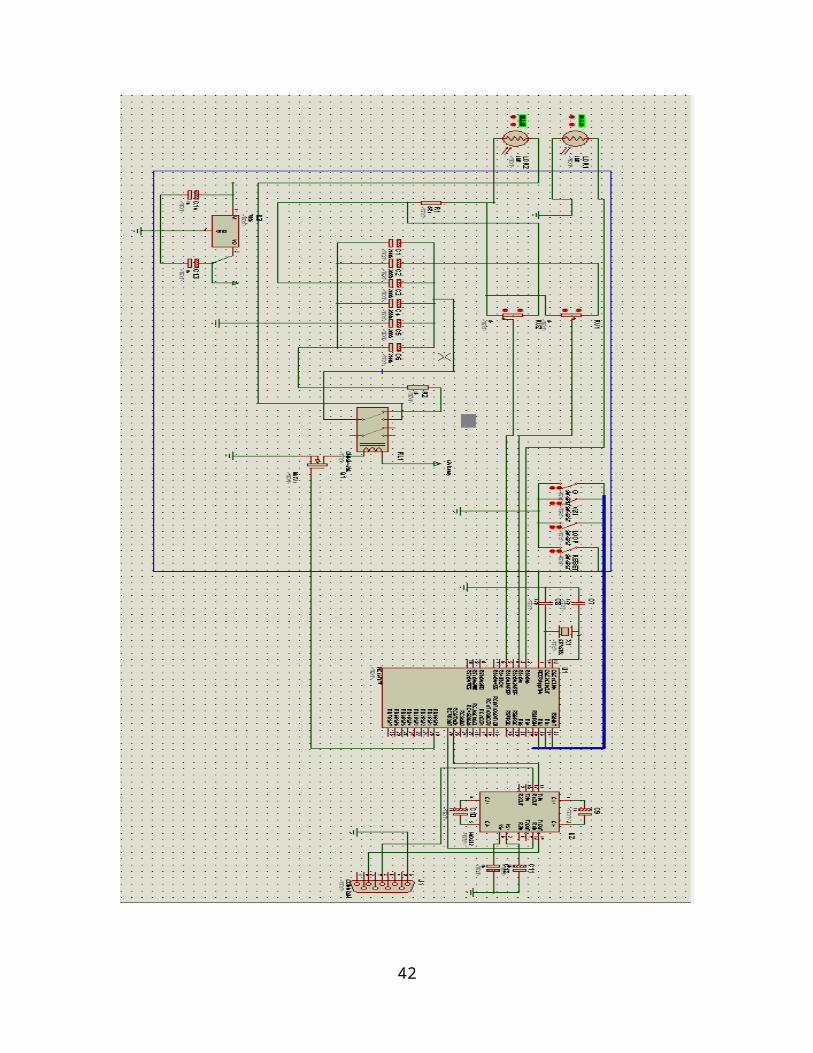
The whole project circuit
33

34

The sequence of work
35
Arrange the data in the table ,find the max power ,Voc, Isc,Vmpp, Impp and the radiation and T’s
Draw the data and auto scale it and fill the square operation
Calculate the fill factor and the efficiency
Determining the sample time interval and start importing from parallel port

Chapter Five
TEST example
36

Chapter Six
Alternating method
Measuring Photovoltaic Cell I-V Characteristics
with the Model 2420 SourceMeter Instrument
IntroductionPhotovoltaic (PV) cells convert sunlight directly to electricity. Fabricated from a wide variety of materials using many different processing techniques, these devices are used for terrestrial power generation, as well as commercial, military, and research space power applications. PV cell characterization involves measuring the cell’s electrical performance characteristics to determine conversion efficiency and critical equivalent circuit parameters. It is an important tool for R&D and production of cells and photovoltaic arrays. This application note describes how to use the Keithley Model 2420 High Current SourceMeter®instrument to measure the current-voltage (I-V) characteristicsof PV cells.With the introduction of SMUs (Source-Measure Units),configuring device characterization systems that once required arack of electronic equipment, including programmable power supplies, digital multimeters, and scanners, has been simplified significantly. The Model 2420’s ability to source/sink up to 3Awith 0.5% accuracy or better and its low noise, high impedance, repeatable DMM offers a cost-effective alternative to using expensive, high power programmable power supplies for PV cell characterization. The Model 2420 offers 10μV resolution on the 2V range, which is sufficient to measure the I-V curve of anysingle junction cell. The 20V range offers adequate resolution (100μV) for multi-junction cells and small arrays, where the open circuit voltage may
37
exceed 2V. The Model 2420’s low current measuring capability, with 10pA maximum resolution on the 1mA current range, is sufficient for virtually all dark I-Vapplications
Test DescriptionA PV cell may be represented by the equivalent circuit model shown, consisting of a photon current source (IL), a diode, a series resistance (rs), and a shunt resistance (rsh).
The series resistance (rs) represents the ohmic losses in the front surface of the cell and the shunt resistance (rsh) represents the loss due to diode leakage currents. The conversion efficiency is defined as:
where Pin is the power input to the cell, Voc is the open circuit voltage, Isc is the short circuit current, and Im and Vm are the maximum cell current and
38
voltage respectively at the maximum power point, Pm = ImVm. Figure 2 illustrates the typical I-V characteristics of an Si PV cell, showing Im and Vm at the maximumpower point.
Critical PV cell performance parameters, such as the equivalent cell shunt and series resistance and the electrical conversion efficiency and fill factor, may be determined from I-V measurements. The cell must be maintained at a constant temperature and a radiant source with a constant intensity and a knownspectral distribution must be used.
Forward Bias I-V (Illuminated)This test involves generating the forward biased I-V curve between the two points (V1 = 0, I1 = Isc ) and (V2 = Voc, I2 = 0). The parameters Voc and Isc can be directly determined from the curve and Im, Vm, Pm, FF, and are easily calculated. Additionalanalytical techniques may be used to determine rs and rsh.
Reverse Bias I-V (Dark)The reverse bias I-V curve test is performed in the dark between 0V and the level where breakdown begins to occur. In this region, the slope of the current-voltage characteristic can be used to estimate the shunt resistance (rsh).
39
Test System and ConfigurationFigure 3 illustrates the measurement configuration for generating the illuminated forward bias I-V characteristics, using a Model 2420 and a 4-wire connection to the cell to minimize measurement lead resistance errors. A solar simulator provides appropriate illumination for the cell and a cooled, vacuum hold own chuck secures the cell and provides isothermal test conditions.
The series resistance (rs) of a PV cell is low, typically <1ohmfor cells designed for operation at 1 sun and <0.1ohmfor concentratorcells. As a result, direct contact to the cell bus bar with specially designed 2-point probes is essential to obtain accurate
Figure 4 is a schematic of a measurement configuration to generate the dark reverse I-V characteristics. If the dark reverse currents to be measured are >1μA, the unguarded 4-wire configuration will provide accurate measurements. For dark reverse currents <1μA, stray leakage currents in cables and fixturingmay create errors and noise in measurements. Two methods can be used to reduce or eliminate these sources of error. The first requires using high resistance materials when constructing the test fixture and keeping the fixture free of contaminants. The second method employs the Model 2420’s built-in guardcircuitry. In Figure 4, the V-guard output of the Model 2420 is a low impedance source at nearly the same potential as the high impedance point,
40

HI (output). Guarding is used in this circuit to ensure the contact probe housing remains isolated from the circuit. The probe housing is constructed from insulatingmaterials; however, contamination may cause a breakdown in resistance and introduce measurable stray currents. The guard plate under the probe, at approximately the same potential as the probe on the top contact of the cell, ensures no current can flow through the probe housing, so the current measured flowsthrough the cell. forward bias I-V measurements
Programming the 2420 forCell CharacterizationAny of the example programs on Keithley’s web site that carry out an I-V sweep would be an excellent starting point. Examplesare available in a number of programming languages at www.keithley.com. Our LabTracer application is an additional software source. LabTracer was developed in Test Point but is provided as a runtime. Therefore, Test Point is not required to run LabTracer.
Equipment ListThe following equipment is required to assemble a PV cell characterizationsystem:1. Keithley Model 2420 SourceMeter instrument2. IEEE-488 interface such as the Keithley KPCI-4883. Source illumination (solar simulator)
41
4. Temperature-controlled hold down chuck/test fixture5. Keithley 7007-x IEEE-488 Interface cable6. Test leads (4-wire) and 2-point adjustable contact probe(s)References 1)Marwan M. Mahmoud, Transient analysis of a PV power generator charginga capacitor for measurement of the I–V characteristics , Energy Research Centre, An Najah National University,2)Santi Wangnipparnto, The development of IV CURVE tester for photovoltaic modelElectrical Engineering department, Pathumwan Institute of Technology, Bangkok,103303) Keithley Instruments, Inc. Measuring Photovoltaic Cell I-V Characteristicswith the Model 2420 SourceMeter Instrument4) K. Bouzidi, M. Chegaar, Solar cells parameters evaluation considering the series and shunt resistance, Physics Department, Ferhat Abbas University
42