chapter four: supply & demand in the … · chapter four: supply & demand in the market*...
TRANSCRIPT
CHAPTER FOUR: SUPPLY & DEMAND IN THE MARKET*
When a cold snap hits Florida, the price of orange juice rises in supermarkets throughoutthe country. When the weather turns warm in New England every summer, the price of hotelrooms in the Caribbean plummets. When a war breaks out in the Middle East, the price ofgasoline in the United States rises, and the price of a used Cadillac falls. What do these eventshave in common? They all show the workings of supply and demand.
Supply and demand are the two words that economists use most often—and for goodreason. Supply and demand are the forces that make market economies work. They determine thequantity of each good produced and the price at which it is sold. If you want to know how anyevent or policy will affect the economy, you must think first about how it will affect supply anddemand.
This chapter introduces the theory of supply and demand. It considers how buyers andsellers behave and how they interact with one another. It shows how supply and demanddetermine prices in a market economy and how prices, in turn, allocate the economy’s scarceresources.
MARKETS AND COMPETITION
The terms supply and demand refer to the behavior of people as they interact with oneanother in markets. A market is a group of buyers and sellers of a particular good or service.The buyers as a group determine the demand for the product, and the sellers as a group determinethe supply of the product. Before discussing how buyers and sellers behave, let’s first considermore fully what we mean by a “market” and the various types of markets we observe in theeconomy.
COMPETITIVE MARKETS
Markets take many forms. Sometimes markets are highly organized, such as the marketsfor many agricultural commodities. In these markets, buyers and sellers meet at a specific timeand place, where an auctioneer helps set prices and arrange sales.
More often, markets are less organized. For example, consider the market for ice creamin a particular town. Buyers of ice cream do not meet together at any one time. The sellers of icecream are in different locations and offer somewhat different products. There is no auctioneercalling out the price of ice cream. Each seller posts a price for an ice-cream cone, and each buyerdecides how much ice cream to buy at each store.______________________* Lifted from Mankiw, N.G. (2009) Principles of Economics, 5th ed. USA: South-Western Cengage Learning. [PDFVersion] Unless otherwise indicated
As scarce as truth is, the supply has always been in excess of the demand.Josh Billings

Even though it is not organized, the group of ice-cream buyers and ice-cream sellersforms a market. Each buyer knows that there are several sellers from which to choose, and eachseller is aware that his product is similar to that offered by other sellers. The price of ice creamand the quantity of ice cream sold are not determined by any single buyer or seller. Rather, priceand quantity are determined by all buyers and sellers as they interact in the marketplace.
The market for ice cream, like most markets in the economy, is highly competitive. Acompetitive market is a market in which there are many buyers and many sellers so that eachhas a negligible impact on the market price. Each seller of ice cream has limited control over theprice because other sellers are offering similar products. A seller has little reason to charge lessthan the going price, and if he or she charges more, buyers will make their purchases elsewhere.Similarly, no single buyer of ice cream can influence the price of ice cream because each buyerpurchases only a small amount.
In this chapter we examine how buyers and sellers interact in competitive markets. Wesee how the forces of supply and demand determine both the quantity of the good sold and itsprice.
COMPETITION: PERFECT AND OTHERWISE
We assume in this chapter that markets are perfectly competitive. Perfectly competitivemarkets are defined by two primary characteristics: (1) the goods being offered for sale are allthe same, and (2) the buyers and sellers are so numerous that no single buyer or seller caninfluence the market price. Because buyers and sellers in perfectly competitive markets mustaccept the price the market determines, they are said to be price takers.
There are some markets in which the assumption of perfect competition applies perfectly.In the wheat market, for example, there are thousands of farmers who sell wheat and millions ofconsumers who use wheat and wheat products. Because no single buyer or seller can influencethe price of wheat, each takes the price as given.
Not all goods and services, however, are sold in perfectly competitive markets. Somemarkets have only one seller, and this seller sets the price. Such a seller is called a monopoly.Your local cable television company, for instance, may be a monopoly. Residents of your townprobably have only one cable company from which to buy this service.
Some markets fall between the extremes of perfect competition and monopoly. One suchmarket, called an oligopoly, has a few sellers that do not always compete aggressively. Airlineroutes are an example. If a route between two cities is serviced by only two or three carriers, thecarriers may avoid rigorous competition to keep prices high. Another type of market ismonopolistically competitive; it contains many sellers, each offering a slightly different product.Because the products are not exactly the same, each seller has some ability to set the price for itsown product. An example is the software industry. Many word processing programs competewith one another for users, but every program is different from every other and has its own price.
Despite the diversity of market types we find in the world, we begin by studying perfectcompetition. Perfectly competitive markets are the easiest to analyze. Moreover, because somedegree of competition is present in most markets, many of the lessons that we learn by studyingsupply and demand under perfect competition apply in more complicated markets as well.
DEMAND
We begin our study of markets by examining the behavior of buyers. Here we considerwhat determines the quantity demanded of any good, which is the amount of the good thatbuyers are willing and able to purchase. To focus our thinking, let’s keep in mind a particulargood—ice cream.
WHAT DETERMINES THE QUANTITY AN INDIVIDUAL DEMANDS?
Consider your own demand for ice cream. How do you decide how much ice cream tobuy each month, and what factors affect your decision? Here are some of the answers you mightgive.
Price. If the price of ice cream rose to Php 50 per scoop, you would buy less ice cream. Youmight buy frozen yogurt instead. If the price of ice cream fell to Php 5 per scoop, you would buymore. Because the quantity demanded falls as the price rises and rises as the price falls, we saythat the quantity demanded is negatively related to the price. This relationship between price andquantity demanded is true for most goods in the economy and, in fact, is so pervasive thateconomists call it the law of demand: Other things equal, when the price of a good rises, thequantity demanded of the good falls.
Income. What would happen to your demand for ice cream if you lost your job one summer?Most likely, it would fall. A lower income means that you have less to spend in total, so youwould have to spend less on some—and probably most—goods. If the demand for a good fallswhen income falls, the good is called a normal good.
Not all goods are normal goods. If the demand for a good rises when income falls, thegood is called an inferior good. An example of an inferior good might be bus rides. As yourincome falls, you are less likely to buy a car or take a cab, and more likely to ride the bus.
Prices of Related Goods. Suppose that the price of frozen yogurt falls. The law of demand saysthat you will buy more frozen yogurt. At the same time, you will probably buy less ice cream.Because ice cream and frozen yogurt are both cold, sweet, creamy desserts, they satisfy similardesires. When a fall in the price of one good reduces the demand for another good, the two goodsare called substitutes. Substitutes are often pairs of goods that are used in place of each other,such as hot dogs and hamburgers, sweaters and sweatshirts, and movie tickets and video rentals.
Now suppose that the price of hot fudge falls. According to the law of demand, you willbuy more hot fudge. Yet, in this case, you will buy more ice cream as well, because ice creamand hot fudge are often used together. When a fall in the price of one good raises the demand foranother good, the two goods are called complements. Complements are often pairs of goods thatare used together, such as gasoline and automobiles, computers and software, and skis and ski lifttickets.
Tastes. The most obvious determinant of your demand is your tastes. If you like ice cream, youbuy more of it. Economists normally do not try to explain people’s tastes because tastes arebased on historical and psychological forces that are beyond the realm of economics. Economistsdo, however, examine what happens when tastes change.
Expectations. Your expectations about the future may affect your demand for a good or servicetoday. For example, if you expect to earn a higher income next month, you may be more willingto spend some of your current savings buying ice cream. As another example, if you expect theprice of ice cream to fall tomorrow, you may be less willing to buy an ice-cream cone at today’sprice.
THE DEMAND SCHEDULE AND THE DEMAND CURVE
We have seen that many variables determine the quantity of ice cream a person demands.Imagine that we hold all these variables constant except one—the price. Let’s consider how theprice affects the quantity of ice cream demanded.
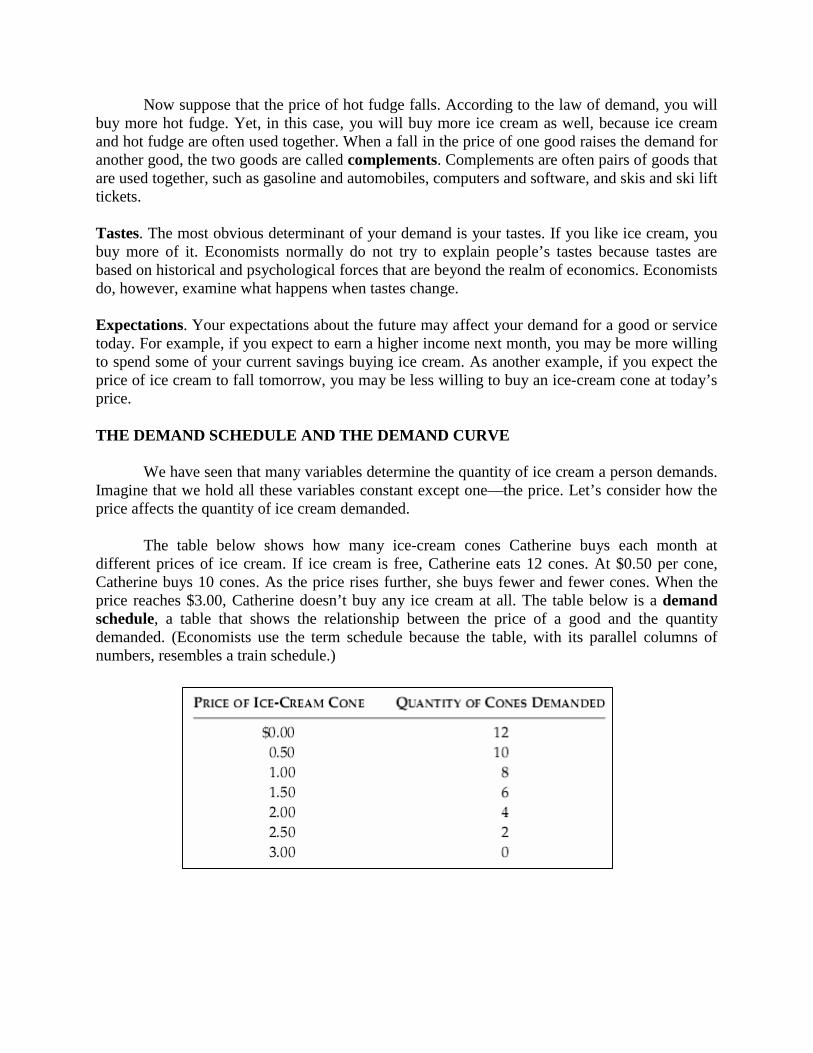
The table below shows how many ice-cream cones Catherine buys each month atdifferent prices of ice cream. If ice cream is free, Catherine eats 12 cones. At $0.50 per cone,Catherine buys 10 cones. As the price rises further, she buys fewer and fewer cones. When theprice reaches $3.00, Catherine doesn’t buy any ice cream at all. The table below is a demandschedule, a table that shows the relationship between the price of a good and the quantitydemanded. (Economists use the term schedule because the table, with its parallel columns ofnumbers, resembles a train schedule.)
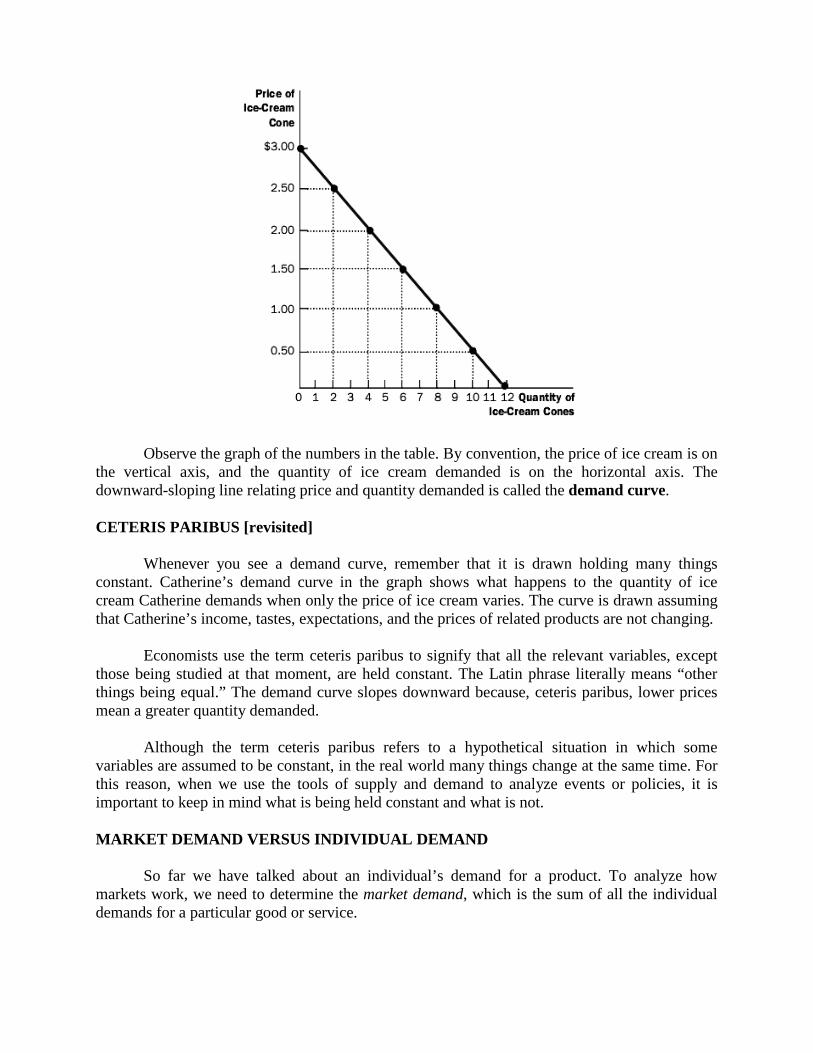
Observe the graph of the numbers in the table. By convention, the price of ice cream is onthe vertical axis, and the quantity of ice cream demanded is on the horizontal axis. Thedownward-sloping line relating price and quantity demanded is called the demand curve.
CETERIS PARIBUS [revisited]
Whenever you see a demand curve, remember that it is drawn holding many thingsconstant. Catherine’s demand curve in the graph shows what happens to the quantity of icecream Catherine demands when only the price of ice cream varies. The curve is drawn assumingthat Catherine’s income, tastes, expectations, and the prices of related products are not changing.
Economists use the term ceteris paribus to signify that all the relevant variables, exceptthose being studied at that moment, are held constant. The Latin phrase literally means “otherthings being equal.” The demand curve slopes downward because, ceteris paribus, lower pricesmean a greater quantity demanded.
Although the term ceteris paribus refers to a hypothetical situation in which somevariables are assumed to be constant, in the real world many things change at the same time. Forthis reason, when we use the tools of supply and demand to analyze events or policies, it isimportant to keep in mind what is being held constant and what is not.
MARKET DEMAND VERSUS INDIVIDUAL DEMAND
So far we have talked about an individual’s demand for a product. To analyze howmarkets work, we need to determine the market demand, which is the sum of all the individualdemands for a particular good or service.
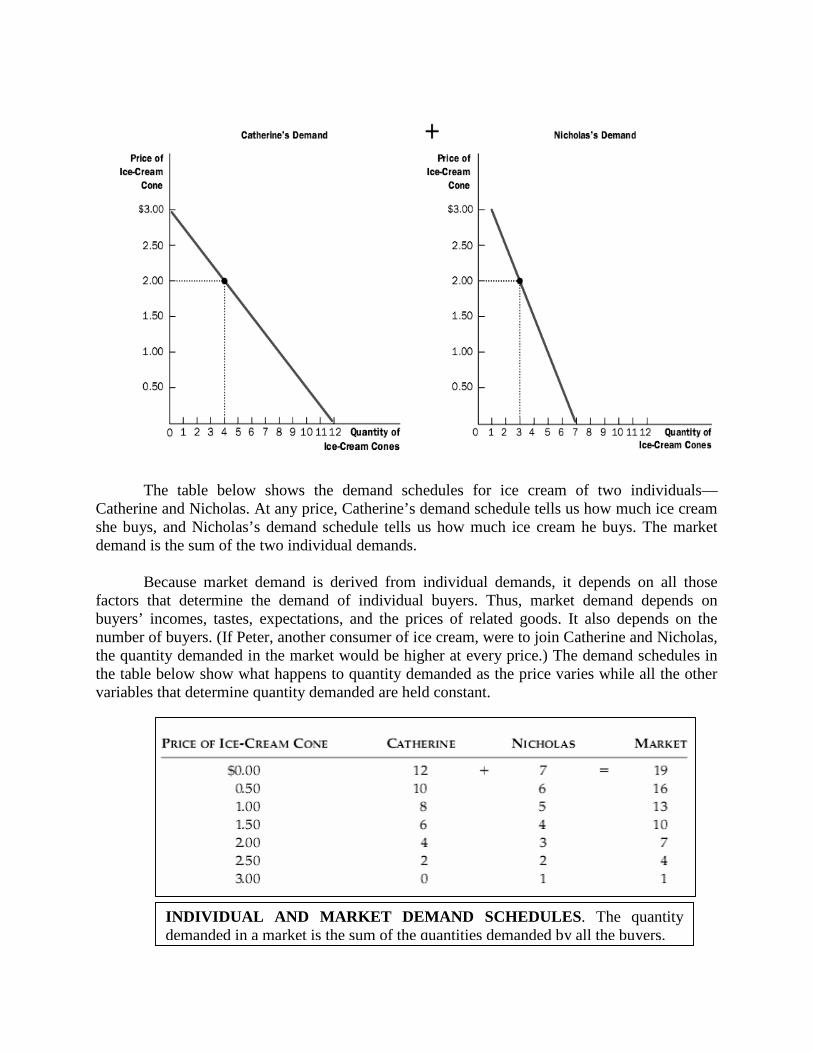
The table below shows the demand schedules for ice cream of two individuals—Catherine and Nicholas. At any price, Catherine’s demand schedule tells us how much ice creamshe buys, and Nicholas’s demand schedule tells us how much ice cream he buys. The marketdemand is the sum of the two individual demands.
Because market demand is derived from individual demands, it depends on all thosefactors that determine the demand of individual buyers. Thus, market demand depends onbuyers’ incomes, tastes, expectations, and the prices of related goods. It also depends on thenumber of buyers. (If Peter, another consumer of ice cream, were to join Catherine and Nicholas,the quantity demanded in the market would be higher at every price.) The demand schedules inthe table below show what happens to quantity demanded as the price varies while all the othervariables that determine quantity demanded are held constant.
INDIVIDUAL AND MARKET DEMAND SCHEDULES. The quantitydemanded in a market is the sum of the quantities demanded by all the buyers.
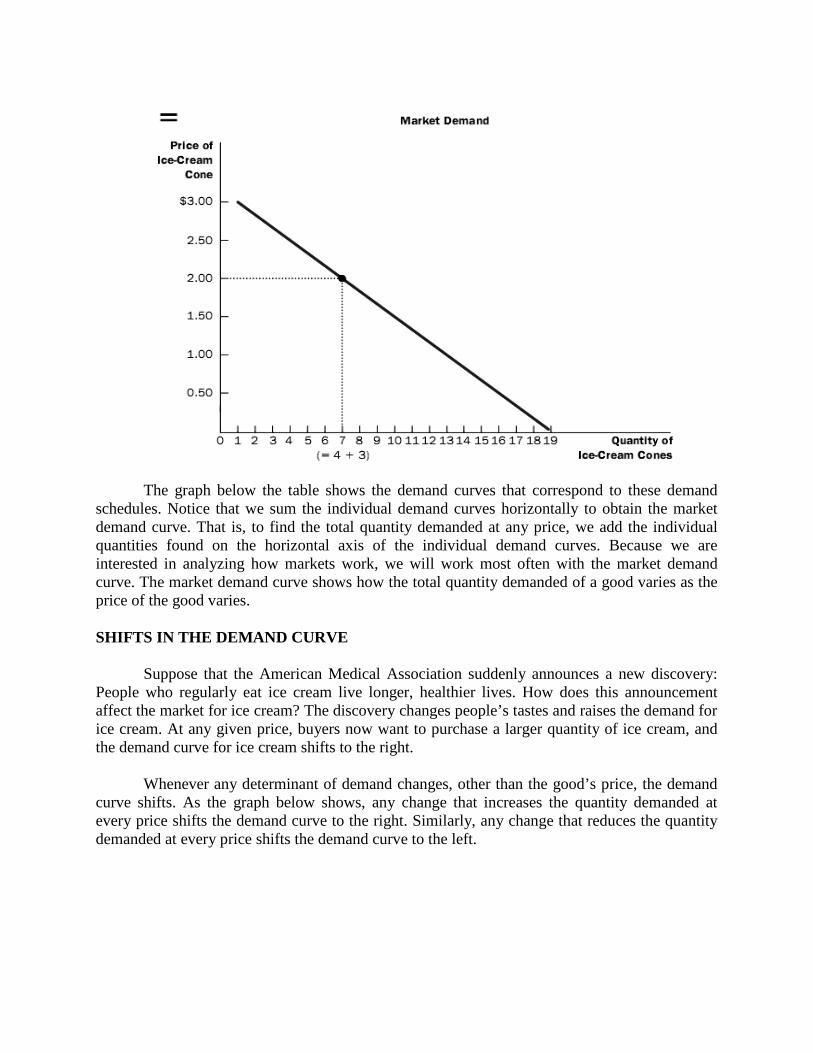
The graph below the table shows the demand curves that correspond to these demandschedules. Notice that we sum the individual demand curves horizontally to obtain the marketdemand curve. That is, to find the total quantity demanded at any price, we add the individualquantities found on the horizontal axis of the individual demand curves. Because we areinterested in analyzing how markets work, we will work most often with the market demandcurve. The market demand curve shows how the total quantity demanded of a good varies as theprice of the good varies.
SHIFTS IN THE DEMAND CURVE
Suppose that the American Medical Association suddenly announces a new discovery:People who regularly eat ice cream live longer, healthier lives. How does this announcementaffect the market for ice cream? The discovery changes people’s tastes and raises the demand forice cream. At any given price, buyers now want to purchase a larger quantity of ice cream, andthe demand curve for ice cream shifts to the right.
Whenever any determinant of demand changes, other than the good’s price, the demandcurve shifts. As the graph below shows, any change that increases the quantity demanded atevery price shifts the demand curve to the right. Similarly, any change that reduces the quantitydemanded at every price shifts the demand curve to the left.

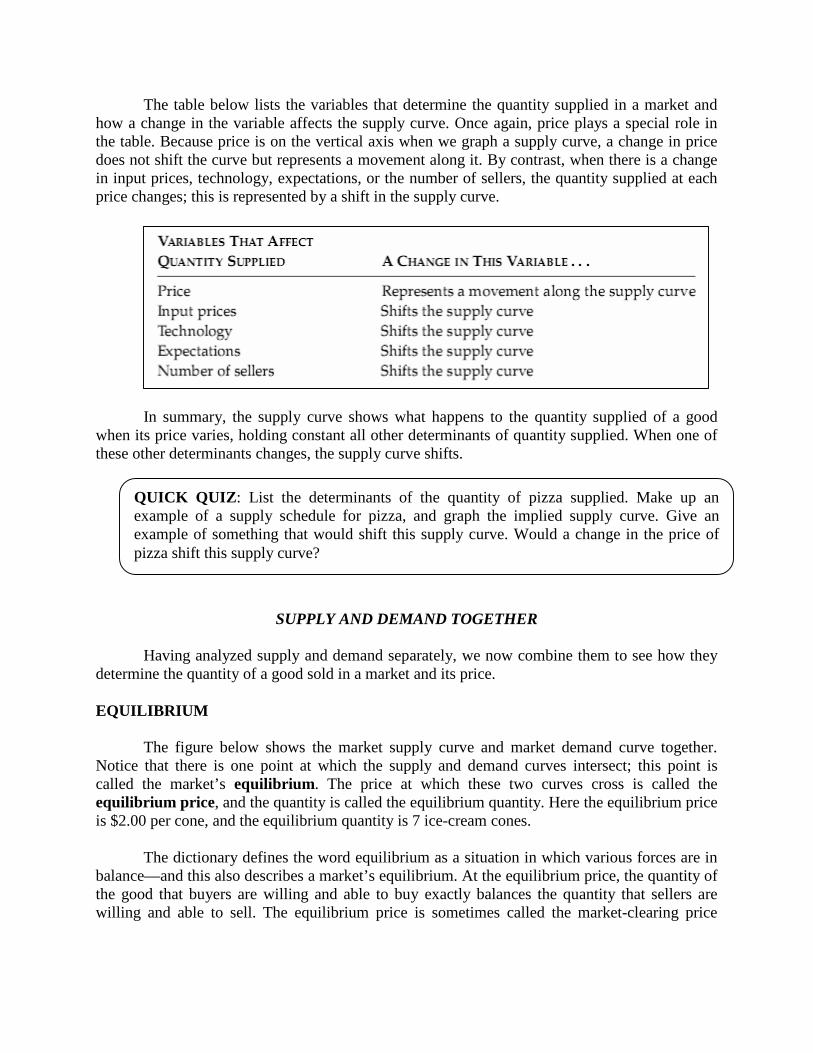
The table that follows lists the variables that determine the quantity demanded in amarket and how a change in the variable affects the demand curve. Notice that price plays aspecial role in this table. Because price is on the vertical axis when we graph a demand curve, achange in price does not shift the curve but represents a movement along it. By contrast, whenthere is a change in income, the prices of related goods, tastes, expectations, or the number ofbuyers, the quantity demanded at each price changes; this is represented by a shift in the demandcurve.
In summary, the demand curve shows what happens to the quantity demanded of a goodwhen its price varies, holding constant all other determinants of quantity demanded. When one ofthese other determinants changes, the demand curve shifts.
CASE STUDY: TWO WAYS TO REDUCE THE QUANTITY OF SMOKING DEMANDED
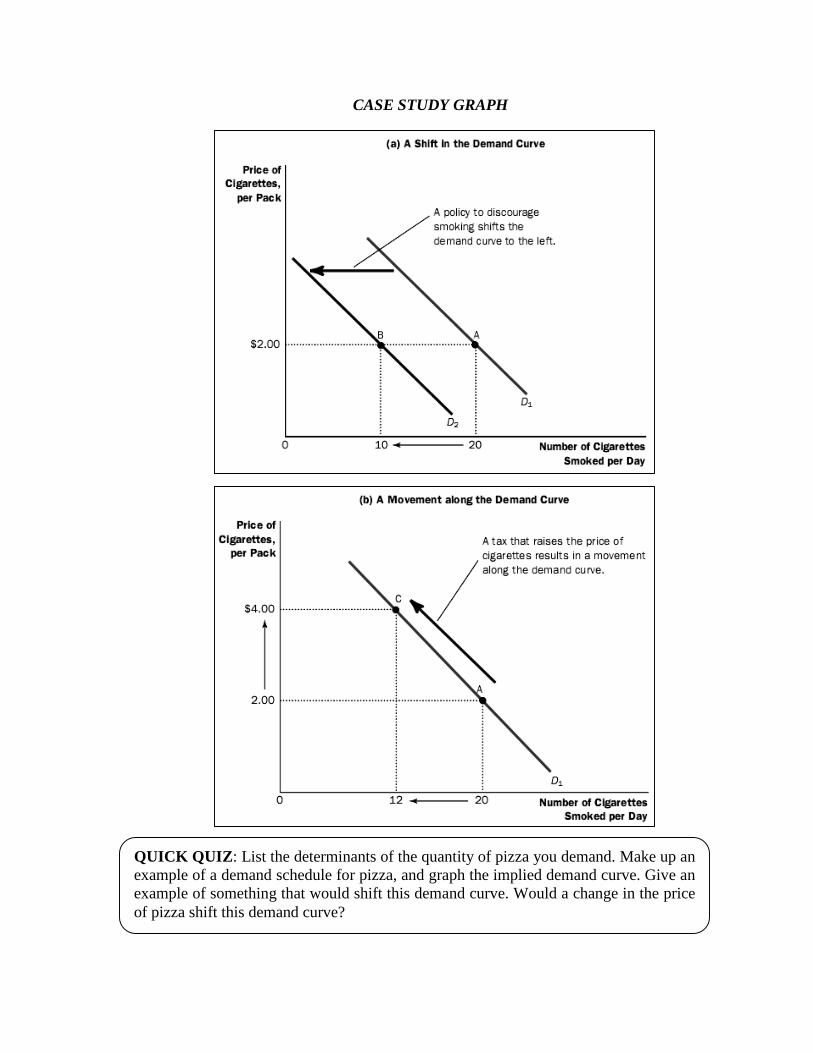
Public policymakers often want to reduce the amount that people smoke. There are twoways that policy can attempt to achieve this goal. One way to reduce smoking is to shift thedemand curve for cigarettes and other tobacco products. Public service announcements,mandatory health warnings on cigarette packages, and the prohibition of cigarette advertising ontelevision are all policies aimed at reducing the quantity of cigarettes demanded at any givenprice. If successful, these policies shift the demand curve for cigarettes to the left, as in panel (a)of the “Case Study Graph”.
Alternatively, policymakers can try to raise the price of cigarettes. If the governmenttaxes the manufacture of cigarettes, for example, cigarette companies pass much of this tax on toconsumers in the form of higher prices. A higher price encourages smokers to reduce thenumbers of cigarettes they smoke. In this case, the reduced amount of smoking does notrepresent a shift in the demand curve. Instead, it represents a movement along the same demandcurve to a point with a higher price and lower quantity, as in panel (b) of the “Case StudyGraph”. How much does the amount of smoking respond to changes in the price of cigarettes?Economists have attempted to answer this question by studying what happens when the tax oncigarettes changes. They have found that a 10 percent increase in the price causes a 4 percentreduction in the quantity demanded. Teenagers are found to be especially sensitive to the price ofcigarettes: A 10 percent increase in the price causes a 12 percent drop in teenage smoking.
A related question is how the price of cigarettes affects the demand for illicit drugs, suchas marijuana. Opponents of cigarette taxes often argue that tobacco and marijuana aresubstitutes, so that high cigarette prices encourage marijuana use. By contrast, many experts onsubstance abuse view tobacco as a “gateway drug” leading the young to experiment with otherharmful substances. Most studies of the data are consistent with this view: They find that lowercigarette prices are associated with greater use of marijuana. In other words, tobacco andmarijuana appear to be complements rather than substitutes.
CASE STUDY GRAPH
SUPPLY
QUICK QUIZ: List the determinants of the quantity of pizza you demand. Make up anexample of a demand schedule for pizza, and graph the implied demand curve. Give anexample of something that would shift this demand curve. Would a change in the priceof pizza shift this demand curve?
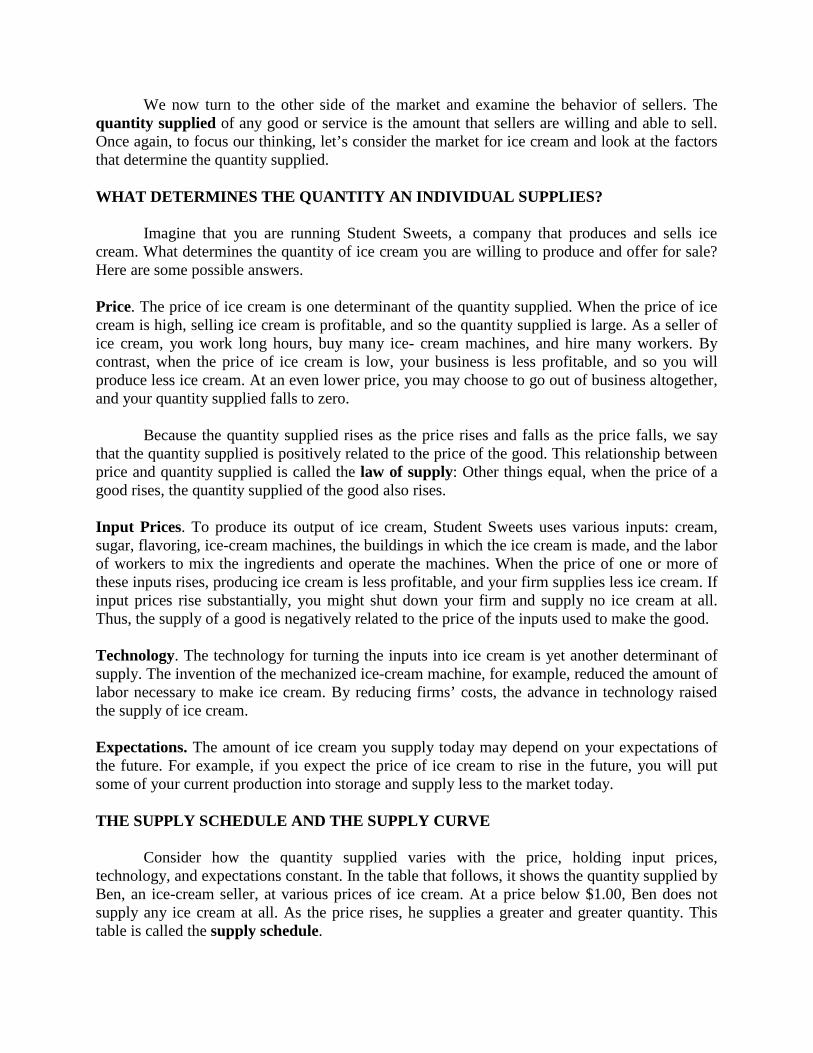
We now turn to the other side of the market and examine the behavior of sellers. Thequantity supplied of any good or service is the amount that sellers are willing and able to sell.Once again, to focus our thinking, let’s consider the market for ice cream and look at the factorsthat determine the quantity supplied.
WHAT DETERMINES THE QUANTITY AN INDIVIDUAL SUPPLIES?
Imagine that you are running Student Sweets, a company that produces and sells icecream. What determines the quantity of ice cream you are willing to produce and offer for sale?Here are some possible answers.
Price. The price of ice cream is one determinant of the quantity supplied. When the price of icecream is high, selling ice cream is profitable, and so the quantity supplied is large. As a seller ofice cream, you work long hours, buy many ice- cream machines, and hire many workers. Bycontrast, when the price of ice cream is low, your business is less profitable, and so you willproduce less ice cream. At an even lower price, you may choose to go out of business altogether,and your quantity supplied falls to zero.
Because the quantity supplied rises as the price rises and falls as the price falls, we saythat the quantity supplied is positively related to the price of the good. This relationship betweenprice and quantity supplied is called the law of supply: Other things equal, when the price of agood rises, the quantity supplied of the good also rises.
Input Prices. To produce its output of ice cream, Student Sweets uses various inputs: cream,sugar, flavoring, ice-cream machines, the buildings in which the ice cream is made, and the laborof workers to mix the ingredients and operate the machines. When the price of one or more ofthese inputs rises, producing ice cream is less profitable, and your firm supplies less ice cream. Ifinput prices rise substantially, you might shut down your firm and supply no ice cream at all.Thus, the supply of a good is negatively related to the price of the inputs used to make the good.
Technology. The technology for turning the inputs into ice cream is yet another determinant ofsupply. The invention of the mechanized ice-cream machine, for example, reduced the amount oflabor necessary to make ice cream. By reducing firms’ costs, the advance in technology raisedthe supply of ice cream.
Expectations. The amount of ice cream you supply today may depend on your expectations ofthe future. For example, if you expect the price of ice cream to rise in the future, you will putsome of your current production into storage and supply less to the market today.
THE SUPPLY SCHEDULE AND THE SUPPLY CURVE
Consider how the quantity supplied varies with the price, holding input prices,technology, and expectations constant. In the table that follows, it shows the quantity supplied byBen, an ice-cream seller, at various prices of ice cream. At a price below $1.00, Ben does notsupply any ice cream at all. As the price rises, he supplies a greater and greater quantity. Thistable is called the supply schedule.
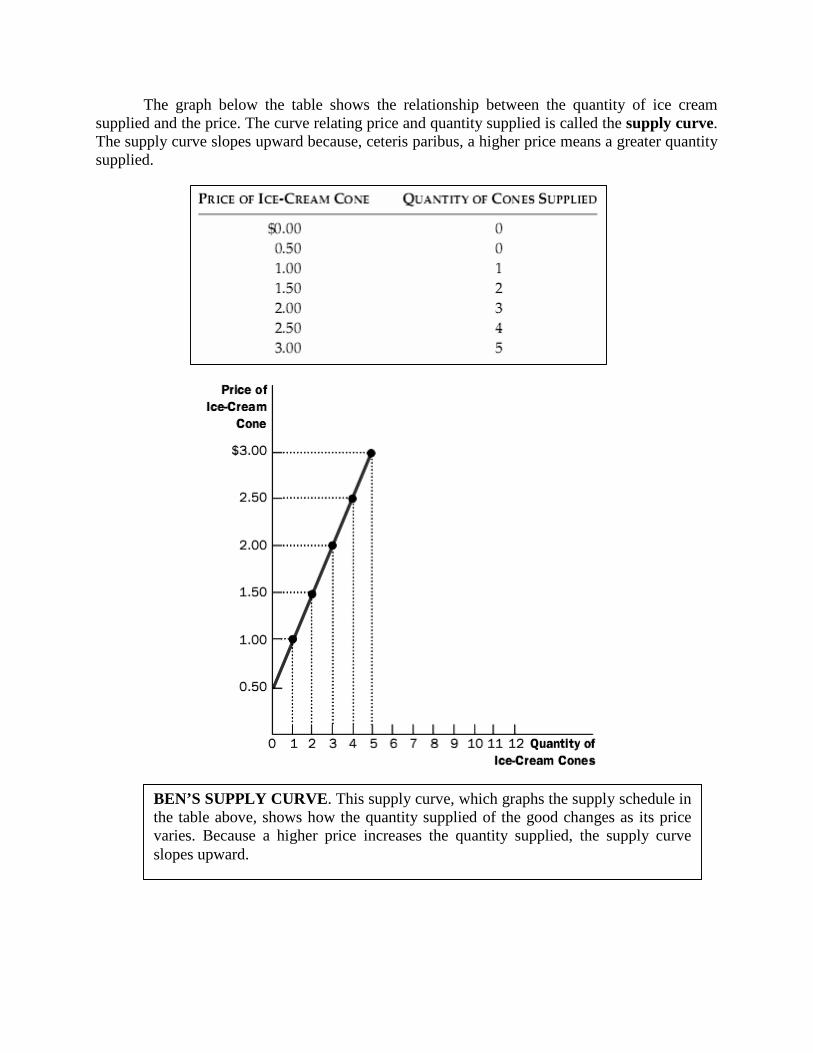
The graph below the table shows the relationship between the quantity of ice creamsupplied and the price. The curve relating price and quantity supplied is called the supply curve.The supply curve slopes upward because, ceteris paribus, a higher price means a greater quantitysupplied.
BEN’S SUPPLY CURVE. This supply curve, which graphs the supply schedule inthe table above, shows how the quantity supplied of the good changes as its pricevaries. Because a higher price increases the quantity supplied, the supply curveslopes upward.
MARKET SUPPLY VERSUS INDIVIDUAL SUPPLY
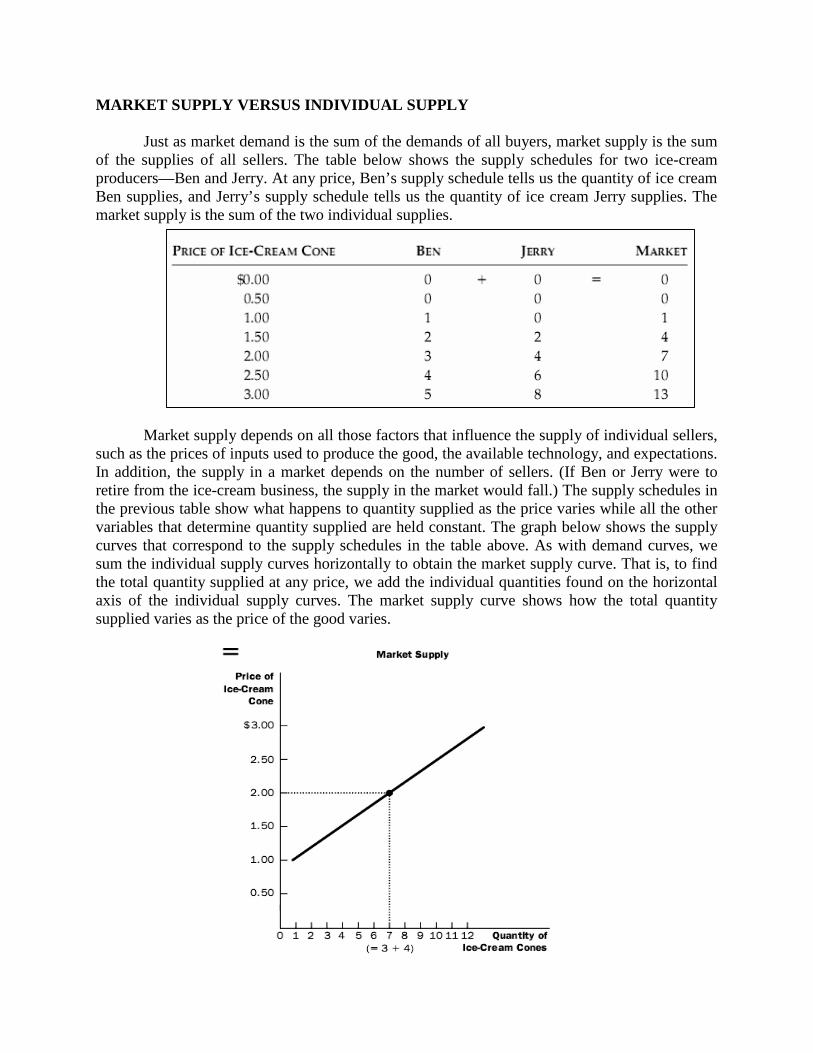
Just as market demand is the sum of the demands of all buyers, market supply is the sumof the supplies of all sellers. The table below shows the supply schedules for two ice-creamproducers—Ben and Jerry. At any price, Ben’s supply schedule tells us the quantity of ice creamBen supplies, and Jerry’s supply schedule tells us the quantity of ice cream Jerry supplies. Themarket supply is the sum of the two individual supplies.
Market supply depends on all those factors that influence the supply of individual sellers,such as the prices of inputs used to produce the good, the available technology, and expectations.In addition, the supply in a market depends on the number of sellers. (If Ben or Jerry were toretire from the ice-cream business, the supply in the market would fall.) The supply schedules inthe previous table show what happens to quantity supplied as the price varies while all the othervariables that determine quantity supplied are held constant. The graph below shows the supplycurves that correspond to the supply schedules in the table above. As with demand curves, wesum the individual supply curves horizontally to obtain the market supply curve. That is, to findthe total quantity supplied at any price, we add the individual quantities found on the horizontalaxis of the individual supply curves. The market supply curve shows how the total quantitysupplied varies as the price of the good varies.
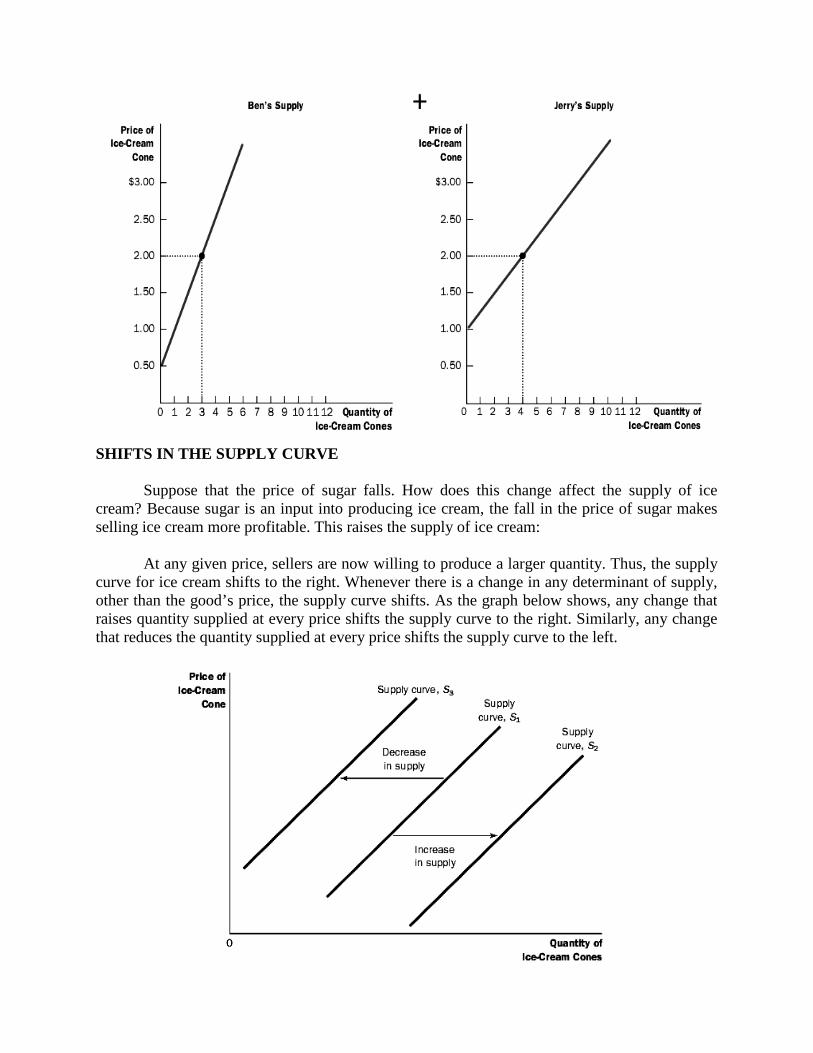
SHIFTS IN THE SUPPLY CURVE
Suppose that the price of sugar falls. How does this change affect the supply of icecream? Because sugar is an input into producing ice cream, the fall in the price of sugar makesselling ice cream more profitable. This raises the supply of ice cream:
At any given price, sellers are now willing to produce a larger quantity. Thus, the supplycurve for ice cream shifts to the right. Whenever there is a change in any determinant of supply,other than the good’s price, the supply curve shifts. As the graph below shows, any change thatraises quantity supplied at every price shifts the supply curve to the right. Similarly, any changethat reduces the quantity supplied at every price shifts the supply curve to the left.
The table below lists the variables that determine the quantity supplied in a market andhow a change in the variable affects the supply curve. Once again, price plays a special role inthe table. Because price is on the vertical axis when we graph a supply curve, a change in pricedoes not shift the curve but represents a movement along it. By contrast, when there is a changein input prices, technology, expectations, or the number of sellers, the quantity supplied at eachprice changes; this is represented by a shift in the supply curve.
In summary, the supply curve shows what happens to the quantity supplied of a goodwhen its price varies, holding constant all other determinants of quantity supplied. When one ofthese other determinants changes, the supply curve shifts.
SUPPLY AND DEMAND TOGETHER
Having analyzed supply and demand separately, we now combine them to see how theydetermine the quantity of a good sold in a market and its price.
EQUILIBRIUM
The figure below shows the market supply curve and market demand curve together.Notice that there is one point at which the supply and demand curves intersect; this point iscalled the market’s equilibrium. The price at which these two curves cross is called theequilibrium price, and the quantity is called the equilibrium quantity. Here the equilibrium priceis $2.00 per cone, and the equilibrium quantity is 7 ice-cream cones.
The dictionary defines the word equilibrium as a situation in which various forces are inbalance—and this also describes a market’s equilibrium. At the equilibrium price, the quantity ofthe good that buyers are willing and able to buy exactly balances the quantity that sellers arewilling and able to sell. The equilibrium price is sometimes called the market-clearing price
QUICK QUIZ: List the determinants of the quantity of pizza supplied. Make up anexample of a supply schedule for pizza, and graph the implied supply curve. Give anexample of something that would shift this supply curve. Would a change in the price ofpizza shift this supply curve?
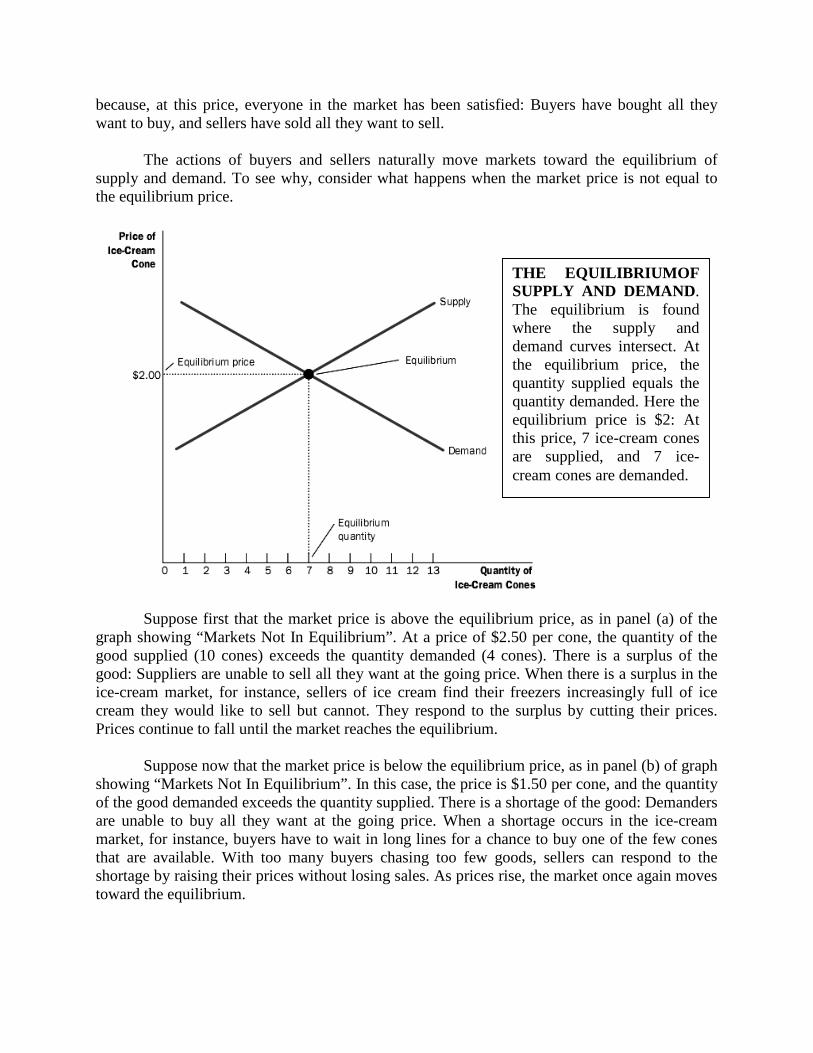
because, at this price, everyone in the market has been satisfied: Buyers have bought all theywant to buy, and sellers have sold all they want to sell.
The actions of buyers and sellers naturally move markets toward the equilibrium ofsupply and demand. To see why, consider what happens when the market price is not equal tothe equilibrium price.
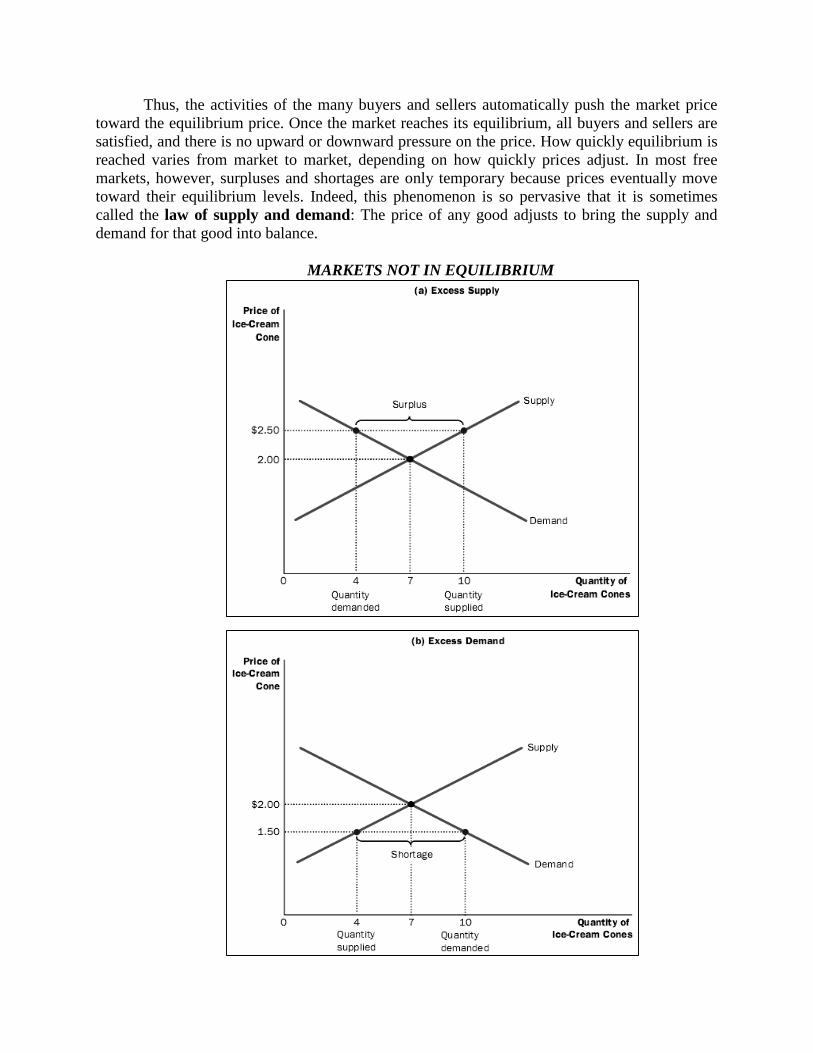
Suppose first that the market price is above the equilibrium price, as in panel (a) of thegraph showing “Markets Not In Equilibrium”. At a price of $2.50 per cone, the quantity of thegood supplied (10 cones) exceeds the quantity demanded (4 cones). There is a surplus of thegood: Suppliers are unable to sell all they want at the going price. When there is a surplus in theice-cream market, for instance, sellers of ice cream find their freezers increasingly full of icecream they would like to sell but cannot. They respond to the surplus by cutting their prices.Prices continue to fall until the market reaches the equilibrium.
Suppose now that the market price is below the equilibrium price, as in panel (b) of graphshowing “Markets Not In Equilibrium”. In this case, the price is $1.50 per cone, and the quantityof the good demanded exceeds the quantity supplied. There is a shortage of the good: Demandersare unable to buy all they want at the going price. When a shortage occurs in the ice-creammarket, for instance, buyers have to wait in long lines for a chance to buy one of the few conesthat are available. With too many buyers chasing too few goods, sellers can respond to theshortage by raising their prices without losing sales. As prices rise, the market once again movestoward the equilibrium.
THE EQUILIBRIUMOFSUPPLY AND DEMAND.The equilibrium is foundwhere the supply anddemand curves intersect. Atthe equilibrium price, thequantity supplied equals thequantity demanded. Here theequilibrium price is $2: Atthis price, 7 ice-cream conesare supplied, and 7 ice-cream cones are demanded.
Thus, the activities of the many buyers and sellers automatically push the market pricetoward the equilibrium price. Once the market reaches its equilibrium, all buyers and sellers aresatisfied, and there is no upward or downward pressure on the price. How quickly equilibrium isreached varies from market to market, depending on how quickly prices adjust. In most freemarkets, however, surpluses and shortages are only temporary because prices eventually movetoward their equilibrium levels. Indeed, this phenomenon is so pervasive that it is sometimescalled the law of supply and demand: The price of any good adjusts to bring the supply anddemand for that good into balance.
MARKETS NOT IN EQUILIBRIUM
THREE STEPS TO ANALYZING CHANGES IN EQUILIBRIUM
So far we have seen how supply and demand together determine a market’s equilibrium,which in turn determines the price of the good and the amount of the good that buyers purchaseand sellers produce. Of course, the equilibrium price and quantity depend on the position of thesupply and demand curves. When some event shifts one of these curves, the equilibrium in themarket changes. The analysis of such a change is called comparative statics because it involvescomparing two static situations—an old and a new equilibrium.
When analyzing how some event affects a market, we proceed in three steps. First, wedecide whether the event shifts the supply curve, the demand curve, or in some cases bothcurves. Second, we decide whether the curve shifts to the right or to the left. Third, we use thesupply-and-demand diagram to examine how the shift affects the equilibrium price and quantity.
Example: A Change in Demand. Suppose that one summer the weather is very hot. How doesthis event affect the market for ice cream? To answer this question, let’s follow our three steps.
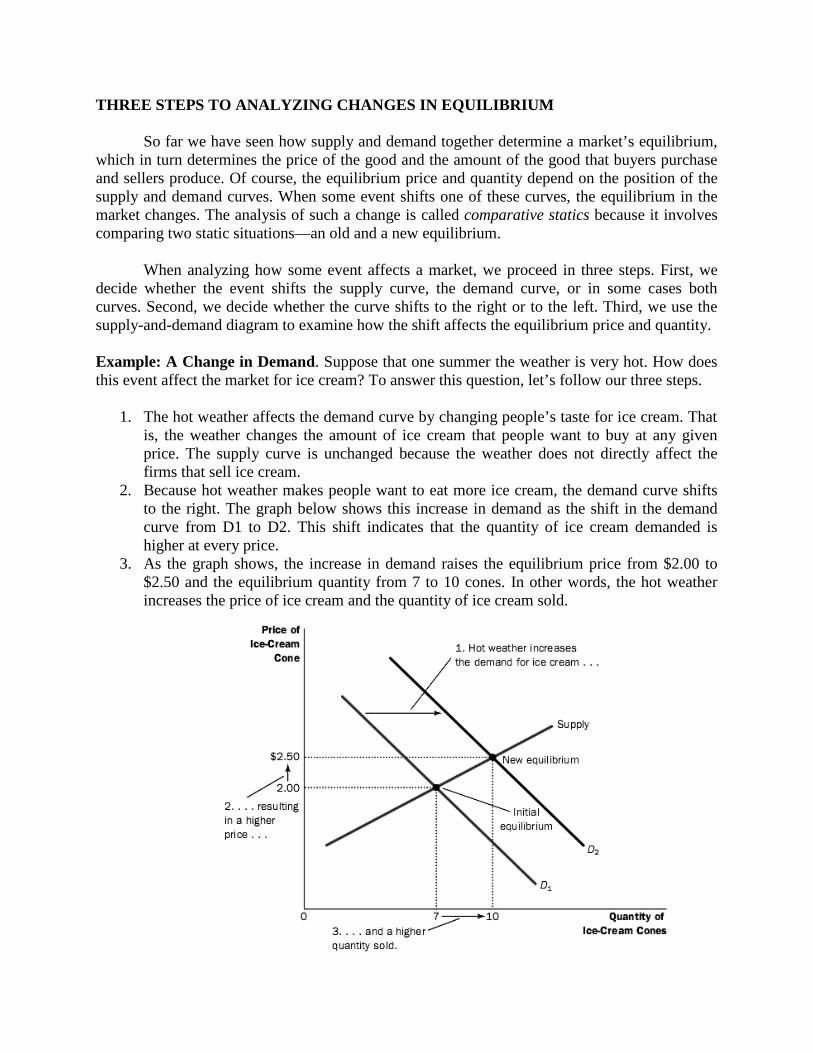
1. The hot weather affects the demand curve by changing people’s taste for ice cream. Thatis, the weather changes the amount of ice cream that people want to buy at any givenprice. The supply curve is unchanged because the weather does not directly affect thefirms that sell ice cream.
2. Because hot weather makes people want to eat more ice cream, the demand curve shiftsto the right. The graph below shows this increase in demand as the shift in the demandcurve from D1 to D2. This shift indicates that the quantity of ice cream demanded ishigher at every price.
3. As the graph shows, the increase in demand raises the equilibrium price from $2.00 to$2.50 and the equilibrium quantity from 7 to 10 cones. In other words, the hot weatherincreases the price of ice cream and the quantity of ice cream sold.

Shifts in Curves versus Movements along Curves. Notice that when hot weather drivesup the price of ice cream, the quantity of ice cream that firms supply rises, even though thesupply curve remains the same. In this case, economists say there has been an increase in“quantity supplied” but no change in “supply.”
“Supply” refers to the position of the supply curve, whereas the “quantity supplied” refersto the amount suppliers wish to sell. In this example, supply does not change because the weatherdoes not alter firms’ desire to sell at any given price. Instead, the hot weather alters consumers’desire to buy at any given price and thereby shifts the demand curve. The increase in demandcauses the equilibrium price to rise. When the price rises, the quantity supplied rises. Thisincrease in quantity supplied is represented by the movement along the supply curve.
To summarize, a shift in the supply curve is called a “change in supply,” and a shift in thedemand curve is called a “change in demand.” A movement along a fixed supply curve is calleda “change in the quantity supplied,” and a movement along a fixed demand curve is called a“change in the quantity demanded.”
Example: A Change in Supply. Suppose that, during another summer, an earthquake destroysseveral ice-cream factories. How does this event affect the market for ice cream? Once again, toanswer this question, we follow our three steps.
1. The earthquake affects the supply curve. By reducing the number of sellers, theearthquake changes the amount of ice cream that firms produce and sell at any givenprice. The demand curve is unchanged because the earthquake does not directly changethe amount of ice cream households wish to buy.
2. The supply curve shifts to the left because, at every price, the total amount that firms arewilling and able to sell is reduced. The graph below illustrates this decrease in supply as ashift in the supply curve from S1 to S2.
3. As the graph shows, the shift in the supply curve raises the equilibrium price from $2.00to $2.50 and lowers the equilibrium quantity from 7 to 4 cones. As a result of theearthquake, the price of ice cream rises, and the quantity of ice cream sold falls.
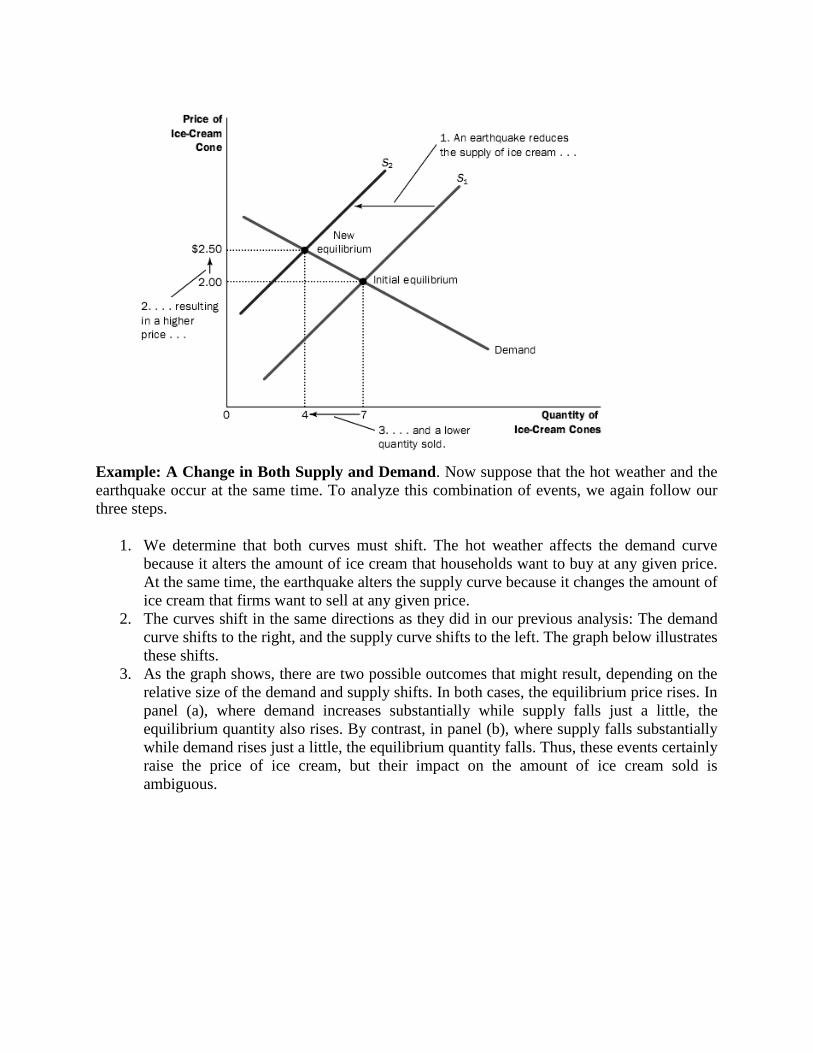
Example: A Change in Both Supply and Demand. Now suppose that the hot weather and theearthquake occur at the same time. To analyze this combination of events, we again follow ourthree steps.
1. We determine that both curves must shift. The hot weather affects the demand curvebecause it alters the amount of ice cream that households want to buy at any given price.At the same time, the earthquake alters the supply curve because it changes the amount ofice cream that firms want to sell at any given price.
2. The curves shift in the same directions as they did in our previous analysis: The demandcurve shifts to the right, and the supply curve shifts to the left. The graph below illustratesthese shifts.
3. As the graph shows, there are two possible outcomes that might result, depending on therelative size of the demand and supply shifts. In both cases, the equilibrium price rises. Inpanel (a), where demand increases substantially while supply falls just a little, theequilibrium quantity also rises. By contrast, in panel (b), where supply falls substantiallywhile demand rises just a little, the equilibrium quantity falls. Thus, these events certainlyraise the price of ice cream, but their impact on the amount of ice cream sold isambiguous.

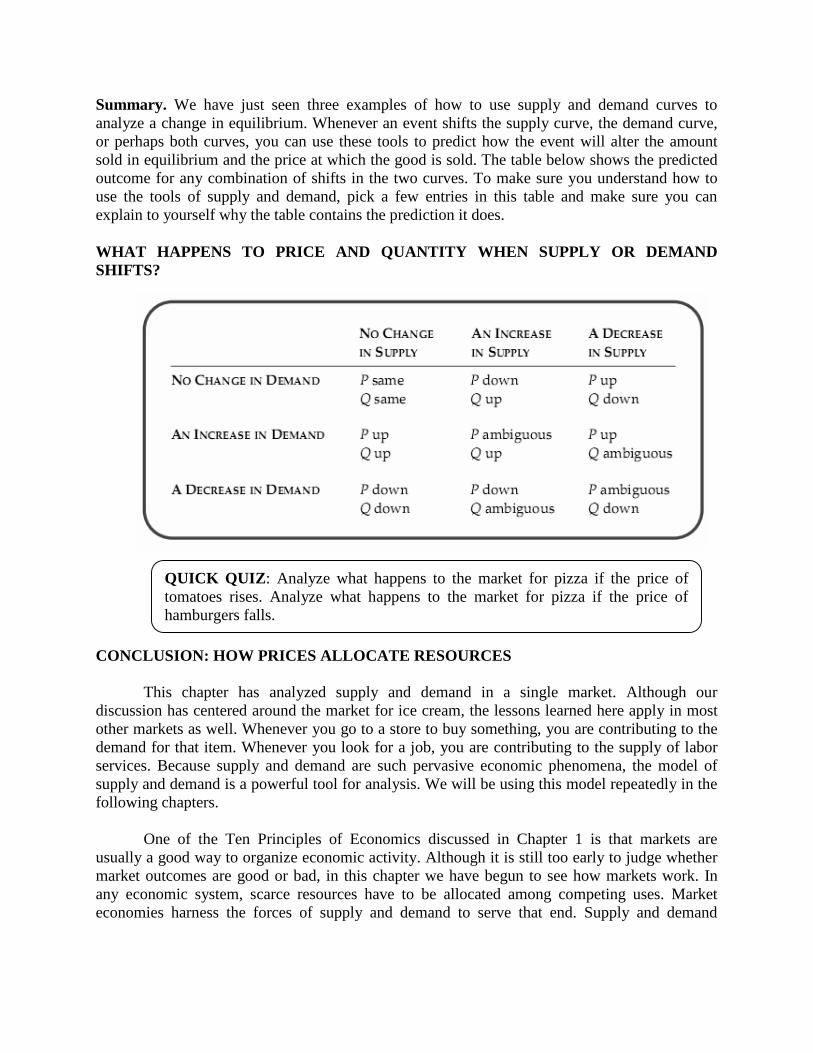
Summary. We have just seen three examples of how to use supply and demand curves toanalyze a change in equilibrium. Whenever an event shifts the supply curve, the demand curve,or perhaps both curves, you can use these tools to predict how the event will alter the amountsold in equilibrium and the price at which the good is sold. The table below shows the predictedoutcome for any combination of shifts in the two curves. To make sure you understand how touse the tools of supply and demand, pick a few entries in this table and make sure you canexplain to yourself why the table contains the prediction it does.
WHAT HAPPENS TO PRICE AND QUANTITY WHEN SUPPLY OR DEMANDSHIFTS?
CONCLUSION: HOW PRICES ALLOCATE RESOURCES
This chapter has analyzed supply and demand in a single market. Although ourdiscussion has centered around the market for ice cream, the lessons learned here apply in mostother markets as well. Whenever you go to a store to buy something, you are contributing to thedemand for that item. Whenever you look for a job, you are contributing to the supply of laborservices. Because supply and demand are such pervasive economic phenomena, the model ofsupply and demand is a powerful tool for analysis. We will be using this model repeatedly in thefollowing chapters.
One of the Ten Principles of Economics discussed in Chapter 1 is that markets areusually a good way to organize economic activity. Although it is still too early to judge whethermarket outcomes are good or bad, in this chapter we have begun to see how markets work. Inany economic system, scarce resources have to be allocated among competing uses. Marketeconomies harness the forces of supply and demand to serve that end. Supply and demand
QUICK QUIZ: Analyze what happens to the market for pizza if the price oftomatoes rises. Analyze what happens to the market for pizza if the price ofhamburgers falls.
together determine the prices of the economy’s many different goods and services; prices in turnare the signals that guide the allocation of resources.
For example, consider the allocation of beachfront land. Because the amount of this landis limited, not everyone can enjoy the luxury of living by the beach. Who gets this resource? Theanswer is: whoever is willing and able to pay the price. The price of beachfront land adjusts untilthe quantity of land demanded exactly balances the quantity supplied. Thus, in marketeconomies, prices are the mechanism for rationing scarce resources.
Similarly, prices determine who produces each good and how much is produced. Forinstance, consider farming. Because we need food to survive, it is crucial that some people workon farms. What determines who is a farmer and who is not? In a free society, there is nogovernment planning agency making this decision and ensuring an adequate supply of food.Instead, the allocation of workers to farms is based on the job decisions of millions of workers.This decentralized system works well because these decisions depend on prices. The prices offood and the wages of farm workers (the price of their labor) adjust to ensure that enough peoplechoose to be farmers.
If a person had never seen a market economy in action, the whole idea might seempreposterous. Economies are large groups of people engaged in many interdependent activities.What prevents decentralized decision making from degenerating into chaos? What coordinatesthe actions of the millions of people with their varying abilities and desires? What ensures thatwhat needs to get done does in fact get done? The answer, in a word, is prices. If marketeconomies are guided by an invisible hand, as Adam Smith famously suggested, then the pricesystem is the baton that the invisible hand uses to conduct the economic orchestra.