chapter five classification of shear strength of …
TRANSCRIPT
CHAPTER FIVE
CLASSIFICATION OF SHEAR STRENGTH OF JOINTS IN ROCK
5.1 Introduction
The shear strength of joint surfaces in a rock mass is a difficult parameter to determine.
Several researchers, including Arnadei and Seab (1990), Barton and Choubey (1977),
Goodman (1976), Nicholson (1983) and others have investigated this problem. The shear
strength parameters of joints in a rock mass are affected by a number of factors as described
in chapter two. To simulate these factors in a laboratory is virtually impossible and in this
study only the most important factors have been considered.
Geotechnical characteristics of joint surfaces in a rock mass can be described in terms of
hardness, roughness filling and water considerations. Sampling and testing of these joints is
difficult and time consuming. Design engineers usually need an estimate of the shear strength
of joints early during the design stage of a structure in a rock mass. If the shear strength could
be linked to a geotechnical description of the joints, then a first estimate of the shear strength
could be made which would satisfY the immediate need of the design engineer. This research
concentrated on classifYing joints in order to estimate the shear strength of joints at the early
stage of an investigation. The findings are discussed in this chapter. This chapter contributes
to the existing knowledge of shear strength by describing the results of shear tests on a
number of southern African rock types tested on the large shear machine described in chapter
four. The rock types used for the investigation were Basalt, Dolerite, Granite, Mudstone and
Sandstone.
The major factors influencing shear strength are:
(i) hardness of the joint surface
(ii) roughness of the joint surface
PhD-Chapter05-2003.doc
5.1
(iii) the influence of water
(iv) the effects of joint fill material
An attempt was made to estimate the shear strength parameters by describing geotechnical
properties of the joint surface, including hardness, roughness, joint fill material present and
the presence of water. These factors were correlated with the shear strengths measured during
large scale shear testing.
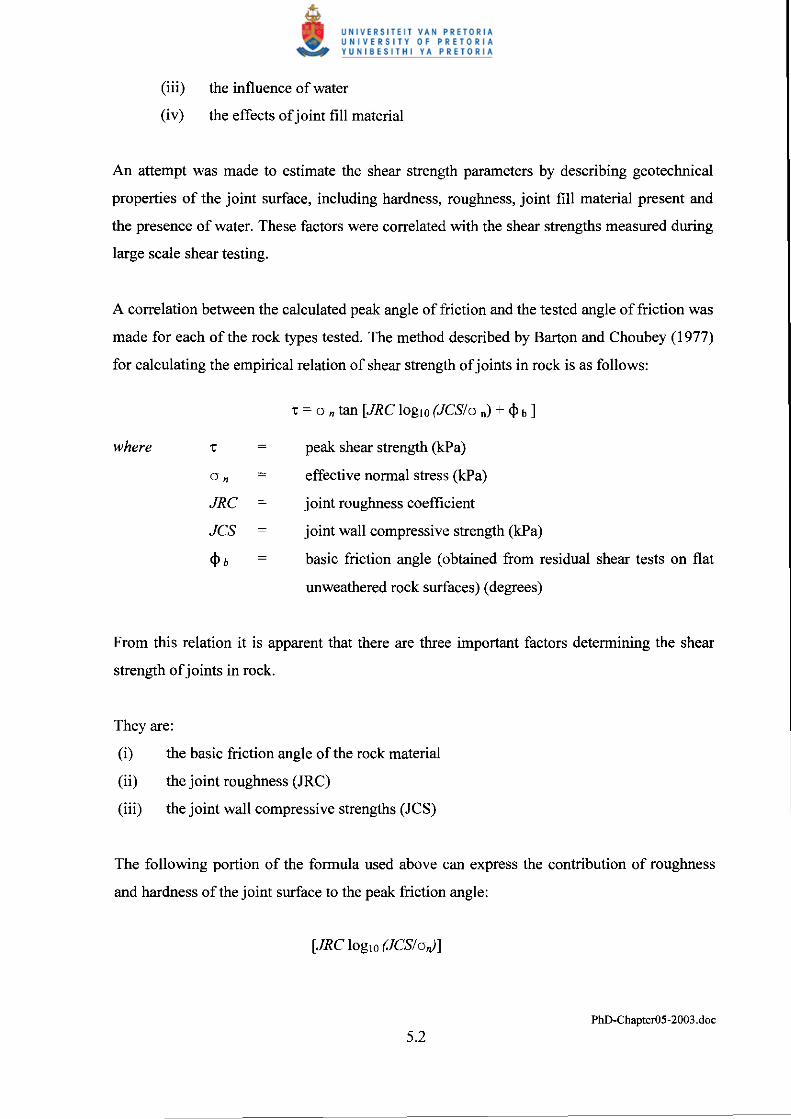
A correlation between the calculated peak angle of friction and the tested angle of friction was
made for each of the rock types tested. The method described by Barton and Choubey (1977)
for calculating the empirical relation of shear strength of joints in rock is as follows:
1: = a n tan [JRC IOglO (JCS/o n) + <P b ]
where 1: peak shear strength (kPa)
On = effective nonnal stress (kPa)
JRC = joint roughness coefficient
JCS joint wall compressive strength (kPa)
<Ph basic friction angle (obtained from residual shear tests on flat
unweathered rock surfaces) (degrees)
From this relation it is apparent that there are three important factors detennining the shear
strength of joints in rock.
They are:
(i) the basic friction angle of the rock material
(ii) the joint roughness (JRC)
(iii) the joint wall compressive strengths (JCS)
The following portion of the fonnula used above can express the contribution of roughness
and hardness of the joint surface to the peak friction angle:
[JRC IOglO (JCS/o,J]
PhD-Chapter05-2003.doc
5.2
5.2 Classification of joints according to this study
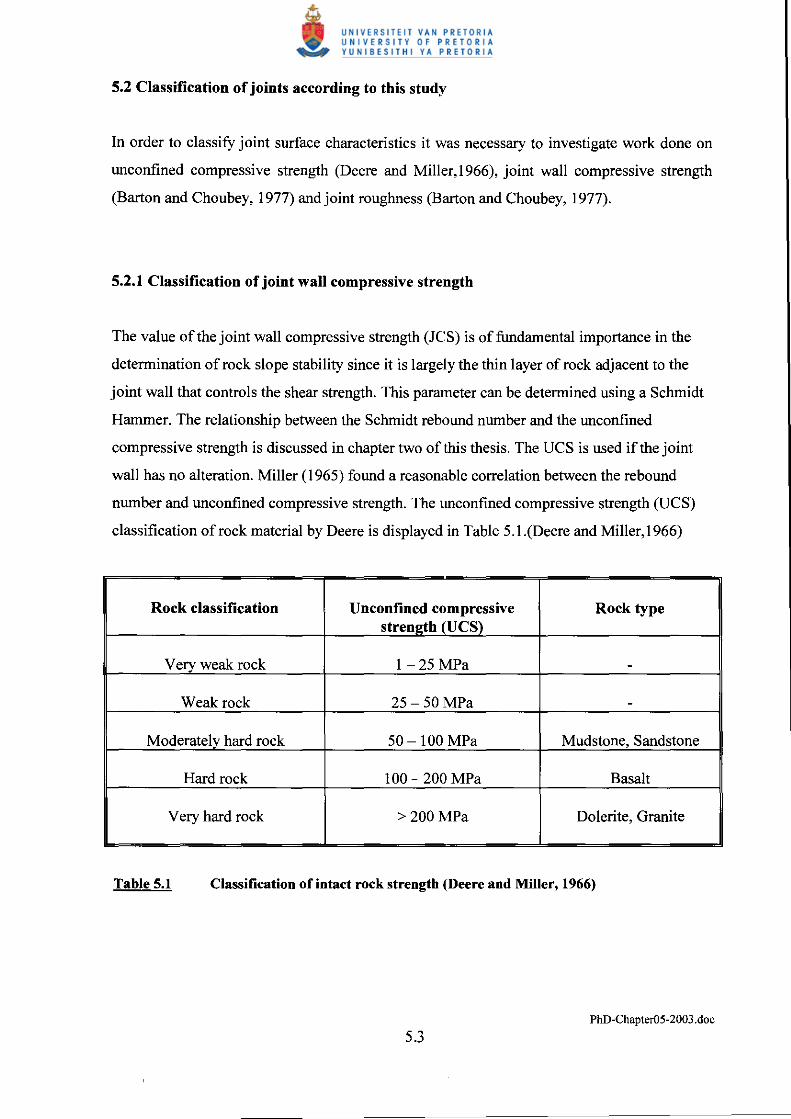
In order to classity joint surface characteristics it was necessary to investigate work done on
Wlconfined compressive strength (Deere and Miller,1966), joint wall compressive strength
(Barton and Choubey, 1977) and joint roughness (Barton and Choubey, 1977).
5.2.1 Classification of joint wall compressive strength
The value of the joint wall compressive strength (JCS) is of fundamental importance in the
determination of rock slope stability since it is largely the thin layer of rock adjacent to the
joint wall that controls the shear strength. This parameter can be determined using a Schmidt
Hammer. The relationship between the Schmidt reboWld number and the Wlconfined
compressive strength is discussed in chapter two of this thesis. The UCS is used if the joint
wall has no alteration. Miller (1965) fOWld a reasonable correlation between the reboWld
number and Wlconfined compressive strength. The unconfined compressive strength (UCS)
classification of rock material by Deere is displayed in Table 5.1.(Deere and Miller, I 966)
Rock classification
1I-___ V~ery:L..:weak rock
1~ ____ VV~eakrock
Moderatelv hard rock
1~ ____ H~ardrock
Very hard rock
Unconfined compressive stren\rth (UCS)
1-25 MPa
25 - 50 MPa
50-100 MPa
100-200 MPa
> 200 MPa
Rock type
Mudstone, Sandstone
Basalt
Dolerite, Granite
Table 5.1 Classification of intact rock strength (Deere and Miller, 1966)
PhD-Chapter05-2003.doc
5.3
5.2.2 Classification of roughness profiles
The roughness profile is another fundamental parameter in the determination of shear
strength. Table 2.4 (after Barton and Choubey, 1977) of roughness profiles with associated
JRC values was used as guide to roughness profiles.
5.3 Shear strength classification based on roughness and hardness of joint surfaces.
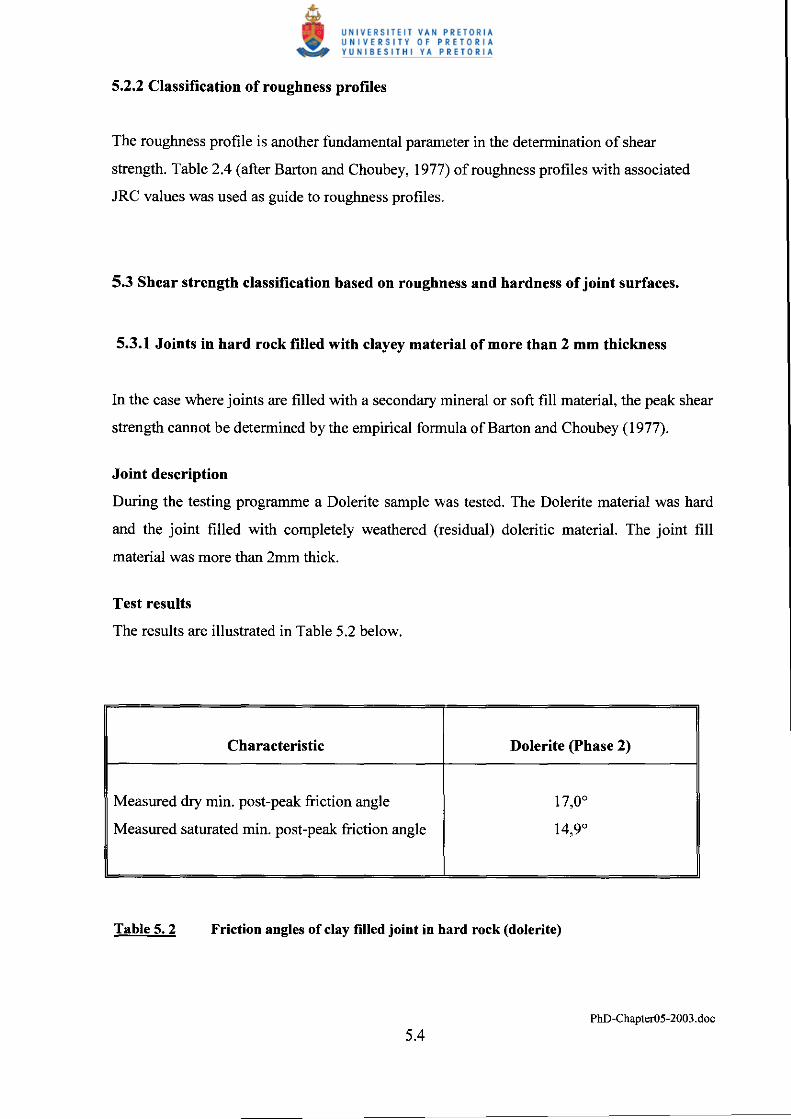
5.3.1 Joints in hard rock filled with clayey material of more than 2 mm thickness
In the case where joints are filled with a secondary mineral or soft fill material, the peak shear
strength cannot be determined by the empirical formula of Barton and Choubey (1977).
Joint description
During the testing programme a Dolerite sample was tested. The Dolerite material was hard
and the joint filled with completely weathered (residual) doleritic material. The joint fill
material was more than 2mm thick.
Test results
The results are illustrated in Table 5.2 below.
Characteristic
Measured dry min. post-peak friction angle
Measured saturated min. post-peak friction angle
Dolerite (phase 2)
17,00
14,90
Table 5. 2 Friction angles of clay filled joint in hard rock (dolerite)
PhD-Chapter05-2003.doc
5.4
Discussion of results
In this case the joint fill material (a 2 mm thick layer of clay) resulted in a maximum post
peak friction angle much lower than the basic friction angle of the rock. The basic friction
angle is 36°. The measured maximum post-peak friction angle was tested as 17,0° and the
saturated post-peak friction angle as 14,9°.
Conclusion
For filled joints in moderate to hard rock or joints in soft rock, the following conclusions can
be made:
(i) the basic friction angle of the rock material is not the minimum friction angle of a
filled joint.
(ii) the dry minimum post-peak friction angle is much lower than the basic.
(iii) the angle of friction is affected negatively by the presence of water if the infill
consists of clay.
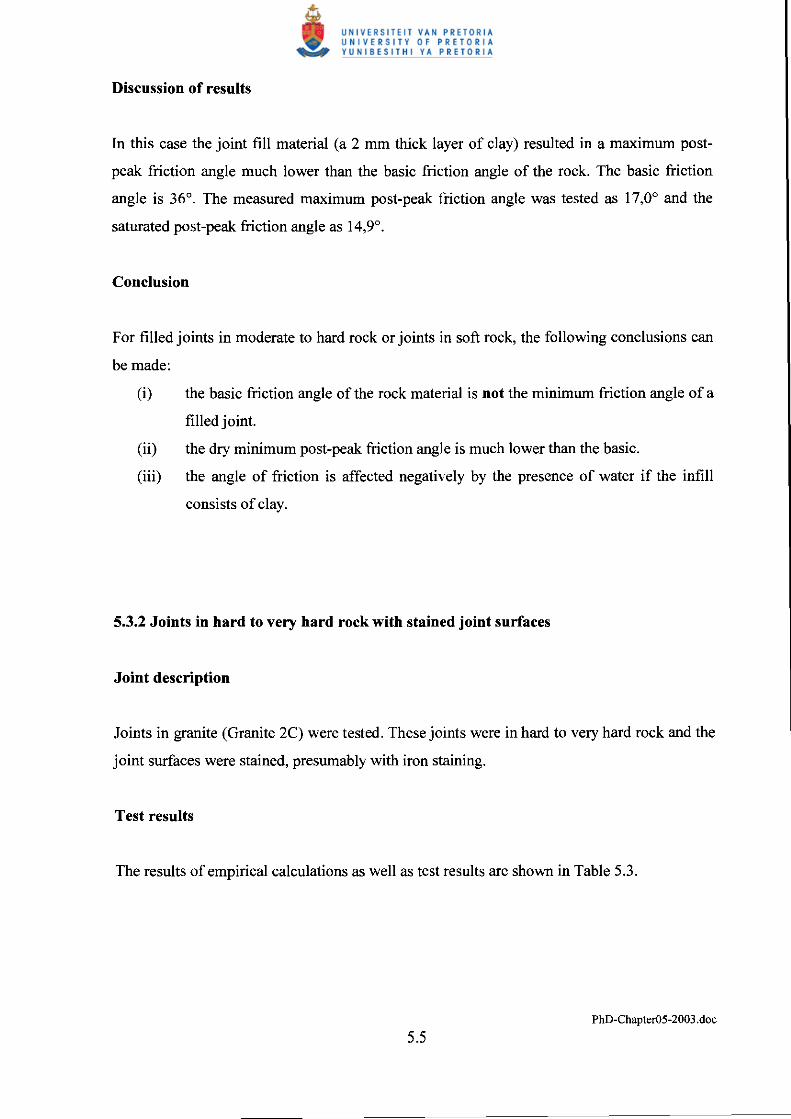
5.3.2 Joints in hard to very hard rock with stained joint surfaces
Joint description
Joints in granite (Granite 2C) were tested. These joints were in hard to very hard rock and the
joint surfaces were stained, presumably with iron staining.
Test results
The results of empirical calculations as well as test results are shown in Table 5.3.
PhD-Chapter05-2003.doc
5.5
Characteristic
Basic friction angle
JRC IOglO (JCS/o n)
Peak or max. pop angle of friction
Min. post-peak angle of friction
Min. post-peak angle of friction (saturated)
Empirical value
Peak
Tested value
35,2°
31,8°
29,8°
Table 5. 3 Friction angles of joints in hard to very hard rock with stained joint surfaces (Granite 2C)
Conclusions
The following conclusions could be made for unfilled joints and joints that are lightly stained
in hard rock:
(i) the basic friction angle is the minimum friction angle of a particular joint
(ii) the contribution of the roughness and hardness of the joint can be added to the basic
friction angle to obtain a design parameter.
(iii) the angle offriction is not significantly affected negatively by the presence of water.
(i) the max. post-peak is considerably lower than the calculated peak.
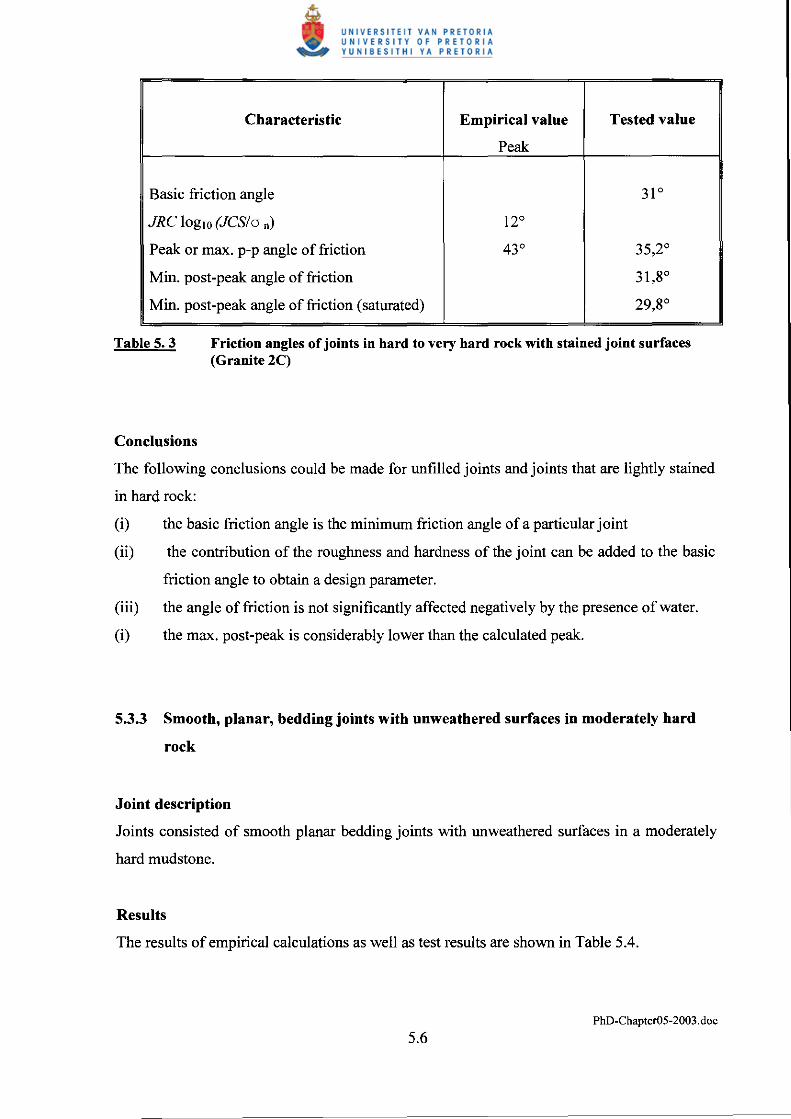
5.3.3 Smooth, planar, bedding joints with unweathered surfaces in moderately hard
rock
Joint description
Joints consisted of smooth planar bedding joints with unweathered surfaces in a moderately
hard mudstone.
Results
The results of empirical calculations as well as test results are shown in Table 5.4.
PhD-Chapter05-2003.doc
5.6
Characteristic
Basic friction angle
JRC loglO (JCS/a n)
Max. post-peak angle of friction
Min. post-peak angle offriction (saturated)
Empirical value
4,5°
35,5°
Tested value
Table 5.4 Friction angle of smooth, planar, bedding joints with unweathered surfaces in
moderately hard rock (Mudstone)
The tested angle of friction of the three samples is between 37,0° and 32,8° with an average
of 34,9°. The calculated peak friction angle is between 35,3° and 35,8° with an average of
35.5°. There is a difference of less than one degree between the calculated and the tested
value of the peak friction angle.
There is a marked difference between the angle of friction determined under dry conditions
and that of under saturated conditions. For Mudstone I the difference is 10°. For Mudstone I
and 2 the difference is even greater namely 22° and 22,4° respectively.
The influence of water on the shear strength (angle of friction) of mudstone was larger than
expected and this phenomenon should be taken into consideration in the design of dams on
mudstone.
Conclusions
(i) The empirical formula developed by Barton and Choubey (1977) to calculate peak
angle of friction was found to be applicable to the rock type tested in this case under
dry conditions.
(i) The influence of water on the shear strength (angle of friction) of mudstone was larger
than expected and this phenomenon should be taken into consideration in the design
of dams on mudstone.
PhD-ChapterOS-2003.doc
5.7
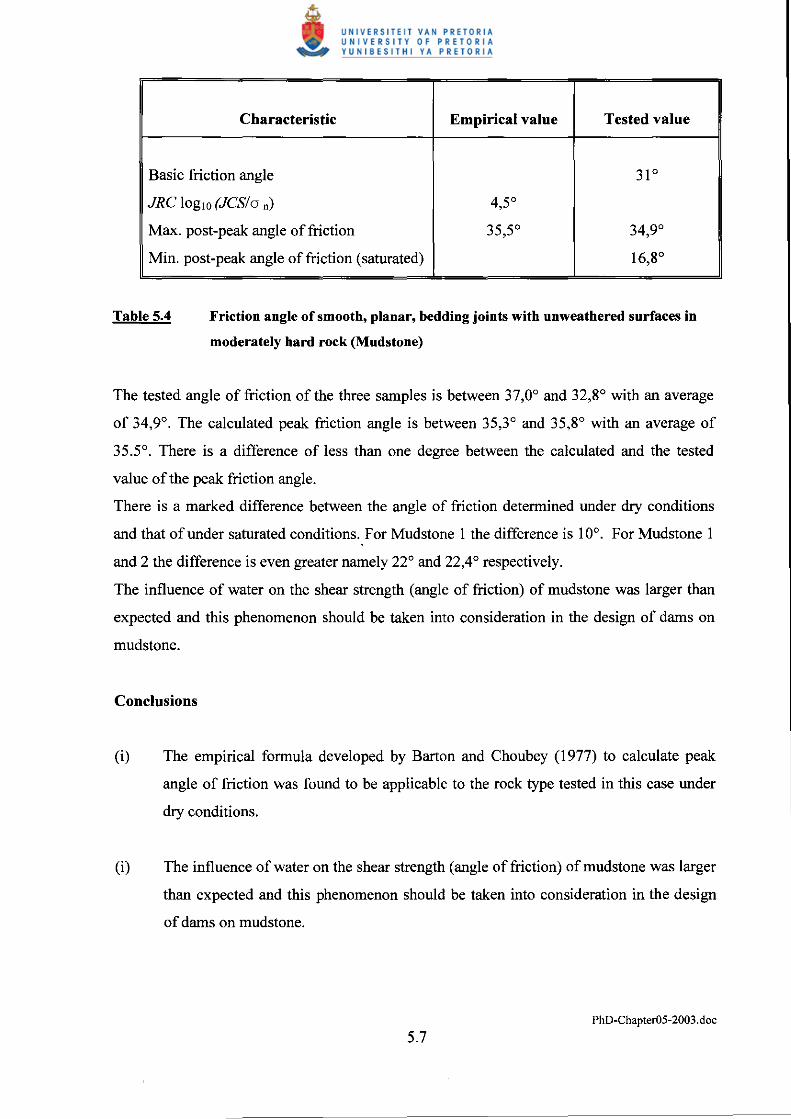
5.3.4 Rough, planar, unweathered surfaces in hard rock
In a rock mass where joint surfaces are characterised by moderate to high joint roughness
coefficient values (JRC above 6 according to Barton and Choubey, 1977) and high joint wall
compressive strength values (UCS above 100 MPa), the shear strength is determined by these
characteristics. The peak shear strength can be calculated using Barton and Choubey's
empirical formula (1977). In essence the peak angle of friction consists of the basic friction
angle plus the contribution of the hardness and roughness.
Joint description
Unweathered joints in hard rock (Granite) were investigated. The joints were rough and
planar.
Results
Results are shown in Table 5.5.
Characteristic
Basic friction angle
JRC loglO (JCS/o n)
Max. post·peak angle of friction
Min. post-peak angle of friction
Min post-peak angle of friction (saturated)
Empirical value
By Barton
10°
41 °
Tested value
3F
43,F
37,0°
27,5°
Table 5.5 Friction angle of rongh, planar, tectonic, nnweathered snrfaces in hard rock (Granite IC)
Discussion of results
The tested maximum post-peak and calculated peak friction angle for the specimen are almost
the same. The effect of water is that the friction angle under saturated conditions is about 10°
lower than under dry conditions.
PhD-Chapter05-2003.doc
5.8
Conclusion
(i) In hard rock with relatively rough surfaces the calculated peak friction angle is
much the same as the tested maximum post-peak value.
(ii) The influence of water on the angle of friction is relative large, in this case almost
10°.
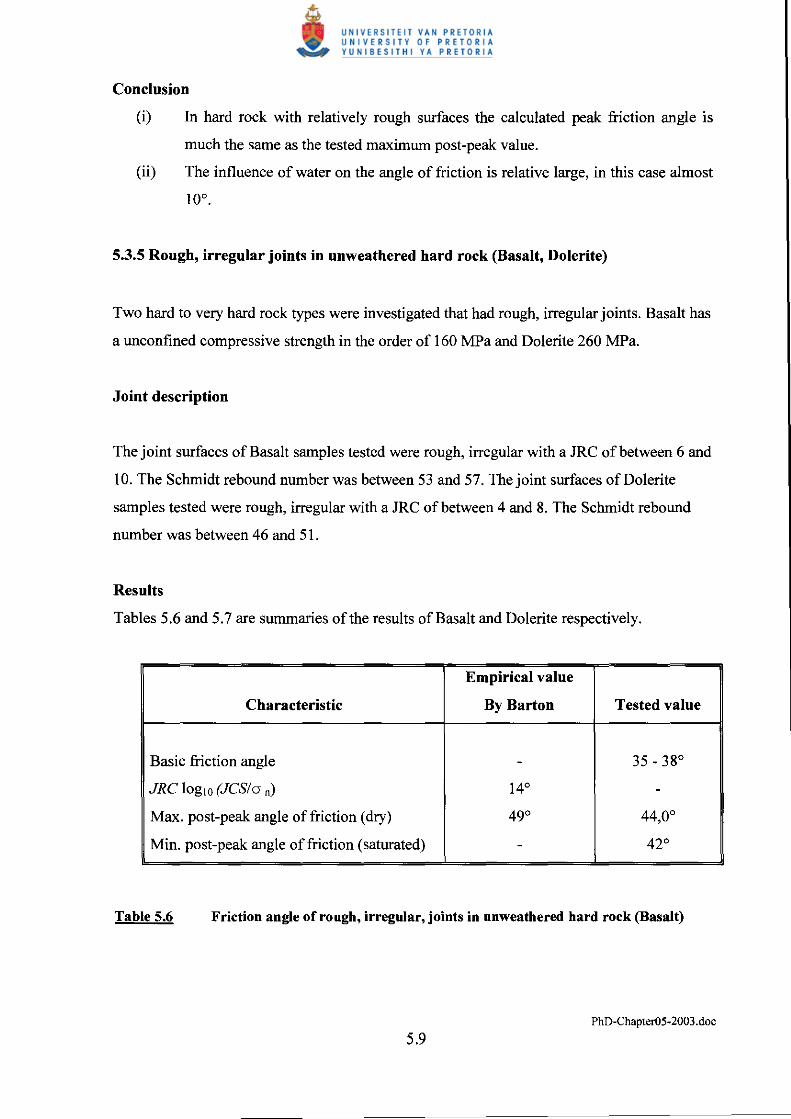
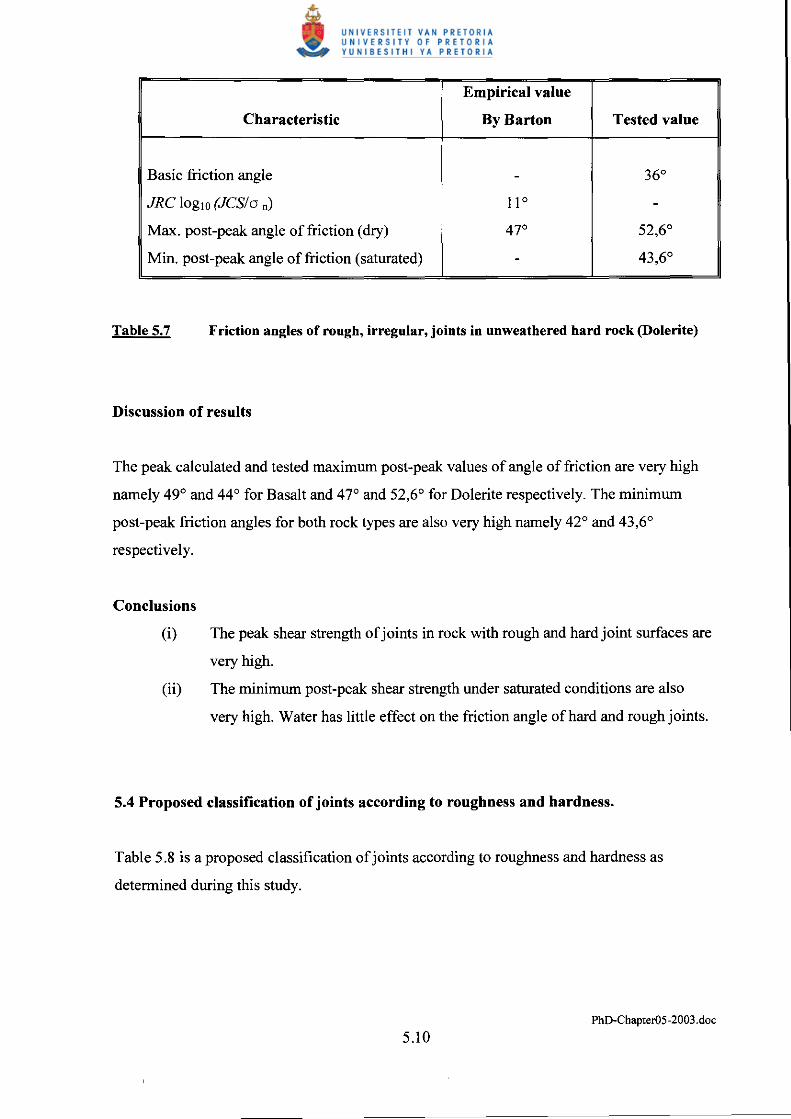
5,3.5 Rough, irregular joints in unweathered hard rock (Basalt, Dolerite)
Two hard to very hard rock types were investigated that had rough, irregular joints. Basalt has
a unconfined compressive strength in the order of 160 MPa and Dolerite 260 MPa.
Joint description
The joint surfaces of Basalt samples tested were rough, irregular with a JRC of between 6 and
10. The Schmidt rebound number was between 53 and 57. The joint surfaces of Dolerite
samples tested were rough, irregular with a JRC of between 4 and 8. The Schmidt rebound
number was between 46 and 51.
Results
Tables 5.6 and 5.7 are summaries of the results of Basalt and Dolerite respectively.
Characteristic
Basic friction angle
JRC 10gIO (JCSla n)
Max. post-peak angle of friction (dry)
Min. post-peak angle offriction (saturated)
Empirical value
By Barton Tested value
Table 5.6 Friction angle of rough, irregular, joints in unweathered hard rock (Basalt)
PhD·Chapter05-2003.doc
5.9
Characteristic
Basic frictIOn angle
JRC 10glO (JCS/o n)
Max. post-peak angle of friction (dry)
Min. post-peak angle of friction (saturated)
Empirical value
By Barton
11°
47°
Tested value
36°
52,6°
43,6°
Table 5.7 Friction angles of rougb, irregular, joiuts in unweathered hard rock (Dolerite)
Discussion of results
The peak calculated and tested maximum post-peak values of angle of friction are very high
namely 49° and 44° for Basalt and 47° and 52,6° for Dolerite respectively. The minimum
post-peak friction angles for both rock types are also very high namely 42° and 43,6°
respectively.
Conclusions
(i) The peak shear strength of joints in rock with rougb and hard joint surfaces are
very high.
(ii) The minimum post-peak shear strength under saturated conditions are also
very high. Water has little effect on the friction angle of hard and rough joints.
5.4 Proposed classification of joints according to roughness and hardness.
Table 5.8 is a proposed classification of joints according to roughness and hardness as
determined during this study.
PhD-Chapter05-2003.doc
5.10
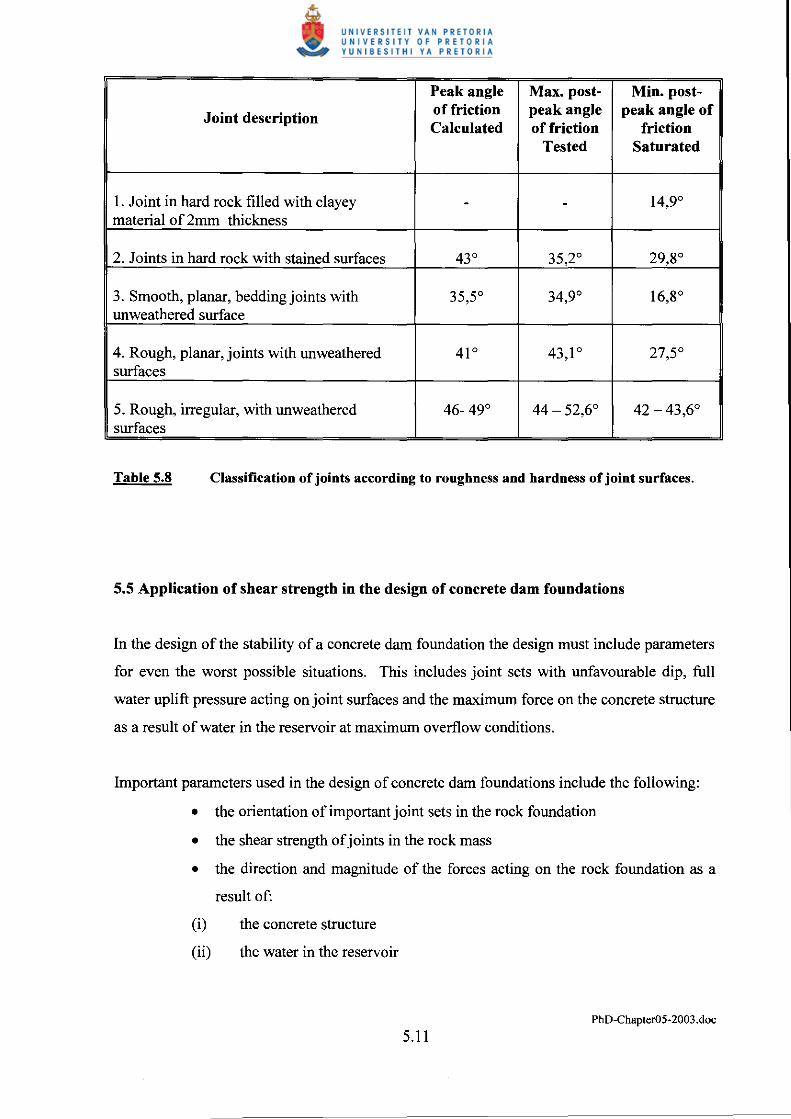
Peak angle Max. post- Min. post-
Joint description offriction peak angle peak angle of Calculated of friction friction
Tested Saturated
I. Joint in hard rock filled with clayey - - 14.9° material of 2mm thickness
2. Joints in hard rock with stained surfaces 43° 35,2° 29,8°
3. Smooth, planar, bedding joints with 35,5° 34,9° 16,8° unweathered surface
4. Rough, planar, joints with unweathered 41 ° 43,1 ° 27,5° surfaces
5. Rough, irregular, with unweathered 46- 49° 44 - 52,6° 42 - 43,6° surfaces
Table 5.8 Classification of joints according to roughness and hardness of joint surfaces.
5.5 Application of shear strength in the design of concrete dam foundations
In the design of the stability of a concrete dam foundation the design must include parameters
for even the worst possible situations. This includes joint sets with unfavourable dip, full
water uplift pressure acting on joint surfaces and the maximum force on the concrete structure
as a result of water in the reservoir at maximum overflow conditions.
Important parameters used in the design of concrete dam foundations include the following:
• the orientation of important joint sets in the rock foundation
• the shear strength of joints in the rock mass
• the direction and magnitude of the forces acting on the rock foundation as a
result of:
(i) the concrete structure
(ii) the water in the reservoir
PhD·Chapter05-2003.doc
5.11
(iii) the uplift pressure of the water
(iv) external forces (e.g. Seismic)
Instability can occur as a result of sliding of the concrete structure along an unfavourable joint
set with insufficient shear strength or rotation of the concrete structure around the toe of the
structure. The design of every structure including the foundation as part of the structure
should be treated separately and investigated in detail.
PhD-Chapter05-2003.doc
5.12