chapter areas for decision: trade, technology, and employment
TRANSCRIPT

Chapter 4
Areas for Decision:Trade, Technology,
and Employment

Chapter 4
Areas for Decision: Trade, Technology,and Employment
Having laid out each step of the fiber/fabric/end sumer has been affected by these changes. Next, theuse production chain in chapter 3, this chapter will chapter looks at recent developments in the researchexamine the role of textiles and apparel as a com- and development of new products and productionpetitor in world markets and as a player in the U.S. techniques used by U.S. textile and apparel firms,economy. First, the chapter reviews global reactions and assesses the importance of capital investmentto the increasingly international textile and apparel to the future of the domestic industry. The chapterindustry, outlines how the U.S. public and private concludes with a discussion of the past, present, andsectors have responded to changing conditions at potential future effects of trade and technology onhome and abroad, and addresses how the U.S. con- those who work to produce textiles and apparel.
DECLINING TRADE BALANCES SHAKE TEXTILE ANDAPPAREL MARKETS
Declining trade balances, perhaps more than anyother single economic or technological issue, havebeen responsible for upheaval in the textile and ap-parel industry. The experience of this industry is partof an unfortunate recent trend in the trade perform-ance of the U.S. economy. In 1986, the U.S. tradedeficit was $170 billion, and deficits were seen invirtually every manufacturing industry. The UnitedStates has become a debtor nation for the first timesince World War I.
Textiles and apparel had a negative trade balancein 1986 of $21.1 billion (see table 9). Approximatelyhalf of the value of apparel purchased in the UnitedStates is foreign-made, in contrast to two-fifths in1984 and one-fifth in 1976.1 In terms of volume, tex-tile imports into the United States have grown byan average of nearly 15 percent per year since 1980,while the U.S. textile market has grown by only 1percent per year. In addition, since 1985 importshave begun to penetrate new areas of the textile in-dustry, including raw yarn and unfinished fabric, aswell as household goods like draperies, sheets, andtowels.2
“’Amer~ca’s Textile Industry: Holding Its Salvation in Its Own Hands,”The Ecorrorms/, Apr 5, 1986, p. 79
2W E, Schmidt, ‘‘Textiles Defends Its Last Bastion, ” The New YorkTimes, June 23, 1985, p, 4F
The origins of imports are diverse. The countriesof the Far East—and increasingly China—have be-come major producers, and are penetrating the U.S.market. By 1985, import penetration in textiles hadreached 33 percent, in apparel it had grown to 48percent, and for industrial products and home fur-nishings it stood at 16 percent—increases of 100 to500 percent over a decade earlier (see tables 10, 11,and 12).
The impact of current levels of import penetrationon the economy in general, as well as on the textileindustry in particular, is devastating. It is estimatedthat every billion yards of fabric and apparel im-ported represents 100,000 lost job opportunities toU.S. workers. Imports, therefore, may account forwell over one million lost job opportunities, not tospeak of the additional million lost through “ripple”effects.
The major trends affecting textile and apparel tradeare:
●
●
●
●
the emergence of a global marketplace for tex-tiles and apparel,the growing protectionism of other nations,an “overly strong” dollar, andsignificantly lower wages and working condi-tions abroad.
79

80
Table 9.—U.S. Textile and Apparel Trade
Textiles Apparel Textiles and apparel
Trade Trade TradeImports Exports balance Imports Exports balance Imports Exports balance
F.A.S. valuesa
1970 . . . . . . . . . . . . . . . . . . . 1,1351971 . . . . . . . . . . . . . . . . . . . 1,3921972 . . . . . . . . . . . . . . . . . . . 1,5261973 . . . . . . . . . . . . . . . . . . . 1,568
C.I.F. valuesb
1974, . . . . . . . . . . . . . . . . . . 1,7521975 . . . . . . . . . . . . . . . . . . . 1,3361976 . . . . . . . . . . . . . . . . . . . 1,7911977 . . . . . . . . . . . . . . . . . . . 1,9391978. . . . . . . . . . . . . . . . . . . 2,4001979. . . . . . . . . . . . . . . . . . . 2,3991980 . . . . . . . . . . . . . . . . . . . 2,6761981 . . . . . . . . . . . . . . . . . . . 3,2501982 . . . . . . . . . . . . . . . . . . . 3,0001983 . . . . . . . . . . . . . . . . . . . 3,4601984 . . . . . . . . . . . . . . . . . . . 4,8741985: . . . . . . . . . . . . . . . . . . 5,2741986: . . . . . . . . . . . . . . . . . . 6,151
603632799
1,225
1,7951,6251,9701,9592,2253,1893,6323,6192,7842,3682,3822,3662,570
– 532 1,267– 760 1,521– 747 1,883– 343 2,168
+ 43 2,517+ 289 2,826+ 179 3,938+ 20 4,493– 175 6,108+ 790 6,291+ 956 6,849+ 369 8,008– 216 8,703–1,092 10,292–2,492 14,513–2,908 16,056–3.581 18.554
200204240278
400403510608677931
1,2021,232
953818807755899
–1,067–1,317–1,643–1,890
–2,117–2,423–3,428–3,885–5,431–5,360–5,647–6,776–7,750–9,474
–13,706–15,301–17,655
2,4022,9133,4093,736
4,2694,1625,7296,4328,5088,6909,525
11,25811,70313,75219,38721,33024,705
803836
1,0191,503
2,1952,0282,4802,5672,9024,1204,8344,8513,7373,1683,1893,1213,469
–1,599–2,077–2,390–2,333
–2,074–2,134–3,249–3,865–5,606–4,570–4,691–6,407–7,966
–10,585–16,198–18,209–21,136
aFAs Free AlongsidebCIF:Carflage Insurance Freight
SOURCE: U.S Department of Commerce, FT.135, FT-140, SITC Classification 65 &84. Data are in millions of dollars
Table 10.—The U.S. Textile Market Table 11 .—U.S. Apparel and Apparel Fabric Market
Import shareImportsa of market
U.S. market (million SYE) U.S. fabrics ‘?/0
Import shareImportsa of market
U.S. market (million SYE) U.S. fabrics %
197319741975197619771978,19791 9 8 0198119821983198419851986
29,61328,23427,03629,10330,36431,03330,43129,01828,86628,28230,53731,96332,652
5,1244,4113,8293,9873,9765,7384,6394,8845,7765,9347,706
10,14610,83112.698
24,48923,82323,20723,11624,37423,29525,79224,13423,09022,34822,83121,81721,821
—
17.315.614,217116,418,515,216,820.021.025.231.733.2
—
1 9 7 31974 . . . . .1975 . . . . . . .1 9 7 6 .1977 .1 9 7 8 , , 1979 . , . , ,1980 . . . . . . .1 9 8 11982, , , , , ,1 9 8 3 .1984..1985 .,,,1 9 8 6 , , ,
15,55714,85114,36315,34516,04416,21515,62715,24415,40515,61916,34117,01917,334
—
4,3133,7353,3514,3184,2704,9533,9884,2434,9765,0616,1397,9598,3229,595
11,24411,11611,01211,02711,77411,26211,63911,00110,42910,55810,1489,0609,012
—
27.725.223,328.126630.625.527,832.332.437.9468480
—
almpOfl~ ,“Clu@ frnlsfled tjoods fabrics and yarn of cotton wool and manmade fibers only
SOURCE American Textile Manufacturers Institute
almpoflslncludeappare[and apparel fabrrcs and yarn ofcotlon wool and manmade fibers only
SOURCE : American Textile Manufacturers Institute

81
Table 12.—U.S. Industrial and HomefurnishingsMarket
Import shareImportsa of market
U.S. market (million SYE) U S fabrics %
19731974197519761977197819791980198119821983198419851986
14,05613,38312,67313,75814,30614,81814,80413,77413,46112,66314,19614,94415,318
—
811676476699706785651642800874
1,5132,1862,5103,103
13,24512,70712,19713,08913,60014,03314,15313,13212,66111,78912.68312,75812,808
—
5 8513 84 94 95 34 44 75.96.9
10.7146164
almpod~ ,nclude fl”(shed goods and nonapparel fabrics Of COII!NI wOOI and manmade fibers ~nlY
SOURCE American Textile Manufacturers Institute
The Emergence of a GlobalTextile Industry
The world population consumes more than 65 bil-lion pounds of textile products per year, and con-sumption is currently growing annually by 1.7 bil-lion pounds, or 750,000 metric tons.3 Comparisonof growth rates across regions of the world showsthat textile growth within developing economies andplanned economies has been faster in recent yearsthan growth within older, more developed marketeconomies. Virtually every nation in the world hasat least a rudimentary textile industry—in order toserve its domestic market, provide jobs, and earnforeign exchange.4
The textile industry occupies a unique position inworld trade and economic development. Because ofthe labor intensity of the industry and the low wagerates of developing nations, many countries view theindustry as an initial rung on the ladder of industri-alization. The industry is commonly viewed as onethat, because of its labor intensity, can progressivelydisplace the textile industries of more advanced na-tions. But as each developing country’s own wagelevels rise, developed industries will be displacedby producers in nations further “down the ladder”
3B Tq’ne, et al , The G/oba/ Textlie /nd(M(~ (London George Allen& Unwin 1 984), P ~~
‘Ibid,, pp 50, 70,
of industrializations As a result, the governmentsof many developing nations promote the textile in-dustry as part of an export strategy. In some cases,this has led to an overexpansion of capacity and amajor export push in the 1980s, characterized bydepressed prices and widespread use of import pro-tection, export subsidies, dumping, and even quotafraud and smuggling.
In the past, the U.S. textile industry has been rela-tively insulated from the more dynamic internationalmarket. This situation is likely to change, becausefuture growth in demand for apparel and other tex-tile fabrics is expected to be largely outside the UnitedStates. United Nations projections are that the worldpopulation will grow by 850 million people between1985 and 1995—when 75 percent will live in devel-oping nations, 20 percent in those with centrallyplanned economies, and 5 percent in industrializednations.
Textile industries throughout the world are highlycompetitive. There are few important economies ofscale, only modest product differentiation, relativelysmall capital requirements compared to other man-ufacturing sectors, and no significant technologicalor resource-based barriers to entry. As a result, thereis a minimum amount of seller market power. Cou-pled with the continued labor intensity of produc-tion, the more industrialized and high wage coun-tries have great difficulties in gaining comparativeadvantage. These observations recently led scholarsfrom several U. S., British, and Japanese universitiesto conclude:
Almost without exception, textile industries inOECD countries have negligible output growth, ris-ing production costs, and declining employment. Onthe other hand, several developing countries with arelative abundance of labor have small but rapidlygrowing textile industries.6
The textile and apparel industry complex hasplainly become a global enterprise. The industriesin developed nations are disadvantaged by compara-tively stagnant domestic markets, as well as high la-
3Thomas Howell, et al., “The Textile and AppA Trade Crlsi\.” stud!”prepared for the Fiber, Fabr)(, and Apparel Coailtl~)n tor Tr,ide, Au-gust 1985, p I
6Toyne, et al , op. cit , p 1 IO.

82
bor costs. Advanced equipment is available in in-ternational markets.7
The U.S. textile market is, by and large, matureand saturated. This is especially true for standard-ized, nonspecialty items. Most analysts agree thatto have a strong future, the U.S. textile industry mustfocus on identifying competitive niches—especiallyfor nonstandardized items—and aggressive market-ing strategies at home and abroad. Many also arguethat growing protectionism abroad must be matchedby U.S. protection of its domestic industry.
The apparel trade deficit has reached a criticallevel; in 1986 it was nearly $18 billion and growing(again see table 9). The real value of imports in thedecade from 1975 to 1984 increased by over 240 per-cent, from $5.5 billion to $18.7 billion. At the sametime, domestic production increased by less than 16percent, meaning that an industry which had only25 percent of its domestic consumption served byimports in 1975 had imports accounting for half ofall consumption in 1984.8 Nearly 30 percent of allcotton fiber poundage used by Americans for appareland textiles is imported. For synthetic garments andfabrics the situation is less severe, with under 7 per-cent of all manmade fiber poundage consumed inthe United States coming from imports. Domesticexports of apparel have expanded since the mid-1970s, but still vary greatly with respect to fashiontrends and the value of the dollar.
Important in any analysis of apparel trade deficitsis to distinguish between imports coming from ac-tual foreign companies, products assembled abroadby U.S. firms, products manufactured by U.S. firmsin joint venture with foreign firms, and productsmade by subcontractors catering to the orders oflarge U.S. retailers. The role of Item 807 productsin increasing the apparel trade deficit also requiresanalysis.9
‘lbId,SInternati~na] ~dles’ Garment workers’ Union Research Department,
based on data from the US. Bureau of the Census, the U.S. Depart-ment of Agriculture, the US. Bureau of Labor Statistics, and the Tex-tile Economic Bureau, 1986.
gltem 807 of the Tariff Schedules of the (-Jnited States (TSUS) Stij)U-
lates that if a product made of U.S. materials is manufactured abroadand then “reimported” into the United States, a tariff is to be paid ononly the value added to that product during overseas production (seebox B).
The Export Market
While the key to domestic marketing is to recog-nize the growth areas within an overall static mar-ket, the key to international marketing is to increaseexport sophistication, recognize the areas in whichU.S. technological comparative advantage exists, andadjust to the growing trade regulations that limit mar-ket entry. It is markets overseas that will experiencethe most future growth.
Even though growth is primarily in developing na-tions, the opportunities for expanded export mar-keting may exist primarily among other developedcountries. 10 To meet this reality, it is argued that com-panies should seek out international multilingualmarketeers to spearhead export drives. U.S. com-panies currently lack marketing staffs that are schooledin the trading knowledge and cultural affinity nec-essary to work effectively in a foreign environmentof currency exchange and red tape.
Some see substantial opportunities, at least forsome products, in the developing world as well.According to Du Pent Vice President David Barnes,for fibers and fiber products the export opportuni-ties are broader than the already industrialized world:
The world market is three times the size of thepresent United States market and still growing . . .
Consumption of fiber products ranges around theworld from about five pounds per person in the de-veloping countries to more than a dozen times thatin this country today. This not only suggests thebreadth of growth opportunities but the diversity ofmarkets we will have to serve if we want to be com-petitive on world levels.
American exports are competitive today becauseof the scale efficiency, higher capacity utilization, andhigher productivity of American fiber and fabric pro-ducers as well as the downstream industries. Thesefundamental advantages will persist even when suchtemporary advantages as currency relationships anddiffering oil prices disappear or diminish over time.
Our industry is learning how to export to Europethe Far East and the developing countries. The U.S.has more than 20 percent of the world’s textile ca-pacity but has historically enjoyed only about 7 per-
IOJack C. Werner, “A Time to Lead: A Challenge and Opportunityfor the U.S. Textile Industry,” speech to annual meeting of the Boardof Trustees of the Institute of Textile Technology, Charlottesville, VA,May 2, 1984, pp. 17-18.
83
cent of the export business. I believe we’re going tomove steadily towards a better balance.11
Barnes goes on to say that such progress in ex-panding exports is necessary to encourage higherlevels of capital investment and to support the con-tinuation of innovative research and development(R&D) activities needed to keep U.S. goods at thetop of the competitive heap. ’2
The current U.S. export market for textiles andtheir end uses is quite small. Changes in worldwidetrade barriers for textiles will be essential if marketsare to open up for U.S. export. That event is the mostcritical. But technological and quality advantages,as well as substantially more aggressive overseasmarketing—perhaps through overseas productionfacilities—are also necessary preconditions.
Trade Regulations and Protectionism
The Response of Developing Nations.—De-veloping nations want the growing textile and ap-parel markets within their countries for themselves.A major response is to protect their own domesticmarkets with a variety of trade and marketing reg-ulations. A 1984 survey of 21 major developing coun-tries by the Secretariat of the General Agreement onTrade and Tariffs (GATT) found that average tariffsthrough the early 1980s ranged from 25 to 75 per-cent. 13
In many individual instances, however, tariffs aremuch higher than these averages. In Brazil, for ex-ample, duties of up to 205 percent of c.i.f. value—“carriage insurance freight” value, which includesshipping and insurance costs—are imposed on im-ports of woven fabrics; on those of manmade fiber;woven apparel, and accessories; and on a numberof other products. On top of this duty, Brazil placesa variety of taxes and charges that further increasethe cost to importers. The GATT Secretariat also re-ported that in addition to tariffs, the majority of thesenations maintained quantitative restrictions on im-ports, ranging from quotas to outright import pro-hibitions.
In general, restrictions are more stringent in down-stream sectors of the industry, with apparel importsmuch more heavily protected by nontariff measuresthan textiles. The emphasis is on downstream sec-tors, since protection of the upstream and midstreamsectors potentially creates competitive disadvantagesfor downstream apparel producers by raising theprice of their inputs. Many developing nations havecircumvented this problem by rebating duties paidon upstream imports used to produce export com-modities, or by establishing “export process zones”in which fiber and fabric needed to produce exportcommodities are imported duty free.
A severe challenge faces U.S. producers of textileproducts as they search for niches in the global tex-tile market, because import restrictions have prolifer-ated so extensively in recent years. Besides tariffs,restrictive activities include embargoes, quotas, li-censing requirements, prior authorization rules, andborder taxes.
Self-Imposed Barriers. -Many countries ban tex-tile imports altogether. Bolivia prohibits the impor-tation of 19 categories of textile products, amongwhich are carpets and blankets; cotton outerwearfor men and boys; cotton outerwear for women, girls,and infants; men’s and boys’ underwear; underwearfor women, girls, and infants; and continuous acrylicfiber yarns.14 Egypt bans the importation of wovenfabrics of eight categories of textile products, amongwhich are carded or combed cotton; bed, table, andkitchen linens; and raw flax.15 Afghanistan bans theimportation of handbags, cotton yarn, rugs of artifi-cial fibers and wool, turban cloth of silk, and travel-ing blankets and rugs.16
The Korean Federation of Textile Industry statedin 1981 that many developing countries “are grad-ually eliminating themselves as textile markets.”17
In 1983, the Textile Minister of Sri Lanka announceda total ban on textile imports, stating: “Now we donot need foreign competition any more.”18
I IDa~,ld B~rn~s, h’)ce Fresldent, Textile Fibers Department, E.! d~lpen t de Nemours & co., ]nc , Textile /ndL/.stu outlook, Apr 25, 1980,
p 6.~~lbld , p 7I ~Ho~,ell, et a! , op cit., p 29
I~I_J ,S Department of commerce} International Trade .Adminlstratlon,,,Office of Textiles and Apparel, “Foreign Regulations Affecting U.S. Tex-tile/Apparel Exports, ” April 1986, p 20
l~lhid , p 78‘OIbid,, p, 1I ~Korean Federation of Textil(~ industry, Textile /ndu.$(v’ l’fl Korea
198(]/81, p ]8.l~Ho\$,el], et al . op (’It., p ~~~

84
In other nations, textiles are taxed at prohibitiverates. In Burma, for example, items such as ready-made wool clothes, silk cloth, and artificial silk aretaxable at 60 percent; jute carpet is taxable at 50 per-cent; and lace synthetic textiles, textiles made ofcombed cotton, imitation leather, and noncottonblankets are all taxable at 40 percent.19
South Korea maintains a strict system of importcontrols with a “Negative List. ” Imports, which mustreceive prior approval of an appropriate ministry,are allowed on a controlled basis, and only if theyare for prompt use to manufacture goods that willbe sold in the export market.
Taiwan virtually bans apparel imports, and strictlylimits imports of textile fiber. But it does allow im-ports of textiles if they are for prompt use in the man-ufacturing of goods sold in the export market.
Colombia maintains restrictions amounting to ade facto ban on most textile and apparel imports.The government requires the granting of importlicenses for about 65 percent of its textile and ap-parel tariff categories. As of early 1985, no licenseswere being granted. Surcharges are imposed onthose products whose importation is allowed in or-der to finance a 6.5 percent textile export incentivefor Colombian products.
Government Subsidies. —Beyond import restric-tions, foreign trade is also influenced by the substan-tial government subsidies that many nations providetheir textile industries. A principal source of capitalfor the South Korean textile industry during its yearsof rapid growth, for example, was the preferentialallocation of credit by government-dominated banksat below-market interest rates. The wide range ofexport subsidies and incentives given by the Koreangovernment to its textile exporters was estimated bythe World Bank to have a subsidy value of 27 per-cent in 1972.20 In addition, Korea has frequently beencharged by other countries with dumping their tex-tile products21—a charge which the Koreans haveeven occasionally acknowledged themselves. Dump-ing, however, is by no means unique to South Korea.
‘gIbid.Zoworld Bank, industrial Po/;cy and Development in Korea, Staff pa-
per No. 236, 1975, cited in Howell, et al., op. cit., p. 50.zlJapan Economjc JoUrna/, Apr. 26, 1983, and JTN, November 1984,
cited in Howell, et al,, op. cit., p. 53.
Taiwan offers its textile exporters financial bene-fits, including tax breaks. Between 1974 and 1979alone, the Taiwanese Government provided $300million in loans to textile producers, enabling themto “modernize their equipment and improve prod-uct quality.”22 Most of Taiwan’s textile and apparelmills have been located in three special export proc-essing zones, where manufacturers can import duty-free production equipment as well as intermediategoods and raw materials used for production ofexports—a system that enables the nation to pro-tect its upstream and midstream home industrieswithout jeopardizing its downstream manufacturedgoods.
Hong Kong also utilizes a customs free zone, andthus takes advantage of the large stocks of upstreamand midstream textile products available on the in-ternational market. Its strategy is to concentrate pro-duction on the downstream apparel end of the in-dustry.
In 1979, China decided to promote textiles as aleading economic priority .23 As a result of this deci-sion, the Chinese textile industry received specialloans from the central government; greater alloca-tions of resources from the provinces, municipalities,and autonomous regions; and was given priority withrespect to raw materials, transport, and electricpower. New textile facilities are concentrated in spe-cial economic zones and receive special tax and reg-ulatory treatment, designed to encourage foreign in-vestment and the manufacture of exports.24
Also significant in China is a government export-stimulus program designed to manipulate the ex-change rate, and an allocation of foreign exchangeearnings to enterprises engaged in exports. This in-volved the implementation of a dual exchange ratesystem, designed to discourage imports and stimu-late exports between 1981 and the beginning of1985. While the official exchange rate was 2.0 ren-mibi (RMB) to the dollar, enterprises remitting dol-lars earned in foreign trade to the Bank received 2.8RMB per dollar, and were required to pay 2.8 RMBfor dollars used in purchasing imports.25 The policy
zz~re china weekly, Oct. 7, 1979, cited in Howell, et d., Op. cit., p. 55.231 bid., p, 64,241 bid,, p. 69.‘sIbid., pp. 75-77.

85
has been described officially by the Chinese in thefollowing ways:
The internal settlement rate is used only to subsi-dize exports and it cannot be called an exchange rate.It is a means of subsidizing our export industry .. .26
China intends to use the profits it makes on im-ports to subsidize exporting enterprises mak[ing] aloss.27
Other nations with emerging export markets intextiles are also using import restrictions and exportsubsidies to promote their textile industries. Amongthem is Thailand, which combines stringent importprotection with liberal grants of export subsidies.
The Indonesian Government utilizes an export in-centive system to pay compensatory money to ex-porters. Imports of cloth with batik motifs, sarongs,and cambric made with cotton yarn are banned al-together; imports of cotton weaving yarn are re-stricted to specified approved importers or govern-ment agencies; and all imports are subject tosurcharges ranging as high as 200 percent.28 Thevalue of the Indonesian export subsidy on textileswas between 16 and 43 percent as of 1978.29 In addi-tion, a 1978 devaluation of the national currency hada dramatically positive impact on Indonesian tex-tile trade.
In Pakistan, where more than half of the coun-try’s total industrial employment is engaged in tex-tiles and apparel, the government made its foreignexchange reserves available to finance acquisitionof foreign production equipment; these imports wereexempt from customs duty. In addition, the govern-ment encouraged domestic banks to provide loansto producers, which could finance the acquisitionof domestically made textile machinery. Tax incen-tives were provided for the installation of modernproduction equipment.30
In the Philippines, government import protectioninvolves quantitative restrictions and a high nomi-nal tariff level—a 100 percent tariff on garment im-
ports. At the same time, it permits duty-free importof textiles used to produce clothing for export. Gar-ment producers are eligible for investment incen-tives. With the help of the World Bank, the govern-ment in 1979 launched a major program to expandand modernize textile production. The Central Bankof the Philippines provided credit at below-marketinterest rates to finance the production of textilegoods for export.31 Of eight sample textile firms, thevalue of investment incentives to textile producerswas between 2.9 and 10.6 percent of total sales.
Although allowing their textile industries to escapefrom the economic realities of competition has in-creased the foreign exchange standing of some de-veloping countries, clearly improving prospects forindustrial employment at home} the effects of suchrestrictions and subsidies have not been completelypositive. Industries being created and expanding un-der heavy government protection have in manycountries grown beyond their capacity to sell theirproducts. Nations have incurred substantial foreignexchange debts to pay for modernized plant andequipment. And some have argued that high levelsof protection have been responsible for a de-empha-sis on efforts to improve efficiency and productivity.
Response of Japan and the European Eco-nomic Community.—Another part of the explana-tion for the unprecedented penetration of textileimports into the United States has to do with the re-sponse of the European Economic Community (EEC)and Japan to the emergence of a global textile mar-ket and increased competition, especially from de-veloping nations. The EEC restricts imports pursuantto bilateral agreements negotiated under the Multi-Fiber Agreement (MFA) (see box A). Since 1983, re-strictions by the EEC have become significantlystronger. Japan restricts imports more informally—byplacing pressure on the distribution network, andby concluding a variety of non-MFA bilateral restraintagreements. Internally, Japan has implemented sig-nificant restraints on competition in order to preventa “shakeout” of producing firms, as has the EEC withsynthetic fiber production. In addition, EEC govern-ments have provided significant amounts of finan-cial aid to their textile and apparel producers.
In the United States, import restrictions pursuantto MFA have been used, but the system is viewed
~llbid,, pp. 101-1 OS

as quite lax (see discussion below). Available evi-dence suggests that the EEC’s adoption of a morerestrictive regime under the MFA as of 1983, cou-pled with Japan’s continuing restrictions, has hadthe effect of channeling developing nation textile ex-ports into the U.S. market.
Since the implementation of new EEC restrictionsin 1983, for example, many of the major suppliers,such as Taiwan, Korea, and Indonesia, have experi-enced a significant drop in export volume to the EEC,and a dramatic rise in the volume shipped to theUnited States. Whereas U.S. imports per capita forthe textile sector from developing nations between1980 and 1984 rose from $5.09 to $10,11, EEC im-
ports declined from $11.82 to $8.30. The apparel sec-tor changes were even more dramatic. In the UnitedStates, the per-capita value of imports from devel-oping nations more than doubled, from $25,56 to$56.63; in the EEC, it declined from $22.38 to $18.47(see table 13).
WhiIe Japan and the EEC had a positive net tradebalance between 1980 and 1984 in the textile sec-tor, the United States—which began positively in1980—developed a sharply negative net balance. Inthe apparel sector, while all three experienced a neg-ative net trade balance, only the U.S. experienceda sharp deterioration in its balance. Japan main-tained roughly the same percentage of overall im-

87
Table 13.—U.S. and EEC Imports From DevelopingCountries Dollars Per Capita, 1980-84
Textiles Clothing
EEC Us . EEC U.S.
1980 . . . . . . . . . . . . . . . . . .$11.82 $5.09 $22.38 $25.561981 . . . . . . . . . . . . . . . . . 8.55 5.83 20.98 29.191982 . . . . . . . . . . . . . . . . . . 7.95 4.99 19.25 30.731983 . . . . . . . . . . . . . . . . . . 7.86 5.97 17.55 35.611984 . . . . . . . . . . . . . . . . . . 8.30 10.11 18.47 56.63SOURCE The Textile and Apparel Trade Crisis, based on international Monetary
Fund data
ports from developing nations between 1980 and1984. During the same period, however the EECcountries imported a lower percentage of textiles andapparel from the developing world, while the UnitedStates imported a sharply higher percentage (see ta-ble 14)
U.S. Response
The impact of significant import protection andexport subsidies on the textile industries of devel-oping countries has been severe. Domestic produc-tion has been threatened through increased competi-tion within home markets, and increased restrictionsand competition in international markets. Not sur-prisingly, textile companies in industrialized nations,as well as the governments of those nations, haveresponded to the threats that they face from noneco-nomic competition in textile trade.
Factors Behind Varying Costs
Differences in Wages. -Employees of U.S. tex-tile and apparel firms pay substantially higher wagesthan firms in Asia and Latin America, although in-dustry wages are among the lowest in U.S. manu-facturing. At $6.71 per hour in 1985, a full-time U.S.textile mill products worker earned just under $14,000per year; in contrast, his/her average hourly earn-
ings were more than 33 times higher than a com-parable Chinese worker earning 20 cents per hour.At $5.73 per hour in 1985, a full-time U.S. apparelworker earned just under $12,000 per year, but thatwas approximately 28 times more than the compara-ble Chinese worker earning 20 cents per hour.
Although direct wage comparisons between a cen-trally planned economy and the U.S. economy areclearly inexact, the fact remains that labor costs forU.S. textile and apparel enterprises—indeed, for en-terprises from the entire developed world—are high-er than those for firms operating in developing coun-tries, This is accentuated by differences in benefitsand working conditions, largely a function of the factthat many developing nations lack standards thatprotect against long hours, long weeks, safety, andhealth hazards. Some even use child labor. Accord-ing to the International Ladies’ Garment Workers’Union (ILGWU), in 1984, “labor compensation in thedeveloping and newly industrialized countries rangedfrom 2 to 25 percent of the U.S.”32
Some U.S. companies attempt to lower their la-bor input costs by establishing production facilitiesoverseas. Especially in the apparel industry, wherelabor intensity continues to be very high, produc-tion and/or assembly overseas may provide someeconomic advantages for individual companies. Infact, such a strategy is encouraged through U.S. pub-lic policy by the “807” rule, which places a tariff noton all textile and apparel imports, but only on thevalue added by specific operations performed out-side the United States—in other words, a U.S. firmcan send fabric to a low cost production facility over-seas, substantially reducing input costs. However,there are risks associated with such movement. Po-
~zLetter from f)r. James Parrott, Assistant to General SecretaW-
Treasurer Jay Mazur, International Ladies’ Garment Workers’ Union,to OTA, Mar, 31, 1986, p, 4,
Table 14.– Percent Share of Exports of Textiles and Clothing From DevelopingCountries by Major Developed Country Markets, 1980-84
EEC U.S. Japan EEC U.S. Japan EEC U.S. Japan
1980 . . . . . . . . . . . . . . 26.80/o 9.90/0 6.4°/0 40.1% 40.0% 5.8% 34.1% 26.7% 6.4%
1981 .., . . . . . . . . . . . 18.2 10.5 5.9 33.9 39.9 6.7 27.1 27,2 6.41982 . . . . . . . . . . . . . . 18.4 9.9 32.2 43.9 7.0 26.4 29.6 6.71983. , . . . . . . . . . . . . 16.8 11.0 4.9 27.8 48.5 5.1 23.1 32.5 5.01984 . . . . . . . . . . . . . . 14.8 15.5 5.6 23.4 61.8 5.8 19.8 42.5 5.7SOURCE The Textile and Apparel Trade Crisis, based on data from GATT

88
Photo credit: Copyright (©) 1986, 1987 by Bobbin International, Inc.All rights resewed
This cutting and shipping facility is located in Hialeah,FL. Cut goods are delivered to two plants in Costa Ricafor sewing, and then reimported to the United States.
litical instability in many low wage countries canmake production unreliable.
Exchange Rate Fluctuations. -During 1983 and1984, the dollar rose in value more than 30 percentagainst the currencies of other industrial countries.This appreciation, according to many analysts, wasno different than a 30 percent tax on exports anda resulting 30 percent cost advantage for imports.33
The 1983-84 appreciation came on top of an appreci-ation of equal magnitude in the previous 3-yearperiod. Weighing the currency average of the 20 na-tions with whom we most heavily trade in textilessuggests that the value of the textile dollar in thesecond quarter of 1986 was almost another 30 per-cent above 1984; of course, the recent decline in thedollar’s value against other currencies has sincehelped to reconcile this difference.
However, while the appreciation of the dollarclearly exacerbated the textile trade problems of theearly and mid-1980s, many experts are quick to em-phasize that massive shifts in worldwide textile tradepatterns are the result of other factors as well, Forexample, whereas imports from the DominicanRepublic and Haiti increased by 40 and 28 percent,respectively, between 1981 and 1984, the exchangerate did not change at all. Large increases in import
‘33 AFL.C]O~{’30th Anniversa~ Report of the AFL-CIO Executive Coun-
cil, 16th Convention,” Oct. 28, 1985, p. 156.
penetration by other major textile supplying coun-tries are also recorded, despite far less substantialchanges in bilateral exchange rates. According to ananalyst at ILGWU, the dollar’s rise did contribute tosizable percentage import increases from a numberof nations in the EEC, but EEC countries accountedfor only 2.2 percent of all apparel imports in 1984.34
Policy Reactions
At the government level, the United States, theEEC, and Japan have all acted to limit the growthof imports from developing nations. But while theUnited States has taken a number of steps to pro-tect its domestic enterprises, U.S. markets are muchmore open than those in Europe and Japan. A studyby European economists concluded that:
While all governments adopted protectionistic pol-icies for their textile mill products industries duringthe 1960s and 1970s, the United States governmentseemed to be the only one that did not couple thispolicy with one of the other policy types. Instead, itpreferred to let internal, partially protected marketforces bring about adjustment. It persistently opposedthe concept of direct government intervention of thetypes undertaken by its counterparts in Europe andin the Asia Pacific Region .35
As a result, the United States is absorbing a largeshare of the world’s textile and apparel exports, atthe expense of its domestic industry. Moreover, atrade imbalance has resulted from the fact that U.S.exports of textile and apparel are not significant. Atthe peak of apparel exports in 1980, for example,they did not amount to more than 3 percent of do-mestic apparel production.
U.S. Enforcement of Existing Trade Laws.—Ineffective administration of the Multi-Fiber Arrange-ment (MFA) is one reason given for the unprece-dented surges in imports and harm to the domestictextile and apparel industry. Despite the existenceof the MFA, which contemplated a 6 percent annualgrowth rate for imports, imports (in terms of squareyard equivalents) grew 30 percent in 1983 and 32percent in 1984, before falling to 7 percent in 1985;1986 growth rose again, however, to over 17 per-cent. Legislation before Congress to require more
aqLetter from Dr. James Parrott, Op. cit , P. 3.s5Toyne, et al., pp. 178-179
89
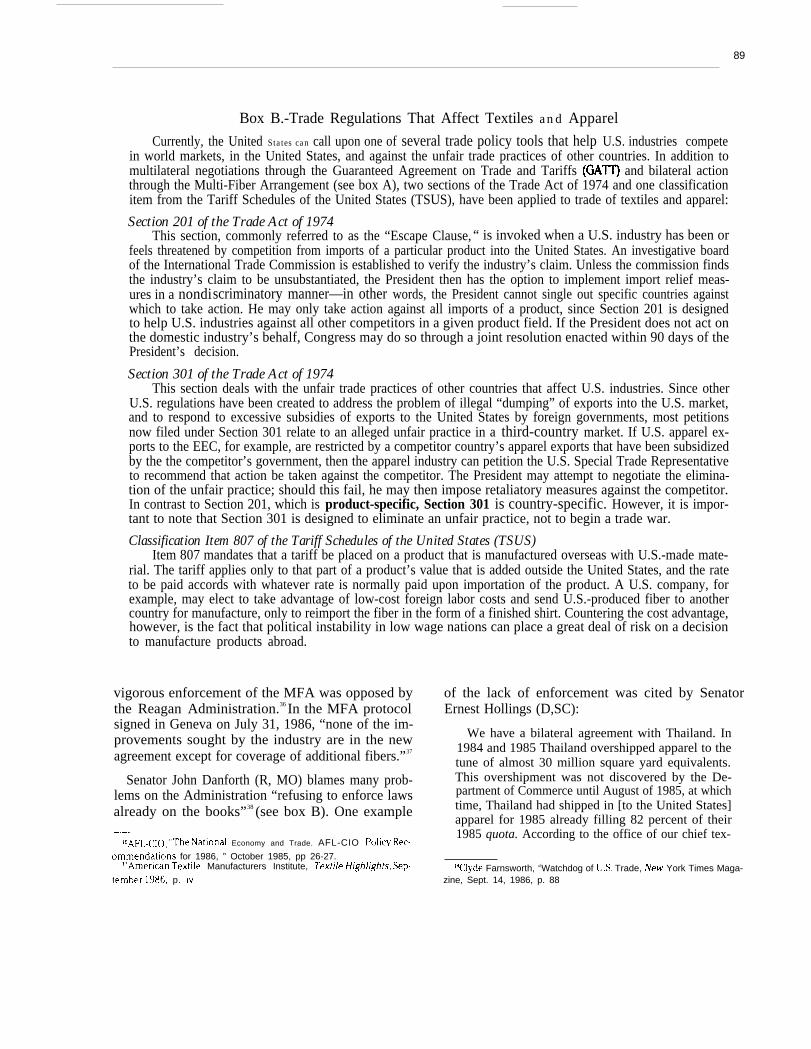
Box B.-Trade Regulations That Affect Textiles and Apparel
Currently, the United States can call upon one of several trade policy tools that help U.S. industries competein world markets, in the United States, and against the unfair trade practices of other countries. In addition tomultilateral negotiations through the Guaranteed Agreement on Trade and Tariffs (GAIT) and bilateral actionthrough the Multi-Fiber Arrangement (see box A), two sections of the Trade Act of 1974 and one classificationitem from the Tariff Schedules of the United States (TSUS), have been applied to trade of textiles and apparel:
Section 201 of the Trade Act of 1974This section, commonly referred to as the “Escape Clause, “ is invoked when a U.S. industry has been or
feels threatened by competition from imports of a particular product into the United States. An investigative boardof the International Trade Commission is established to verify the industry’s claim. Unless the commission findsthe industry’s claim to be unsubstantiated, the President then has the option to implement import relief meas-ures in a nondiscriminatory manner—in other words, the President cannot single out specific countries againstwhich to take action. He may only take action against all imports of a product, since Section 201 is designedto help U.S. industries against all other competitors in a given product field. If the President does not act onthe domestic industry’s behalf, Congress may do so through a joint resolution enacted within 90 days of thePresident’s decision.
Section 301 of the Trade Act of 1974This section deals with the unfair trade practices of other countries that affect U.S. industries. Since other
U.S. regulations have been created to address the problem of illegal “dumping” of exports into the U.S. market,and to respond to excessive subsidies of exports to the United States by foreign governments, most petitionsnow filed under Section 301 relate to an alleged unfair practice in a third-country market. If U.S. apparel ex-ports to the EEC, for example, are restricted by a competitor country’s apparel exports that have been subsidizedby the the competitor’s government, then the apparel industry can petition the U.S. Special Trade Representativeto recommend that action be taken against the competitor. The President may attempt to negotiate the elimina-tion of the unfair practice; should this fail, he may then impose retaliatory measures against the competitor.In contrast to Section 201, which is product-specific, Section 301 is country-specific. However, it is impor-tant to note that Section 301 is designed to eliminate an unfair practice, not to begin a trade war.
Classification Item 807 of the Tariff Schedules of the United States (TSUS)Item 807 mandates that a tariff be placed on a product that is manufactured overseas with U.S.-made mate-
rial. The tariff applies only to that part of a product’s value that is added outside the United States, and the rateto be paid accords with whatever rate is normally paid upon importation of the product. A U.S. company, forexample, may elect to take advantage of low-cost foreign labor costs and send U.S.-produced fiber to anothercountry for manufacture, only to reimport the fiber in the form of a finished shirt. Countering the cost advantage,however, is the fact that political instability in low wage nations can place a great deal of risk on a decisionto manufacture products abroad.
vigorous enforcement of the MFA was opposed bythe Reagan Administration.36 In the MFA protocolsigned in Geneva on July 31, 1986, “none of the im-provements sought by the industry are in the newagreement except for coverage of additional fibers.”37
Senator John Danforth (R, MO) blames many prob-lems on the Administration “refusing to enforce lawsalready on the books”38 (see box B). One example
MAFL.C]O, ‘rThe Nationa] Economy and Trade. AFL-CIO Policy Rec-
ommendations for 1986, ” October 1985, pp 26-27.~lAmerican Textile Manufacturers Institute, Textile Highlights, SeP-
tember 1986, p. IV
of the lack of enforcement was cited by SenatorErnest Hollings (D,SC):
We have a bilateral agreement with Thailand. In1984 and 1985 Thailand overshipped apparel to thetune of almost 30 million square yard equivalents.This overshipment was not discovered by the De-partment of Commerce until August of 1985, at whichtime, Thailand had shipped in [to the United States]apparel for 1985 already filling 82 percent of their1985 quota. According to the office of our chief tex-
%lyde Farnsworth, ‘(Watchdog of U.S. Trade, New York Times Maga-zine, Sept. 14, 1986, p. 88

90
tile negotiator, Ambassador Carlisle, “Frankly, thesystem did not work . . . It was inadequate. ” That isan understatement. After discovering illegal massiveshipments in mid-August, apparel shipments fromThailand were finally embargoed on October 8th. Ne-gotiations with the Thais were begun. These nego-tiations are now completed and I understand fromAmbassador Carlisle’s office that the embargo willbe lifted one month prematurely on December lst.This will enable the U.S. importers to get their goodsout of embargo in time for the Christmas season. Theembargo will be lifted even though the Thais over-shipped in 1984 and are probably going to be overtheir quota in 1985.
Further, the overshipments for 1984 and 1985 willnot be charged against Thailand’s 1986 quota.39
President Reagan made the following two pledgesto the textile community as he vetoed HR-1562, thecongressional effort to protect the apparel, textile,copper, and shoe industries:
I am directing Secretary of the Treasury Baker, asChairman Pro Tempore of the Economic Policy Coun-cil, to investigate the import levels of textiles and ap-parel to determine if these imports have exceededthose limits agreed upon in international negotia-tions. I have directed that he report back to me within60 days and recommend changes in existing admin-istrative and enforcement procedures, if necessary . . .
Also, I am directing the Office of the United StatesTrade Representative to most aggressively renegoti-ate the Multi-Fiber Arrangement (MFA) on terms noless favorable than present. Our trading partnersmust be put on notice that we will not allow unfairtrading practices to continue.40
Nonetheless, many examples of poor enforcementhave been cited by critics of existing procedures:
● Even though the Treasury Department had re-quested additional customs personnel to beposted abroad to stop textile fraud, the State De-partment refused to authorize the additionalagents. Currently, only about 2 percent of whatcomes into the United States is actually in-spected by customs officials. This is despite thefact that customs agents usually earn two tothree times their salary in tariffs collected.41
~qstatement of Senator Ernest Hollings on Thailand, NOV. 13, 1985.qclveto message of President Ronald Reagan, HR-1562, Dec. 17, 198641(&Orge Wlno, Chief Economist, American Textile Manufacturers in-
stitute, interview of Nov. 18, 1986.
●
●
●
The
Even though the textile industry has filed a ser-ies of countervailing duty cases against severalcountries, the Administration negotiated agree-ments to suspend most of those duties,There have been many charges of dumping oftextiles against foreign nations. The producersof nylon impression fabric, for example, havelong been concerned that imported impressionfabric from Japan has been and is being dumpedin the United States.42
Transshipments to evade quotas abound. Ac-cording to testimony received by the HouseGovernment Operations Committee, garmentsthat come into the United States under the 807agreement often involve fraudulent transship-ments. In review of U.S.-Canada free trade ne-gotiations, the House Committee on Ways andMeans in 1986 invited written comments, Manyof these comments expressed fear of Canada be-coming a “pass through” point for the Far Eastif a free-trade arrangement were negotiated.43
There has been some experience in the pastwith Canada being a transshipment point fortextile products from the developing world. Af-ter the 1978 antidumping duty order, NisseiSangyo of Japan apparently began transshippingbroad woven nylon impression fabric throughCanada. 44 The executive director of the Neck-wear Association of America expressed his in-dustry’s concern with a free-trade agreement:
. . . our industry is very concerned about the po-tential of transshipments through Canada. Becauseof the low unit value of neckwear, especially fromthe Far East, the elimination of duties will maketransshipment through Canada particularly attrac-tive. We are not sanguine about enforcement asCustoms is not able to cope with its present re-sponsibilities. 45
executive director of the Work Glove Manufac-turers Association also argued against a free-tradeagreement, saying that:
.lZstatement of Bomont Industries, Inc., cited in “written comments
on Proposed U.S.-Canada Free Trade Agreement, ” Subcommittee onTrade, Committee on Ways and Means, U.S. House of Representatives,April 1986.
43’’ Written Comments on United States-Canada Free Trade Negotia-tions, ” op. cit., p. 346.
qtstatement of Bomont Industries, Inc., op. cit., P. 69.45”ln Opposition to Proposed U.S.-Canada Free Trade Agreement,”
Statement of Gerald Andersen, Executive Director, Neckwear Associa-tion of America, cited in “Written Comments on United States-CanadaFree Trade Negotiations,” op. cit., p. 215.
91
Such an arrangement could not only take advan-tage of duty-free access to the U.S. market, but per-mit the circumvention of quota arrangements aswell. The U.S. Customs Service already has itshands full with its regular import monitoring pro-grams. Recent personnel cutbacks will make it im-possible for Customs to guard effectively againsttransshipments.46
● The House Commerce Committee published aninvestigative report on textile fraud in April of1985, and found widespread quota violation andevasion. Examples included shipments of youngmen’s sportswear from Hong Kong, China, andthe Philippines for nearly 5 years by means offalse documents; 1,700 dozen pairs of Taiwanesejeans falsely claimed as having been manufac-tured in South Africa; a Taiwanese importersewing shirts and skirts together and enteringalmost 10,000 dozen of them as dresses, whichhad a lower duty rate and a larger quota. Theimporter admitted the items were separated af-ter entry and sold as shirts and skirts.
Recent Legislative Proposals.-The relative“openness” of U.S. markets has become a point ofextensive controversy. In 1986, Congress passed leg-islation designed to shield the industry from imports,but the Reagan Administration vetoed this bill (HR-1562). The administration argued the economic ad-vantages of market equilibration and the consumeradvantages of lower cost textiles and apparel. Sena-tor Danforth, former chairman of the Senate FinanceCommittee’s trade subcommittee, argued that othercountries should either reduce their barriers to tradeor face equivalent restrictions. He would use the $360billion annual American market for both a carrot anda stick.47
The 100th Congress is likely to vote on anothertextile import bill, which has been introduced by Se-nators Hollings and Strom Thurmond (R, SC); Rep-resentative Butler Derrick (D, SC) has introduced thesame bill in the house. This legislation (S-549 andHR-1154) calls for a general import ceiling, whichis designed to limit import growth to the growth ofthe U.S. domestic market. The bill’s sponsors con-
4b”ln OpposNion to the Proposed U, S.-Canada Free Trade Agreement, ”Statement of Craig Schulz, Executive Director, Work Glove Manufac-turers Association, Chicago, cited in “written Comments on UnitedStates-Canada Free Trade Negotiations,” op. cit., p 344.
4~Clyde Farnsworth, OP. cit.
tend that they have addressed several of the prob-lems cited by opponents of the bill vetoed by thePresident:
●
●
●
●
quotas would be set against imports from allcountries, rather than against those from the de-veloping world only;upper limits against specific countries would notbe mandatory, but the President would havethe authority to set individual quotas within theoverall amount;quotas would not require rollbacks of foreignshipments; andforeign suppliers would be compensated for lostsales. 48
Private Sector Reactions
An Increase in Capital Investment. -Chapter3 indicated that U.S. producers have invested heavilyin more advanced production equipment, enablingthem to offset the lower wage levels of developingnations.49 Some of the more labor-intensive aspectsof apparel production have been moved offshore.Similar developments are occurring in the EEC andJapan. In all three geographic markets, fiber and fab-ric producers are establishing vertical links withdownstream apparel producers. In the United States,textile mill product manufacturers reinvested be-tween 80 and 85 percent of their retained cash flowbetween 1975 and 1985, spending an average of $1.4billion per year on new plant and equipment. Thisaverage rose to $1.8 billion between 1984 and 1986.50
U.S. firms have invested in such innovations asrobotics, computer control systems, and shuttlelesslooms in order to improve productivity. Reflectingthese investments, U.S. textile mill producers’ pro-ductivity levels increased at more than twice the levelof all U.S. manufacturing industries in the decadefrom 1975 to 1985—5.6 percent v. 2.4 percent peryear. Productivity levels in the United States werealso substantially higher than in nations overseasin 1981. Increased productivity, however, has beenaccompanied by decreased profitability; as a result,
48’’ Compromise Textile Bill Being Readied,” The Washington Post,Feb. 13, 1987, p. F1
‘gThis paragraph is based Iargelv on Howell, et al., op. cit., pP. 1 f17’-
110 and 172-173.so~exfjle /f/~/rli~/?K, Op. cit., p. 2 I.

92
marketing strategy in this area becomes fused withtechnological development and capital investment.
The “Buy American” Program.-The industryhas worked actively to make U.S. consumers moreaware of U.S.-made goods. This is largely being donethrough the “Crafted With Pride in U. S. A.” campaign.Labels and tickets are displayed prominently on U. S.-made apparel, and there is an extensive advertis-ing campaign. Such major retailers as Wal-Mart andJ.C. Penney are featuring U.S. products.51
The Crafted With Pride in U.S.A. Council hasnearly 400 members, Their statement of purpose issimple and direct:
The Crafted With Pride in U.S.A. Council is a com-mitted force of United States cotton growers, labororganizations, fabric distributes, and manufacturersof manmade fibers, fabric, apparel, and home fashions,whose mission is to convince consumers, retailers,and apparel manufacturers of the value of purchas-ing and promoting U.S.-made products.52
Surveys by Roper Reports have consistently founda “Made in the U. S. A.” label to be regarded as “su-perior or fairly good” by 93 to 95 percent of thosequeried. Gallup polls show that Americans regardU.S.-made clothing to be “as good or better thanoverseas” by 75 percent of Americans.53
Since 1984, manufacturers have been required bylaw to label domestically-made products with thewords “Made in the U. S. A.” To persuade consumersto look for those labels before making a purchase,Council members pledged $40 million in advertis-ing over a 3-year period, They engaged such starsas Bob Hope, Diahann Carroll, Sally Struthers, O.J.Simpson, Lynda Carter, and Sammy Davis, Jr., toappear on television commercials on their behalf.
Encouraging news about the Crafted With Prideprogram came from a spring 1986 experiment byHanover House Industries, a national catalog house.Two versions of a catalog were mailed to consumers.Four million catalogs were sent in all, In one ver-sion, 56 specific items carried a special “Made in theU. S. A.” logo. Sales returns from consumers receiv-ing this catalog were 10 percent greater than the
‘sl-BrUC~St~-keS, “@tting competitive,” Nationaf ./ournal, June T, 1986,P. 1365,
SZArnerlCan Textile Manufacturers Institute, advertisement in TimeMagazine, September 1986.
531 bid
identical catalog without the “Made in the U. S. A.”logo.54
The Auburn University Apparel Sourcing Fair ofFebruary 1986 is just one example of efforts under-way to promote domestic apparel products. This, theNation’s first sourcing fair, brought State manufac-turers and retailers together from Alabama and sur-rounding States. Participating retailers repeatedlystated that they were looking for partners, in the formof manufacturers who could fit their products withinthe structure of retail lines, and of contractors whocould take on more of the burden of production bysupplying the complete package.55
Trade and the U.S. Consumer
Competitive advantage of textile and apparel ex-ports stems primarily from lower wages in export-ing nations, which reduce production costs in bothmaterial manufacture and assembly. But even thoughit may cost producers only one-fifth as much to maketheir goods abroad, the U.S. consumer may not nec-essarily enjoy a similar reduction in price. There isoften a large disparity between production cost andthe selling price in the United States, with much ofthe difference ending up in the hands of foreign anddomestic shippers, wholesalers, and retailers.56
The extent to which consumers benefit from in-expensive imports is obviously a controversial issue,one that is difficult to resolve given the lack of appro-priate data. However, figure 15 suggests that changesin domestic apparel prices are not closely correlatedwith changes in import prices; this can work bothfor and against the interests of consumers. The priceof imports appears to have increased much moresharply than average domestic sales prices from 1977to 1982, and has roughly followed domestic pricessince then. Presumably, three factors cause the in-crease in import prices:
1. a shift in mix, not captured properly in the defla-tor series that compute price indices;
2. real increases in production prices abroad, dueto rising wages and other factors; and
541bid.55Joyce Santora, “Retailers Reasses Domestic Sourcing,” Bobbin Maga-
zine, April 1986, p. 63,sbMurray Finley, president, Amalgamated Clothing and Textile Work-
ers’ Union, cited in AFL-C1O News, NOV. 23, 1985, p. 1.

93
1.1
1.05
1
0.95
0.8
0.75
0.7
0.65
Figure 15.—Price lndices for Clothing (1982=1)
.
/
/ 0
J 1 I1970 1972 1974 1976 1978 1980 1982 1984
Year
— D o m e s t i c p u r c h a s e s - - - I m p o r t sSOURCE Office of Technology Assessment, 1987; based on data provided by the U S Department of Commerce and U S Department of Labor
3. shifts in the way markups are captured here andabroad.
The Fiber, Fabric & Apparel Coalition has usedCommerce Department figures to show that manyimported blouses, shorts, and shirts actually costmore than their U.S.-produced counterparts.57 JohnMeinert, president of the Clothing ManufacturersAssociation, testified in 1985 before a subcommit-tee of the House Ways and Means Committee aboutthe financial advantages of clothing imports benefit-ing retailers, not consumers. He told the subcom-mittee:
It is no secret that a big attraction of cheaper im-ported goods is the exceptional mark-up available to
STAFL-C1O News, Nov. 23, 1985, P. 1.
be taken by retailers. It is argued that such low-basepricing is passed on to American consumers throughlower prices. That argument has been demonstratedincorrect. The high margins available on these im-ported goods are used to benefit those who importthem, as the differential is retained by the importer-seller. The American consumer does not receivelower prices, and we know this to be true from ourinformation about companies which compete in ourretail markets.58
In addition, some have charged that in those caseswhere the consumer does benefit from a lower price
SsTeStimOny Of John Meinert regarding HR-1 562, “The Textile and
Apparel Trade Enforcement Act of 1985,” Subcommittee on Trade, Com-mittee on Ways and Means, US. House of Representatives, July 15,1985, p. 2.

94
on imported apparel, it is often the result of mislead-ing “discount” prices. Some retailers may mark upthe price of their imported garments to match theprice of a similar U.S. garment, only to immediatelydiscount the initially advertised cost. In this way, theretailer can still make a profit far above that whichwould be earned from sale of the U.S. garment, whilegaining the added marketing advantage brought byadvertising a discount.
When Allied Stores president Thomas Macioce wasasked by Women Wear Daily whether retailers arereally buying markups when they purchase imports,his response was: “Sure, we are indeed buying bet-ter markup, but that’s our job. We would be delightedto buy only American-made goods if we could makethe same type of markup.”59
A study by the Amalgamated Clothing and Tex-tile Workers’ Union (ACTWU)60 found three foreign-made shirts, from Taiwan, Guyana, and Colombia,
59TestimOny of SOI Chaikin, President, International Ladies’ GarmentWorkers’ Union, Subcommittee on International Trade, Committee onFinance, U.S. Senate, July 15, 1985, p. 13.
~OAF’L.GIIO News, Oct. 5, 1985, P. 1.
with the same $18 price tag as an identical U.S.-madeshirt. Similarly, a comparison of the costs of men’slong-sleeve broadcloth shirts found the following.The wholesale cost of the U.S.-made shirt was $6.50,and a 100 percent retailer mark-up yielded a $13retail price. The cost of the same shirt made in Ko-rea was $4.25, including labor, shipping, and tariffs;a 206 percent markup was added to this shirt, or$8.75, so that the Korean shirt sold for $13 as well.For every imported shirt sold at the retail price, theretailer made an additional $2.25. On an annual ba-sis, ACTWU found that the retailer imported 250,000dozen shirts, for a total additional profit of $6.75 mil-lion. A study by the International Ladies’ GarmentWorkers’ Union indicates that “markups on importedgarments typically range from 200 to 400 percent.”61
It is important to note that many U.S. retailers dis-pute this analysis strongly. They argue that mark-ups on inexpensive imports are not nearly largeenough to deny the U.S. consumer the benefits oflow-cost imported apparel.
GILetter from Dr. James Parrott to OTA, op. Cit., p. 5.
THE ADEQUACY OF DOMESTIC INNOVATION AND CAPITAL INVESTMENT
Research and Development
While improved R&D efforts alone will not ensurea healthy domestic industry, they are clearly neces-sary, There are indications that U.S. efforts in R&Drelated to textiles and apparel may not be adequate,given the high social returns that could be enjoyedfrom a healthy domestic industry. Even more im-portant than the development of new inventions,however, is the creation of an economic and man-agement environment that allows American entre-preneurs to make money from investment in inno-vation. This requires capital and, in many cases,more patience in waiting for returns than has beentypical of U.S. investors operating under existingmacroeconomic policy.
It is ironic that while many U.S. economic prob-lems have resulted from an inability of U.S. inves-tors to capitalize on the benefits of innovations de-veloped in the United States—most of the basic
inventions behind semiconductors were developedin the United States, for example, yet it is the Japa-nese who seem to be succeeding in turning theseinventions into profits—in the textile and apparelindustries the reverse may be happening. Much ofthe technology that has made the U.S. textile industryamong the most productive in the world has beenpurchased overseas.
Large companies do carry out some of their ownR&D, especially the chemical companies that pro-duce synthetic fibers. But in an industry that to dateis still made up largely of small, family-owned com-panies, it is difficult to amass the capital for majortechnological research. Most of the R&D for textileequipment is done by the equipment manufacturers,but little in the way of major innovation has comein recent years. The electronics and other relatedindustries are, of course, engaged in R&D relatedto computers and electronics, that can be adaptedto the textile and apparel industry.

95
Even though the new surge in investment in plantand equipment preceded the flood of imports, it isthe decade-long explosion of textile and apparel im-ports into the United States that has served as thegreatest impetus for restructuring. Many look towardpromoting U.S. technological developments as a ma-jor response to the threat of those imports. All agreethat at a minimum, the United States must keep pacewith technological developments that are constantlyoccurring throughout global markets.
R&D is critically needed to improve technology,but also to make strides in organizational structure,marketing, and public policy. As the chemical in-dustry becomes increasingly aligned with the tex-tile industry, some segments—most notably fibers—have experienced greater R&D efforts. The U.S.chemical industry has long understood the need foraggressive R&D efforts, accounting for 9 percent ofU.S. manufacturing shipments but approximately 15percent of all industrial R&D and 35 percent of allresearch funded by industry.62 Du Pent chairmanE.G. Jefferson credits this level of R&D with assist-ing the chemical industry in achieving a $9 billiontrade surplus and generating 36 percent of worldchemical sales in 1983.63 Fiber research at Du Penthas given way to process technology advances, re-sponsible for more than doubling productivity inmanmade fibers during the past decade.64
Rapid technology transfer around the world is asimple fact of life. It takes the form of exported prod-ucts, industrial processes, and the skills needed toapply technical ideas. Driving costs down throughinvestment in nonproprietary technology cannot pre-vent long-term, continued growth of imports.65 Butmany argue that it can provide an important short-run technological and competitive edge.
There is evidence that the pace of technologicaldiffusion is increasing. Technological innovations arethemselves a major contributor to the trend. On-lineinternational data networks allow global access tocurrent information in some areas, while new tele-
~lRemarks of E G Jefferson, Chairman, Du Pent, at the 40th Anniver-sary of the Society. of F]ber Science and Technology, Tokyo, May 11,1984, p 5
‘]lt)idb~lbld , p 6~Speter Harding, Kurt Salmon Associates, Inc , “Quick Response in
the Soft Goods Pipeline, ” synopsis of speech given at the Knitted Tex-tile Assoclat]on Retail Relations W’orkshop, Dec 6, 1985, p. 1,
communications increasingly permit tighter globalintegration of production and even R&D. More gen-erally, declining communications and transportationcosts have contributed to an increase in the knowl-edge and skill base outside the United States, a de-velopment visible in the rapid growth of trained engi-neers, financial experts, and managers in developingnations. The result is a more competitive economicenvironment, in which the life cycle of any producthas been dramatically shortened.
Capital Investment: An EconomicNecessity
Textile executives realize that their companiesmust modernize if they are to survive. But with ma-chinery turnover and the period of renewal of ma-chinery growing more rapid from year to year, de-mand for capital investment funds can be staggering.The degree of technological change in the industryrequires constant investments to keep up with com-petition. Some of the larger textile firms, like Burling-ton Industries, have been investing as much as 85percent of their cash flow in new machinery.66 TheU.S. textile industry has spent $1 billion or more ayear on machinery for two decades, and is the mostproductive in the world.67
One of the costs of the scale of investment neededfor new technology may be the increasing concen-tration of the industry, as only large and financiallystrong corporations may deem themselves able toabsorb the costs. In weaving, for example, the 10largest companies in the United States account for85 percent of all purchases in new machinery. It isunclear if weaker firms are able to afford the con-stant renewal process demanded by rapidly chang-ing technology. While substantial capital investmentsare essential to achieving a competitive edge in pro-ductivity, clearly relating these investments to short-run profitability is often difficult. An example of thiswas explained by a Du Pent Vice-President in thefollowing way:
Our Cooper River plant near Charleston, S. C., isour newest, largest and most productive facility forthe manufacture of polyester staple and filament. It
GfIw.E, Schmidt, op. cit.~TFiber, Fabric & ,.4pparel Coalition for Trade, “Fiber, Textile and AP-
parei Imports: Myths and Realities, ” Mar 14, 1985,

started up in 1976. The mid-1980s cost to duplicatethis large modern facility will be almost double ouroriginal mid-1970s investment. We’re talking abouthundreds of millions of dollars. A return of 15 per-cent would be the minimum required to invest insuch a plant in this decade. Prices for polyester willneed to rise more than cost escalation to make rein-vestment in polyester staple an attractive businessopportunity for us in 1985.
Clearly, that’s a formidable challenge when pricesare not even at the point of meeting our past costincreases. 68
Investment requirements in the industry are byno means spread evenly among sectors. The tradi-tional apparel sectors have only 14 percent of theoverall fixed assets of the industry. The weaving,knitting, and yarn sectors, on the other hand, have55 percent of the overall fixed assets. Within fabricproduction, cotton fabric manufacture requires thehighest fixed assets.
MD. K, Barnes, Vice president, Textile Fibers Department, DU pent,“The Fibers Outlook,” report to American Apparel Manufacturers Asso-ciation Seminar, New York, Dec 10, 1980, p. 9,
While there appears to be a commitment to mod-ernization, the degree of investment depends largelyon the current economic situation. Purchases of shut-tleless looms and ring spindle frames fluctuate heav-ily with the economic climate. This, however, hasnot been true with open-end spinning machines.And while U.S. firms are investing substantially, theratio of new technology to older technology is stillrather small, and some industry experts question thelong-term commitment of manufacturers to make thenecessary investments.
Due to a high gross value of fixed assets as wellas a high turnover of machinery, the weaving seg-ments of the textile industry alone account for 29percent of total yearly expenditures on new plantand equipment. Apparel firms spend much less onnew equipment, largely because there have histori-cally been few technologies designed to increase theproductivity of apparel manufacturing. As chapters2 and 3 indicated, however, this situation maychange rapidly in the near future, through the adop-tion of Quick Response technologies; U.S. apparelfirms may soon have to make significant new invest-ments in production equipment in order to remaincompetitive in world markets.
IMPLICATIONS FOR THE TEXTILE AND APPAREL LABOR FORCE
Advancing technology and the internationalizationof production are revolutionizing employment in theU.S. textile and apparel industry. The total numberof jobs continues to decline, while new jobs are fre-quently created in unconventional categories.
The textile industry throughout U.S. history hasbeen, and in the 1980s continues to be, a major in-dustrial employer. The U.S. textile industry complex—consisting of fiber, textile, and apparel production—is the Nation’s largest nondurable goods manufac-turer, and employs one in every nine manufactur-ing workers, or just under 2 million in 1985. Apparelis the largest employer, with 1.1 million employees.Textile mill products follow with 700,000 workers.In the fiber industry, man-made fiber production em-ploys 64,000 individuals. The textile machinery in-dustry, a durable goods sector, employs 18,000.
With 2 million people employed in all 50 States,and 1983 wages totaling nearly $25 billion—$1 1.1
billion for textile wages, and $13.6 billion for wagesin the apparel sector—major changes in the num-ber and types of textile jobs affect more than justspecific individuals and companies. Many workerslive in communities in which a textile plant is theonly major local employer; job losses in these areasaffect both States and localities, since both suffer fromthe depletion of economic activity and the loss oftax revenue caused by high unemployment. Clearly,suchomy
effects may propagate through the U.S. econ-as well.
Employment Changes Withinthe Industry
Sectoral Shifts
In apparel, labor-intensive operations still predom-inate in the industry, and job declines are largelydue to import penetration. The apparel sector em-

97
ploys 48 percent of the total industry, and has thelowest wages—27 percent lower than manufactur-ing as a whole, and 13 percent lower than those em-ployed in textile mill products manufacture. It alsohas the greatest percentage of women employees ofall manufacturing sectors, 81 percent. In addition,apparel has the largest percentage of production em-ployees to total employees, 82 to 84 percent v. 70percent for all manufacturing. Apparel is also thesector of the industry where job loss is most severe,especially low wage production jobs filled by sub-stantial numbers of women and minorities.
In textile mill products, automation and adoptionof new, capital-intensive technology have signifi-cantly reduced the number of jobs available. Indeed,there are many examples of modernization elimi-nating jobs. Since 1978, when Burlington began itsmodernization program, it has reduced its work forceby at least 10,000. Stevens has spent more than $480million on its capital program since 1978, and, likeBurlington, has trimmed 10,000 people from itspayroll.
But modernization does not always lead to jobloss—especially if new plant and equipment can beused to expand markets. When Burlington replaced700 Draper fly shuttle looms in its Shannon, Geor-gia, plant with approximately 450 Ruti air-jet loomsin 1979, none of the 1,300 employees there werelaid off, even though production speeds increasedtwo- to three-fold. At the Burlington weaving plantin Vinton, Virginia, when a $25 million moderniza-tion program in 1981 converted operations to shut-tleless weaving, the 600-employee work force wasfully maintained.69
Within the textile mill products sector, the distri-bution of employment varies considerably amongproduction processes. The weaving sectors, for ex-ample, account for 16 percent of all employees inthe total textile industry. Knitting and hosiery ac-count for 10 percent of industry-wide employment,the yarn industries 5.5 percent, and the carpet in-dustries 2.4 percent. All other sectors employ lessthan 2 percent; 2 percent, however, still represents50,000 jobs.
The only industry sector claiming new job crea-tion was retail trade, which gained nearly 250,000
bc’Tex[lle U’eek, Aug. 10, 1981, p 6
jobs between 1970 and 1985. This was largely dueto the sharp rise in personal spending on apparelafter 1970, which necessitated more activity at theretail end of the industry. However, a gain in retailjobs in the service sector of the economy may nothelp stop the erosion of the U.S. industrial base, espe-cially when an increasing share of what U.S. con-sumers purchase has been manufactured overseas.
In addition, these jobs provide substantially loweraverage wages than textile manufacturing jobs—themselves low-paying by U.S. industrial standards,although not by international standards for textileand apparel workers. Average 1985 hourly earningsin apparel retail trade were $5.29, in contrast to $5.73for apparel manufacturing, $6.71 for textile mill prod-ucts manufacturing, and $7.98 for textile machinerymanufacturing. In the newer manmade fiber indus-try, however, wage rates were significantly higher,with average hourly wages at $11.37.70 These com-pare to an average hourly rate in 1980 for all man-ufacturing of $8.55.
Job Movement to OverseasProduction Facilities
Much employment has been lost as textile com-panies transfer some of their production overseas.
WIU ,s, D~partment of Labor, Bureau of Labor Statistics, ~@OJ’~e~(
and Earnings, March 1986, pp. 91-93
Photo credit Copyright (©) 1986, 1987 by Bobbin International, Inc.All rights reserved
This apparel manufacturing facility, located in Barbadosand used by U.S. firms under the 807 role, employs alow wage workforce. The lower labor costs that a U.S.firm pays to these workers often influence the choice
to move labor-intensive tasks offshore.

98
While such activities may deplete a region’s eco-nomic base and tax revenue due to the loss of jobs,some analysts claim that this is balanced by the factthat overall corporate costs are minimized whenlabor-intensive tasks, such as sewing, are performedin low labor cost countries. However, as the levelof technology and the capital intensity of productiongrows, wage rates may decrease in importance. Theeducation of the people at the machines and in thecontrol rooms may gain increasing priority,
It is important to note that the United States is notalone in suffering employment losses in the textileand apparel industry. Job loss has occurred through-out the developed world—for example, 53 percentin the Netherlands and 37 percent in the UnitedKingdom within the last decade. At the same time,employment in developing nations is gaining signif-icantly—l 11 percent in South Korea and 194 per-cent in Mauritius, for example.71
Impact on Individuals and Families
The textile industry is an important employer ofwomen and minorities. While manufacturing over-all had an employment profile that was 32 percentfemale in 1980, it was 51 percent for the textile in-dustry, Whereas minorities held 11 percent of man-ufacturing jobs overall in 1980, they represented 20percent of textile manufacturing employment.
The industry is also a major employer of immi-grants, and immigrants feel dependent on these jobs.For example, in testimony before the CongressionalTextile Caucus, one Chinese member of the ILGWUsaid that except for the garment shops, there werealmost no places outside Chinatown where a non-English speaking immigrant could find work in NewYork City.72
In may cases, there may be little or no severancepay to displaced workers. Because of the low levelof wages, it is unlikely that a displaced individualhas much in the way of savings.
The damage that job loss brings to individuals andfamilies can be significant; problems are exacerbated
Tl]nternationa] ~~r Organization, “Social and Labor Practices of Mul-
tinational Enterprises in the Textile Clothing and Footwear Industries,”cited in Dai/y Labor Report, Bureau of National Affairs, Jan. 3, 1985,p. A-6,
~lAFL.CIO News, Sept. 21, 1985, p. 5.
for two main reasons. First of all, many of the work-ers affected are minorities, women, and/or thosewith little education and few other job skills. Sec-ond, they often live in areas that are highly depen-dent on textile and apparel employment. Displacementmay mean not only the uprooting of individuals andfamilies, but of whole communities and regions aswell.
Impact on Communities and Regionsof the Country
The geographical distribution of textile employ-ment makes the industry, both as an employer andas a tax-paying resident, critical to several regionsof the United States. As of 1980, 46 percent of U.S.textile employees were in the Southeast, and 17 per-cent in the Midwest; the latter were predominantlyagricultural workers involved with cotton and woolfibers. North Carolina houses over 250,000 textilejobs, more than any other State. South Carolina, NewYork, and Texas each have between 200,000 and250,000 people employed. Georgia and Pennsylvaniarely on the textile industry to supply between150,000 and 200,000 jobs. And there are between100,000 and 150,000 textile jobs in Alabama, Cali-fornia, Tennessee, and Mississippi (see figure 16).
Jobs are divided about half and half between smalltowns and metropolitan areas. In South Carolina, forexample, approximately 60 percent of all textile andapparel jobs are in places with fewer than 2,500 peo-ple. But textile and apparel businesses are also sig-nificant employers in New York, Philadelphia, LosAngeles, and Miami.
It is conservatively estimated that for every U.S.textile worker who loses a job, another Americanworker is also put out of work (see tables in the ex-ecutive summary). These connections are particu-larly vivid when entire communities are affected byloss of a major plant.
Indeed, in geographic areas where textile employ-ment is particularly concentrated, such as the South-east, plant closings and job loss can mean economicdevastation to an entire town or region, The declinein employment has been the greatest in North Caro-lina, South Carolina, New York, and Pennsylvania.The region of the country most directly affected isthe Southeast-North Carolina, South Carolina, Geor-

99
Figure 16.— The Geographic Distribution of Textile Employment by State
‘ 1 (
Number of jobs
❑ 200,000-250,000
SOURCE Off Ice of Technology Assessment, 1987
gia, Tennessee, Alabama, Florida, Kentucky, andMississippi–where 33,400 jobs were lost in 1985,bringing textile employment 17 percent below its1951 level. According to the Bureau of Labor Statis-tics, 32.2 percent of the region’s total manufactur-ing employment in 1951 was in the textile indus-try. By 1985, it had shrunk to only 13.5 percent.73
An example of economic devastation to a smalltextile town is Ware Shoals, South Carolina—a townbuilt by Riegel Textile Corp. nearly 80 years ago,and now the location of a closed textile plant. Ware
‘~~.S;Department of Labor, Bureau of Labor Statistics, cited In AFL-CIO News, July 19, 1986, p, 3.
Shoals has a skilled work force, an abundant watersupply, an adequate waste treatment facility, andnearly 1 million square feet of manufacturing spaceunder one roof. The town has access to rail and ma-jor highways, and to airports in Greenville andGreenwood.
Ware Shoals also has severe unemployment mort-gage foreclosures, town emigration, empty stores,and an eroding tax base. Sixty percent of its busi-nesses are gone, including all of its clothing stores.More than 50 percent of the town’s property taxeswere lost by the exodus of Riegel alone, not to speakof wiping out the lion’s share of business licensetaxes. Younger people are moving out, leaving be-

100
hind an elderly population that faces a severe cut- where textile manufacturers have closed plants overback in public services due to the town’s eroded tax the past four years. Invariably, the closing of a plantbase. Beyond the tragedy of Ware Shoals is the fact is followed by an exodus of small businesses and athat this is not an uncommon occurrence: virtual collapse of local economies.74
The story of what happened in Ware Shoals is fairly llR1ldolph A. Pyatt, Jr., “Factory’s Shutdown Tears Fabric of Smalltypical of what has occurred in many communities Company Town,” The Washington Post, Oct. 14, 1985, pp. 1, 26-27.