chapter 9 roadway congestion, deficiencies, & …€¦ · • traffic interruptions (traffic...
TRANSCRIPT

Chapter 9
Roadway Congestion, Deficiencies, &
Recommended Projects The Travel Demand Forecast Model (TDFM or “model”), as described in chapter 8 was
used to identify roadway capacity constraints and deficiencies within the Jackson MPO.
The results were provided for three scenarios:
1. Base year 2014 (“current” year)
2. Base year 2014 with committed projects (as listed in 2017 – 2020 TIP)
3. Horizon year 2045 with committed projects (as listed in 2017 – 2020 TIP)
� Also referred to as a “No Future Build” or “No Build” scenario
The results of the TDFM use a scale based on the current or anticipated volume of the
roadway, over a 24-hour period, and the allotted capacity of the roadway. The results
provided are called “Volume to Capacity ratios (VOC).” Once calculated, the VOCs are
assigned to a “Level of Service (LOS)” categorical system, using a letter grade (A-F). A
description and visual representation of the LOS grades used for the Jackson MPO are
provided in the below:
Traditionally, there are additional “build option” scenarios to address
capacity limitations on the road network. R2PC opted to not use these
scenarios for the Jackson 2045 Long-Range Transportation Plan.
8-1

Factors that may affect the LOS include the following:
• Free-flow speed
• Freedom to maneuver
• Traffic interruptions (traffic signals, stop signs, merging, etc.)
• Commercial traffic volume
• Safety
The information was developed using a computer travel demand modeling and
forecasting software, based on socio-economic data, for each scenario. For the 2045
Long-Range Transportation Plan, the acceptable capacity of each link in the model
roadway network is defined as the capacity at LOS D.
In addition to identifying the roadway capacity constraints, the Jackson MPO and
members of the public were provided opportunities to review the model results and
address the issues through testing, evaluation, and final selection of projects to include
in the plan. Other projects that have the potential to modify the existing roadway
capacity were solicited for input and testing. This allows the Jackson MPO to identify
potential impacts associated with capacity changes on the existing road system. Due to
the limited amount of congested corridors over a daily period in the area, no capacity
projects were tested or selected outside of those already listed in the most current
Transportation Improvement Plan (TIP).
MDOT and R2PC staff provided additional roadways with moderate VOC (0.60 to 0.70)
to the various committees and for public comment, since there were limited roadways
within the Jackson MPO area that exhibited high capacity restrictions on a daily level.
By showing roadways with moderate VOC levels, the public was able to identify
potential traffic congestion problem areas that may need attention in future construction
programs. The locations may also illustrate operational type issues on a roadway
segment, especially during peak travel periods, such as short on/off ramps, intersection
queuing, etc.
Base Year 2014 Results
The Base Year 2014 scenario analysis looked at existing conditions of the area-wide
transportation system as it was in 2014. The 2014 year was chosen because of the
demographic and employment data source availability, along with maintaining
consistency with available local agency land use or master plans. Recent roadway
projects and socio-economic data changes are not included in this scenario.
8-2

Capacity constraints for the plan were analyzed for roadways that exhibited traffic
volumes approaching or exceeding the acceptable roadway capacities. The ten highest
congested roadways, based on VOC for the Base Year 2014 are listed below:
1. SB M-106 (Cooper St) between W Monroe St & E North St
2. NB M-106 (Cooper St) between E North St & W Monroe St
3. WB I-94 between M-106 (Cooper St) & North Leg US-127 interchanges
4. SB US-127 BR / EB M-50 Off Ramp to E McDevitt Ave / Brooklyn Rd
5. EB & WB E High St between S Elm Ave & Losey Ave
6. EB & WB M-50 (Brooklyn Rd) between Plymouth Rd & M-50 (Brooklyn Rd) –
Austin Rd intersection
7. EB I-94 between north & south legs of US-127
8. WB I-94 between South Leg US-127 & M-106 (Cooper St) interchanges
9. EB & WB M-50 (Brooklyn Rd) between M-124 (Wamplers Lake Rd) & M-50 –
Brooklyn Rd split
10. NB & SB US-127 BR / EB & WB M-50 (N West Ave) under I-94
A detailed table of the ten highest VOC roadway corridors, along with maps, for the
Base Year 2014 results can be found in Figures 2A – 2C later in the chapter.
Base Year 2014 with Committed Projects Results
As with the Base Year 2014 scenario, the Base Year 2014 with Committed Projects
results analyzed the traffic volumes in relation to the road capacity on the roadways with
completion of the 2017 – 2020 TIP projects. Typically, this scenario will include an
analysis of roadways and corridors with Capacity Improvement projects that aim to
increase capacity on roadways within the area. In many cases, roadways that are
expected to see a reduction in the number of thru-lanes, and thus a lower total roadway
capacity, are included in this scenario. The main purpose of this is to ensure that traffic
is not negatively affected by the reduction in capacity or that the reduction will create a
deficient corridor (VOC > 1.00). Only roadways that are designated as a part of the
federal-aid network are eligible for inclusion in the 2045 plan project lists.
The ten highest congested roadways, based on VOC for the Base Year 2045 with
Committed Projects scenario are listed below:
1. SB M-106 (Cooper St) between W Monroe Ave & E North St
2. NB US-127 BR / WB M-50 (Louis Glick Hwy) between N Mechanic St & N
Blackstone St
3. NB M-106 (Cooper St) between E North St & W Monroe Ave
8-3

4. WB Washington Ave (turn back to city) between S Mechanic St & S Blackstone
St
5. SB US-127 BR / EB M-50 (Louis Glick Hwy) between N Blackstone St & N
Mechanic St
6. WB I-94 between M-106 (Cooper St) & North Leg US-127 interchanges
7. SB US-127 / EB M-50 Off Ramp to E McDevitt Ave / Brooklyn Rd
8. EB Washington Ave (turn back to city) between S Blackstone St & S Mechanic St
9. E High St between S Elm Ave & Losey Ave
10. EB & WB M-50 (Brooklyn Rd) between Plymouth Rd & M-50 (Brooklyn Rd) –
Austin Rd intersection
A detailed table of the ten highest VOC roadway corridors, along with maps, for the
Base Year 2014 with Committed Projects results can be found in Figures 3A – 3C later
in the chapter.
The capacity projects that were used in the model and were listed in 2017 – 2020 TIP,
along with other large projects from the TIP are included in the table on the next page:
8-4

Project
ID
Fiscal
YearProject Name Project Limits
Responsible Road
Agency
Capacity Change
TypeProject Description Total Cost
Length
(Miles)
1 2017M-60 (Spring Arbor
Rd)
Chapel Rd to
Emerson RdMDOT
Capacity
ImprovementResurface and widen to include Center Left-Turn Lane $11,205,000.00 1.60
2 2018 I-94Over JAIL RR and
Grand RiverMDOT
Capacity
Improvement Replace and realign bridge structure $30,639,000.00 0.40
3 2018 I-94M-60 to
Sargent RdMDOT
Capacity
ImprovementComplete roadway reconstruction from Lansing Avenue to Elm Road $71,868,000.00 8.90
4 2018 I-94M-106 (Cooper St)
over I-94MDOT
Capacity
Improvement Replace bridge structure and associated road work $19,765,000.00 0.20
5 2021 I-94 At Elm Ave MDOTCapacity
ImprovementReconstruct interchange $20,149,000.00 1.50
$153,626,000.00 12.60
Proposed Capacity Improvement Projects
TOTAL:
8-5

Horizon Year 2045 with Committed Projects Results
The Horizon Year 2045 with Committed Projects scenario includes projects listed in the
2017 – 2020 TIP, along with the projected changes in socio-economic data through
2045. Traffic volume results were also compared to the expected capacities for the road
system in 2045. The ten highest congested roadways, based on VOC, that are
expected in Horizon Year 2045 are listed below:
1. SB M-106 (Cooper St) between W Monroe St & E North St
2. SB M-106 (Cooper Rd) between M-106 (Bunkerhill Rd) – Cooper Rd split &
Parnall Rd
3. NB M-106 (Cooper St) between E North St & W Monroe St
4. WB I-94 between south & north legs of US-127
5. SB US-127 BR / EB M-50 (Louis Glick Hwy) between N Blackstone St and N
Mechanic St
6. WB M-50 (Brooklyn Rd) between Plymouth Rd & M-50 (Brooklyn Rd) – Austin
Rd intersection
7. WB Washington Ave (turn back to city) between S Mechanic St & S Blackstone
St
8. WB M-50 (Brooklyn Rd) between M-50 – Brooklyn Rd split & M-124 (Wamplers
Lake Rd)
9. NB US-127 BR / WB M-50 (Louis Glick Hwy) between N Mechanic St & N
Blackstone St
10. EB M-50 (Brooklyn Rd) between M-124 (Wamplers Lake Rd) & M-50 –
Brooklyn Rd split
A detailed table of the ten highest VOC roadway corridors, along with maps, for the
Horizon Year 2045 with Committed Projects results can be found in Figures 4A – 4C
later in the chapter.
Recommended Capacity Improvement Projects
After the completion of the travel demand modeling process and identification of
congested or deficient corridors, it is necessary to determine what action should be
taken to address the current and anticipated future traffic on the road network. With the
knowledge of available federal, state, and local revenues for the 27 year span of the
plan, the various JACTS Committees and Region 2 Planning Commission, considered
local community concerns and issues, which determines what improvements should be
programmed in the coming years. The specific projects identified include I-94 trunkline
projects on State highways under the jurisdiction of MDOT.
8-6

The plan provides a vision of Jackson County’s transportation system through the year
2045. The transportation improvements included in the first years (2017-2020) of the
plan are considered firm commitments by the implementing jurisdictions. This means
that funding has been assigned to the specific improvement which will be completed
unless unforeseen circumstances prevent completion. The remaining years of the plan
(2021 – 2045) are a vision of how the transportation system may develop based on the
existing land use and zoning plans of the City of Jackson, villages, and townships of
Jackson County, and the current forecast of available transportation revenues. The
transportation improvements in the “out” years (2021-2045) of the Plan represent
current priorities for the future. The transportation plan is updated every five years and
the priorities listed for the later years may change as conditions warrant.
Recommendations
There are a limited number of congested corridors and no corridors that are currently, or
are expected to be, deficient within the Jackson MPO. R2PC’s focus is to maintain the
current transportation system. This means that although capacity projects are valid and
important for the future of the MPO transportation system, they are viewed to be a lower
priority than projects aimed at preserving the existing system. Preservation projects
generally include reconstruction and resurfacing of the road within the existing right-of-
way. In most cases, the lane configuration of the roadway remains the same. These
types of projects are not required to be identified within this plan.
The projects listed in the table on page 4 and illustrated in Figures 3A and 3B, identifies
the proposed capacity improvement projects that would increase the capacity on a
roadway. Examples of capacity improvement projects may be the addition of traffic
lanes, turn lanes, merge-weave lanes, or the construction of a new roadway. Also, only
those roadways located on the federal-aid roadway network are eligible for inclusion in
the plan’s project list. The total estimated investment for the State trunkline Capacity
Improvement projects totals $153.6 million.
I-94 Modernization
Many of the projects currently programmed in the most current TIP consider several
transportation issues outside the focus of the TDFM, in particular the modernization of
the Interstate 94 corridor.
MDOT completed the Final Environmental Impact Statement and Final Section 4(f)
Evaluation for the I-94 Freeway Modernization Study in November, 2006. The Record of
Decision (ROD) was approved by the Federal Highway Administration in March, 2007.
The Re-Evaluation was approved by the Federal Highway Administration in September,
2013, and again in December, 2017. The project study area included a nine-mile
8-7

segment of I-94 extending from the M-60 interchange to just east of the Sargent Road
interchange. The project area encompassed approximately nine miles of existing
highway, eight interchanges, local frontage roads adjacent to I-94, and 18 distinct bridge
structures at 14 locations. The purpose of the project is to (1) improve the deteriorating
condition of existing bridges and road segments consistent with an overall corridor
improvement plan, (2) improve travel efficiency and roadway capacity in the I-94
corridor by replacing existing road segments, interchanges, and bridges with modern
facilities designed to accommodate projected year 2045 traffic volumes, and (3) to
improve motorist safety.
The following information is informed by the 2045 Long Range Transportation Plan and
MDOT staff. The original priorities were determined at the time of the I-94 Modernization
Study (2007) in cooperation with an ad hoc committee consisting of local
representatives and MDOT experts evaluating the phasing strategy of the elements
based on: 1) Safety; 2) Operations; 3) Condition; 4) Under-clearance; and 5) Funding
Availability.
With a projected cost of $409 million (in 2005-year dollars), sufficient funding is not
available for construction of the entire 9-mile corridor. Instead, MDOT will phase project
implementation over the next 5 to 40 years based on conditions, traffic volume needs,
congestion, funding availability, and safety needs along the corridor based upon the
purpose of and need for the I-94 Modernization Study. The Preferred Alternative for
reconstructing the I-94 corridor has been divided into three separate phases as follows:
Phase 1: Sargent Road interchange reconstruction, including the closure of the I-94 BL
interchange, and the replacement of the Hawkins Road and Dettman Road bridge
overpasses. The bridge replacements are complete, and the Sargent Road interchange
was completed in 2013.
Phase 2: Cooper Street interchange reconstruction and other road improvements as
necessary will also be performed. The replacement and widening of the I-94 bridge over
the Grand River to accommodate potential future widening of I-94. I-94 will be
reconstructed from west of Cooper Street to east of Cooper Street. The remainder of I-
94 between M-60 and Sargent road will receive a major rehabilitation. Replacement of
the M-60 interchange, Lansing Avenue bridge overpass, and the replacement of the
Elm Road interchange are also included in this phase. The estimated time frame for the
start and completion of this phase is 0 - 10 years. Funding for this phase has been
identified. See Figures 5A – 5D at the end of this chapter.
8-8

Phase 3: US-127/M-50-West Avenue interchange reconstruction; reconstruct the
northern portion of the Sargent Road interchange; US-127 South interchange
reconstruction; Airport Road interchange reconstruction; widen I-94 between the two
legs of US-127; widen I-94 from US-127 South to Sargent Road; widen I-94 from US-
127/M-50/West Avenue to M-60. The estimated start and completion time-period for this
phase is 25 to 40 years out. No funding for this phase has been identified.
These unfunded improvements are technically not a part of the JACTS 2045 Long
Range Transportation Plan, but instead are included to highlight some of the unmet
needs that could be addressed with increased revenues. As future funding is identified
and becomes available for implementing the findings included in the I-94 Modernization
Study, the JACTS committees will continue to assist MDOT in programming the projects
to address the capacity and safety improvements outlined in the study.
8-9

Figure 2A
8-10

Figure 2B
8-11

Figure 2C
8-12

Figure 3A
8-13

Figure 3B
8-14

Figure 3C
8-15
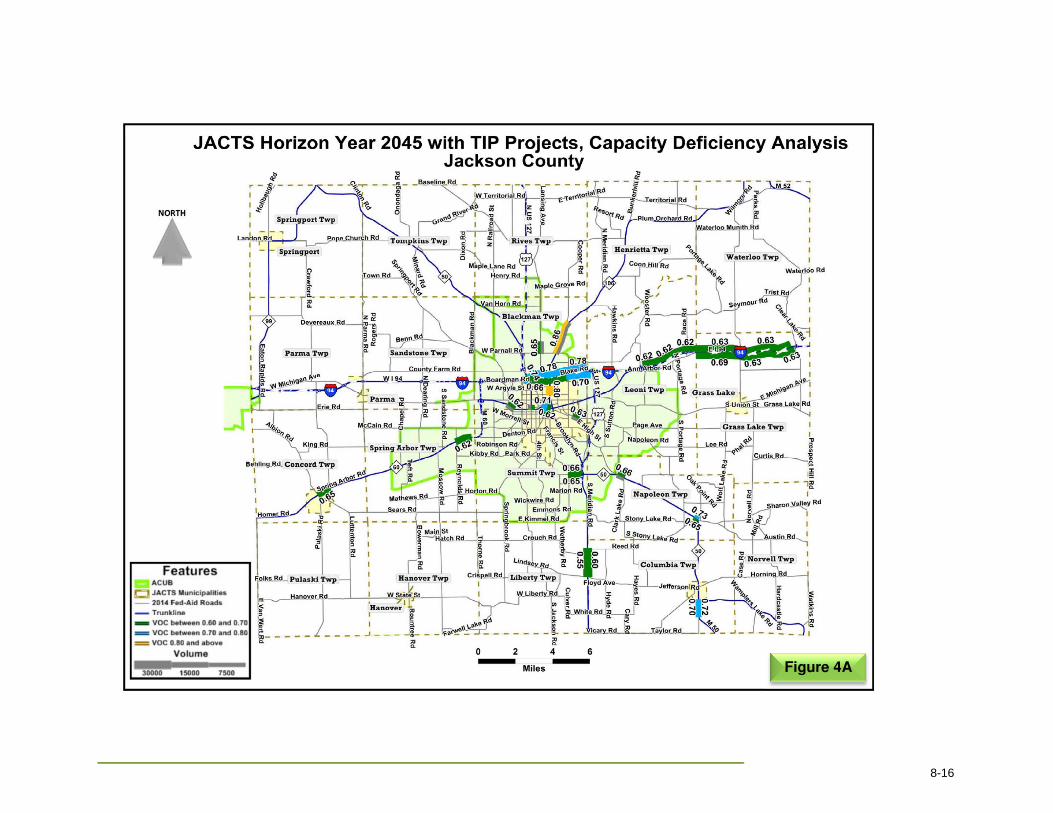
Figure 4A
8-16

Figure 4B
8-17

Figure 4C
8-18

Figure 5A
8-19
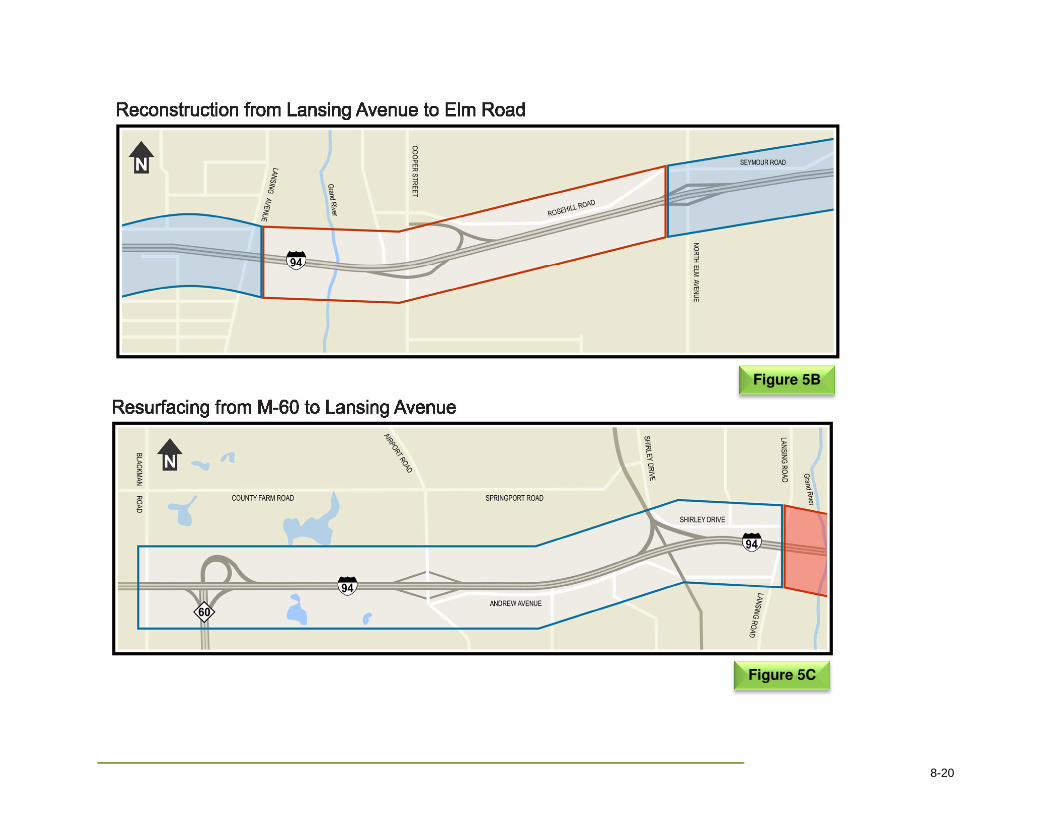
Figure 5B
Figure 5C
8-20

Figure 5D
8-21