chapter 9. measurements of the respiratory system frank p. primiano, jr. medical instrumentation...
TRANSCRIPT

Chapter 9. Measurements of the Respiratory System
Frank P. Primiano, Jr.
Medical Instrumentation Application and Design, 4th Edition
John G. Webster, Univ. of Wisconsin, Madison
ISBN: 978-0-471-67600-3

Figure 9.1 Models of the lungs: (a) Basic gas-transport unit of the pulmonary system. Here (x Q) is the molar flow of X through the airway opening, awo, and the pulmonary capillary blood network, b. Ubx is the net rate of molar uptake—that is, the net rate of diffusion of X into the blood. VD and VA are the dead-space volume and alveolar volume, respectively. (b) A basic mechanical unit of the pulmonary system. PA is the pressure inside the lung—that is, in the alveolar compartment. PPL and PAWO are the pressures on the pleural surface of the lungs and at the airway opening, respectively. VL is the volume of the gas space within the lungs, including the airways; QAWO is the volume flow of gas into the lungs measured at the airway opening.

fig_09_02
Figure 9.2 Models of normal ventilatory mechanics for small-amplitude, low-frequency (normal lungs, resting) breathing: (a) Lung mechanical unit enclosed by chest wall. (b) Equivalent circuit for model in Figure 9.2(a).


Figure 9.3 Pneumotachometer flow-resistance elements: (a) Screen. (b) Capillary tubes or channels.

Figure 9.4 Pneumotachometer for measurements at the mouth: (a) Diameter adapter that acts as a diffuser. (b) An application in which a constant flow is used to clear the dead space.

Figure 9.5 Volume ranges of the intact ventilatory system (with no external loads applied). TLC, FRC, and RV are measured as absolute volumes. VC, IC, ERV, and Vt are volume changes. Closing volume (CV) and closing capacity (CC) are obtained from a single-breath washout experiment.

fig_09_06
Figure 9.6 A water-sealed spirometer set up to measure slow lung-volume changes. The soda-lime and one-way-valve arrangement prevent buildup of CO2 during rebreathing.


fig_09_07
Figure 9.7 Diagram of an N2 washout experiment. The expired gas can be collected in a spirometer, as shown here, or in a rubberized-canvas or plastic Douglas bag. N2 content is then determined off-line. An alternative is to measure expiratory flow and nitrogen concentration continuously to determine the volume flow of expired nitrogen, which can be integrated to yield an estimate of the volume of nitrogen expired.

Figure 9.8 A pressure-type total-body plethysmograph is used with the shutter closed to determine lung volume and with the shutter open to determine changes in alveolar pressure. Airway resistance can also be computed if volume flow of gas is measured at the airway opening. Because atmospheric pressure is constant, changes in the pressures of interest can be obtained from measurements made relative to atmospheric pressure.

Figure 9.9 Idealized statically determined expiratory pressure–volume relations for the lung. The positions and slopes for lungs with different elastic properties are shown relative to scales of absolute volume and pressure difference.

Figure 9.10 A speaker-driven forced oscillation system can be used to obtain the mechanical impedance of the total respiratory system during spontaneous breathing, and to measure the acoustic impedance and/or frequency responses of laboratory apparatus. The high inertance of the long (8.5 m) tube at port 2, acts as a low-pass filter for flow. As the subject breathes normally, the low frequency flow produced passes through port 1 and port 2. However, the small, high-frequency pressure variations generated by the speaker are blocked by the inertance at port 2 and are preferentially transmitted to the subject through port 1.
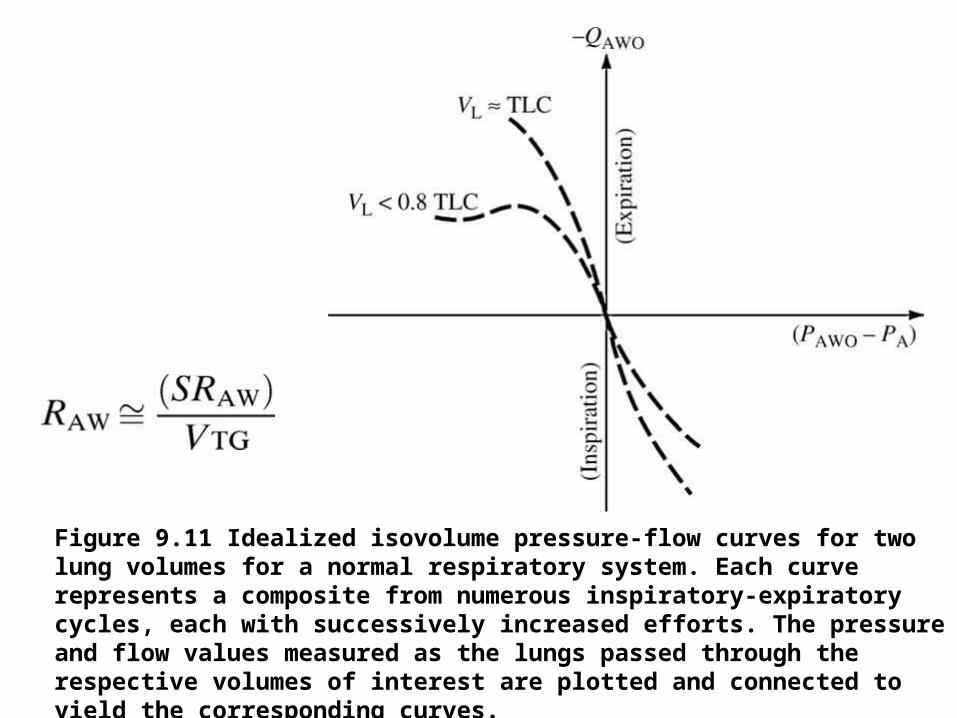
fig_09_11
Figure 9.11 Idealized isovolume pressure-flow curves for two lung volumes for a normal respiratory system. Each curve represents a composite from numerous inspiratory-expiratory cycles, each with successively increased efforts. The pressure and flow values measured as the lungs passed through the respective volumes of interest are plotted and connected to yield the corresponding curves.

fig_09_12
Figure 9.12 Alternative methods of displaying data produced during a forced vital capacity expiration. Equivalent information can be obtained from each type of curve; however, reductions in expiratory flow are subjectively more apparent on the MEFV curve than on the timed spirogram.

Figure 9.13 Essential elements of a medical mass spectrometer.

Figure 9.14 General arrangement of the components of an infrared spectroscopy system.

fig_09_15
Figure 9.15 N2 analyzer employing emission spectroscopy.

Figure 9.16 Oxygen analyzers: (a) Diagram of the top view of a balance-type paramagnetic oxygen analyzer. The magnetic field is perpendicular to the plane of the diagram. The test body either is allowed to rotate (as shown) or is held in place by countertorque, which is measured to determine the oxygen concentration in the gas mixture, (b) Diagram of a differential pressure and a magnetoacoustic oxygen analyzer.

Figure 9.17 Distributions of volume and gas species at RV and TLC for a vital-capacity inspiration of air or pure oxygen.

fig_09_18
Figure 9.18 Single-breath nitrogen-washout maneuver (a) An idealized model of a lung at the end of a vital-capacity inspiration of pure O2, preceded by breathing of normal air. (b) Single-breath N2-washout curves for idealized lung, normal lung, and abnormal lung. Parameters of these curves include anatomical dead space, slope of phase III, and closing volume.
