chapter 9 divisional performance measures - hksc...
TRANSCRIPT
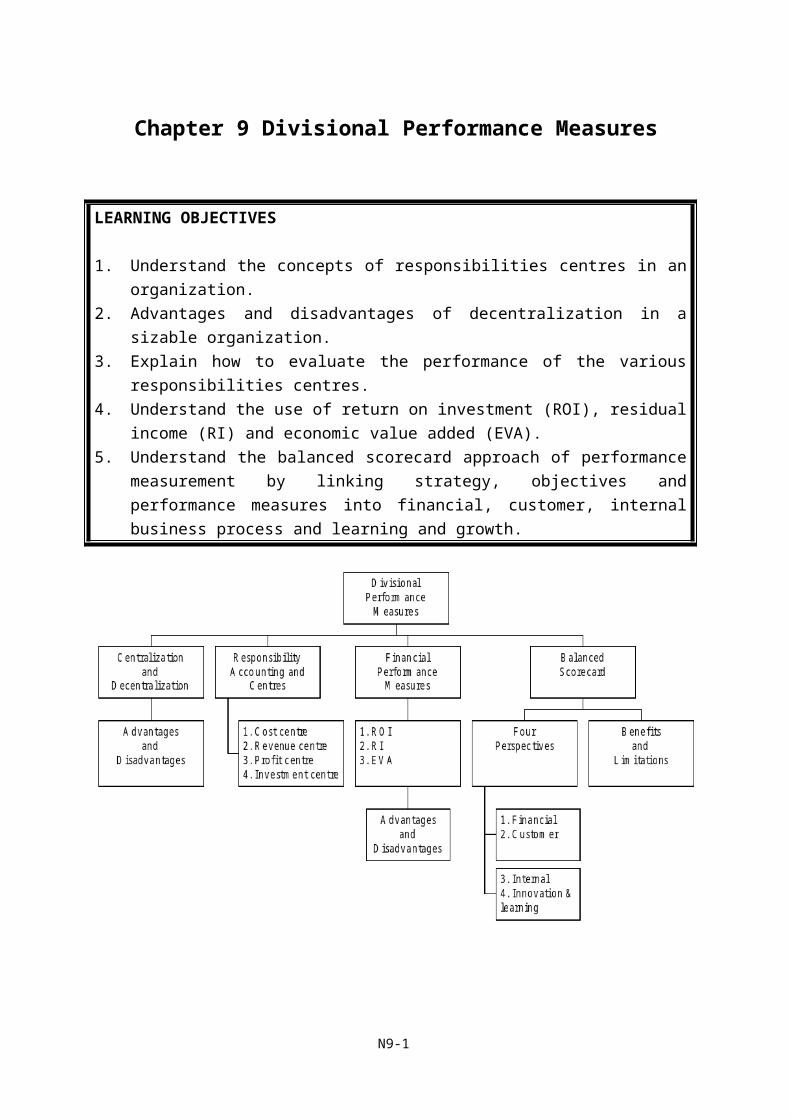
Chapter 9 Divisional Performance Measures
LEARNING OBJECTIVES
1. Understand the concepts of responsibilities centres in an organization.2. Advantages and disadvantages of decentralization in a sizable organization.3. Explain how to evaluate the performance of the various responsibilities centres.4. Understand the use of return on investment (ROI), residual income (RI) and economic
value added (EVA).5. Understand the balanced scorecard approach of performance measurement by linking
strategy, objectives and performance measures into financial, customer, internal business process and learning and growth.
N9-1
1. Centralization and Decentralization
1.1 Definitions
(a) Centralized organization is an organization in which top management makes most decisions and control most activities from the central headquarters.
(b) Decentralization is defined as delegating authority to make decisions.
In general, a divisional structure will lead to decentralization of the decision-making process and divisional managers may have the freedom to set selling prices, choose suppliers, make product mix and output decisions and so on.
1.2 Advantages of decentralization (Jun 11, Dec 12)
(a) Size – the process of decentralization breaks an organization up into more manageable units, this enables decision-making to proceed quickly and effectively and, in theory, a closer control to be maintained on the day to day running of a business’s activities.
(b) Motivation – if managers are made to feel responsible for a particular part of a business then it is generally found that their efforts within that part of the business are improved.
(c) Quality of decisions – divisional managers know local conditions and are able to make more informed judgements. Moreover, with the personal incentive to improve the divisions’s performance, they ought to take decisions in the division’s best interests.
(d) Releasing top management – it can free top management from detailed involvement in day-to-day operations and allows them to devote more time to strategic planning.
(e) Training – Divisions provide valuable training grounds for future members of top management by giving them experience of managerial skills in a less complex environment than that faced by top management.
N9-2
1.3 Disadvantages of decentralization
(a) Lack of goal congruence – the danger arises that divisional managers will make decisions which, whilst in the best interests of their divisions, are not in the best interest of the company as a whole. This leads to sub-optimal or dysfunctional decisions.
(b) Cost – It is claimed that the costs of activities that are common to all divisions such as running the accounting department may be greater for a divisionalised structure that for a centralized structure.
(c) Loss of central control – top management may not aware what is going on in the division. An effective system of divisional reporting should overcome this problem. The reporting system should produce the key figures to monitor divisional performance and motivate the staff.
2. Concepts of Responsibility Accounting and Responsibility Centres
2.1 Responsibility accounting
2.1.1 Principle of responsibility accounting (Jun 09, Jun 10)
(a) Responsibility accounting is a system under which management is given decision-making authority from top management and has responsibility for each activity, including costs, revenues and profits within a specific area of the company, such as division or a business unit. That is, managers are responsible to what they have control.
(b) The rationale behind responsibility accounting is that each manager’s performance should be judged by how well he or she manages those items under his or her control, as assigned by top management.
2.2 Responsibility centres
2.2.1 Nowadays, most sizable organizations are decentralizing as their operations are getting more complex while they have operations globally. Geographical and complicated operations make management more difficult to control and thus managers of business units are responsible for a range of decisions considered by the head office.
N9-3
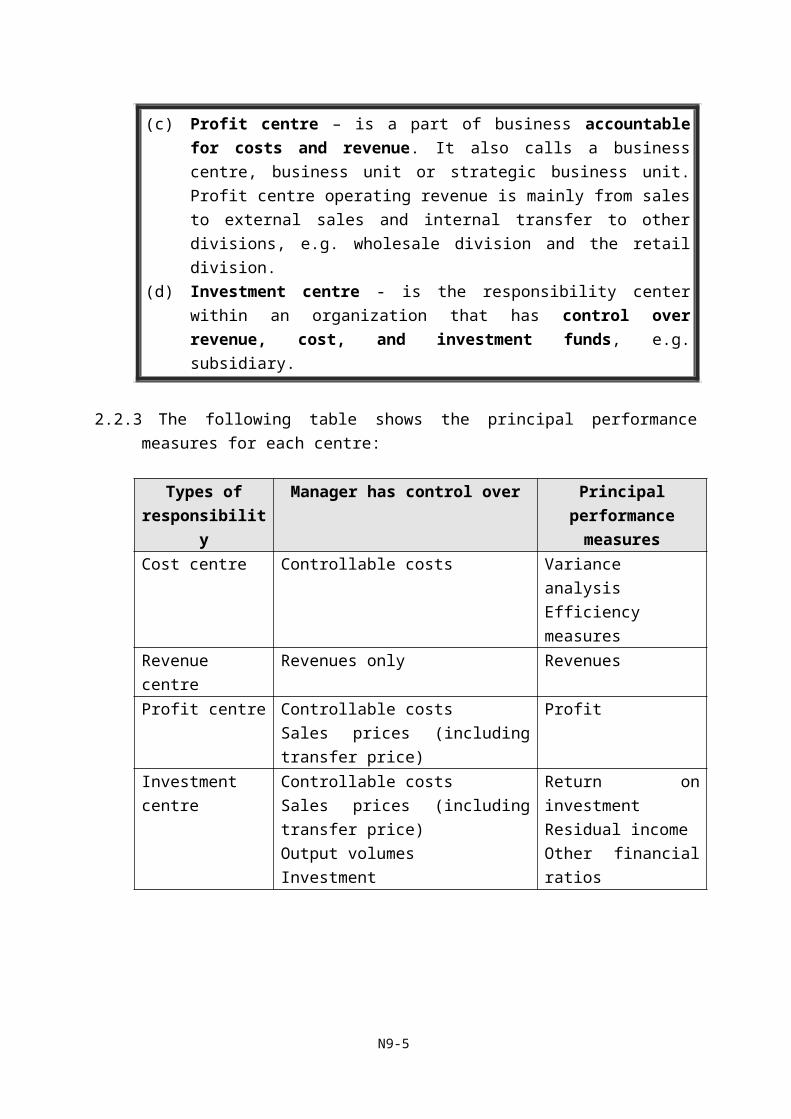
2.2.2 Definitions (Jun 09, Jun 11, Jun 13)
(a) Cost centre – a production or service location, function, activity or item equipment whose costs may be attributed to cost units, e.g. packaging department, administration department, etc.
(b) Revenue centre – is a centre devoted to raising revenue with no responsibility for production, e.g. sales and marketing departments.
(c) Profit centre – is a part of business accountable for costs and revenue. It also calls a business centre, business unit or strategic business unit. Profit centre operating revenue is mainly from sales to external sales and internal transfer to other divisions, e.g. wholesale division and the retail division.
(d) Investment centre - is the responsibility center within an organization that has control over revenue, cost, and investment funds, e.g. subsidiary.
2.2.3 The following table shows the principal performance measures for each centre:
Types of responsibility
Manager has control over Principal performance measures
Cost centre Controllable costs Variance analysisEfficiency measures
Revenue centre Revenues only RevenuesProfit centre Controllable costs
Sales prices (including transfer price)Profit
Investment centre Controllable costsSales prices (including transfer price)Output volumesInvestment
Return on investmentResidual incomeOther financial ratios
N9-4
3. Financial Performance Measures of Investment Centre
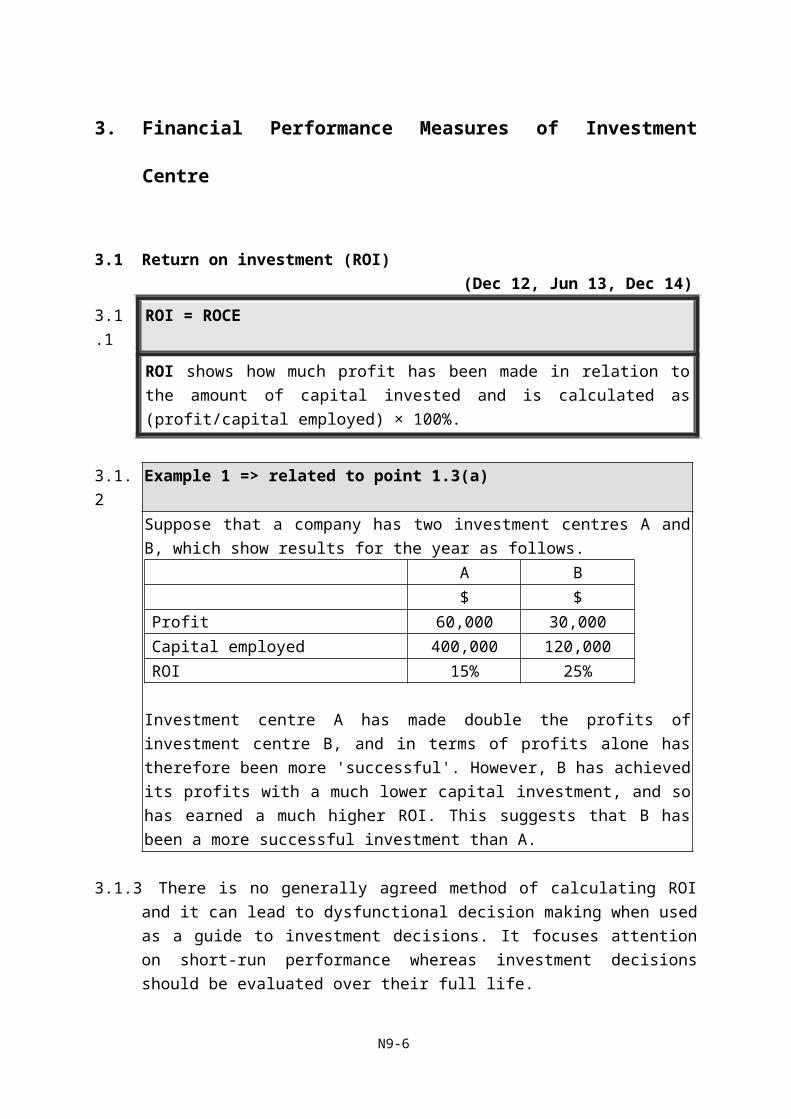
3.1 Return on investment (ROI)(Dec 12, Jun 13, Dec 14)
3.1.1 ROI = ROCE
ROI shows how much profit has been made in relation to the amount of capital invested and is calculated as (profit/capital employed) × 100%.
3.1.2 Example 1 => related to point 1.3(a)Suppose that a company has two investment centres A and B, which show results for the year as follows.
A B$ $
Profit 60,000 30,000Capital employed 400,000 120,000ROI 15% 25%
Investment centre A has made double the profits of investment centre B, and in terms of profits alone has therefore been more 'successful'. However, B has achieved its profits with a much lower capital investment, and so has earned a much higher ROI. This suggests that B has been a more successful investment than A.
3.1.3 There is no generally agreed method of calculating ROI and it can lead to dysfunctional decision making when used as a guide to investment decisions. It focuses attention on short-run performance whereas investment decisions should be evaluated over their full life.
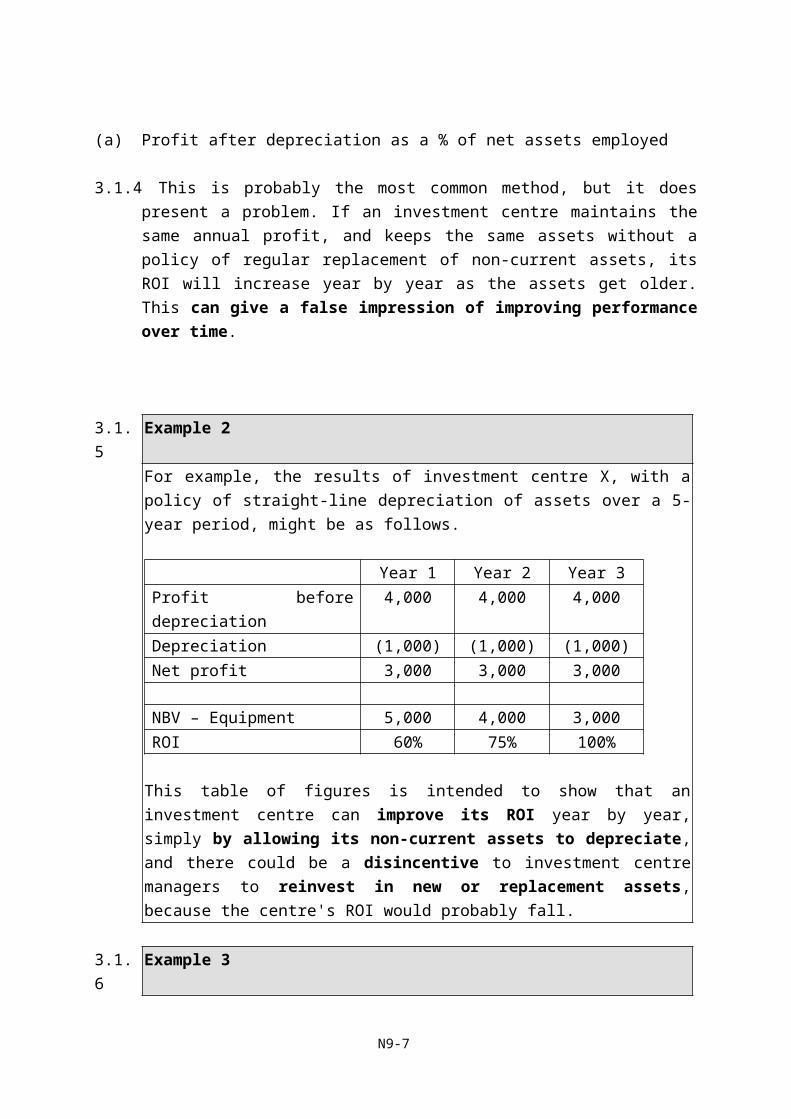
(a) Profit after depreciation as a % of net assets employed
3.1.4 This is probably the most common method, but it does present a problem. If an investment centre maintains the same annual profit, and keeps the same assets without a policy of regular replacement of non-current assets, its ROI will increase year by year as the assets get older. This can give a false impression of improving performance over time.
N9-5
3.1.5 Example 2For example, the results of investment centre X, with a policy of straight-line depreciation of assets over a 5-year period, might be as follows.
Year 1 Year 2 Year 3Profit before depreciation 4,000 4,000 4,000Depreciation (1,000) (1,000) (1,000)Net profit 3,000 3,000 3,000
NBV – Equipment 5,000 4,000 3,000ROI 60% 75% 100%
This table of figures is intended to show that an investment centre can improve its ROI year by year, simply by allowing its non-current assets to depreciate, and there could be a disincentive to investment centre managers to reinvest in new or replacement assets, because the centre's ROI would probably fall.
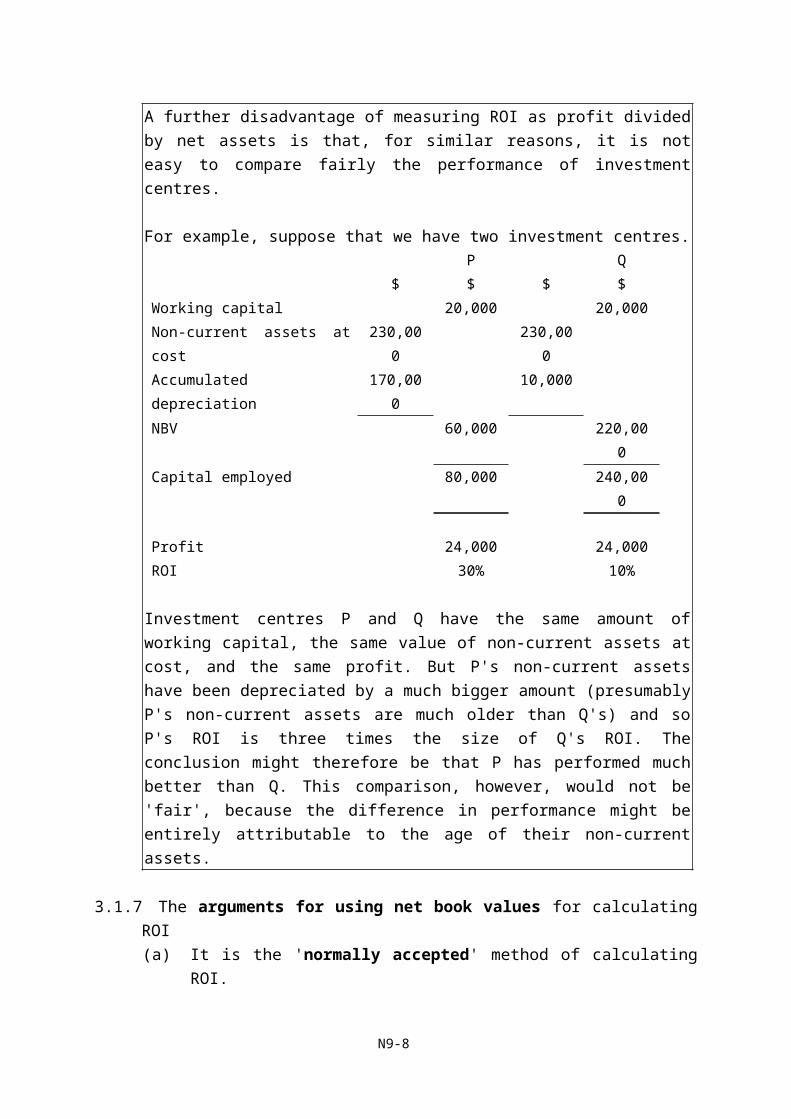
3.1.6 Example 3A further disadvantage of measuring ROI as profit divided by net assets is that, for similar reasons, it is not easy to compare fairly the performance of investment centres.
For example, suppose that we have two investment centres.P Q
$ $ $ $
Working capital 20,000 20,000
Non-current assets at cost 230,000 230,000
Accumulated depreciation 170,000 10,000
NBV 60,000 220,000
Capital employed 80,000 240,000
Profit 24,000 24,000
ROI 30% 10%
Investment centres P and Q have the same amount of working capital, the same value of non-current assets at cost, and the same profit. But P's non-current assets have been depreciated by a much bigger amount (presumably P's non-current assets are
N9-6
much older than Q's) and so P's ROI is three times the size of Q's ROI. The conclusion might therefore be that P has performed much better than Q. This comparison, however, would not be 'fair', because the difference in performance might be entirely attributable to the age of their non-current assets.
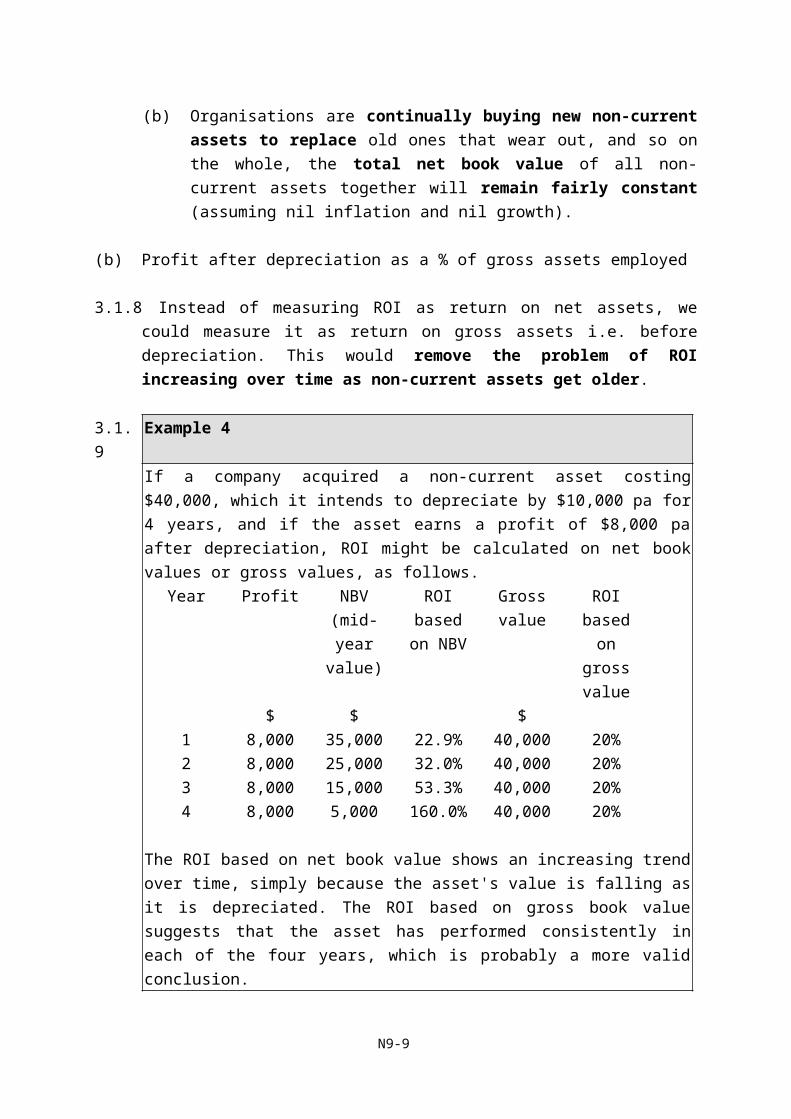
3.1.7 The arguments for using net book values for calculating ROI(a) It is the 'normally accepted' method of calculating ROI.(b) Organisations are continually buying new non-current assets to replace old
ones that wear out, and so on the whole, the total net book value of all non-current assets together will remain fairly constant (assuming nil inflation and nil growth).
(b) Profit after depreciation as a % of gross assets employed
3.1.8 Instead of measuring ROI as return on net assets, we could measure it as return on gross assets i.e. before depreciation. This would remove the problem of ROI increasing over time as non-current assets get older.
3.1.9 Example 4If a company acquired a non-current asset costing $40,000, which it intends to depreciate by $10,000 pa for 4 years, and if the asset earns a profit of $8,000 pa after depreciation, ROI might be calculated on net book values or gross values, as follows.
Year Profit NBV (mid-year
value)
ROI based on NBV
Gross value
ROI based on gross
value$ $ $
1 8,000 35,000 22.9% 40,000 20%2 8,000 25,000 32.0% 40,000 20%3 8,000 15,000 53.3% 40,000 20%4 8,000 5,000 160.0% 40,000 20%
The ROI based on net book value shows an increasing trend over time, simply because the asset's value is falling as it is depreciated. The ROI based on gross book value suggests that the asset has performed consistently in each of the four years, which is probably a more valid conclusion.
N9-7
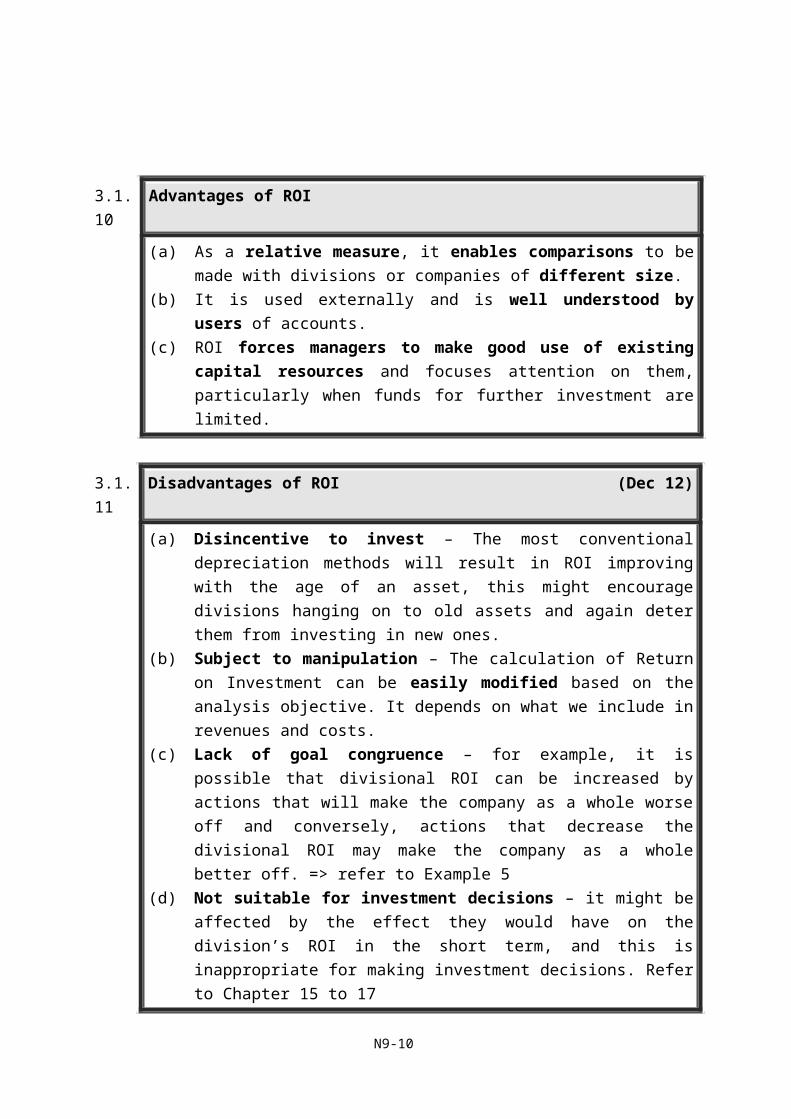
3.1.10 Advantages of ROI
(a) As a relative measure, it enables comparisons to be made with divisions or companies of different size.
(b) It is used externally and is well understood by users of accounts.(c) ROI forces managers to make good use of existing capital resources and
focuses attention on them, particularly when funds for further investment are limited.
3.1.11 Disadvantages of ROI (Dec 12)
(a) Disincentive to invest – The most conventional depreciation methods will result in ROI improving with the age of an asset, this might encourage divisions hanging on to old assets and again deter them from investing in new ones.
(b) Subject to manipulation – The calculation of Return on Investment can be easily modified based on the analysis objective. It depends on what we include in revenues and costs.
(c) Lack of goal congruence – for example, it is possible that divisional ROI can be increased by actions that will make the company as a whole worse off and conversely, actions that decrease the divisional ROI may make the company as a whole better off. => refer to Example 5
(d) Not suitable for investment decisions – it might be affected by the effect they would have on the division’s ROI in the short term, and this is inappropriate for making investment decisions. Refer to Chapter 15 to 17
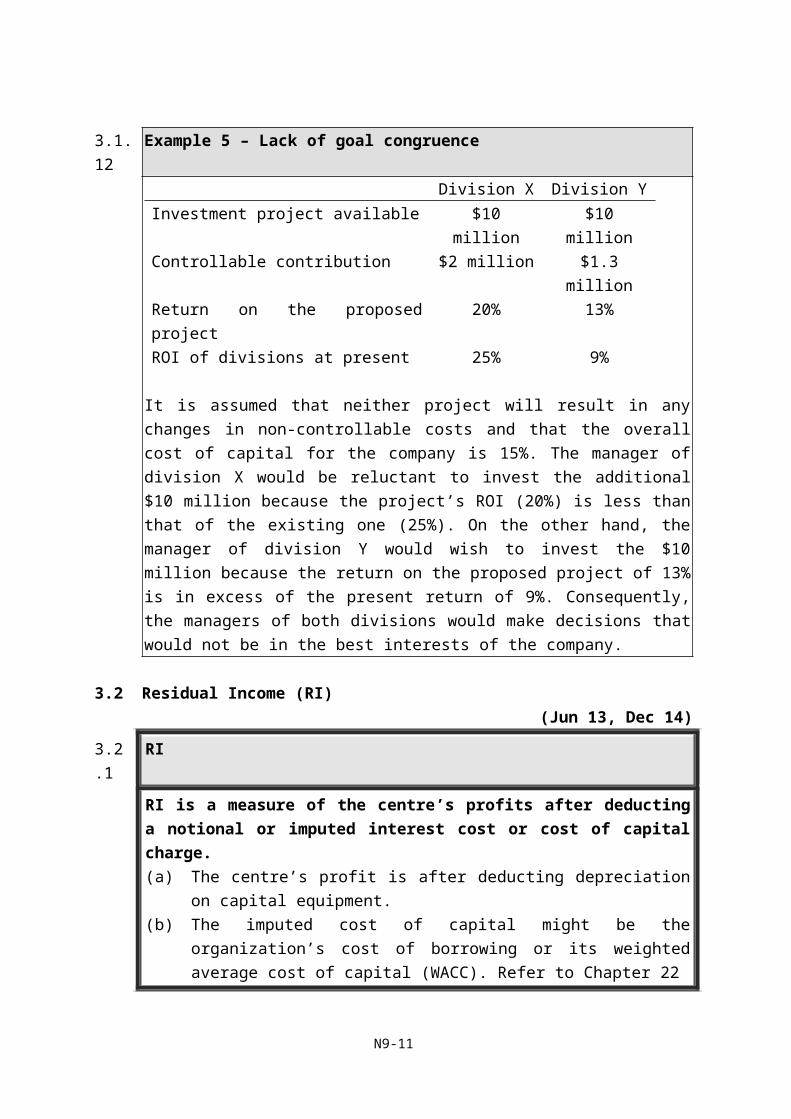
3.1.12 Example 5 – Lack of goal congruenceDivision X Division Y
Investment project available $10 million $10 millionControllable contribution $2 million $1.3 millionReturn on the proposed project 20% 13%ROI of divisions at present 25% 9%
It is assumed that neither project will result in any changes in non-controllable costs and that the overall cost of capital for the company is 15%. The manager of division X would be reluctant to invest the additional $10 million because the project’s ROI
N9-8
(20%) is less than that of the existing one (25%). On the other hand, the manager of division Y would wish to invest the $10 million because the return on the proposed project of 13% is in excess of the present return of 9%. Consequently, the managers of both divisions would make decisions that would not be in the best interests of the company.
3.2 Residual Income (RI)(Jun 13, Dec 14)
3.2.1 RI
RI is a measure of the centre’s profits after deducting a notional or imputed interest cost or cost of capital charge.(a) The centre’s profit is after deducting depreciation on capital equipment.(b) The imputed cost of capital might be the organization’s cost of borrowing or
its weighted average cost of capital (WACC). Refer to Chapter 22
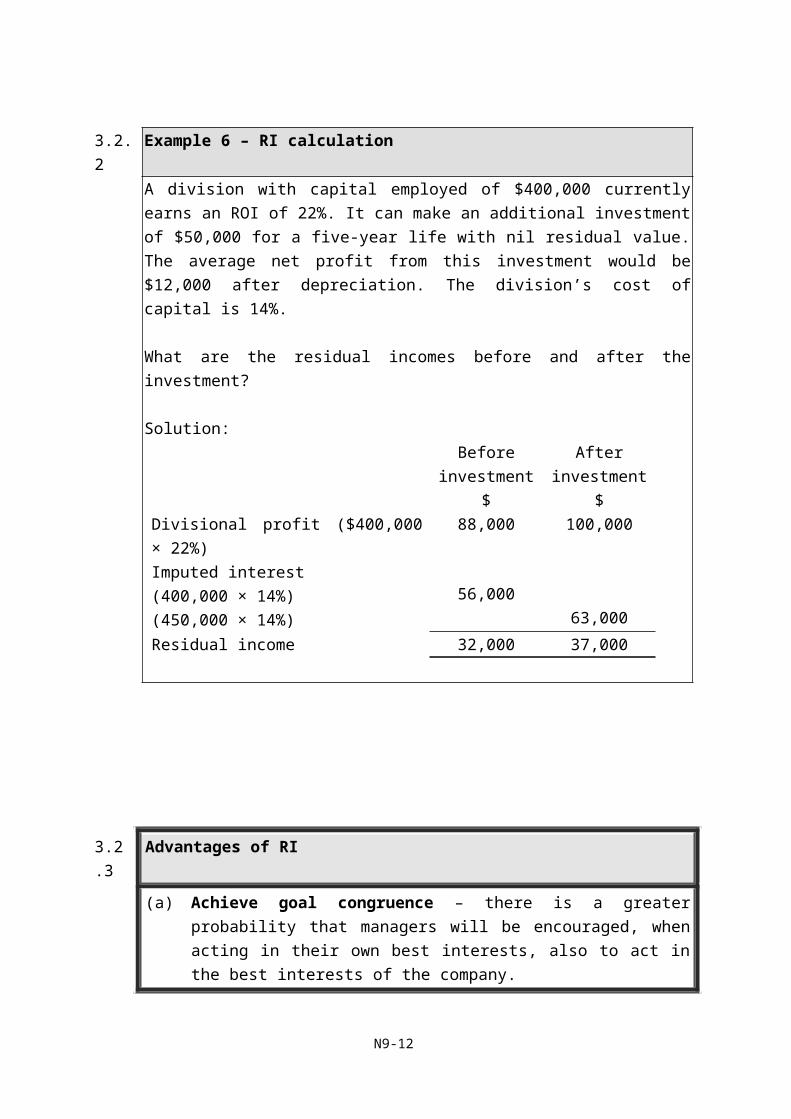
3.2.2 Example 6 – RI calculationA division with capital employed of $400,000 currently earns an ROI of 22%. It can make an additional investment of $50,000 for a five-year life with nil residual value. The average net profit from this investment would be $12,000 after depreciation. The division’s cost of capital is 14%.
What are the residual incomes before and after the investment?
Solution:Before
investmentAfter
investment$ $
Divisional profit ($400,000 × 22%) 88,000 100,000Imputed interest(400,000 × 14%)(450,000 × 14%)
56,00063,000
Residual income 32,000 37,000
N9-9
3.2.3 Advantages of RI
(a) Achieve goal congruence – there is a greater probability that managers will be encouraged, when acting in their own best interests, also to act in the best interests of the company.
(b) More flexible – RI can apply a different cost of capital to investment with different risk characteristics. => Refer to chapter 15 to 17
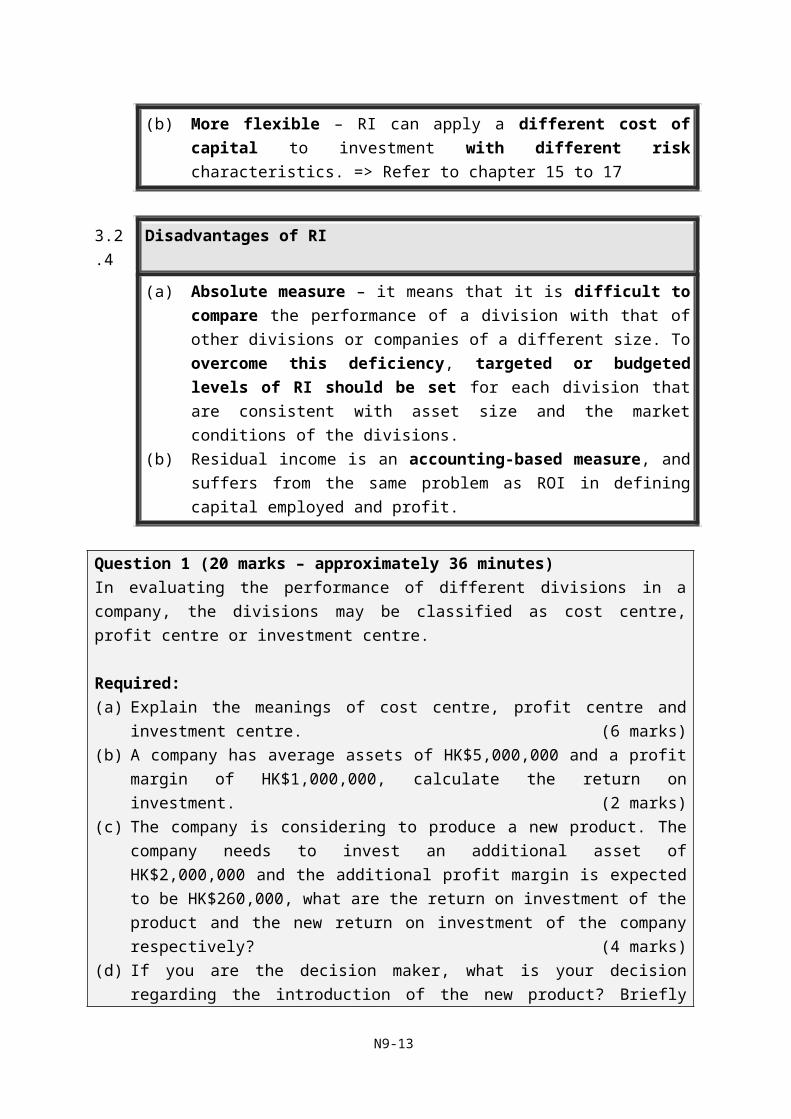
3.2.4 Disadvantages of RI
(a) Absolute measure – it means that it is difficult to compare the performance of a division with that of other divisions or companies of a different size. To overcome this deficiency, targeted or budgeted levels of RI should be set for each division that are consistent with asset size and the market conditions of the divisions.
(b) Residual income is an accounting-based measure, and suffers from the same problem as ROI in defining capital employed and profit.
Question 1 (20 marks – approximately 36 minutes)In evaluating the performance of different divisions in a company, the divisions may be classified as cost centre, profit centre or investment centre.
Required:(a) Explain the meanings of cost centre, profit centre and investment centre. (6 marks)(b) A company has average assets of HK$5,000,000 and a profit margin of HK$1,000,000,
calculate the return on investment. (2 marks)(c) The company is considering to produce a new product. The company needs to invest
an additional asset of HK$2,000,000 and the additional profit margin is expected to be HK$260,000, what are the return on investment of the product and the new return on investment of the company respectively? (4 marks)
(d) If you are the decision maker, what is your decision regarding the introduction of the new product? Briefly explain. (3 marks)
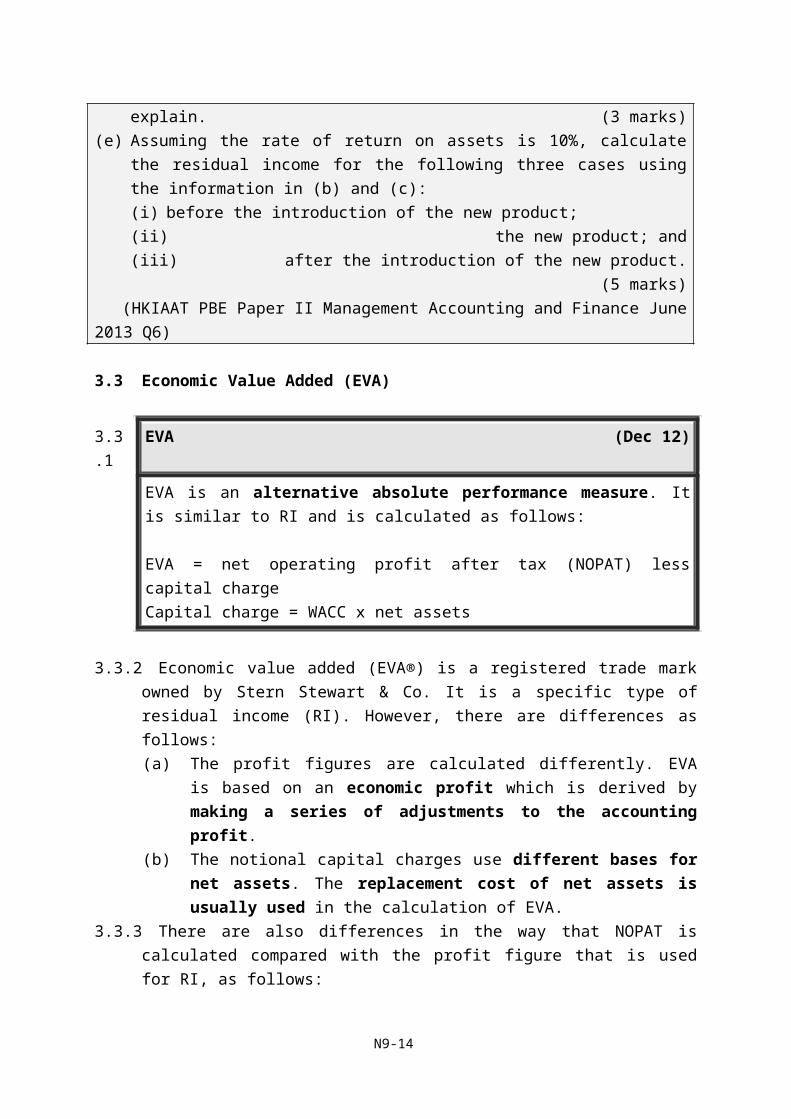
(e) Assuming the rate of return on assets is 10%, calculate the residual income for the following three cases using the information in (b) and (c):
N9-10
(i) before the introduction of the new product;(ii) the new product; and(iii) after the introduction of the new product. (5 marks)
(HKIAAT PBE Paper II Management Accounting and Finance June 2013 Q6)
3.3 Economic Value Added (EVA)
3.3.1 EVA (Dec 12)
EVA is an alternative absolute performance measure. It is similar to RI and is calculated as follows:
EVA = net operating profit after tax (NOPAT) less capital chargeCapital charge = WACC x net assets
3.3.2 Economic value added (EVA®) is a registered trade mark owned by Stern Stewart & Co. It is a specific type of residual income (RI). However, there are differences as follows:(a) The profit figures are calculated differently. EVA is based on an economic
profit which is derived by making a series of adjustments to the accounting profit.
(b) The notional capital charges use different bases for net assets. The replacement cost of net assets is usually used in the calculation of EVA.
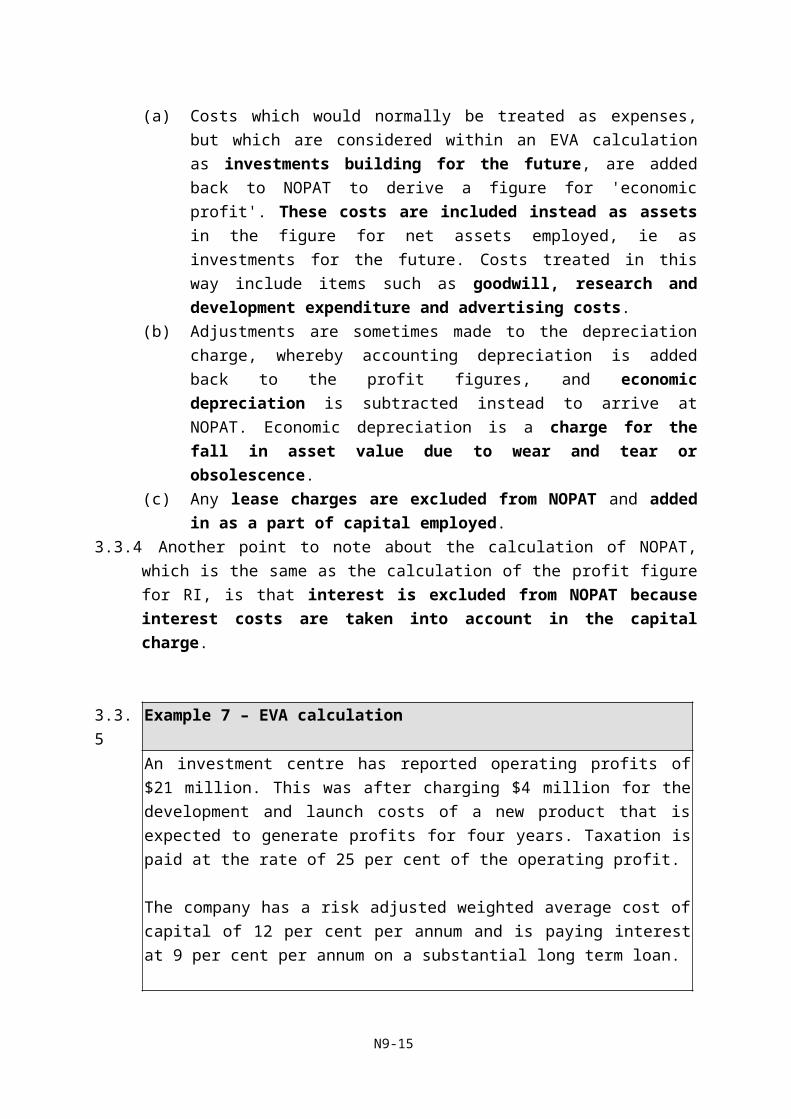
3.3.3 There are also differences in the way that NOPAT is calculated compared with the profit figure that is used for RI, as follows:(a) Costs which would normally be treated as expenses, but which are considered
within an EVA calculation as investments building for the future, are added back to NOPAT to derive a figure for 'economic profit'. These costs are included instead as assets in the figure for net assets employed, ie as investments for the future. Costs treated in this way include items such as goodwill, research and development expenditure and advertising costs.
(b) Adjustments are sometimes made to the depreciation charge, whereby accounting depreciation is added back to the profit figures, and economic depreciation is subtracted instead to arrive at NOPAT. Economic depreciation is a charge for the fall in asset value due to wear and tear or obsolescence.
(c) Any lease charges are excluded from NOPAT and added in as a part of capital employed.
N9-11
3.3.4 Another point to note about the calculation of NOPAT, which is the same as the calculation of the profit figure for RI, is that interest is excluded from NOPAT because interest costs are taken into account in the capital charge.
3.3.5 Example 7 – EVA calculationAn investment centre has reported operating profits of $21 million. This was after charging $4 million for the development and launch costs of a new product that is expected to generate profits for four years. Taxation is paid at the rate of 25 per cent of the operating profit.
The company has a risk adjusted weighted average cost of capital of 12 per cent per annum and is paying interest at 9 per cent per annum on a substantial long term loan.
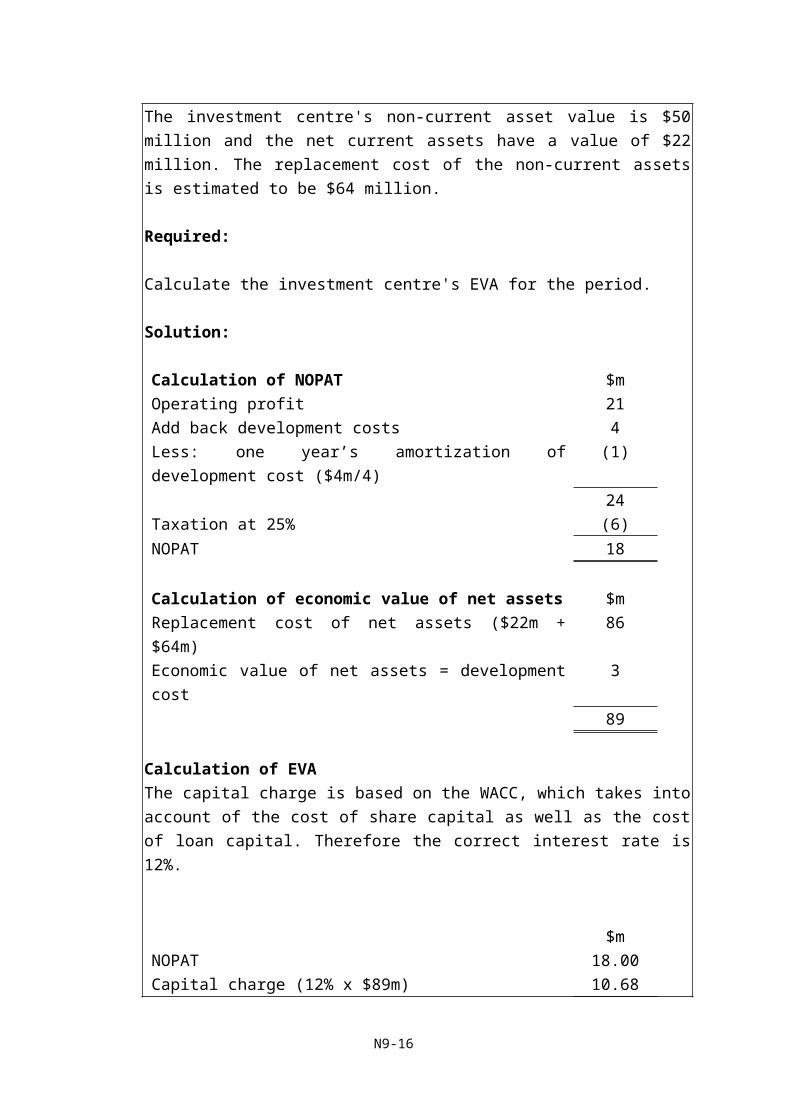
The investment centre's non-current asset value is $50 million and the net current assets have a value of $22 million. The replacement cost of the non-current assets is estimated to be $64 million.
Required:
Calculate the investment centre's EVA for the period.
Solution:
Calculation of NOPAT $mOperating profit 21Add back development costs 4Less: one year’s amortization of development cost ($4m/4) (1)
24Taxation at 25% (6)NOPAT 18
Calculation of economic value of net assets $mReplacement cost of net assets ($22m + $64m) 86Economic value of net assets = development cost 3
89
N9-12
Calculation of EVAThe capital charge is based on the WACC, which takes into account of the cost of share capital as well as the cost of loan capital. Therefore the correct interest rate is 12%.
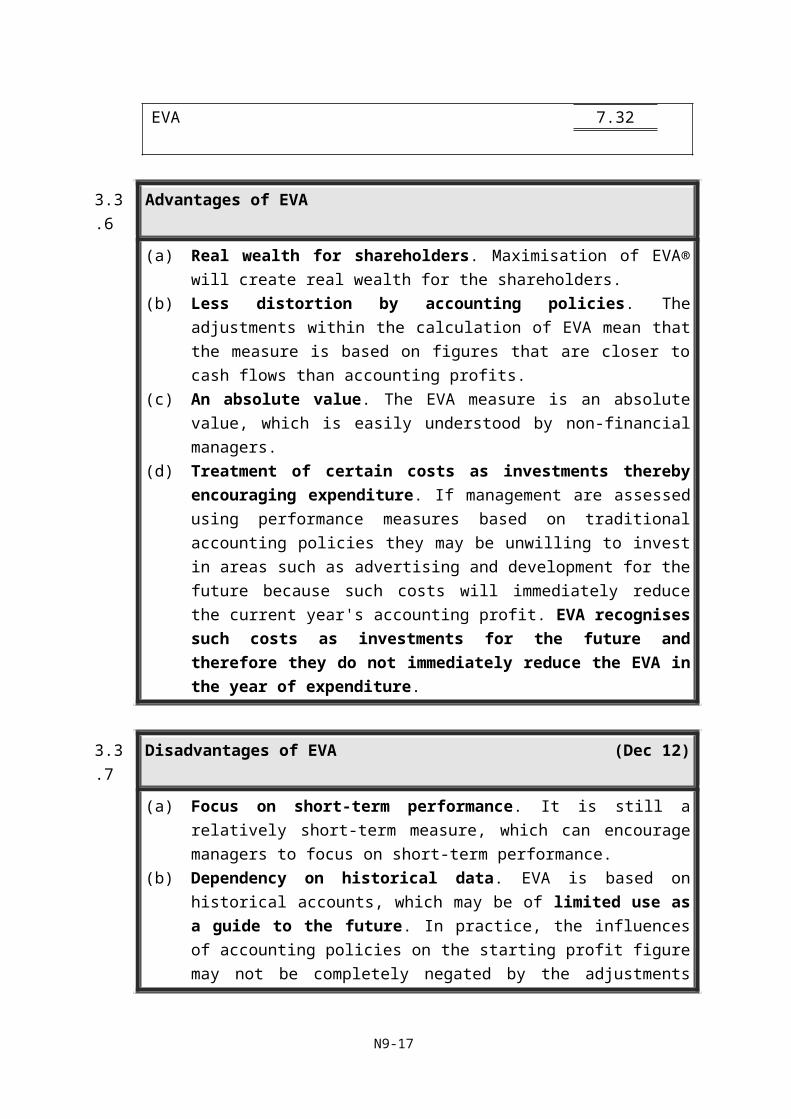
$mNOPAT 18.00Capital charge (12% x $89m) 10.68EVA 7.32
3.3.6 Advantages of EVA
(a) Real wealth for shareholders. Maximisation of EVA® will create real wealth for the shareholders.
(b) Less distortion by accounting policies. The adjustments within the calculation of EVA mean that the measure is based on figures that are closer to cash flows than accounting profits.
(c) An absolute value. The EVA measure is an absolute value, which is easily understood by non-financial managers.
(d) Treatment of certain costs as investments thereby encouraging expenditure. If management are assessed using performance measures based on traditional accounting policies they may be unwilling to invest in areas such as advertising and development for the future because such costs will immediately reduce the current year's accounting profit. EVA recognises such costs as investments for the future and therefore they do not immediately reduce the EVA in the year of expenditure.
3.3.7 Disadvantages of EVA (Dec 12)
(a) Focus on short-term performance. It is still a relatively short-term measure, which can encourage managers to focus on short-term performance.
(b) Dependency on historical data. EVA is based on historical accounts, which may be of limited use as a guide to the future. In practice, the influences of accounting policies on the starting profit figure may not be completely negated by the adjustments made to it in the EVA model.
N9-13
(c) Number of adjustments needed to measure EVA. Making the necessary adjustments can be problematic as sometimes a large number of adjustments are required.
(d) Comparison of like with like. Investment centres, which are larger in size, may have larger EVA figures for this reason. Allowance for relative size must be made when comparing the relative performance of investment centres.
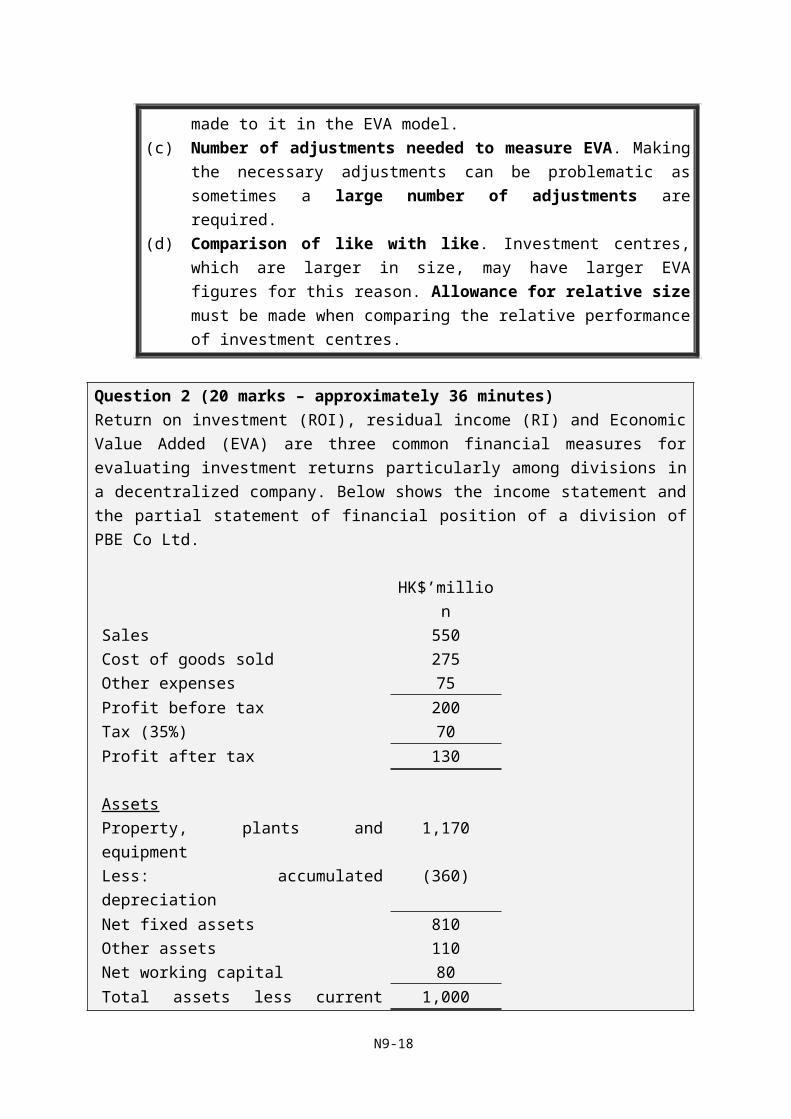
Question 2 (20 marks – approximately 36 minutes)Return on investment (ROI), residual income (RI) and Economic Value Added (EVA) are three common financial measures for evaluating investment returns particularly among divisions in a decentralized company. Below shows the income statement and the partial statement of financial position of a division of PBE Co Ltd.
HK$’millionSales 550Cost of goods sold 275Other expenses 75Profit before tax 200Tax (35%) 70Profit after tax 130
AssetsProperty, plants and equipment 1,170Less: accumulated depreciation (360)Net fixed assets 810Other assets 110Net working capital 80Total assets less current liabilities 1,000
Required:
(a) Define and calculate the return on investment of that division. (3 marks)(b) Suggest THREE ways to increase the return on investment. (6 marks)(c) Briefly explain one major weakness of ROI. (3 marks)(d) Briefly explain what EVA is and one of its major weaknesses. (3 marks)(e) If the cost of capital is 10%, calculate the EVA. (3 marks)
N9-14
(f) Suggest one advantage of decentralized corporate structure. (2 marks)(HKIAAT PBE Paper II Management Accounting and Finance December 2012 Q3)
N9-15
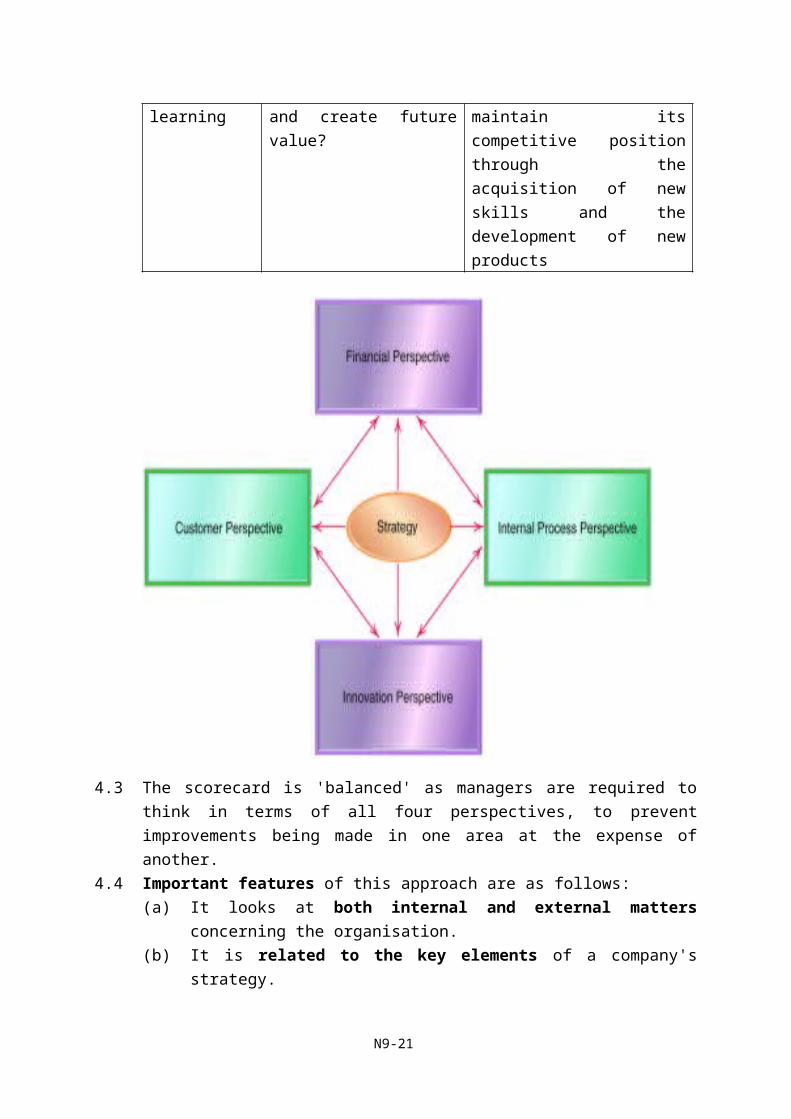
4. Balanced Scorecard and Performance Measurement
4.1 Balanced Scorecard
The balanced scorecard approach to performance measurement focuses on four different perspectives and uses financial and non-financial indicators.
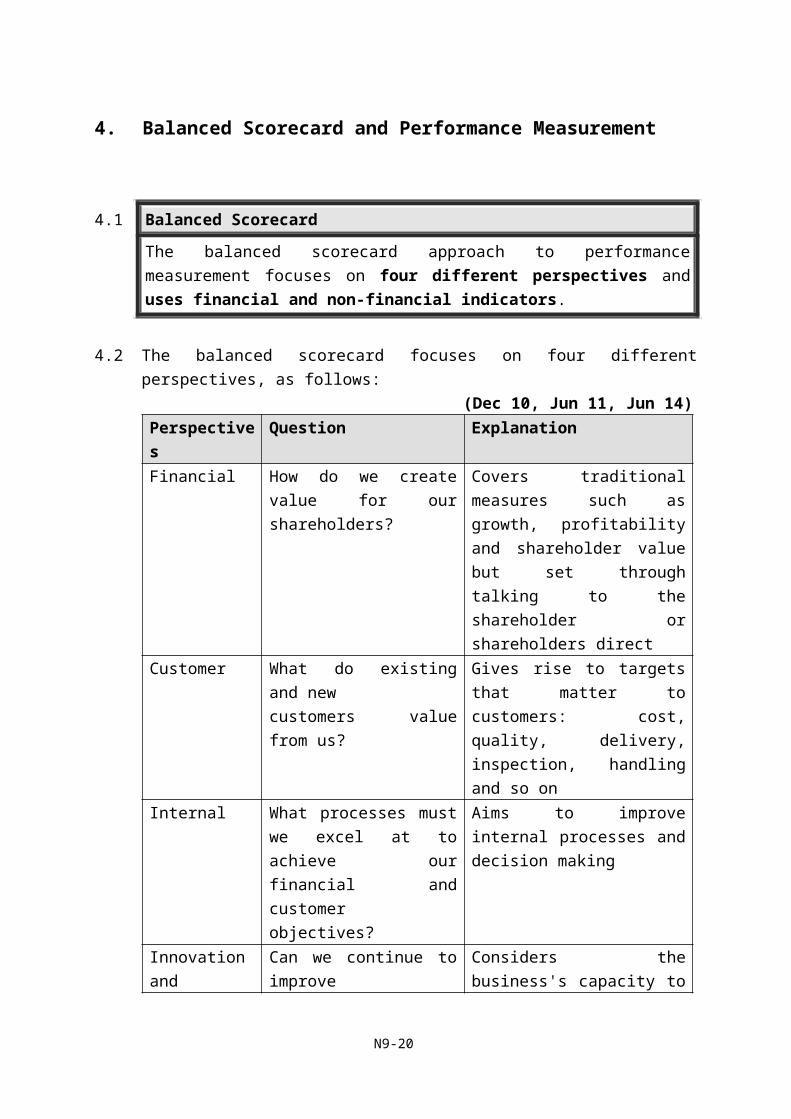
4.2 The balanced scorecard focuses on four different perspectives, as follows:(Dec 10, Jun 11, Jun 14)
Perspectives Question ExplanationFinancial How do we create value for
our shareholders?Covers traditional measures such as growth, profitability and shareholder value but set through talking to the shareholder or shareholders direct
Customer What do existing and newcustomers value from us?
Gives rise to targets that matter to customers: cost, quality, delivery, inspection, handling and so on
Internal What processes must we excel at to achieve our financial and customer objectives?
Aims to improve internal processes and decision making
Innovation and learning
Can we continue to improveand create future value?
Considers the business's capacity to maintain its competitive position through the acquisition of new skills and the development of new products
N9-16
4.3 The scorecard is 'balanced' as managers are required to think in terms of all four perspectives, to prevent improvements being made in one area at the expense of another.
4.4 Important features of this approach are as follows:(a) It looks at both internal and external matters concerning the organisation.(b) It is related to the key elements of a company's strategy.(c) Financial and non-financial measures are linked together.(d) It helps to communicate the strategy to all members of the organization by
translating the strategy into a coherent and linked set of understandable and measurable operational targets.
N9-17
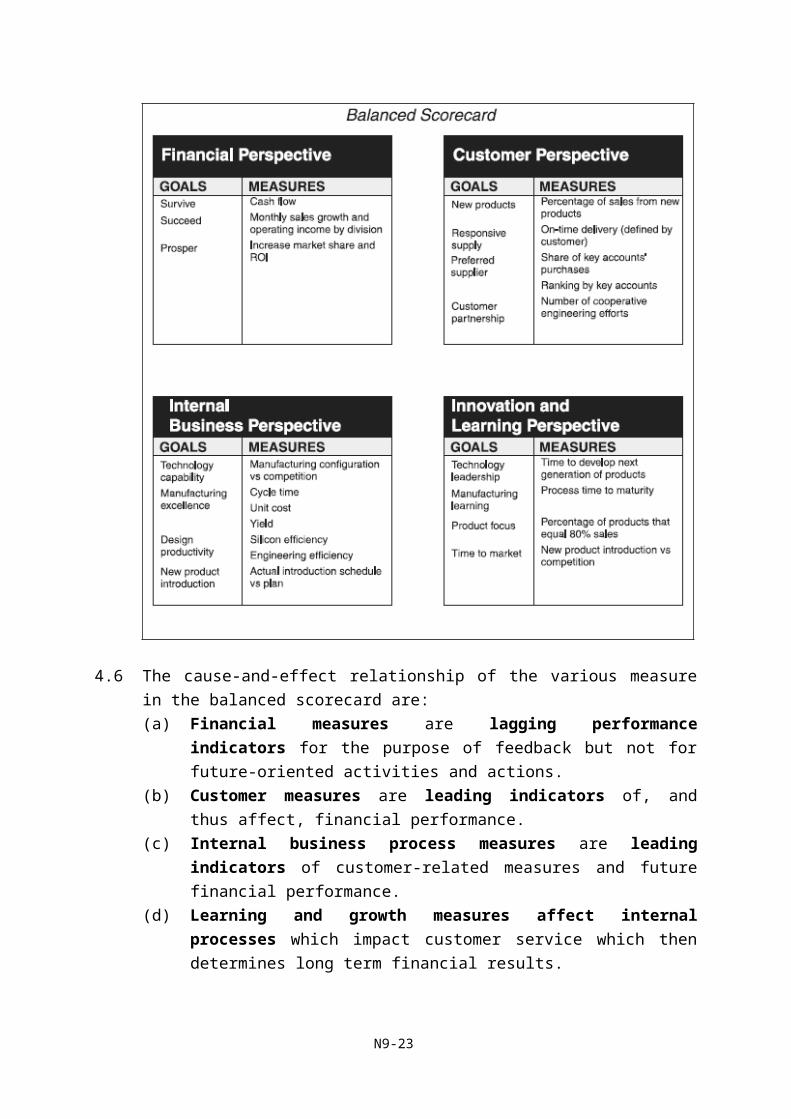
4.5 Example 8An example of how a balanced scorecard might appear is offered below.
4.6 The cause-and-effect relationship of the various measure in the balanced scorecard are:(a) Financial measures are lagging performance indicators for the purpose of
feedback but not for future-oriented activities and actions.(b) Customer measures are leading indicators of, and thus affect, financial
performance.(c) Internal business process measures are leading indicators of customer-
related measures and future financial performance.(d) Learning and growth measures affect internal processes which impact
customer service which then determines long term financial results.
N9-18
4.7 Benefits of balanced scorecard
(a) The scorecard brings together in a single report of four perspectives on a company’s performance that relate to many of the disparate elements of the company’s competitive agenda.
(b) The approach provides a comprehensive framework for translating a company’s strategic goals into a coherent set of performance measures by developing the major goals for the four perspectives and then translating these goals into specific performance measures.
(c) It helps managers to consider all the important operational measures together to see whether improvements in one area may have been at the expense of another.
(d) It improves communications within the organization and promotes the active formulation and implementation of organizational strategy by making it highly visible through the linkage performance measures to business unit strategy.
4.8 Limitations of balanced scorecard
(a) The assumption of the cause-and-effect relationship on the grounds that they are too ambiguous and lack a theoretical underpinning or empirical support.
(b) It may omit other important perspectives, such as the environmental on society perspective and an employee perspective. However, it should be noted that there is nothing to prevent companies adding additional perspectives to meet their own requirements but they must avoid the temptation of creating too many perspectives and performance measures.
N9-19
Examination Style Questions
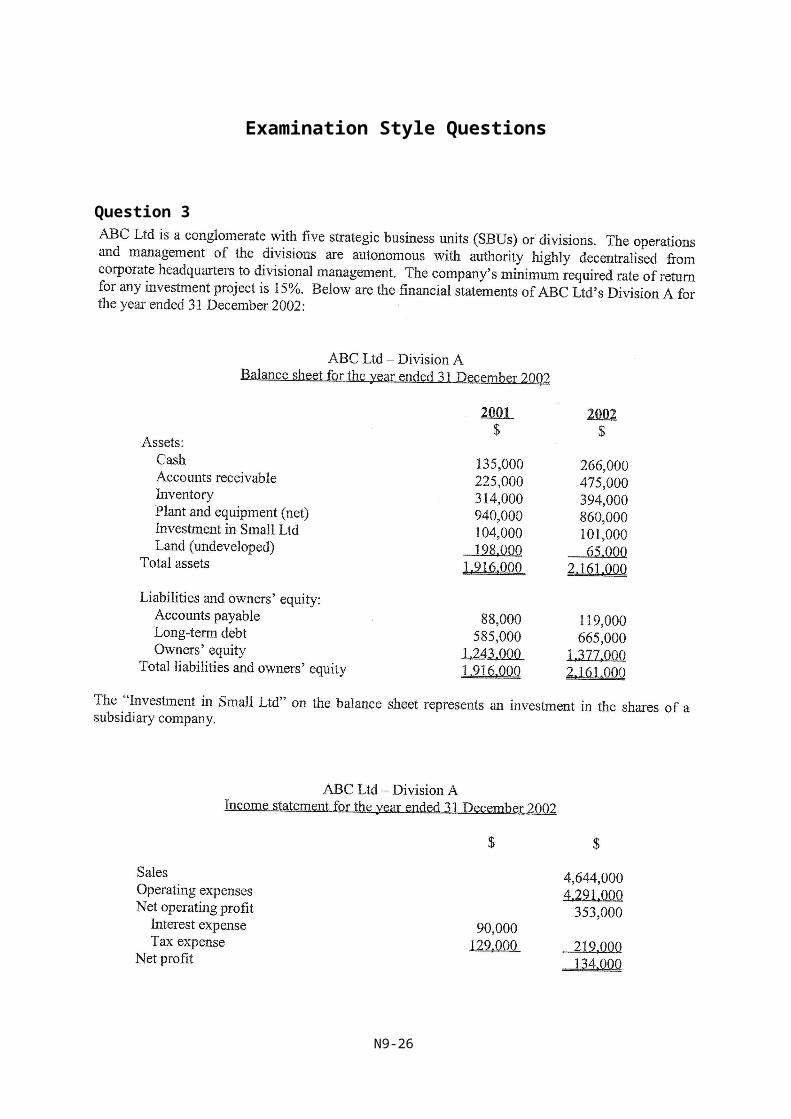
Question 3
N9-20
(HKIAAT PBE Paper II Management Accounting June 2003 Q6)
N9-21
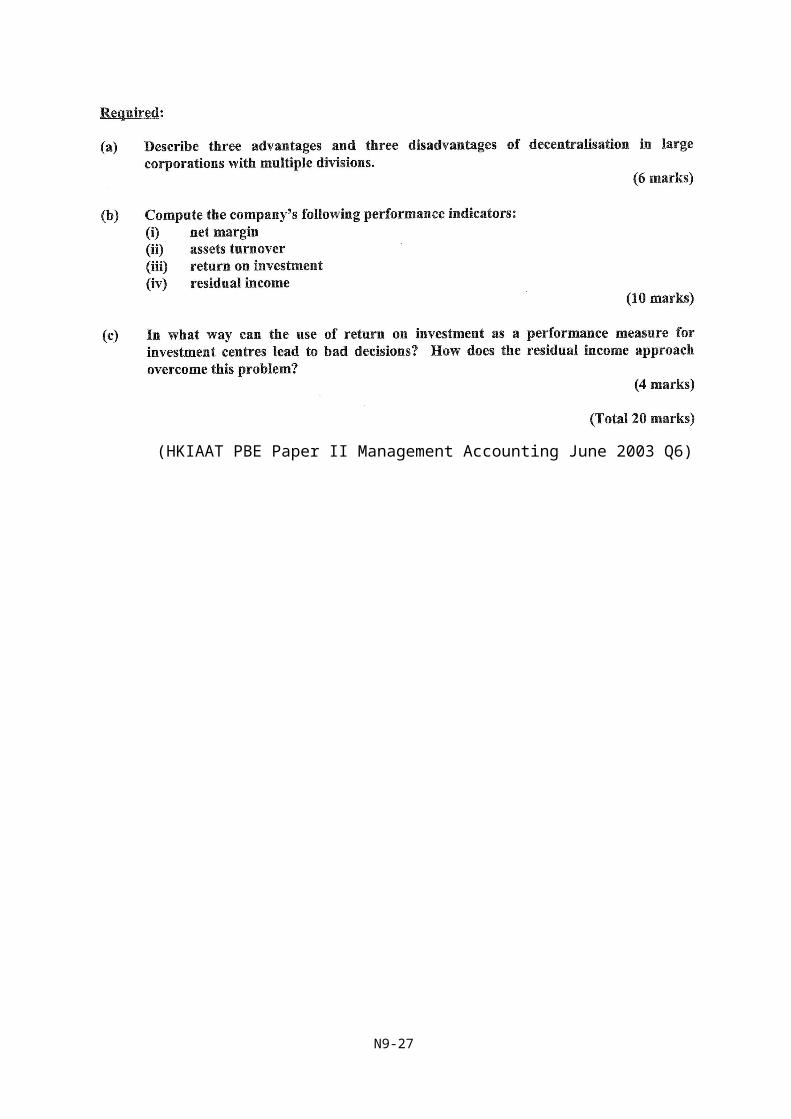
Question 4
(HKIAAT PBE Paper II Management Accounting December 2003 Q3)
N9-22
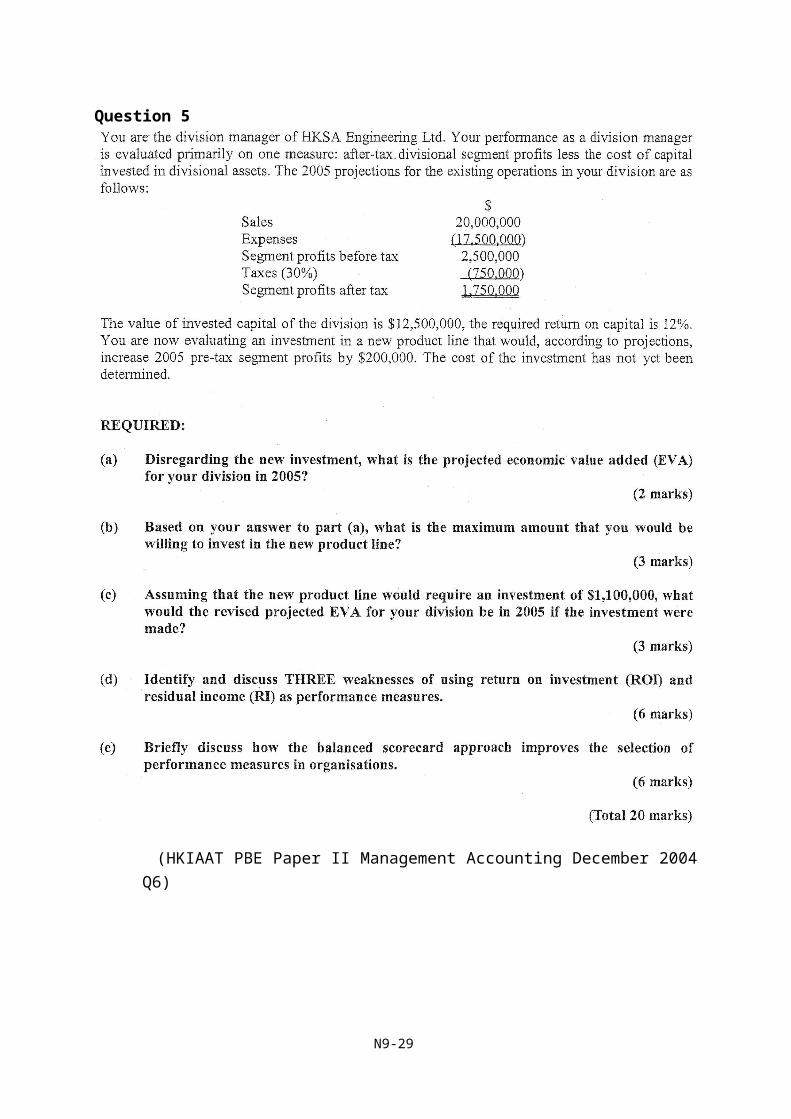
Question 5
(HKIAAT PBE Paper II Management Accounting December 2004 Q6)
N9-23
Question 6 – Balanced scorecard
(HKIAAT PBE Paper II Management Accounting June 2005 Q6)
N9-24

Question 7
N9-25
(HKIAAT PBE Paper II Management Accounting December 2005 Q1)
N9-26
Question 8Rising Star Ltd has several divisions which operate as investment centres. The divisional managers have the authority to purchase and dispose of all fixed assets. The minimum required rate of return used in evaluating the performance of divisional managers is 20%. The management accountant has just completed the following divisional accounts for 2006:
N9-27
(HKIAAT PBE Paper II Management Accounting December 2006 Q5)
Question 9
(Total 20 marks)(HKIAAT PBE Paper II Management Accounting and Finance June 2009 Q6)
N9-28
Question 10
(Total 20 marks)(HKIAAT PBE Paper II Management Accounting and Finance December 2010 Q6)
N9-29
Question 11
(HKIAAT PBE Paper II Management Accounting and Finance December 2014 Q5)
N9-30