chapter 9 cyclones - san diego state university
TRANSCRIPT

from Perilous Earth: Understanding Processes Behind Natural Disasters, ver. 1.0, June, 2009 by G.H. Girty, Department of Geological Sciences, San Diego State University Page 1
Chapter 9 Cyclones

from Perilous Earth: Understanding Processes Behind Natural Disasters, ver. 1.0, June, 2009 by G.H. Girty, Department of Geological Sciences, San Diego State University Page 2
Introduction The Earth’s atmosphere is subdivided into five distinctive elevation‐dependent zones or
layers. Cyclones are disturbances of the lowest level of these five zones. Below I first review the structure of the atmosphere, and then cover the Hadley, Ferrel, and Polar cells. I then discuss jet streams and the development of thunderstorms, and then the two end member varieties of cyclones, tropical and mid‐latitudinal. I close this chapter with a review of cyclonic hazards.
The Earth’s Atmosphere The Earth’s atmosphere extends from sea level to about 10,000 kilometers (~6,214
miles) (Figure 1). It consists of about 78% N, 21% O, 0.93% Ar, 0.038% CO2, and trace amounts of Ne, He, CH4, H2O, Kr, H, Xe, and O3. However, 97% of the mass of the atmosphere is contained within its lower 80 kilometers. Within this lower interval, the atmosphere is subdivided into the troposphere, stratosphere, and mesosphere.
The troposphere extends from sea level to a height of about 8‐17 kilometers (~5‐11 miles) (Figure 1). Within the troposphere temperature decreases with height, and as a result, air masses within the atmosphere are unstable. In fact, the weather of planet Earth is controlled by the movement and location of unstable air masses within the troposphere. In other words, it is within the troposphere where cyclones, the subject of this chapter, are born and die.
Figure 1. The structure of the Earth’s atmosphere
Separating the troposphere from the overlying stratosphere is the tropopause (Figure 1). The stratosphere extends from the tropopause to about 50 kilometers above sea level. Within the stratosphere temperature increases with elevation, and as a result, air in the stratosphere is relatively stable. The ozone layer lies within the stratosphere and contains
from Perilous Earth: Understanding Processes Behind Natural Disasters, ver. 1.0, June, 2009 by G.H. Girty, Department of Geological Sciences, San Diego State University Page 3
greenhouse gases like H2O and O3 that absorb radiate heat from the sun thereby warming the atmosphere.
Overlying the stratosphere is the mesosphere. It extends to an elevation of about 80 kilometers (~50 miles), and is separated from the underlying stratosphere by the stratopause (Figure 1). Within the mesosphere the temperature decreases with elevation.
The thermosphere overlies the mesosphere and extends to about 640 kilometers (~398 miles) elevation. It in turn is overlain by the exosphere which extends to about 10,000 kilometers (~6,214 miles) (Figure 1). The exosphere is the last layer of the atmosphere of planet Earth prior to entering the vacuum of interplanetary space. Within it gas molecules, such as H and He, occur in very small amounts, and are constantly escaping into space.
Air Movement within the Troposphere The temperature at the equator is significantly warmer then at the poles, and, as a
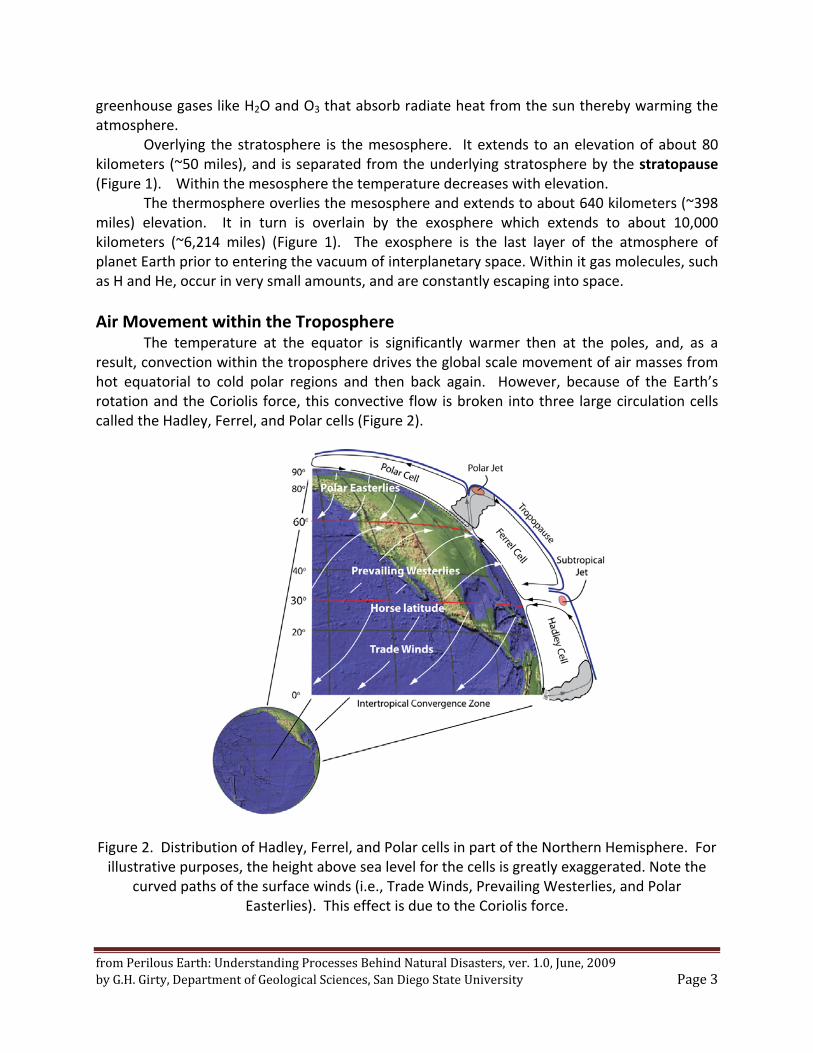
result, convection within the troposphere drives the global scale movement of air masses from hot equatorial to cold polar regions and then back again. However, because of the Earth’s rotation and the Coriolis force, this convective flow is broken into three large circulation cells called the Hadley, Ferrel, and Polar cells (Figure 2).
Figure 2. Distribution of Hadley, Ferrel, and Polar cells in part of the Northern Hemisphere. For illustrative purposes, the height above sea level for the cells is greatly exaggerated. Note the
curved paths of the surface winds (i.e., Trade Winds, Prevailing Westerlies, and Polar Easterlies). This effect is due to the Coriolis force.

from Perilous Earth: Understanding Processes Behind Natural Disasters, ver. 1.0, June, 2009 by G.H. Girty, Department of Geological Sciences, San Diego State University Page 4
As air masses move within and from the Hadley, Ferrel, and Polar cells their movement is also driven by differences in atmospheric pressure. In fact, as a general rule, air masses flow from areas of high pressure to areas with lower pressure. The force causing this to happen is the pressure‐gradient force. However, as the air masses move from region to region, the Earth rotates beneath them, forcing the wind to follow a curved path. In the Northern Hemisphere, the wind is deflected to the right of its direction of motion (Figure 2), while in the Southern Hemisphere it is deflected to the left. This effect is referred to as the Coriolis force. At the equator the Coriolis force is zero.
With the above as background, let’s now take a look at the structure and processes operating within the Hadley, Ferrel, and Polar cells. The Hadley Cell
Within low pressure regions at the equator, warm moist air masses are heated by the sun’s radiate energy and begin to rise toward the tropopause (Figure 2). As they move upward they are carried in a poleward direction in both the northern and southern hemispheres. As the equatorial moist air masses rise water vapor condenses, and eventually is returned back to the Earth’s surface or oceans as precipitation. Hence, equatorial regions of the tropics receive significant annual rainfall.
As the equatorial air masses lose their moisture and continue to travel upward and poleward, they become dryer, cooler, and denser. Because of this change in character, at about 30o N and 30o S latitude (the Horse latitudes), the migrating air masses begin to descend within areas of high pressure (Figure 2). Most of the non‐polar desert regions of the world lie between about 20o and 30o N and S latitude due to this effect.
Because of the ascension of air mass in equatorial regions, some of the descending air masses at the Horse latitudes in both hemispheres are drawn back toward the equator to form the Intertropical Convergence Zone (ITCZ), and in doing so complete the so called Hadley Cell (Figure 2). The Trade Winds in both hemispheres are a key element of this process as they represent equatorially bound surface winds of the Hadley Cell. Because of the ITCZ, a narrow band of clouds and thunderstorms typically encircles equatorial portions of the globe. The Polar Cell At the poles air masses are cool and dry. As they move southward or northward in the northern and southern hemispheres respectively, they encounter significantly warmer poleward flowing air masses not caught up in the equatorial return flow of the Hadley Cell (Figure 2). As a result of this convergence, warm moist air is lofted toward the tropopause at about 60o N and S latitudes. As the relatively warm moist air rises toward the tropopause it undergoes condensation and then precipitation, and then some of it moves poleward and some of it flows back toward the Horse latitudes (Figure 2). As the moisture free air reaches the poles it is significantly colder and dryer, and, as a result it descends within a high pressure polar region and then turns and flows back toward about 60o latitude as the Polar Easterlies in both the northern and southern hemispheres (Figure 2). As described above, the Polar and Hadley cells exist because of the thermal conditions at the Earth’s surface. They are an attempt to redistribute the heat received at equatorial

from Perilous Earth: Understanding Processes Behind Natural Disasters, ver. 1.0, June, 2009 by G.H. Girty, Department of Geological Sciences, San Diego State University Page 5
regions from the radiant energy of the Sun across the surface of the Earth. Caught between these two cells is the Ferrel Cell. The Ferrel Cell
The Ferrel Cell, a secondary circulation feature, is sometimes referred to as a zone of mixing. As shown in Figure 2, in its southern extent it overrides the Hadley Cell, and in its northern extent it overrides the Polar Cell. Some of the air within the Hadley cell descending at the Horse latitudes continues poleward at the Prevailing Westerlies where at about 60o N and S latitude it encounters cold dry polar air moving toward the equator (Figure 2). These cold dry winds force the poleward flowing warmer air masses upward where they condense and eventually lose their moisture as precipitation. Some of the resulting dry air moves poleward, and some flows back toward the Horse latitudes where it again descends within high pressure cells, and thus closes the loop of the Ferrel Cell.
Jet Streams Jet streams are relatively narrow fast flowing air currents occurring near the tropopause
(Figure 2). They occur near boundaries of air masses with significant differences in temperature, traveling, by definition, at speeds in excess of 94 kilometers per hour (57 miles per hour). They are known in some cases to have reached speeds of nearly 500 kilometers per hour (300 miles per hour). The dimensions of a typical jet stream vary from hundreds to thousands of kilometers (miles) in length, 160 to 500 kilometers (100‐300 miles) in width, and about a kilometer in depth (~0.62 miles).
Where two air masses of significantly different temperature and density meet, the resulting pressure difference between the two air masses is greatest at the highest elevations. This pressure difference causes air to flow from the warm toward the cold air mass. In the Northern Hemisphere, the Coriolis force causes the warmer flowing air mass to be strongly deflected to the right parallel to the boundary between the two air masses of significantly different temperature and density. For example, the Polar jet lies parallel to and above the Polar front, the area where cold dry Polar air flowing toward the equator meets poleward moving warmer moist air, i.e., between the Polar and Ferrel cells. As a result, the poleward flowing warm moist air is deflected strongly to the right, and thus moves from west to east. A similar effect is responsible for the Subtropical jet (Figure 2).
The Polar jet lies at an elevation between ~ 7 and ~12 kilometers (~4.4 ‐ ~7.5 miles), while the Subtropical jet lies between ~10 and ~16 kilometers (~6.2 ‐ ~9.9 miles) elevation. The paths of both the Polar and Subtropical jets are meandering and at various times and locations they merge and then separate. The fastest flowing portions of the jet streams, i.e., the positions of peak winds in the jets, are called jet streaks.
Thunderstorms A thunderstorm can develop both over the oceans and over land masses. When they
develop over tropical oceans, they may lead to the development of a tropical cyclone, and when they develop over land masses as part of a frontal system associated with the development of a mid‐latitude cyclone, they may span tornadoes. Regardless of which

from Perilous Earth: Understanding Processes Behind Natural Disasters, ver. 1.0, June, 2009 by G.H. Girty, Department of Geological Sciences, San Diego State University Page 6
environment they form in, thunderstorms commonly undergo three stages of evolution referred to as the cumulus, mature, and dissipation stages (Figure 3).
Figure 3. The three stages of formation of a thunderstorm are tower cumulous, cumulonimbus (mature), and dissipation. Arrows are directions of updraft and downdraft. Modified from
illustrations at http://www.srh.weather.gov/srh/jetstream/tstorms/life.htm.
During the cumulus stage moist air is lifted upwards, rapidly cools into liquid drops of water, resulting in the formation of a tower cumulus cloud (Figure 3). As water vapor condenses, latent heat is released warming the air, and causing it to become less dense than the surrounding dryer air. Latent heat, in the context of this discussion, is the amount of energy released as water vapor, a gas, is transformed to a liquid, and thus undergoes a change in state. As a result of the warming effect produced by latent heat, the air rises as a convective driven updraft. The movement of air upward produces beneath the forming thunderstorm a low‐pressure zone.
During the mature stage, the warmed air produced during the cumulus stage continues to rise until it reaches air that is warmer than it is. Commonly this happens at the tropopause. Once the ascension of the rising air mass has been arrested, it spreads out into a characteristic anvil shape (Figure 4). At this stage in development of a thunderstorm, the cloud is called cumulonimbus.
Within cumulonimbus clouds both updrafts and downdrafts are present, producing considerable internal turbulence (Figures 3 and 4). Lightening and high winds are manifestations of this turbulence. If there is considerable wind shear present, then the downdraft may separate from the updraft, and the storm may be transformed into a supercell, a deep continuously‐rotating updraft. If this happens, then the mature stage can be sustained for several hours.

from Perilous Earth: Understanding Processes Behind Natural Disasters, ver. 1.0, June, 2009 by G.H. Girty, Department of Geological Sciences, San Diego State University Page 7
Figure 4. Cumulonimbus cloud with well developed anvil shape. Photograph by H. Campbell, NOAA.
During the dissipation stage, the thunderstorm is dominated by the downdraft (Figure
3). During this process the downdraft pushes down out of the cloud, and spreads outward cutting off the inflow to the thunderstorm.
Cyclones Due to the pressure‐gradient force air always flows from high pressure regions to areas
of low pressure. This movement of air is in fact what we experience as wind. As noted earlier in this chapter, high pressure regions are areas where air is descending, while low pressure areas are where air is ascending. At the surface, as air flows into low pressure regions from the north and south, as for example at the Horse latitudes, due to the Coriolis force its path in the direction of flow is bent to the right in the Northern hemisphere and to the left in the Southern Hemisphere (Figure 2). The amount of deflection from the Coriolis force is dependent upon the speed of the moving air mass and its latitude. In general, air masses moving relatively slowly are deflected smaller amounts than are air masses with greater speeds. In addition, an air mass moving at a given speed at the poles will be deflected more than a similar air mass at the equator moving at the same speed. In short, as a result of the sum of the pressure‐gradient and Coriolis forces, the air mass swirls about the low pressure region in an anticlockwise fashion in the Northern Hemisphere and in a clockwise fashion in the Southern Hemisphere. Such swirling masses of air are called cyclones.
Technically, a cyclone is an area of closed, circular atmospheric motion rotating in the same direction as the Earth. As viewed from the North Pole, the Earth rotates counterclockwise. Hence, cyclones in the Northern Hemisphere rotate counterclockwise and in the Southern Hemisphere they rotate clockwise.

from Perilous Earth: Understanding Processes Behind Natural Disasters, ver. 1.0, June, 2009 by G.H. Girty, Department of Geological Sciences, San Diego State University Page 8
Tropical Cyclones Meteorologists recognize several different varieties of cyclones. Here I will first discuss
tropical cyclones, and then I will consider mid‐latitude cyclones. Tropical cyclones are warm‐core storm systems that form almost exclusively in tropical
regions around the globe. However, depending upon their location they are referred to by different names. For example, in the Atlantic and eastern Pacific they are called hurricanes, and in the western North Pacific and Philippines they are called typhoons. In other locations around the globe they are simply called by their generic name, i.e., cyclones.
Tropical cyclones like those in the Atlantic commonly begin as a complex of thunderstorms that evolve into a weak tropical depression (Figure 5), i.e., an organized weather system composed of clouds and thunderstorms with a defined circulation, and maximum sustained
winds of 61 kilometers per hour (38 miles per hour) or less. If sustained wind speeds within the depression reach at least 63 kilometers (39 miles) per hour, then it is classified as a tropical storm. For a tropical storm to reach hurricane or typhoon status sustained wind speeds must reach 117 kilometers (73 miles) per hour or more.
In order for a tropical cyclone to form from the above sequence of events there are four general conditions that must be met. These conditions are (1) the water temperature must be at least 26.5oC (80oF), (2) high relative humidity must exist in the lower and middle troposphere, (3) low amounts of wind shear must be present, and (4) the above conditions must form more than 555 kilometers (5 degrees of latitude) from the equator. If these conditions are met, then there is a probability, but not a certainty, that a genetic tropical cyclone will form.
When water temperatures are above 26.5oC, the overlying atmosphere tends to be unstable enough to sustain convection and thunderstorm development. If, at the same time,
Figure 5. Tropical depression encircled in Red. Photograph from NOAA. there is high relative humidity, then there will be a lack of evaporation of moisture from clouds, and thus they will carry more water vapor as they rise. This point is significant because to form

from Perilous Earth: Understanding Processes Behind Natural Disasters, ver. 1.0, June, 2009 by G.H. Girty, Department of Geological Sciences, San Diego State University Page 9
rain, water vapor must condense to a liquid form, and this process releases large amounts of latent heat, and thus warms up the surrounding atmosphere.
If there is little or low amounts of wind shear, then the latent heat produced during the production of rain will be localized rather than spread out. Because the warmed air is less dense than the atmosphere surrounding the developing storm it rises and expands. This process in turn draws more surface air from outside the growing storm into its center to replace the ascending moist air mass. Hence, the surface pressure beneath the rising moist air mass decreases as air converges toward the growing storm center, and, as a result, a large pressure gradient is set up between the top and bottom parts of the rising air mass.
If the above conditions develop at a distance of at least 555 kilometers (345 miles) from the equator, then because of the low pressure conditions at the bottom of the growing storm surface air masses will continue to converge toward its center causing even more moist air to rise (Figure 6). As the warm moist air is lofted above the ocean surface it cools and condenses forming more precipitation. The above cycle repeats itself over and over intensifying the storm, and, unless other factors come into play such as encountering land, cold water, or high wind shear, eventually leads to the development of a tropical cyclone. However, if the storm develops less than 555 kilometers from the equator, then the Coriolis force is not great enough to produce a rotation, and a cyclone will not evolve from the conditions described above.
Figure 6. Elements of a severe tropical cyclone. A‐A‐ is schematic. NOAA photograph.

from Perilous Earth: Understanding Processes Behind Natural Disasters, ver. 1.0, June, 2009 by G.H. Girty, Department of Geological Sciences, San Diego State University Page 10
At the center of a cyclone is the eye (Figure 6), a calm and cloudless circular region that depending upon the size of the cyclone can be anywhere from 20 to 50 kilometers (~12 – ~31 miles) in diameter. The eye is the result of the strongly converging surface winds and the Coriolis force which deflects them to the right. This force is balanced by the pressure‐gradient force, and, as a result, the converging air masses never reach each other, and the eye, a region of very low pressure and low wind speeds forms.
A circular area of strong thunderstorms surrounding the eye makes up the eyewall (Figure 6). The greatest wind speeds and the heaviest precipitation occur within the eyewall. As air rises within the eyewall some of it diverges from the eye, while other parts of it converge toward the center of the eye. The converging air is forced downward, and, as a result, it compresses and warms enough to evaporate any moisture in the atmosphere leaving the eye free of clouds.
Radiating outward from the eyewall of a cyclone are bands of clouds that make up the so called spiral rain bands or simply spiral bands (Figure 6). Intervening between the bands of clouds are areas where no clouds are present and hence no rain fall occurs. Each band of rain clouds represents an area where air is rising and water vapor is condensing, and each intervening cloudless region is an area where air is descending.
Hurricanes are classified on the basis of their greatest sustained wind speed into 5 categories with category 1 being the weakest and category 5 the strongest. Category 1 hurricanes have sustained winds of ~119 ‐ ~153 kilometers per hour (74‐95 miles per hour), category 2 hurricanes have sustained winds of ~154.5 – ~177 kilometers per hour (96‐110 miles per hour), category 3 hurricanes have sustained winds of ~178.6 ‐ ~209 kilometers per hour (111‐130 miles per hour), category 4 hurricanes have sustained winds of ~210.8 –~ 249 kilometers per hour (131‐155 mile per hour), and category 5 hurricanes have sustained winds that are greater than or equal to ~249 kilometers per hour (≥ 155 miles per hour). There have been three category 5 hurricanes that made landfall in the United States. They are an unnamed hurricane that came ashore in the Florida Keys in 1935, Hurricane Camille in 1969, and Hurricane Katrina in 2004.
According to the United States National Hurricane Center, National Oceanic and Atmospheric Administration (NOAA), the hurricane season in the Atlantic, Caribbean, and Gulf of Mexico runs from June 1 to November 30. In contrast, in the eastern Pacific it runs from May 15 to November 30, and in the central Pacific from June 1 to November 30.
For an additional perspective on how tropical cyclones form please consult the following web site.
http://ww2010.atmos.uiuc.edu/(Gh)/guides/mtr/hurr/grow/home.rxml
Mid‐Latitudinal Cyclones
A mid‐latitude cyclone (or cold‐core cyclone) is an area of low pressure lying between 30o and 60o N and S latitude. Such cyclones are sometimes referred to as frontal cyclones as they initiate at a sharp localized gradient in atmospheric temperature, i.e., a front. They can reach 2000 kilometers (~1243 miles) in diameter.
from Perilous Earth: Understanding Processes Behind Natural Disasters, ver. 1.0, June, 2009 by G.H. Girty, Department of Geological Sciences, San Diego State University Page 11
Mid‐latitude cyclones may form as a result of tropical cyclones moving northward above the Horse latitudes or as the result of equatorial flowing air masses of the Polar cell interacting with poleward moving air masses of the Ferrel cell. The latter variety occurs much more often than do tropical cyclones, and produce the weather over much of the Earth. For example, from fall through winter and into the spring, mid‐latitude cyclones dominate the weather across much of the United States as well as other parts of the globe. Such storms generally move from west to east across the North American continent, and consist of a low atmospheric pressure center with winds spiraling counterclockwise. In the Southern Hemisphere, the winds spiral clockwise about the low atmospheric pressure center.
There are two prominent models used to describe the development of mid‐latitudinal cyclones; the Norwegian and Shapiro‐Keyser models. Below I only consider the former as it describes well cyclone development over a continent like North America. You can find a summary of the differences between the two models at the following web site.
http://en.wikipedia.org/wiki/Extratropical_cyclone
Fronts are classified on the basis of which type of air (warm or cold) is replacing the
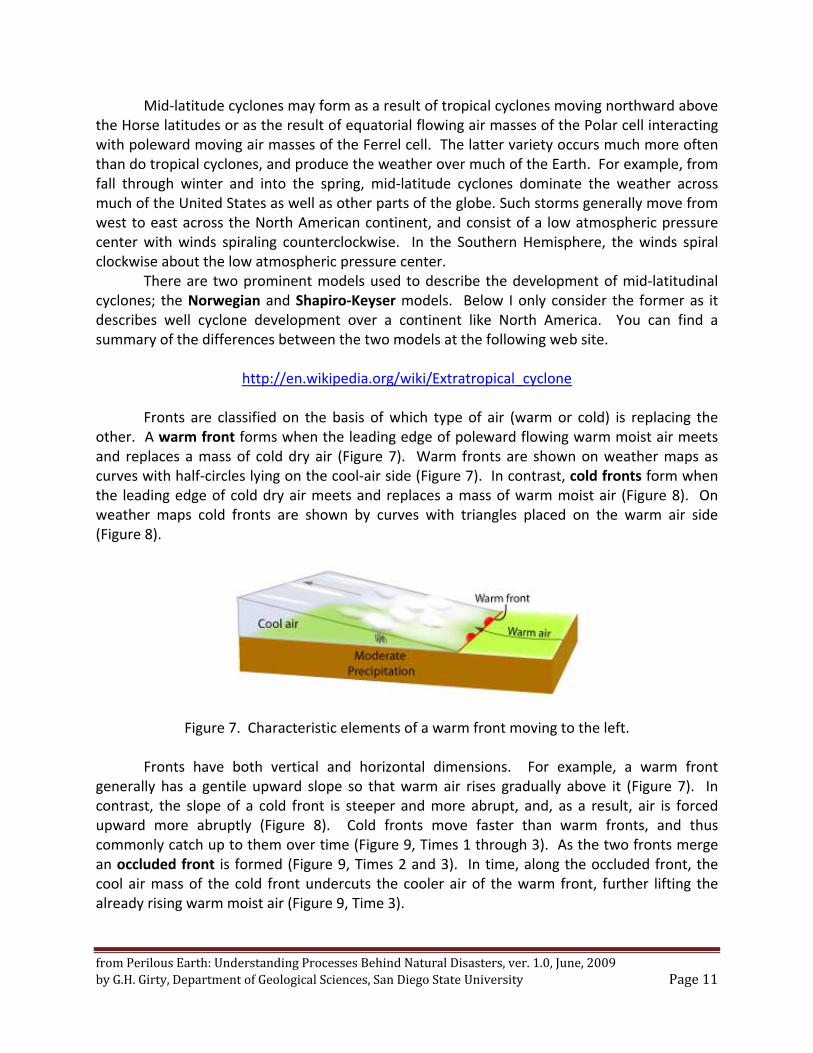
other. A warm front forms when the leading edge of poleward flowing warm moist air meets and replaces a mass of cold dry air (Figure 7). Warm fronts are shown on weather maps as curves with half‐circles lying on the cool‐air side (Figure 7). In contrast, cold fronts form when the leading edge of cold dry air meets and replaces a mass of warm moist air (Figure 8). On weather maps cold fronts are shown by curves with triangles placed on the warm air side (Figure 8).
Figure 7. Characteristic elements of a warm front moving to the left.
Fronts have both vertical and horizontal dimensions. For example, a warm front generally has a gentile upward slope so that warm air rises gradually above it (Figure 7). In contrast, the slope of a cold front is steeper and more abrupt, and, as a result, air is forced upward more abruptly (Figure 8). Cold fronts move faster than warm fronts, and thus commonly catch up to them over time (Figure 9, Times 1 through 3). As the two fronts merge an occluded front is formed (Figure 9, Times 2 and 3). In time, along the occluded front, the cool air mass of the cold front undercuts the cooler air of the warm front, further lifting the already rising warm moist air (Figure 9, Time 3).

from Perilous Earth: Understanding Processes Behind Natural Disasters, ver. 1.0, June, 2009 by G.H. Girty, Department of Geological Sciences, San Diego State University Page 12
Figure 8. Characteristic elements of a cold front moving to the right. Along the cold front thunderstorms are shown in development as a series of cumulonimbous clouds.
Figure 9. Mid‐latitude cyclone. Upper part of each time interval is characteristic weather map.
Lower part is cross section through atmosphere along indicated line.
A common scenario leading to a mid‐latitude cyclone is the formation of a warm front. In the Northern Hemisphere as the mass of warm moist air of the Ferrel Cell moves northward, cold dry air from the Polar cell flows in behind and below it forming a cold front (compare

from Perilous Earth: Understanding Processes Behind Natural Disasters, ver. 1.0, June, 2009 by G.H. Girty, Department of Geological Sciences, San Diego State University Page 13
Figure 9 – Time 1 and Figure 10). This geometry results in a low pressure region lying between the two frontal systems. As the warm front moves northward, the cold front moves southward and the two systems wrap around the low pressure region in a counter clockwise direction (compare Figure 9 – Times 2 and 3 and Figure 10).
Figure 10. Developing characteristics of a mid‐latitude cyclone in the United States. Image corresponds approximately to Time 1 in Figure 9.
After reading through the material in this section, if you do not yet understand the basic
components of mid‐latitude cyclones, then I encourage you to read through the discussion provided by NOAA at the following web site:
http://oceanservice.noaa.gov/education/yos/resource/JetStream/synoptic/cyclone.htm
While reviewing the NOAA material, pay particular attention to the beautiful but simple 3D illustrations. Summary Though both tropical and mid‐latitudinal cyclones form over lower pressure centers, they differ in several ways. For example, tropical cyclones form over an ocean in tropical latitudes, and are warmest in their centers, i.e., they are warm‐core cyclones. They do not involve the formation of fronts, and the strongest winds develop near the Earth’s surface. In contrast, mid‐latitudinal cyclones form outside the tropics, normally between about 30o and 60o N and S latitude, and have a center that is colder than the air surrounding the storm, i.e., they are cold‐core cyclones. Most mid‐latitudinal cyclones form as a result of moving fronts, and have the strongest winds in the upper atmosphere.

from Perilous Earth: Understanding Processes Behind Natural Disasters, ver. 1.0, June, 2009 by G.H. Girty, Department of Geological Sciences, San Diego State University Page 14
Cyclonic Hazards Tropical Cyclones
Hazards associated with tropical cyclones occur as a result of high wind speeds, storm surge, and flooding. Winds associated with cyclones obtain speeds ranging from ~119 kilometers per hour (74 miles per hour) to greater than ~249 kilometers per hour (155 miles per hour). When a cyclone comes ashore in the Northern Hemisphere winds rotate counterclockwise. In addition, the center of the cyclone is moving at a certain velocity. For example, consider the hypothetical cyclone moving at 20 knots due northward in the Northern Hemisphere in Figure 11. For reference, 96 knots equals 111 miles per hour (~178.64 kilometers per hour). Winds are rotating about the eye at a velocity of 70 knots. When the hurricane reaches land, which side of the cyclone would have the highest wind velocity?
Recall that a vector has both magnitude and direction. Conventionally, a vector is shown as an arrow, with its length being equal to magnitude and its orientation being the direction. As shown in Figure 11, the vector for the winds velocity on the east side of the cyclone points in the same direction as the vector for the velocity of the hurricane as it moves from south to north. Hence, these two vectors add together, and indicate that the wind velocity on the east side of the cyclone would be 90 knots. In contrast, the vector for the wind velocity on the west side points in the opposite direction of the vector for the 20 knot velocity of the cyclone. Thus, we have to subtract the velocity of the cyclone from the winds velocity resulting in a 50 knot wind on the west side of the hurricane as it comes ashore. Clearly, areas on the east side of a hurricane, cyclone, or typhoon in the Northern Hemisphere are the most dangerous. If the cyclone was in the Southern Hemisphere, which side would have the highest wind velocities?
Figure 11. Illustration of variation of wind speed on opposite sides of cyclone in the Northern
Hemisphere.

from Perilous Earth: Understanding Processes Behind Natural Disasters, ver. 1.0, June, 2009 by G.H. Girty, Department of Geological Sciences, San Diego State University Page 15
As shown in Table 1, Category 5 hurricanes have wind speeds that are powerful enough to cause extensive damage to most homes and industrial buildings, and can completely level smaller structures. In addition, the storm surge can become quite large for both category 4 and 5 hurricanes. Storm surge is the rise of sea level brought on by low pressure, high winds, and large waves as hurricanes, typhoons, and cyclones make landfall.
Table 1. Saffir‐Simpson Hurricane Damage‐Potential Scale
Scale # Wind Speeds Storm Surge Observed Damage
Category 1 74‐95 mph 64‐82 knots
4‐5 feet ~1.5 meters
Some damage to trees, shrubbery, and unanchored mobile homes
Category 2 96‐110 mph 83‐95 knots
6‐8 feet ~2.0‐2.5 meters
Major damage to mobile homes; roofs of buildings damaged, trees blown down
Category 3 111‐130 mph 96‐113 knots
9‐12 feet ~2.5‐4.0 meters
Mobile homes destroyed; large trees blown down; small buildings damaged
Category 4 131‐155 mph 114‐135 knots
13‐18 feet ~4.0‐5.5 meters
Mobile homes completely destroyed; lower floors of structures near shore are susceptible to flooding
Category 5 >155 mph >135 knots
>18 feet >5.5 meters
Extensive damage to homes and industrial buildings; small buildings blown away; lower floors of structures within 500 meters of shore and less than 4.5 meters (15 feet) above sea level are damaged.
The high winds occurring on the east side of a hurricane in the Northern Hemisphere
that were described earlier in this chapter push more water shoreward than do the winds on the west side and thus can cause extensive coastal flooding. In addition, within the eye of the hurricane, pressures are significantly lower than in the exterior portions of the storm. As a result, the sea surface may actual be as much as about 0.5 meters (~1.64 feet) higher within the eye. Hence, as the eye of the storm comes ashore it brings with it flooding while the high wind speeds accompanying the hurricane create waves varying in height from 1 to up to 10 meters (i.e., ~3.28 to over ~32.8 feet high).
Mid‐latitudinal Cyclones The types of weather associated with mid‐latitudinal cyclones can vary greatly, ranging from mild weather with little rain to cold weather with torrential rains and wind speeds exceeding 119 kilometers per hour (74 miles per hour). Associated with the warm front is a

from Perilous Earth: Understanding Processes Behind Natural Disasters, ver. 1.0, June, 2009 by G.H. Girty, Department of Geological Sciences, San Diego State University Page 16
band of precipitation that can be extensive, and depending upon the season can produce either heavy rainfall or snowfall (see Figures 7 and 9). In contrast, bands of thunderstorms, sometimes called squall lines, can form ahead of a cold front (see Figures 8 and 9). Within the squall lines hail and high winds commonly occur. If significant wind shear exists in the atmosphere ahead of a cold front, then in the presence of a strong upper level jet stream tornadoes also may form. The greatest number of tornadoes spanned in this manner occurs in the Great Plains region of the United States.
Record Breaking Cyclones Tropical Cyclones On November 13, 1970, a tropical cyclone with 160 kilometers per hour (100 miles per hour) winds struck the Ganges Delta region of what is now Bangladesh, and left somewhere between 200,000 to 500,000 dead. This is the deadliest tropical cyclone on record. Though tropical cyclones (hurricanes) hit the southeastern and eastern United States fairly regularly, none have caused such severity. In fact, the most destructive in terms of physical damage in the history of the United States is hurricane Andrew. It struck Florida and the Gulf Coast area causing an estimated $25 billion in damage. Though Hurricane Andrew was highly destructive, the Galveston Hurricane of 1900 came ashore as a Category 4 storm and killed somewhere between 6,000 and 12,000. It remains the deadliest storm in the history of the United States. However, hurricane Camille came ashore with 190 miles per hour (305 kilometers per hour) sustained winds and 210 miles per hour (335 kilometers per hour) gusts, and thus holds the record as the strongest tropical cyclone to ever hit land. Mid‐Latitudinal Cyclones
Perhaps the greatest mid‐latitudinal cyclone is the Great Storm of 1987 which occurred over the United Kingdom. During the Great Storm wind speeds reached 220 kilometers per hour (137 miles per hour), the highest ever recorded. The Great Storm produced widespread damage to homes, and destroyed some 15 million trees. During the storm, 19 lives were lost. The total cost of the Great Storm is estimated at $2.3 billion.
References Used in the Development of this Chapter Books and Articles Buckley, B., Hopkins, E.J., Whitaker, R., 2008, Weather, a visual guide, A Firefly Book, p. 303. Pidwirny, M., 2006, “The Mid‐Latitude Cyclone”, Fundamentals of Physical Geography, 2nd
Edition
Web http://ww2010.atmos.uiuc.edu/(Gh)/guides/mtr/hurr/grow/home.rxml
http://en.wikipedia.org/wiki/Jetstream

from Perilous Earth: Understanding Processes Behind Natural Disasters, ver. 1.0, June, 2009 by G.H. Girty, Department of Geological Sciences, San Diego State University Page 17
http://www.islandnet.com/~see/weather/elements/jetstream1.htm http://www.upto11.net/generic_wiki.php?q=tropical_cyclone http://en.wikipedia.org/wiki/Extratropical_cyclone http://www.usatoday.com/weather/wstorm.htm http://www.usatoday.com/weather/resources/basics/coriolis‐understanding.htm http://www.nhc.noaa.gov/aboutgloss.shtml http://www.aoml.noaa.gov/hrd/tcfaq/A7.html http://www.physicalgeography.net/fundamentals/7s.html http://news.bbc.co.uk/2/hi/science/nature/7533909.stm http://www.ems.psu.edu/~fraser/Bad/BadFAQ/BadCoriolisFAQ.html http://en.wikipedia.org/wiki/Thunderstorm http://en.wikipedia.org/wiki/Supercell http://www.jpl.nasa.gov/news/news.cfm?release=2006‐096 http://earthobservatory.nasa.gov/IOTD/view.php?id=8542 http://www.srh.weather.gov/srh/jetstream/tstorms/life.htm