chapter 8 spectroscopic and molecular structure...
TRANSCRIPT

CHAPTER 8
SPECTROSCOPIC AND MOLECULAR STRUCTURE
INVESTIGATION OF 4-METHYL-N-(4-NITROPHENYL)
BENZENE SULFONAMIDE BY DFT METHOD:
A COMBINED EXPERIMENTAL AND THEORETICAL STUDY
8.1 INTRODUCTION
Para-nitroaniline, a well known donor–acceptor system, with relatively
high nonlinearity was commonly used to design and synthesize molecules with
high electro-optic coefficients. It has attracted attention because of the specific
effects of an electron withdrawing nitro group and an electron donating amino
group being in para position at an aromatic ring system, showing a great nonlinear
susceptibility and making this molecule interesting for nonlinear optics [1].
Chis et al [2] reported Experimental (FT-Raman, SERS) and theoretical
(DFT) study on para-nitroaniline. Tanaka et al [3] have investigated the Raman
spectra of para nitroaniline in acetonitrile solution. Panunto et al [4]. studied the
crystal structure of para nitroaniline (monoclinic P21/n). Gustavo Pozzi et al [5]
described the use of crystal vibrational modes in the estimation of the anisotropic
displacement parameters of hydrogen atoms in
para-nitroaniline. Dhanya et al [6] reported ground state and excited state dipole
moments of alkyl substituted para-nitroaniline derivatives. G.C.Yang [7] reported
hyperpolarizabilities of para nitro aniline based on TDDFT–SOS method.
Katarzyna Piela et al [8] reported molecular motions contributions to
optical nonlinearity of N-benzyl-2-methyl-4-nitroaniline studied by temperature-
dependent FT-IR, 1H NMR spectroscopy and DFT calculations.
Please purchase PDF Split-Merge on www.verypdf.com to remove this watermark.

195
Experimental and theoretical study of the structure of N,N-dimethyl-4-
nitroaniline derivatives, vibrational spectra of the 2,6-dibromo-4-nitroaniline (2,6-
DB4NA) and 2-(methylthio)aniline have been studied by applying the DFT
calculations based on Becke3-Lee-Yang-Parr (B3LYP) level with 6–31G*[9].
4-Nitrobenzenesulfonyl groups as activating groups have also been
frequently used for the preparation of secondary amines both in solution- and
solidphase synthesis [10-13]. The X-ray crystallographic structure of
2-nitrobenzene sulfonamide was analyzed by Cheng et al. [14]. Tremayne et al.
[15] investigated the structures of three substituted arenesulfonamides which are 2-
toluenesulfonamide, 3-nitro benzene sulfonamide and 4-nitro benzene Sulfonamide
from X-ray powder diffraction data using the differential evolution technique and
refined by the Rietveld method. The single-crystal X-ray analysis of 4-nitro
benzene sulfonamide was performed by Zhou et al. [16]. De Benedetti et al and
M.M. Pomerantz et al reported FTIR and NMR spectra of 4-nitro benzene
sulfonamide [17,18]. M. Karabacak et al, studied spectroscopy studies of some
benzenesulfonamide derivatives by abinitio and DFT calculations [19, 20].
Derivatives of para-methyl-(para-nitrophenyl)benzene sulfonamide have
been used as starting materials for drugs, such as antagonists of the neurotensin
receptors [21] and microbicide compositions for agriculture and horticultural use
[22]. In addition, it has also been used to prepare dyes [23].
With the aid of above seen literatures, it is clear that there is no quantum
mechanical analysis on this 4M4NPBS molecule. Hence, a detailed vibrational
analysis has been carried out here for knowing the vibrational wavenumbers,
geometrical parameters, modes of vibrations, dipole moment, rotational constants,
atomic charges and other thermodynamic parameters of this molecule. These
Please purchase PDF Split-Merge on www.verypdf.com to remove this watermark.

196
parameters were investigated using B3LYP calculations with 6-31G(d,p) basis set.
Specific scale factors were also used and employed in the predicted frequencies.
8.2 SYNTHESIS
Para Nitroaniline (6.9 gm), Triethylamine (4 ml) were dissolved in acetone
(8 ml). To this solution, Para toluene sulfonyl chloride (9.53 gm) in acetone
(12.5 ml) was added in drops with continuous stirring for two hours. The resulting
solution was allowed to evaporate. The residue was washed several times with
water and then with petroleum ether solution (In the synthesis of the 4M4NPBS
reported earlier [24], pyridine was used as a catalyst and reactions subjected to
heating and cooling). The crude product of the title compound was recrystallized
from ethanol. After one week pale yellow crystals suitable for x-ray diffraction
studies were obtained. The scheme of the synthesis is shown in Figure 8.1.
8.3 SINGLE CRYSTAL X-RAY DIFFRACTION ANALYSIS
8.3.1 Crystal structure Determination
A crystal with dimensions of 0.30 x 0.20 x 0.20 mm was used for
collection of intensity data on a “Bruker Apex II CCD” area detector
diffractometer with graphite monochromatic MoKα radiation (0.71073) ω scan
technique. The programs used to solve and refine the structure were SHELXS-97,
SHELXL97 and PLATON [25,26]. The refinement was carried out by using the
Full matrix least square on F2. All non hydrogen atoms were refined
anisotropically. All hydrogen atoms have been geometrically fixed and refined
with isotropic thermal parameters.
Please purchase PDF Split-Merge on www.verypdf.com to remove this watermark.

Figure 8.1 Pathway synthesis of 4M4NPBS
CH3
SO2Cl
+
NH
CH3
SO2NHNO2
ACETONE
︵C 2H5 ︶3N2
NO2
Please purchase PDF Split-Merge on www.verypdf.com to remove this watermark.

197
8.2 CRYSTAL STRUCTURE ANALYSIS
The ORTEP [27] diagram of the title molecule showing 30% Probability
displacement ellipsoids is shown in Figure 2(a). From the single crystal analysis, it
was observed that the crystal belongs to monoclinic system with space group,
p21/C. Lattice parameters have been determined as a = 13.77 (13)Å, b=8.21(7)Å, c
= 11.93(10) Å, α = 90 o β= 103 o γ = 90o and the volume of the unit cells is found
to be 1314.5(4) Å3. In the crystal structure of the title compound C13H12N2O4S, the
mean plane distance between the dihedral angles (C6-C1-C2-C3) and (C12- C7-
C8-C9) of the nitrophenyl and tolyl ring is 86.14(2)⁰. This shows their non
coplanar conformation. This is in Contrast with the near coplanar conformation
reported for the crystal structure of 4-[(2-hydroxy-benzylidene)-amino]-N-(5-
methyl-isoxazol-3-yl)-benzenesulfonamide [28]. All the Caro-Caro bond lengths are
comparable to the reported mean values of Caro-Caro =1.380Å [29]. The atoms
around the sulphonamide, “S” atom in 4M4NPBS are arranged in a slightly
distorted tetrahedral configuration. The largest deviation is in the angle
O (2)-S (1)-O (1) of 120(3)°, but it conforms to the non-tetrahedral arrangement
commonly observed in sulfonamides [30,31]. The bond angle N1–S1–C1 of
106.04(9)° is correspondingly smaller than the tetrahedral value of 109° [32]. The
S1-C1 distance of 1.7547(13) Å is normal single bond values and agrees well with
those observed in other sulfonamides [33]. The torsion angle τ(C-S-N-C) defining
the conformation of the sulfonamide group is reported to lie in the range 60-90⁰
[34]. In the present crystal structure, the torsion angle
τ1 (C1-N1-S1-C7) is 65.94(14)°. The position of the methyl group C13 is defined
by the torsion angles τ1 (C13-C10-C11-C12) and τ2 (C8-C9-C10-C13) are
179.86(14)° and 178.93(16)° respectively. The molecules in the unit cell are
related to each other by inversion. In each molecule the tolyl ring and phenyl rings
are orthogonal to each other. In fact the phenyl ring is deviated from the planar
Please purchase PDF Split-Merge on www.verypdf.com to remove this watermark.

Table 8.1 Selected bondlengths and bondangles of 4M4NPBS
Parameter Experiment a Experiment B3LYP
Bond Lengths(Å) S1-O1 1.426(4) 1.426(11) 1.463 S1-O2 1.423(5) 1.429(12) 1.462 S1-N1 1.632(4) 1.636(13) 1.703 S1-C7 1.754 1.759(15) 1.788 O3-N2 1.216 1.214(18) 1.232 O4-N2 1.214(2) 1.222(17) 1.232 N1-C1 1.408 1.461(17) 1.398 N2-C4 1.453 1.411(17) 1.461 N1-H1 0.86 0.86(5) 1.013 C1-C6 1.391(19) 1.384(19) 1.405 C1-C2 1.394 1.375(2) 1.399 C7-C12 1.381 1.388(2) 1.398 C7-C8 1.383(16) 1.378(2) 1.393 C10-C13 1.499(14) 1.5(2) 1.508 Bond angles(°) O1S1O2 120 (3) 120(7) 122.6 O1S1N1 104.32(2) 104.2(7) 109.86 O1-S1-C7 108.35(10) 108.08 (7) 107.84 O2-S1-N1 109.04(11) 109.04(7) 102.11 O2-S1-C7 108.24(10 108.5 (7) 109.11 N1-S1-C7 106.04(9) 106.06(7) 103.91 S1-N1-C1 126.63 126.64(10) 128.68 O3-N2-O4 122.33 122.52(13) 124.45 O3-N2-C4 119.02 118.83(13) 117.81 O4-N2-C4 118.63 118.62(12) 117.73 N1-C1-C6 122.35 118.62(12) 122.94 N1-C1-C2 117.34 117.44(12) 117.62 Dihedral angles(°) O1S1N1C1 179.76 ‐179.7(12) 163.19 O2S1N1C1 50.4 ‐50.32(14) 32.03 C7S1N1C1 ‐65.94 65.85(13) ‐83.11 N1S1C7C8 122.52 ‐122.62(13) 116.23 O1S1C7C8 ‐125.97 125.89(13)) ‐135.34 O2S1C7C8 5.65 5.81(14) ‐0.34 O4N2C4C3 1.41 1.6(2) 0.156 O3N2C4C5 2.51 2.2(2) 0.156 C14‐C12‐C13‐C8 177.0(3) 176.4(3) 178
Please purchase PDF Split-Merge on www.verypdf.com to remove this watermark.

Figure 8.2(a) An ORTEP drawing of 4M4NPBS, with the atom numbering Scheme.
Displacement ellipsoids are drawn at the 30% Probability level
Figure 8.2(b) Optimised structure of 4M4NPBS with atom numbering obtained by
DFT/B3LYP 6-31G(d,p)
Please purchase PDF Split-Merge on www.verypdf.com to remove this watermark.

198
configuration by 0.03-1.51º, see Table 2. The nitro group is found out of plane by
4.0º, see Table 8.1.
8.3.3 Hydrogen Bonding and Molecular Packing
The crystal packing is stabilized by weak intermolecular
N-H…O interaction. An N-H-O bond links the molecules into infinite chains
running along the diagonal of the crystal plane is shown in Figure.3. The amino
nitrogen N1-H is involved in intermolecular interaction with nitro oxygen. The
amino nitrogen N1-H acts as donor with nitro oxygen O3 of symmetry related x, y,
z molecule. The weak inter and intramolecular interactions (N1-H1-O3), (C3-H3-
O4), (C5-H5-O1), (C6-H6-O2) and (C8-H8-O2) of the title compound obtained by
XRD are shown in the Table 8.2.
Several researchers (35, 36) have explained the changes in the frequency or
bond length of the C-H bond on substitution due to a change in the charge
distribution on the carbon atom of the benzene ring. The substituents may be either
of the electron withdrawing type (F, Cl, Br, NO2, etc) or electron donating type
(CH3, C2H5, NH2, etc). The carbon atoms are bonded to the hydrogen atoms with
σ bond in benzene and substitution of a NO2 group for hydrogen reduces the
electron density at the ring carbon atom.
The C-N bond length (1.4535) for 4M4NPBS (para nitro derivative) is
slightly lesser (1.4686) than that of the 4M3NPBS (meta nitro compound) because
of the meso meric effect operating in the para compound. Similarly the C-N bond
of C-NH2 is slightly decreased (1.413 for 4M3NPBS & 1.4080 for 4M4NPBS
compound) in length because of the same effect. Such a mesomeric effect is not
possible for the 4M3NPBS.
Please purchase PDF Split-Merge on www.verypdf.com to remove this watermark.
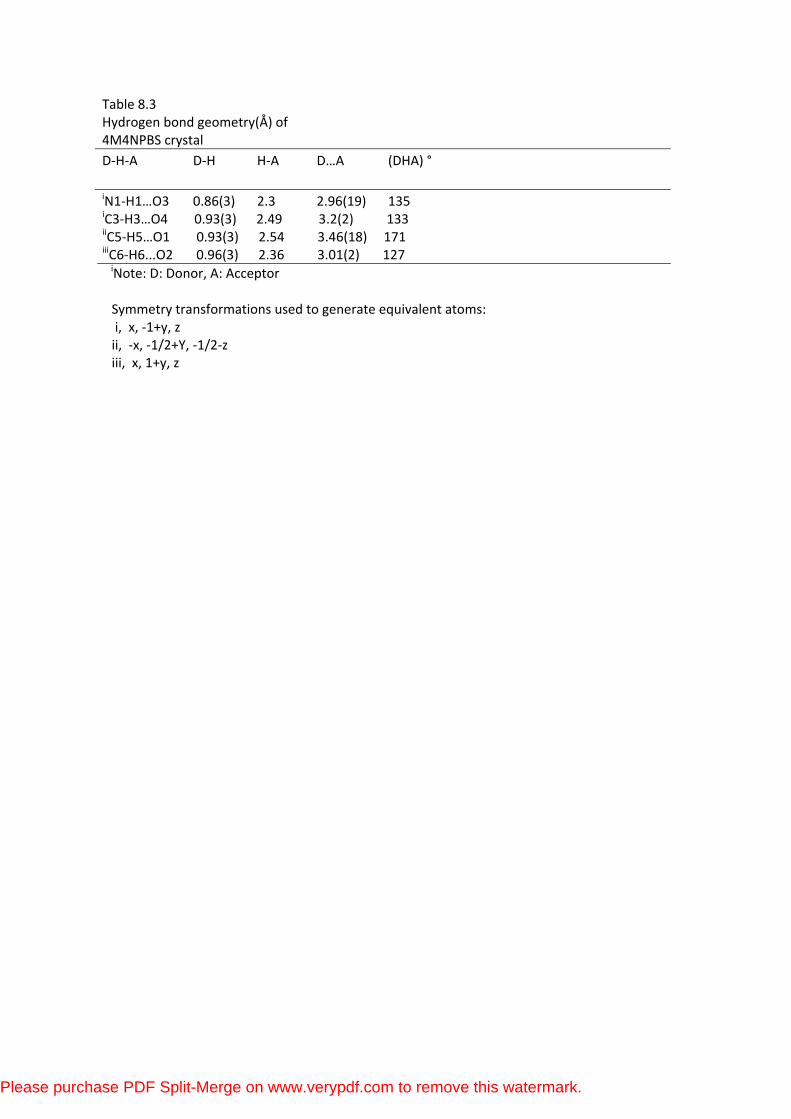
Table 8.3 Hydrogen bond geometry(Å) of 4M4NPBS crystal D‐H‐A D‐H H‐A D…A (DHA) ° iN1‐H1…O3 0.86(3) 2.3 2.96(19) 135
iC3‐H3…O4 0.93(3) 2.49 3.2(2) 133 iiC5‐H5…O1 0.93(3) 2.54 3.46(18) 171 iiiC6‐H6...O2 0.96(3) 2.36 3.01(2) 127 iNote: D: Donor, A: Acceptor
Symmetry transformations used to generate equivalent atoms: i, x, ‐1+y, z ii, ‐x, ‐1/2+Y, ‐1/2‐z iii, x, 1+y, z
Please purchase PDF Split-Merge on www.verypdf.com to remove this watermark.

Figure 8.3(a) Molecular Packing diagram of 4M4NPBS
Figure 8.3(b) Plot of Calculated Versus Experimental bond lengths
Please purchase PDF Split-Merge on www.verypdf.com to remove this watermark.

199
8.3.4 Geometrical Structure
The optimized geometry was obtained by the DFT levels of theory with 6-
31G(d,p) basis set [37-41 ] .The molecular structures of the title compounds with
numbering schemes for the atoms are given in Figure 8.2(b). At C1 position, the
bond angles N1–C1–C6, N1–C1–C2 and C2–C1–C6 are 122.94°, 117.62° and
120.64° respectively for B3LYP. These bond angles are in agreement with the
XRD data. This asymmetry in angles reveals the interaction between NH group
and phenyl ring. Further, the results of our calculations showed that S1–O1 and
S1–O2 bonds show typical double bond characteristics and all other bond lengths
fall within the expected range. The experimental bond lengths are slightly shorter
than that of theoretical values. Theoretical bond lengths vary ± .071 Å where
comparing with the XRD data and these differences are probably due to
intramolecular interactions in the solid state. Graphic correlation between
experimental versus theoretical bond lengths is shown in Figure 8.4. The values of
correlation coefficient provide good linearity between calculated and experimental
bond lengths (correlation coefficient R2 of .9866). It is observed that most of the
optimized bond angles are slightly larger than the experimental values, due to the
theoretical calculations belong to the isolated molecules in gaseous phase and the
experimental results belong to the molecules in solid phase. The bond angle (O1-S-
O2) varies 2.6° and (O3-N2-O4) deviates 2.12° from XRD data. In spite of the
differences, calculated geometric parameters represent a good approximation and
they are the bases for calculating other parameters such as vibrational frequencies
and thermodynamic properties.
Please purchase PDF Split-Merge on www.verypdf.com to remove this watermark.

200
8.4 VIBRATIONAL ASSIGNMENTS
The harmonic vibrational frequencies and intensity of the vibrational bands were
calculated by the DFT levels of theory with 6-31G(d,p) basis set. The detailed
interpretation of the vibrational spectra of 4M4NPBS has been made using VEDA
[42 ].
8.4.1 N-H Vibrations
As it is seen in Table 8.3, the N–H stretching mode, calculated as
3456 cm-1 is observed at 3436cm-1 in the FTIR spectrum. This difference between
experimental and calculated N–H stretching vibration (20 cm-1) can be due to
N–H–O strong intermolecular hydrogen bond which has not been taken into
consideration in the calculation. In the literature, some N-H stretching modes
observed experimentally for the different substituent sulfonamide are 3273, 3343
and 3284 cm-1 [43]. The N-H in-plane bending vibration is expected near
1400 cm-1. This vibration is usually masked by the strong intense band of CH3
asymmetric bending or SO2 asymmetric stretching. In the present case, 1403 cm-1
in the FTIR spectrum, 1433, 1369 and 1210 cm-1 theoretically are due to N-H in-
plane bending vibration. The modes 73 and 75 having wavenumbers 385 and 317
cm-1 are calculated to N-H out of plane bending vibration.
8.4.2 C-H Vibrations
Normally, the C-H stretching vibrations are observed around
3100-3000 cm-1 in aromatic molecules which is a ready identification of the
benzene structure [45, 46]. This must be due to one symmetric and two asymmetric
Please purchase PDF Split-Merge on www.verypdf.com to remove this watermark.

Table 8.4 Vibrational wavenumbers obtained for 4M4NPBS at B3LYP/6-31G(d,p) [(harmonic frequency cm−1), IR intensities (K mmol−1), Raman intensities (arb. units)]. Mode nos
Experimental (cm−1) FT-IR
FT-Raman
DFT Calculated (cm−1) (scaled
IbIR Ic
Raman Vibrational assignments PED (%)
1 2 3 4 5 6 7 8 9
10 11 12 13 14 15 16 17 18 19 20 21 22 23 24 25 26 27 28 29 30 31 32 33 34 35 36 37 38 39 40
3441 3288
3057
2922 1628 1598
1492
1403
1333
1160
1084
3075
2927
1587
1525
1476
1384
1318
1256
1163
1097
1032
3456312531173112309730893064306130613010298129231598158915881563154614771475144514401433138413711369133813151300128812821264121011861167116511021097109410891046
0.040.000.010.050.150.300.410.390.290.270.070.181.520.720.352.650.549.250.650.410.041.721.001.917.63
10.5129.361.030.73
22.156.241.782.546.37
32.1513.230.263.947.031.06
1.51.61.80.10.10.20.10.10.20.40.20.51.10.40.60.50.12.80.20.10.20.30.10.10.40.41.81.01.11.61.10.10.10.67.61.50.90.40.10.9
νNH(100) νring2CH(100) νring2CH(98) νring2CH(99) νring1CH(95) νring1CH(93)
νring1CH(95) νring2 CH(98) νring1CH(92) νmethylCH(97) νmethylCH(100) νmethylCH(100) νON(34)+νring2CC(32) νring2CC(43) νring1CC(30) νCCring1(52)+βring2CCC(11) νON(54)+νring2CC(26) βHCC(57) βring1HCC(63) βring2HCH(72) βring1HCH(78) νCC(27)+ βHNC(25)+βmethylHCC(10) νCC(35))+ βmethylHCC(23) βring2HCH(92) νring2CC(30)+ βHNC(35) νON(71)+ βONO(11) νring2CC(41) νring1CC(55) νring2CC(31)+ βHCC(31) βring1HCC(74) νNC(19)+νSO(37)+ βring1HCC(24) νring1CC(12)+νNC(20)+ βHNC(20) νring2CC(49)+ βCCC(12) βring1HCC(53) νring1CC(10)+ βmethylHCC(71) Νring1CC(11)+νSO(12)+ βring1HCC(28) νring2CC(10)+ βring2HCC(40) νSO(32)+ βring1HCC(10) Νring2CC(33)+νNC(20)+ βring2HCC(16) Νring1CC(33)+νSO(38)
Please purchase PDF Split-Merge on www.verypdf.com to remove this watermark.

41 42 43 44 45 46 47 48 49 50 51 52 53 54 55 56 57 58 59 60 61 62 63 64 65 66 67 68 69 70 71 72 73 74 75 76 77 78 79 80 81 82 83 84 85 86
907 883 813
760
677
565
939
812
756
657
585 522
488 450
316
285
250
1024991986974948942934930856829822817791790789766726693668654629621610550515512488469432405400393385328317302280262249223173155119946965
12.5551.560.050.020.370.090.270.201.561.99
25.0219.5627.594.05
16.820.813.070.86
23.2421.932.268.265.05
41.87100.2111.060.102.246.961.842.542.78
22.3522.670.095.11
45.0220.753.833.182.492.051.702.100.360.24
11.12.00.20.10.70.00.30.10.20.02.9
17.55.02.13.20.90.92.69.3
17.30.30.53.5
12.8100.1
0.87.50.41.63.53.30.30.31.21.4
15.556.70.7
43.718.212.817.214.716.614.812.9
βmethylHCH(15)+�ring1HCCC(49) βring1CCC(71) βring2CCC(75) τring2HCCC(48) τHCCS(48)+ τring1HCCC(30)+ τCCCC(13) τring2HCCN(67)+ τring2NCCC(16) τring2HCCN(71)+ τring2HCCC(16) τring1HCCC(39)+ τHCCS(41) νCC(10)+νNC(12)+νSN(15)+ΒCCC(20) νSN(16)+ βONO(34) τHCCS(43)+ τHCCC(40) τring2HCCC(53) τHCCS(33)+ τring2HCCC(30) τring2HCCC(68)+ τHCCN(29) Νring1CC(13)+ βring2CCC(24) νSN(13)+ βring2CCC(12) τCCCC(17)+ τOCON(52)+ τNCCC(12) τring1CCCC(71) τring2CCCC(66)+ τOCON(18) νNC(16)+ βONO(34)+ βCCC(12) νCC(11)+νSC(17)+ βCCC(14) βring1CCC(68) βring2CCC(46) βOSO(24)+ βNSC(11) βONC(29)+ βOSO(11)+ τONOS(17) βONC(29)+ τONOS(17) τCCCN(19)+ τring1CCCC(37)+ τNCCC(15) βOSO(11)+ τring1CCCC(23)+ τSCCC(13) νNC(17)+ τONCS(23) τring2HCCC(11)+ τring1CCCC(64) τring1HCCC(11)+ τring2CCCC(60) βCCC(15)+ βSCC(12)+ τONCS(11) τring2HNCC(58) βCCN(11)+ βCCC(34)+ τONCS(11) βOSO(13)+ βNSC(13)+ τHNCC(12) βring2CCC(17) βNCC(12)+ τCCCN(14)+ τNCCC(11) νSC(30)+ τONOS(14) νNC(10)+ βOSN(43) βNCC(19) βNCC(12)+ βNSC(15) βSCC(52)+ τONCS(16) βCNS(15)+ τCNSC(21) βCCN(17)+ βCCS(25)+ τSCCC(11) ƮτONCC(49) βτNSC(10)+ τONCC(42)
Please purchase PDF Split-Merge on www.verypdf.com to remove this watermark.

87 88 89 90
4232188
0.220.340.22
15.23
7.415.117.224.8
τHCCC(94) τCCNS(15)+�NSCC(56) τCNSC(50)+�NSCC(27) τCCNS(58)
Please purchase PDF Split-Merge on www.verypdf.com to remove this watermark.

Figure 8.4(a) FTIR spectrum of 4M4NPBS
Figure 8.4(b) FTRaman Spectrum of 4M4NPBS
4000 3500 3000 2500 2000 1500 1000 500
Wavenumber(cm-1)
Experimental
Tran
smitt
ance
(arb
.uni
ts)
B3LYP
Please purchase PDF Split-Merge on www.verypdf.com to remove this watermark.

201
stretches. C-H symmetric stretching is observed at 3288 cm-1 in FTIR and at 3075
cm-1 in FT-Raman. The C-H in plane bending vibrations usually occurs in the
region 1430-990 cm-1 and is very useful for characterization purposes [47]. As
stated in the earlier literature [47], in this work, the peaks at 1445, 1440 and 1024
occur due to the C-H in-plane-bending vibrations. The substitution patterns on the
ring can be judged from the out of plane bending vibrations of the ring C-H bond
in the region 900-675 cm-1 which are highly informative [48]. The modes
calculated at 822, 817, 791 and 790 cm-1 confirms the C-H out of plane bending
vibrations.
8.4.3 C-C Vibrations
The bands in the region 1430-1650 cm-1 are usually assigned to C-C
stretching modes [49-51]. As predicted in the earlier references, in this case, the
prominent peaks at 1598, 1492 and 1333 cm-1 are assigned to the ring C-C
stretching vibrations. The C-C-C in plane and out of plane bending vibrations are
calculated at 991, 986, 610, 550, 393 and 328 cm-1 and 693, 668, 488, 405 and 400
cm-1 respectively.
8.4.4 Methyl Group Vibrations
In general, the C-H stretching of methyl group occurs at lower frequencies
than those of aromatic ring (3100-3000 cm-1). The calculated values 2923-3010
cm-1 assigned to methyl C-H stretching modes in B3LYP/6-31G (d, p) method. The
vibrations of methyl group in this molecule are observed at 2922 and 2927 cm-1 in
FTIR and FT-Raman respectively. These assignments are within the characteristic
range as reported in earlier literatures [52-56]. The modes calculated at 1165, and
Please purchase PDF Split-Merge on www.verypdf.com to remove this watermark.

202
1024 cm-1 in B3LYP are assigned to C-H in-plane bending vibrations, which are in
good agreement with the value reported by Durig et al [57].
8.4.5 Heavy Atoms Fundamental Vibrations
The asymmetric and symmetric stretching modes of SO2 group appear in
the region 1360–1310 cm-1 and 1165–1135 cm-1 [58]. The observed bands at 1333,
1160 cm-1 in the FTIR spectrum, 1318, 1163 in the FT-Raman spectrum and 1264,
1102, 1094 and 1046 cm-1 theoretically are assigned as SO2 stretching modes. The
SO2 scissoring and wagging vibrations occur in the range 570 ± 60 cm-1 and
520 ± 40 cm-1 [58]. The corresponding bands are observed for the title compound
at 565 cm-1 and 585 cm-1 in the FT-IR spectrum, calculated as 550 and 515 cm-1
respectively.
The Raman bands at 1587 and 1525 cm−1 as weak intensities have been
assigned to NO2 asymmetric stretching vibrations. The IR and Raman bands
observed at 1348, and 1354 cm−1 have been assigned to NO2 symmetric stretching
vibrations. Aromatic nitro compounds have a band of weak-to-medium intensity in
the region 590–500 cm−1 [50] due to the in-plane deformation mode of the NO2
group. The NO2 in plane vibrations are observed at 813 in IR, 812 in FT-Raman
and 829 cm-1 in B3LYP. The NO2 out of plane deformation vibrations are expected
in the region 775–662 cm−1 [50]. The observed bands in IR at 760 cm−1 and in
Raman at 756 cm−1 as weak intensities have been assigned to NO2 out of plane
deformation.
Because of the mixing of several bands, the identification of C-N vibrations
is a very difficult task. In the present work, the band observed at 1256 cm-1 in FT-
Raman spectrum have been assigned to C-N stretching vibration. The mode 61
Please purchase PDF Split-Merge on www.verypdf.com to remove this watermark.

203
calculated at 1264 cm-1 with 6-31G(d,p) basis set is in good agreement with
experimental value. The PED of this mode is 20%. The PED of this mode suggests
that this is a mixed mode.
8.5 FTNMR SPECTRAL ANALYSIS
The FTNMR spectra are presented in Figure 8.6(a) and Figure 8.6(b)
respectively and the chemical shifts are tabulated with the assignments in
Table 8.4. As it is seen in Figure 8.6 (a), this compound shows thirteen different
carbon atoms, which is consistent with the structure on the basis of molecular
symmetry. 1H NMR spectrum Figure 8.6 (b) of the title compound is investigated,
it can be seen that total number of protons are in agreement with the integration
values presented in this spectrum.
Chemical shifts were reported in ppm relative to TMS for 1H NMR and 13C NMR spectrum provides information about the number of different types of
protons and also the nature of immediate environment of each of them. 13C NMR
spectrum also provides the structural information with regard to different carbon
atoms present in the molecules. In the 1H NMR spectrum, a singlet at 2.4 ppm
indicates the three protons of methyl group. The above said methyl group protons
are calculated in the range of 1.8 ppm - 2.21 ppm for B3LYP. The eleven aromatic
protons of nitrophenyl and tosyl group are appeared as multiplet in the range of
7.2-8.2 ppm and are calculated in the range of 7.72-8.41 ppm for B3LYP. The N1H
group of the nitrophenyl is responsible for the appearance of broad singlet at 4.36
ppm and calculated as 5.88 ppm for B3LYP. In general, highly shielded protons
appear downfield and vice versa. The protons associated with the carbons C5 and
Please purchase PDF Split-Merge on www.verypdf.com to remove this watermark.

Table 8.5 The chemical shift in 1H NMR and 13CNMR spectrum of 4M4NPBS crystal
Spectrum Experimental (CDCl3) signal at δ(PPM)
B3LYP Calculated Chemical shift at δ(PPM)
Group Identification
1H NMR 2.4(singlet)
2.21, 1.8, 1.8
3 protons of the Methyl carbon(C11)
8.2 8.29 8 7.79 7.78 7.77 7.37 7.2
8.41 8.29 8 7.98 7.98 7.98 7.78 7.72
Proton of (C6)29 Proton of (C2)8 Proton of (C11)24 Proton of (C13)9,7,10 Proton of (C5)26 Proton of (C3)28 Proton of (C10) 19 Proton of (C9)
4.36 5.88 N‐H Proton 13C NMR 20.05 10.97 C11 methyl group carbon 143.46 143.1 C 27(methyl group attached carbon) 136.67 130.64 C6(methyl group attached carbon) 134.40 127.83 C20 (N‐H attached carbon) 129.17 119.76 C23(SO2 attached carbon) 129.07 118.99 C21 126.91 118.05 C3 126.85 116, 115.89 C2Meta carbons of tolyl ring 121.62 115.7, 115.16 C4Ortho carbons of tolyl ring 121.58 115.01 C1 121.53 109.64 C5 76.77‐77.28 79.86 Carbon of the solvent CDCl3
Please purchase PDF Split-Merge on www.verypdf.com to remove this watermark.

Figure 5a H1 NMR spectrum of 4M4NPBS
Please purchase PDF Split-Merge on www.verypdf.com to remove this watermark.

Figure 5b C NMR spectrum of 4M4NPBS
Please purchase PDF Split-Merge on www.verypdf.com to remove this watermark.

204
C3 are appeared at higher chemical shift of 8.2 and 8.29 ppm experimentally and
8.41, 8.29 ppm theoretically due to the electronegative effect of nitro group. The
protons associated with C8 and C12 are appeared at high chemical shift of 8 and
7.79 ppm, calculated as 8 and 7.98 ppm due to the sulfonyl group. The protons
associated with C11 and C9 are appeared at upfield chemical shift of 7.78 and 7.77
ppm, calculated as 7.98 and 7.98 ppm because of shielding by the
hyperconjugative effect of methyl group. The protons associated with C6 and C2
carbons are appeared at 7.37 and 7.2 ppm in the proton NMR spectrum, calculated
as 7.78 and 7.72 ppm respectively.
In the 13C NMR spectrum, the methyl carbon of the tolyl group give signal
at 20.05 ppm, calculated as 10.97 ppm. The sixteen aromatic carbons of the
nitrophenyl and tolyl group are appeared as multiplet in the range of
121.53–143.46 ppm and are found to be in the range of 109.64–143.10 ppm for
B3LYP. The C1 carbon of the phenyl ring appears 143.46 ppm, due to
neighbouring N-H group, calculated as 143.1 ppm. The signal at 136.67 ppm is
assigned to the C10 carbon of the tosyl ring which is bonded with methyl group,
calculated as 130.64 ppm. The signal at 134.40 ppm is assigned to the C4 carbon
of the phenyl ring which is bonded with nitro group, calculated as 127.83 ppm.
The signal at 129.17 ppm is assigned to the C7 carbon of the tolyl ring which is
bonded with sulfonyl group, calculated as 119.76 ppm. The Meta carbons
(C9,C11) of the tosyl ring are responsible for the signal at 126.85 ppm, calculated
as 116 ppm and 115,89 ppm. The ortho carbons (C8, C12) of the tosyl ring are
responsible for the signal at 121.62 ppm, calculated as 115.7 ppm and 115.16 ppm.
The signals at 129.07 ppm, 126.91 ppm, 121.58 ppm, 121.53 ppm are assigned to
the (C3,C5,C2 and C6) carbons of the nitrophenyl ring. The above said carbons of
the nitrophenyl ring are calculated as, 118.99 ppm, 118.05 ppm, 115.01 ppm and
Please purchase PDF Split-Merge on www.verypdf.com to remove this watermark.

205
109.64 ppm for B3LYP. (See ortep diagram for numbering of atoms). A Signal at
76.77–77.28 ppm indicates the carbon atom of the CDCl3 (solvent), calculated as
79.86 ppm. As it is seen from the Table 4, calculated 1H and 13C chemical shifts
values of the title compound are generally agreement with the experimental 1H and
13C chemical shifts data.
In this study, GIAO 13C and 1H NMR chemical shifts of the molecules
were calculated and tabulated in Table 8. 6.
8.6 NBO ANALYSIS
NBO analysis provides a possible ‘natural Lewis structure’ picture of ø,
because all orbital details are mathematically chosen to include the highest possible
percentage of the electron density. A useful aspect of the NBO method is that it
gives information about interactions in both filled and virtual orbital spaces that
could enhance the analysis of intra- and intermolecular interactions.
The second order Fock matrix was carried out to evaluate the donor–
acceptor interactions in the NBO analysis. The interactions result is a loss of
occupancy from the localized NBO of the idealized Lewis structure into an empty
non-Lewis orbital. For each donor (i) and acceptor (j), the stabilization energy E
(2) associated with the delocalization i→j is estimated as
E(2) = ∆Eij = qi ⎟⎟⎠
⎞⎜⎜⎝
⎛
− )(),( 2
ij
jiFεε
where qi is the donor orbital occupancy, are εi and εj diagonal elements and F(i, j)
is the off diagonal NBO Fock matrix element.Natural bond orbital analysis
provides an efficient method for studying intra and intermolecular bonding and
Please purchase PDF Split-Merge on www.verypdf.com to remove this watermark.
206
interaction among bonds, and also provides a convenient basis for investigating
charge transfer or conjugative interaction in molecular systems. The larger the E(2)
value, the more intensive is the interaction between electron donors and electron
acceptors, i.e. the more donating tendency from electron donors to electron
acceptors and the greater the extent of conjugation of the whole system.
Delocalization of electron density between occupied Lewis type (bond or lone pair)
NBO orbitals and formally unoccupied (antibond or Rydgberg) non-Lewis NBO
orbitals correspond to a stabilizing donor–acceptor interaction.
NBO analysis has been performed on the molecule at the DFT/B3LYP/
6-31G (d,p) level in order to elucidate the intra molecular, rehybridization and
delocalization of electron density within the molecule. The intra molecular
interaction are formed by the orbital overlap between (σ and π (C–C, C-H and
C-N) and σ* and π* of (C-C, C-H and C-N)) bond orbital which results intra
molecular charge transfer (ICT) causing stabilization of the system. These
interactions are observed as increase in electron density (ED) in C–C anti bonding
orbital that weakens the respective bonds. The electron density of conjugated
double as well as single bond of the aromatic ring (~1.9e) clearly demonstrates
strong delocalization inside the molecule. The strong intramolecular
hyperconjugation interaction of the σ (C –C) to the π*(C–C) bond in the ring leads
to stabilization of some part of the ring as evident from Table 8.5. For example, the
intra molecular hyper conjugative interaction of σ (C3–C4) distribute to σ * (C2–
C3) leading to stabilization of ~5.0 kJ/mol. This enhanced further conjugate with
anti-bonding orbital of π*(C1–C2) and (C5–C6), leads to strong delocalization of
22.24 and 14.52 kJ/mol respectively. The magnitude of charges transferred from
(LP(2)O32)→(C23-H28) shows weak intramolecular interaction which is shown in
the hydrogen bonding interactions of XRD result. The magnitude of charges
Please purchase PDF Split-Merge on www.verypdf.com to remove this watermark.

Table 8.6. Second order perturbation theory analysis of Fock matrix in NBO basis.
Donor(i) Type ED(e) Acceptor Type ED(e) E(2)a (KJ/mol) E(j)‐E(i)b(a.u) F(i,j)c (a.u)
C5‐C6 π 1.6183 C1‐C2 π * 0.2995 17.21 0.28 0.063
C3‐C4 π * 0.4029 27.27 0.26 0.076
C21‐C23 π 1.6501 C20‐C22 π * 0.3573 21.52 0.28 0.069
π C25‐C27 π * 0.3779 20.89 0.27 0.068
C3‐C4 π 1.6867 C1‐C2 π* 0.2995 22.24 0.30 0.073
C5‐C6 π* 0.3339 14.52 0.30 0.060
C20‐C22 π 1.654 C21‐C23 π* 0.3060 19.28 0.29 0.068
C25‐C27 π* 0.3779 21.59 0.28 0.070
C25‐C27 π 1.6711 C20‐C22 π* 0.3881 18.56 0.29 0.066
C21‐C23 π* 0.3069 20.31 0.31 0.070
S15‐O16 σ 1.9855 C2‐C3 σ* 0.0262 1.37 1.52 0.041 C22‐C25 σ 1.9721 N18‐C20 σ* 0.0305 4.37 1.03 0.060 LP(2)O16 σ 1.8166 S15‐N18 σ* 0.0254 12.6 0.44 0.068 LP(2)O16 σ 1.8166 C3‐S15 σ* 0.1779 0.83 0.73 0.023 C3‐C4 π* 1.6867 C1‐C2 π* 0.2995 172.35 0.02 0.078 C25‐C27 π* 1.6711 C21‐C23 π* 0.3060 203.15 0.01 0.081 N30‐O31 π* .58628 C25‐C27 π* 0.37794 10.94 0.08 0.037
a E(2) means energy of hyper conjugative interaction (stabilization energy). b Energy difference between donor and acceptor i and j NBO orbitals. c F(i,j) is the fork matrix element between i and j NBO orbitals.
Please purchase PDF Split-Merge on www.verypdf.com to remove this watermark.

207
transferred from (LP(2)O16)→(S15-N18) and (LP(1)N18)→(C20-C21) show that
stabilization energy of about ~12.6 KJ/Mol and ~ 6 KJ/Mol respectively. The
delocalization of electron π*(C3-C4) and π*(C25-C27) to π*(C1-C2) and π*(C21-
C23) with enormous stabilization energy of about ~ 172.35 and 203.15 KJ/Mol.
8.7 NONLINEAR OPTICAL EFFECTS
NLO is a forefront of current research because it provides the key functions
of frequency shifting, optical modulation, optical switching, optical logic, and
optical memory for the emerging technologies in areas such as
telecommunications, signal processing, and optical interconnections. The
hyperpolarizability values of 4M4NPBS calculated by the B3LYP/6-31G(d,p)
method is 4.60 x 10⁻³¹ cm5/esu and are listed in Table 8.6 (the β of urea is 6.06x10-
31 cm5/esu obtained by DFT (B3LYP)/6-31G(d,p) method). The first
hyperpolarizability of the title compound is 6.81 times that of urea. Conclusion
from the magnitude of the first hyperpolarizability, the 4M4NPBS compound may
be a potential applicant in the development of NLO materials.
8.8 MULLIKEN ATOMIC CHARGES
Atomic charges of the 4M4NPBS compound, computed by Mulliken
method at the B3LYP/6-31G(d,p) level of calculation, are illustrated in
Table 8.7. The magnitudes of the carbon atomic charges for the compounds were
found to be both positive and negative at the basis set. These magnitudes were
obtained to change between − 0.3836 and 0.2339 for 4M4NPBS. The maximum
atomic charge was obtained for C11 atom due to the effect of negatively charged
carbon atoms. The magnitude of N atoms were computed to be about −0.6455
(N18 and 0.2078(N30)). All the oxygen atomic charges were obtained to be
negative. Oxygen atoms of sulfonyl group have more negative charges (-0.526,
Please purchase PDF Split-Merge on www.verypdf.com to remove this watermark.

Table 8.7
The electric dipolemoment(D), Polarizability and first hyperpolarizability of 4M4NPBS
a.u esu(x10‐24) a.u (esux10‐33) αxx 255 1723 Βxxx 433.52 3745 αxy ‐7.38 49.86 Βxxy 83.91 724.81 αyy 171.87 1161.32 Βxyy 60.7 524.38 αxz ‐22.2 150 Βyyy 84.94 733.79 αyz ‐5.28 35.67 Βxxz ‐4.77 41.21 αzz 100.9 681.78 Βxyz ‐2.43 20.99αtotal 175.92 1188.69 Βyyz 3.86 33.34 µx ‐2.24 15.13 Βxzz ‐46.91 405.25 µy 1.11 Βyzz .103 .8898 µz 1.12 Βzzz 26.96 232.907 µ 2.95 Βtotal 478.86 4132.58
Please purchase PDF Split-Merge on www.verypdf.com to remove this watermark.

208
-0.523) than oxygen atoms of nitro group (-0.2939, -0.2932). Additionally, the
magnitudes of the hydrogen atomic charges were noted to be only positive values,
indicating the charge transfer from hydrogen to carbon atom. All the hydrogen
atoms in the molecules lost electrons.
8.9 MOLECULAR ELECTROSTATIC POTENTIAL
Molecular Electrostatic potential at the B3LYP/6-31G(d,p) optimized
geometry was calculated. The molecular electrostatic potential (MEP) is related to
the electronic density and a very useful descriptor for determining sites for
electrophilic attack and nucleophilic reactions as well as hydrogen–bonding
interactions. As it is seen in Figure 8.7, the red region is localized on the oxygen
atoms of nitro group and sulfonyl group has value of -0.0829 a.u. and the
maximum blue region localized on the N1–H1 bond has value of +0.0585 a.u,
indicating the possible sites for electrophilic attack and nucleophilic reaction
respectively. These sites give the information about the region, from where the
compound can have intermolecular interactions. Hence, the molecular electrostatic
potential map confirms the existence of intermolecular N–H-O interactions.
8.10 ELECTRONIC ABSORPTION SPECTRUM
General types of electronic transitions in organic compounds are π–π* and
n–π*. In order to understand the electronic transitions of the 4M4NPBS compound,
theoretical calculations on electronic absorption spectra were performed in gas
phase by TD-B3LYP/6-31G(d,p) method. The absorption peak obtained at 225 nm
is attributed to the π–π* type transition in benzene ring and oscillation effect. The
weak absorption peak at 309 nm denotes n→π* type transition in nitro group.
Please purchase PDF Split-Merge on www.verypdf.com to remove this watermark.

Figure 8.6 The Mulliken charge distribution of 4M4NPBS
Please purchase PDF Split-Merge on www.verypdf.com to remove this watermark.

Figure 8.7 Molecular Electrostatic Potential of 4M4NPBS
Please purchase PDF Split-Merge on www.verypdf.com to remove this watermark.

Figure 8.8 UV‐Vis absorption spectrum of 4M4NPBS
Please purchase PDF Split-Merge on www.verypdf.com to remove this watermark.

209
8.11 HOMO-LUMO ANALYSIS
Highest occupied molecular orbital (HOMO) and lowest unoccupied
molecular orbital (LUMO) are very important parameters for quantum chemistry.
The way the molecule interacts with other species will be determined by them.
Hence, they are called the frontier orbitals. HOMO, which can be thought the
outermost orbital containing electrons, tends to give these electrons such as an
electron donor. On the other hand; LUMO can be thought the innermost orbital
containing free places to accept electrons. Due to the interaction between HOMO
and LUMO orbital of a structure, transition state transition of π-π* type is
observed with regard to the molecular orbital theory. Therefore, while the energy
of the HOMO is directly related to the ionization potential, LUMO energy is
directly related to the electron affinity. According to B3LYP/6-31G(d,p) level of
theory, the energy band gap between HOMO and LUMO) was found to be about
3.51eV. The HOMO and LUMO energies calculated present that the charge
transfer occurs within the molecules. Moreover it is visible from Figure. 8.9, the
highest occupied molecular orbital (HOMO) is localized on the nitrophenyl and
NH-SO2 group. LUMO is delocalised only over the nitrophenyl ring. HOMO-
LUMO transition is taking place from NH-SO2 moiety to nitrophenyl ring.
By using HOMO and LUMO energy values, the global chemical reactivity
descriptors of molecules such as hardness, chemical potential, softness,
electronegativity and electrophilicity index as well as local reactivity have been
calculated and their values are shown in the Table 8.8.
8.12 THERMAL ANALYSIS
4M4NPBS compound is found to be stable upto the temperature of about to
295°c. From 295°c, the first stage of decomposition starts. It goes upto nearly
380°c with a total mass loss of 35%. The second stage decomposition begins at the
Please purchase PDF Split-Merge on www.verypdf.com to remove this watermark.

Figure 8.9 HOMO‐LUMO surfaces of 4M4NPBS
Please purchase PDF Split-Merge on www.verypdf.com to remove this watermark.

Figure 8.10 TGA and DTA of 4M4NPBS
Please purchase PDF Split-Merge on www.verypdf.com to remove this watermark.

210
temperature of 570°c. The decomposition becomes complete at about 670°c with
the whole mass of the compound getting decompose, leave behind less than 10%
of charred material.
8.13 CONCLUSION
In this chapter, 4M4NPBS was studied using experimental techniques
(FT-IR, FT-Raman, NMR and UV) and tools derived from the density functional
theory. The vibrational FT-IR and FT-Raman spectra of 4M4NPBS was recorded
and detailed description of vibrational modes were assigned with the aid of
potential energy distribution analysis. The electronic properties were also
calculated and compared with experimental electronic spectrum. The comparisons
of the predicted bands are generally in good agreement with experimental results.
Furthermore, total dipole moment, linear polarizability, first hyperpolarizability of
the 4M4NPBS molecule were calculated and the results were discussed. These
results indicate that the studied compound is a good candidate for nonlinear optical
materials.
Please purchase PDF Split-Merge on www.verypdf.com to remove this watermark.

211
REFERENCES
1. V. Krishnakumar, V. Balachandran, spectro chimica acta A, 61,
(2005)1811-1819.
2. V. Chis¸ M. Monica, Venter, N. Leopold, O. Cozar, Vibrational
Spectroscopy 48 (2008) 210–214.
3. T. Tanaka, A. Nakajima, A. Watanabe, T. Ohno, Y. Ozaki, J. Mol. Struct.
437 (2003) 661–662
4. T. W. Panunto, Z. Urbánczyk-Lipkowska, R. Johnson, M.C. Etter, J. Am.
Chem.Soc. 109 (1987) 7786-7797.
5. C. Gustavo Pozzi, A. C. Fantoni, Andrés E. Goeta, Etelvina de Matos
Gomes, Garry J. McIntyre, Graciela Punte.
6. R. Dhanya, V.C. Kishore, C. Sudha Kartha, K. Sreekumar, Rani Joseph,
Spectrochimica. Acta Part A 71 (2008) 1355–1359.
7. G.C. Yang, S.Q. Shi, W. Guan, L. Fang, Z.M. Su J. Mol. Struct.
THEOCHEM 773 (2006) 9–14.
8. K. Piela, K. Hołderna-Natkaniec, M. Baranowski, T.M. Jan Baran, M. M.
Szostak, J. Mol. Struct. 1033 (2013) 91–97.
9. O. Y. Borbulevych, R. D. Clark, A. Romero, Li Tan, M. Yu Antipin, V. N
Nesterov, B. H Cardelino, C. E Moore, M. Sanghadasa, T.V. Timofeeva,
J. Mol.struct. 604 (2002) 73-86.
10. U. Bhatt, N. Mohamed, G. Just, E. Roberts, Tetrahedron Lett. 38 (1997)
3679–3682.
11. T. Ibuka, N. Mimura, H. Aoyama, M. Akaji, H. Ohno, Y. Miawa, T. Taga,
K. Nakai, H. Tamamura, N. Fujii, Y. Yamamoto, J. Org. Chem. 62 (1997)
999–1015.
Please purchase PDF Split-Merge on www.verypdf.com to remove this watermark.

212
12. P.G.M. Wuts, J.M. Northuis, Tetrahedron Lett. 39 (1998) 3889–3890.
13. H.L. Cheng, S.Q. Zhang, C.F. Huang, Acta Crystallogr. E63 (2007) o1979–
o1980.
14. M. Tremayne, C.C. Seaton, C. Glidewell, Acta Crystallogr. B58 (2002)
823–834.
15. M.S. Fonar, E.V. Ganin, A. Dvorkin, A.A.A. Simonov, G.S.Y. Musienko,
E.N. Krylov, T.I. Malinovskii, Zh. Obshch. Khim. 62 (1992) 1378–1386.
16. T. Zhou, Q. Zhang, G. Chen, Z. Zhou, Acta Crystallogr. E60 (2004)
o1767–o1768.
17. P.G. De Benedetti, D. Iarossi, M.C. Menziani, C. Frassineti, A. Benedetti,
J. Mol. Struct. 175 (1988) 37–42.
18. M.M. Pomerantz, W.N. Chou, M.K. Witczak, C.G. Smith, J. Org. Chem.
52 (1987) 159-165.
19. M. Karabacak, M. Cinar, A. Coruh, M. Kurt, J. Mol. Struct. 919 (2009) 26–
33.
20. M. Karabacak, M. Cinar, M. Kurt, J. Mol. Struct. 968 (2010) 108–114.
21. Labeeuw, B., Gully, D., Jeanjean, F., Molimard, J.-C. & Boigegrain, R.
(1996). WO patent No. 9 632 382.
22. Takanori, T., Ryo, I. & Tetsuhiro, Y. (2002). WO Patent No. 2 002 034-
049.
23. B. Bugaut, P. Andrillon, (1981). US Patent No. 4 277 244.
24. J.D. Xing, T. Zeng, Acta Cryst. E61(2005) o4318-o4319.
25. G.M Sheldrick, SHELXS97 and SHELXL97. Programme for solution and
refinement of crystal structure. University of Gottingen, Germany (1997).
Please purchase PDF Split-Merge on www.verypdf.com to remove this watermark.

213
26. A.L Spek, J Appl Cryst Sect. 36 (2003) 7-13.
27. C.K. Johnson, ORTEPII. Report ORNL, 5138. Oak Ridge, National
Laboratory,Tennessee, USA, (1976).
28. Subashini, M. Hemamalini, P. T. Muthiah, G. Bocelli, A. Cantoni, J. Chem.
Crystallogr. 39 (2009) 112-116.
29. F.H. Allen, O. Kennard, D.G Watson, L. Brammer, A.G. Orpen, R. Taylor,
J. Chem. Soc. Perkin Trans. 2 (1987) S1-S19.
30. E. Kendi, S. Ozbey, O. Bozdogan, R. Ertan, Acta Cryst. C56 (2000)
457-458.
31. S. Ozbey, A. Akbas, G.A. Kilcigil, R. Ertan Acta Cryst. C61 (2005)
559-561.
32. C. Glidewell, J.N. Low, J.M.S. Skakle, J. L. Wardell, Acta.Cryst. C60
(2004) o33-o34.
33. V.L. Abramenko, V.S Sergienko, Russ. J. Inert. Chem. 47 (2002) 905-911.
34. C.A Hunter, Chem. Soc Rev. 23 (1994) 101-109.
35. J.V. Prasad, S.B. Rai, S.N.Thakur, Chem Phys Lett. 164(6) (1989) 629.
36. M. K. Ahmed, B. R. Henry, J. Phys. Chem. 90 (1986) 629-.
37. M.J. Frisch, Gaussian 03 Revision C.02, Gaussian, Inc.,Wallingford, CT,
(2004).
38. H.B. Schlegel, J. Comput. Chem. 3 (1982) 214-218.
39. P.Hohenberg, W. Kohn, Phys. Rev. 136 (1964) B864-B871.
40. A.D. Becker, J. Chem. Phys. 98 (1993) 5648-5652.
41. C. Lee, W.Yang, R.G.Parr, Phys Rev. B37 (1988) 785-789.
Please purchase PDF Split-Merge on www.verypdf.com to remove this watermark.
214
42. M.H. Jamroz, Vibrational Energy Distribution Analysis VEDA 4 program,
Warsaw, 2004.
43. N.P.G. Roges, A Guide to the Complete Interpretation of the Infrared
Spectra of Organic Structures, Wiley, New York, (1994).
44. R.L. Peesole, L.D. Shield, I.C. McWilliam, Modern methods of chemical
analysis, Wiley, New York, (1976).
45. Y.R. Sharma, Elementary organic spectroscopy- Principles and chemical
applications, S.Chand & Company Ltd., New Delhi, (1994) 92-93.
46. M. Pagannone, B. Formari, G.Mattel, Spectrochim. Act. 43A (1986)
621-625.
47. P.S. Kalsi, Spectroscopy of organic compounds, Wiley eastern limited,
New Delhi, (1993).
48. D.N. Sathyanarayana, Vibrational spectroscopy – Theory and applications,
second ed., New age international (P) Ltd. publishers, New Delhi, (2004).
49. G. Socrates, Infrared and Raman characteristic frequencies, Third ed., John
Wiley & Sons Ltd., Chichester. (2001).
50. V.R. Dani, Organic Spectroscopy, Tata – MacGraw Hill Publishing
Company, New Delhi, (1995) 139.
51. D. Lin-Vien, N.B. Colthup, W.G. Fateley, J.G. Grasselli, The Hand book of
infrared and raman characteristic frequencies of organic molecules,
Academic Press, Boston, (1991).
52. M. Dien, Introduction to Modern Vibrational Spectroscopy, Wiley, New
York, (1993).
53. P.B. Nagabalasubramanian, S. Periandy, S. Mohan, Spectrochim. Acta A.
74 (2009) 1280-1287.
Please purchase PDF Split-Merge on www.verypdf.com to remove this watermark.