chapter 8 · health care and social assistance 12% ... biological sciences non-stem 18 ... chapter...
TRANSCRIPT

WhaT aRE BIOlOgIcal ScIEncES?the main purpose of studying and working in Biological sciences is to understand and apply knowledge of the genetics and physiology of living organisms and the
relationship of living organisms to one another as well as the physical environment. Biological sciences is comprised of the following: Biochemistry and Cell Biology, Botany, ecology and evolution, Marine science, Genetics, Microbiology, Human Biology, Zoology, and other Biological sciences, n.e.c. (not elsewhere classified)
(ABs, 2001). In addition to the Biological sciences, the related disciplines of Medical sciences and Food science and Biotechnology are separately examined.
CHAPTER 8 STEM PATHWAYS: BIOLOgICAL SCIENCES

90 AUSTRALIA’S STEM WORKFORCE
KEY FACTS
STEM PATHWAYS: BIOLOgICAL SCIENCES
8In 2011, there were 44 164 Biological Sciences graduates.
The majority of graduates were female (55 per cent); however, of those in the workforce the majority was male (53 per cent).
Two-thirds of female, and over half of male graduates were aged under 45 (67 and 54 per cent, respectively).
57 per cent worked in the private sector—varying from 68 per cent of bachelors to 37 per cent of doctorates.
Almost one quarter worked in the Education and Training industry (24 per cent), and one-fifth worked in Professional, Scientific and Technical Services (20 per cent).
The majority of graduates worked as Professionals (55 per cent), most commonly as Design, Engineering, Science and Transport (53 per cent), and Education (19 per cent) professionals.
Graduates with Biological Sciences qualifications aged 45-59 were more likely to earn more than $104 000 (the highest personal income bracket) per year compared to all STEM and all Non-STEM graduates.
Fewer Biological Sciences graduates earned more than $104 00 per year on average compared to all other graduates.
Agriculture, Forestry and Fishing 2%Accommodation and Food Services 3%
Wholesale Trade 3%
Retail Trade 4%
Arts and Recreation Services 3%
Manufacturing 5%
Health Care and Social Assistance 12%
Public Administration and Safety 13%
Professional, Scientific and Technical Services 19%
Education and Training 24%
Top ten industry sectors of employment for BiologicalSciences graduates
91chapter 8 STEM PATHWAYS: biologicAl SciENcES
hOW Many BIOlOgIcal ScIEncES gRaDUaTES aRE ThERE In aUSTRalIa?In 2011, there were 44 164 Biological Sciences graduates (bachelor and above) in Australia. The top three fields of study were Biological Sciences, n.f.d. (not further defined), Biochemistry and Cell Biology, and Microbiology, with 30, 15 and 11 per cent of graduates respectively.
Just over one quarter of graduates (11 558, 26 per cent) were either not in the labour force or were unemployed (23 and 3 per cent, respectively).
Approximately, 31 per cent of Biological Sciences graduates in the workforce held a doctorate degree, compared to eight per cent of STEM graduates and three per cent of Non-STEM graduates.
The majority of graduates were females (55 per cent). This is in contrast with other STEM fields, such as Physics and Astronomy and Mathematics where the male population was in the majority. However, the majority of graduates in the workforce and the majority of doctorate degree holders were male (53 and 57 per cent, respectively).
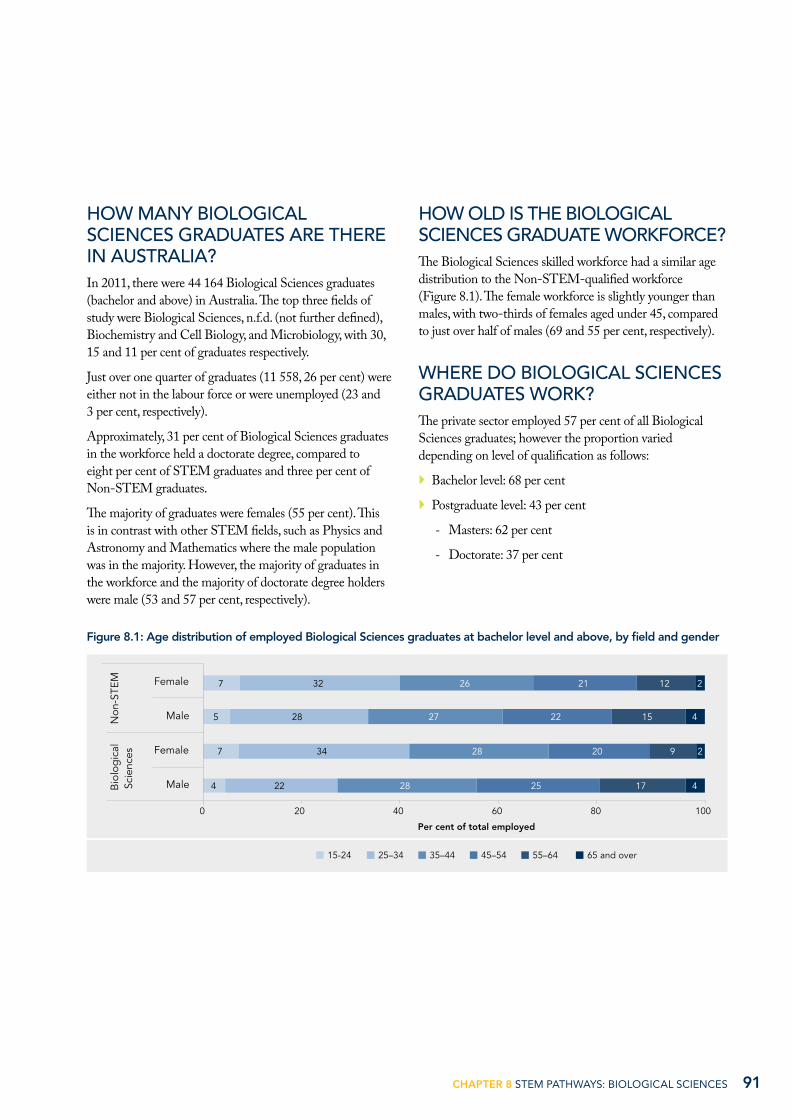
hOW OlD IS ThE BIOlOgIcal ScIEncES gRaDUaTE WORkFORcE?The Biological Sciences skilled workforce had a similar age distribution to the Non-STEM-qualified workforce (Figure 8.1). The female workforce is slightly younger than males, with two-thirds of females aged under 45, compared to just over half of males (69 and 55 per cent, respectively).
WhERE DO BIOlOgIcal ScIEncES gRaDUaTES WORk?The private sector employed 57 per cent of all Biological Sciences graduates; however the proportion varied depending on level of qualification as follows:
` Bachelor level: 68 per cent
` Postgraduate level: 43 per cent
- Masters: 62 per cent
- Doctorate: 37 per cent
Figure 8.1: Age distribution of employed Biological Sciences graduates at bachelor level and above, by field and gender
Per cent of total employed
Male
Female
Male
Female
Bio
log
ical
Scie
nces
Non
-STE
M
18
0 20 40 60 80 100
15-24 25–34 35–44 45–54 55–64 65 and over
7 34 28 20 9 2
5 28 27 22 15 4
7 32 26 21 12 2
4 22 28 25 17 4

92 AUSTRALIA’S STEM WORKFORCE
INDUSTRY SECTORS OF EMPLOYMENT
Industries are classified in four levels (ABS, 2006a):
` Divisions (the broadest level)
` Subdivisions
` Groups
` Classes (the finest level)
See Appendix B for a detailed list.
The top two industries that employed Biological Sciences graduates were Education and Training and Professional, Scientific and Technical Services (24 and 19 per cent, respectively) (Figure 8.2). Males and females were generally equally represented in the top ten industries of employment, except for the Health Care and Social Assistance industry where females made up 69 per cent of the workforce with Biological Sciences qualifications.
The top industries of employment for doctorate holders were the same as the aggregated cohort, with Education and Training employing 42 per cent and Professional, Scientific and Technical Services employing 24 per cent. Male representation in this workforce was higher in all industries
Figure 8.2: Top ten industry divisions of employment for Biological Sciences graduates with qualifications at bachelor level and above, by gender
Male Female
Per cent of graduates
2 3 3 3
4 5
12 13
19 24
0 5 10 15 20 25
Agriculture, Forestry and FishingAccommodation and Food Services
Wholesale TradeArts and Recreation Services
Retail TradeManufacturing
Health Care and Social AssistancePublic Administration and Safety
Professional, Scientific and Technical ServicesEducation and Training
Figure 8.3: Top ten industry divisions of employment for Biological Sciences doctoral graduates, by gender
Male Female
Per cent of graduates
1 1 1 1
2 3
7 13
24 42
0 10 20 30 40 50
Financial and Insurance ServicesOther Services
Agriculture, Forestry and FishingWholesale Trade
Arts and Recreation ServicesManufacturing
Health Care and Social AssistancePublic Administration and Safety
Professional, Scientific and Technical ServicesEducation and Training

93chapter 8 STEM PATHWAYS: biologicAl SciENcES
except Healthcare and Social Assistance where 52 per cent of the workforce was female (Figure 8.3).
At the level of industry class, Higher Education was the dominant destination, employing 18 per cent of all graduates and 38 per cent of doctorates (Figure 8.4 and Figure 8.5). The next most popular destination was Scientific Research Services (8 per cent of bachelor and above and 16 per cent of doctorates).
WhaT aRE ThE OccUPaTIOnS OF BIOlOgIcal ScIEncES gRaDUaTES?The majority of graduates in the Biological Sciences field worked as Professionals and Managers (55 and 14 per cent, respectively). Within the graduates employed as Professionals, the most common occupation sub-groups were:
` Design, Engineering, Science and Transport Professionals (53 per cent)
` Education Professionals (19 per cent)
` Business, Human Resource and Marketing Professionals (10 per cent).
Figure 8.4: Top ten industry classes of employment for Biological Sciences graduates with qualifications at bachelor level and above, by gender
Male Female
Per cent of graduates
2 2
2 2
3 3
5 7
8 18
0 5 10 15 20
Computer System Design and Related ServicesHuman Pharmaceutical & Medicinal Product Manufacturing
Secondary EducationPathology and Diagnostic Imaging Services
Central Government AdministrationManagement Advice and Related Consulting Services
Hospitals (except Psychiatric Hospitals)State Government Administration
Scientific Research ServicesHigher Education
Figure 8.5: Top ten industry classes of employment for Biological Sciences doctoral graduates, by gender
Male Female
Per cent of graduates
1
1
1
1
3
4 4
7 16
38
0 10 20 30 40
Engineering Design and Engineering Consulting Services
Pathology and Diagnostic Imaging Services
Secondary Education
Human Pharmaceutical & Medicinal Product Manufacturing
Management Advice and Related Consulting Services
Central Government AdministrationHospitals (except Psychiatric Hospitals)
State Government AdministrationScientific Research Services
Higher Education

94 AUSTRALIA’S STEM WORKFORCE
Occupations are classified in five levels (ABS, 2013):
` Major group (broadest level)
` Sub-major group
` Minor group
` Unit group
` Occupation (most detailed level)
See Appendix C for a detailed list.
At the finer unit group level of detail, Medical Laboratory Scientists (8 per cent) and Life Scientists (8 per cent) were the most common occupations (Figure 8.6).
Most occupations had an equal distribution of males and females; an exception is Medical Laboratory Scientists, where more females were employed at a ratio of 1:1.7.
ARE THE OCCUPATIONS OF BIOLOgICAL SCIENCES DOCTORATE HOLDERS DIFFERENT FROM BACHELOR DEgREE HOLDERS?
Almost 80 per cent of Biological Sciences doctorate holders were employed as Professionals and 13 per cent were employed as Managers. Of the Professionals, 32 per cent were employed in the private sector.
The most common occupations for doctorate holders at the unit level were University Lecturers and Tutors, Life Scientists, and Medical Laboratory Scientists (15, 12 and 12 per cent of graduates, respectively) (Figure 8.7).
Figure 8.6: Top ten unit group level occupations of Biological Sciences graduates with qualifications at bachelor level and above, by gender
Male Female
Per cent of graduates
2 2
2 2
4 4
6 6
8 8
0 2 4 6 8
Contract, Program and Project AdministratorsScience Technicians
Other Specialist ManagersSecondary School Teachers
Professionals nfdNatural and Physical Science Professionals nfd
Environmental ScientistsUniversity Lecturers and Tutors
Life ScientistsMedical Laboratory Scientists
Figure 8.7: Top ten unit group level occupations of Biological Sciences doctoral graduates, by gender
Male Female
Per cent of graduates
2 2
2 2
6 7
10 12 12
15
0 5 10 15 20
Secondary School TeachersOther Specialist Managers
Agricultural and Forestry ScientistsResearch and Development Managers
Environmental ScientistsProfessionals nfd
Natural and Physical Science Professionals nfdMedical Laboratory Scientists
Life ScientistsUniversity Lecturers and Tutors

95chapter 8 STEM PATHWAYS: biologicAl SciENcES
aRE BIOlOgIcal ScIEncES gRaDUaTES hIgh EaRnERS?Ten per cent of Biological Sciences bachelor degree holders and 25 per cent of doctorate holders had an income in the highest bracket (more than $104 000) (Figure 8.8). In comparison, 15 per cent of bachelor and 42 per cent
of doctorate graduates from Non-STEM fields had incomes in the highest range. Graduates earning less than $41 599 made up 44 per cent of all Biological Sciences graduates at bachelor level and 18 per cent of those with a doctorate degree.
Figure 8.8: Personal annual income of graduates, by field and level of qualification
Per cent of graduates
STEM
Biological Sciences
Biological Sciences
Non-STEM
Non-STEM
STEM
Bac
helo
rD
octo
rate
Less than $41 599 Between $41 600–$103 999 Greater than $104 000
400 20 60 80 100
34 51 15
27 48 25
44 46 10
18 40 42
15 52 33
18 58 25

96 AUSTRALIA’S STEM WORKFORCE
Graduate income levels were dependent on both gender and full-time or part-time employment, with fewer females and fewer part-time workers in the higher income brackets. More women were employed in a part-time role compared to men in all income brackets except those earning more than $104 000 per year (Figure 8.9).
Compared to the total STEM graduate cohort, a lower percentage of graduates with a bachelor degree in Biological Sciences reached the highest income bracket (more than $104 000) across all age groups and for both males and females (Figure 8.10).
The percentage of Biological Sciences bachelor graduates with earnings in the highest income bracket peaked for males at 26 per cent between the ages of 45 to 54. This was lower than the peak for the total STEM cohort, which was 35 per cent between 40 and 54; but higher than that for the total Non-STEM cohort, which peaked at 21 per cent at the same age groups. In comparison, the peak for females was lower than both the STEM and Non-STEM cohorts, and was 10 per cent between 45 and 54. The percentage of male graduates with earnings in the highest bracket was at least double that for females across all age groups, except above the age of 65.
At the doctorate level, the difference between the proportion in the top income bracket of the total STEM graduate cohort and those from Biological Sciences was not as large as for bachelors. The percentage of males in the top bracket exceeded that of the total STEM cohort between the ages of 50 and 59, reaching a maximum of 54 per cent in the 55 to 59 year age group. The percentage of males in the top bracket was around double that of females between the ages of 35 and 64 (Figure 8.11).
Figure 8.9: Personal annual income of Biological Sciences graduates working full-time and part-time, by field, gender and level of qualification
Per cent of total employed
Male
Female
Male
Female
Bac
helo
rD
octo
rate
0 20 40 60 80 100
Less than $41 599 Full-time
Greater than $104 000 Full-time
Between $41 599 and $104 999 Full-time
Part-time
Part-time
Part-time
Annual personal income and employment status
10 14 52 6 17 1
11 30 41 12 5 1
2 4 50 6 36 2
3 12 52 16 16 2

97chapter 8 STEM PATHWAYS: biologicAl SciENcES
Figure 8.10: Percentage of bachelor level graduates earning greater than $104 000 annually, by field, gender and age group
Biosciences male Non-STEM Biosciences female STEM
Per
cen
t w
ith
inco
me
gre
ater
tha
n $1
04 0
00
20–24 25–29 30–34 35–39 40–44 45–49 50–54 55–59 60–64 65 +
0
5
10
15
20
25
30
35
40
Figure 8.11: Percentage of doctoral level graduates earning greater than $104 000 annually, by field, gender and age group
20–24 25–29 30–34 35–39 40–44 45–49 50–54 55–59 60–64 65 +
Biological sciences male Non-STEM Biological sciences female STEM
Per
cen
t w
ith
inco
me
gre
ater
tha
n $1
04 0
00
0
10
20
30
40
50
60

98 AUSTRALIA’S STEM WORKFORCE
STEM PaThWayS: MEDIcal ScIEncEThere were 17 045 Medical Science graduates (bachelor and above) in Australia. One quarter of graduates (4189, 25 per cent) were not in the labour force (21 per cent) or were unemployed (3 per cent). The majority of graduates in the workforce were female (66 per cent).
Almost half of the male (48 per cent), and 56 per cent of female graduates were younger than 34, suggesting a recent increase in the popularity of studying in this field (Figure 8.12).
Healthcare industry subdivisions such as Medical and Other Healthcare Services and Hospitals employed approximately 45 per cent of Medical Science graduates (Figure 8.13). The most common occupation for graduates was as Design, Engineering, Science and Transport Professionals (43 per cent)(Figure 8.14). The personal incomes reported by Medical Science graduates is shown in Figure 8.15, and is similar to those reported by the Biological Sciences graduates. The level of qualification influences income, with higher proportions of graduates with a doctorate reporting higher income levels compared to bachelor qualified graduates (25 and 6 per cent, respectively).
Figure 8.12: Age distribution of employed Medical Science graduates with qualifications at bachelor level and above, by field and gender
Per cent of total employed
Male
Female
Male
Female
Med
ical
Scie
nce
Non
-STE
M
0 20 40 60 80 100
15-24 25–34 35–44 45–54 55–64 65 and over
5 28 27 22 15 4
7 32 26 21 12 2
17 39 21 16 7 1
17 31 20 17 12 3
Figure 8.13: Top five industry subdivisions employing Medical Science graduates, by gender
Male Female
Per cent of graduates
4
11
13
19
26
0 5 10 15 20 25 30
Other Store-Based Retailing
Professional, Scientific and Technical Services(except Computer System Design & Related Services)
Tertiary Education
Hospitals
Medical and Other Health Care Services

99chapter 8 STEM PATHWAYS: biologicAl SciENcES
Figure 8.14: Top five sub-major group occupations of Medical Science graduates, by gender
Male Female
Per cent of graduates
6
6 6
7 43
0 5 10 15 20 25 30 35 40 45
Education ProfessionalsHealth ProfessionalsSpecialist Managers
Engineering, ICT and Science TechniciansDesign, Engineering, Science and Transport Professionals
Figure 8.15: Personal annual income of graduates, by field and level of qualification
Per cent of graduates
STEM
Medical Science
Medical Science
Non-STEM
Non-STEM
STEM
Bac
helo
rD
octo
rate
Less than $41 599 Between $41 600–$103 999 Greater than $104 000
400 20 60 80 100
34 51 15
27 48 25
47 47 6
18 40 42
15 52 33
15 60 25

100 AUSTRALIA’S STEM WORKFORCE
STEM PaThWayS: FOOD ScIEncE anD BIOTEchnOlOgyIn 2011, there were 7700 Food Science and Biotechnology graduates (bachelor and above) in Australia. Twenty three per cent of graduates were not in the labour force (18 per cent) or were unemployed (3 per cent).
The gender ratio of this workforce was almost evenly balanced, at 49 per cent male and 51 per cent female.
Almost 51 per cent of males and 63 per cent of females were below the age of 34 (Figure 8.16). The largest proportions were observed in the 25-34 year age bracket for both genders, indicating a recent increase in the emphasis of this field.
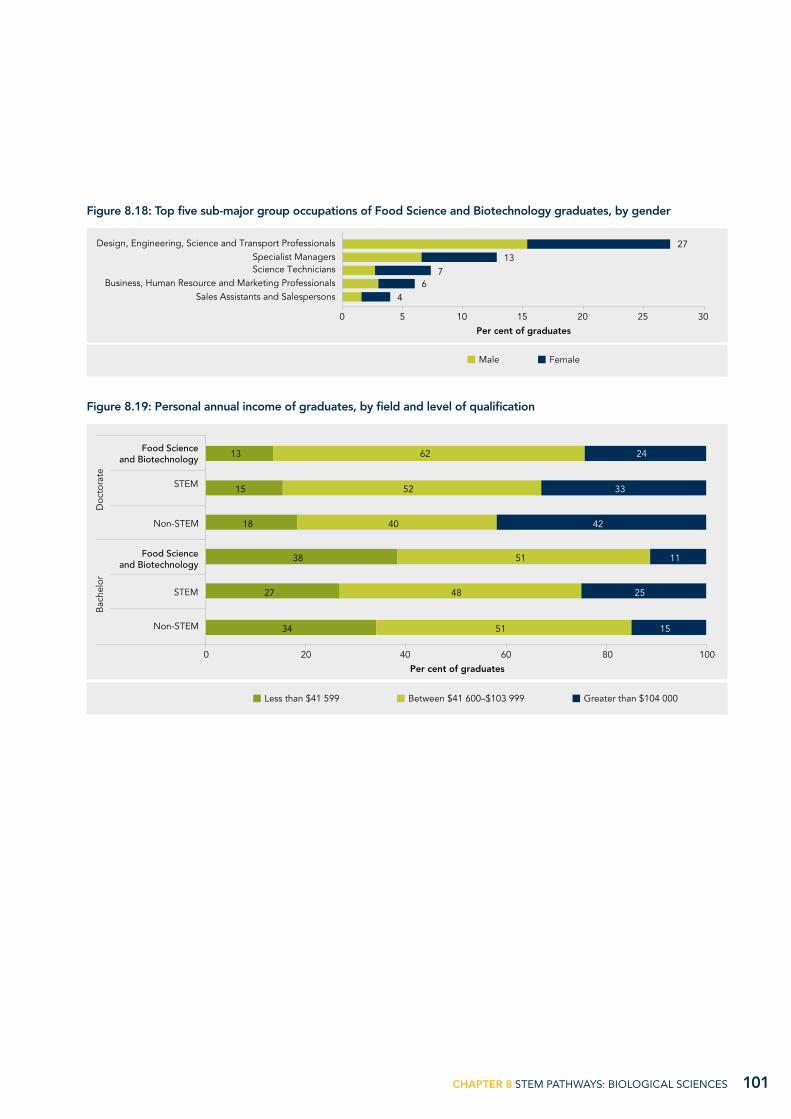
The top industries of employment were the food, beverage and tobacco manufacturing industries (Figure 8.17). These graduates were employed mostly as Design, Engineering and Science Professionals (27 per cent) or as Specialist Managers (13 per cent) (Figure 8.18). Personal annual incomes reported were marginally higher than Biological Sciences graduates at bachelor and doctorate level of education with fewer individuals reporting annual incomes of less than $41 599 (Figure 8.19).
Figure 8.16: Age distribution of employed Food Science and Biotechnology graduates with qualifications at bachelor level and above, by field and gender
Per cent of total employed
Male
Female
Male
Female
Non
-STE
M
18
0 20 40 60 80 100
15-24 25–34 35–44 45–54 55–64 65 and over
12 51 25 10 2
7 44 26 15 7 1
5 28 27 22 15 4
7 32 26 21 12 2
Food
Scie
nce
and
Bio
tech
nolo
gy
Figure 8.17: Top five industry subdivisions employing Food Science and Biotechnology graduates, by gender
Male Female
Per cent of graduates
5
9
11
12
15
0 4 8 12 16
Food and Beverage Services
Tertiary Education
Professional, Scientific and Technical Services (except Computer System Design and Related Services)
Food Product Manufacturing
Beverage and Tobacco Product Manufacturing
101chapter 8 STEM PATHWAYS: biologicAl SciENcES
Figure 8.18: Top five sub-major group occupations of Food Science and Biotechnology graduates, by gender
Male Female
Per cent of graduates
4 6
7 13
27
0 5 10 15 20 25 30
Sales Assistants and SalespersonsBusiness, Human Resource and Marketing Professionals
Science TechniciansSpecialist Managers
Design, Engineering, Science and Transport Professionals
Figure 8.19: Personal annual income of graduates, by field and level of qualification
Per cent of graduates
STEM
Food Scienceand Biotechnology
Food Scienceand Biotechnology
Non-STEM
Non-STEM
STEM
Bac
helo
rD
octo
rate
Less than $41 599 Between $41 600–$103 999 Greater than $104 000
400 20 60 80 100
34 51 15
27 48 25
38 51 11
18 40 42
15 52 33
13 62 24