chapter 7 wind energy - special report on renewable energy
TRANSCRIPT

535
Chapter 7
7 Wind Energy
Coordinating Lead Authors:Ryan Wiser (USA), Zhenbin Yang (China)
Lead Authors:Maureen Hand (USA), Olav Hohmeyer (Germany), David Infi eld (United Kingdom), Peter H. Jensen (Denmark), Vladimir Nikolaev (Russia), Mark O’Malley (Ireland), Graham Sinden (United Kingdom/Australia), Arthouros Zervos (Greece)
Contributing Authors:Naïm Darghouth (USA), Dennis Elliott (USA), Garvin Heath (USA), Ben Hoen (USA), Hannele Holttinen (Finland), Jason Jonkman (USA), Andrew Mills (USA), Patrick Moriarty (USA), Sara Pryor (USA), Scott Schreck (USA), Charles Smith (USA)
Review Editors: Christian Kjaer (Belgium/Denmark) and Fatemeh Rahimzadeh (Iran)
This chapter should be cited as:
Wiser, R., Z. Yang, M. Hand, O. Hohmeyer, D. Infi eld, P. H. Jensen, V. Nikolaev, M. O’Malley, G. Sinden,
A. Zervos, 2011: Wind Energy. In IPCC Special Report on Renewable Energy Sources and Climate Change
Mitigation [O. Edenhofer, R. Pichs-Madruga, Y. Sokona, K. Seyboth, P. Matschoss, S. Kadner, T. Zwickel,
P. Eickemeier, G. Hansen, S. Schlömer, C. von Stechow (eds)], Cambridge University Press, Cambridge, United
Kingdom and New York, NY, USA.

536
Wind Energy Chapter 7
Table of Contents
Executive Summary . . . . . . . . . . . . . . . . . . . . . . . . . . . . . . . . . . . . . . . . . . . . . . . . . . . . . . . . . . . . . . . . . . . . . . . . . . . . . . . . . . . . . . . . . . . . . . . . . . . . . . . . . . . . . . . . . . . . . . . . . . . . . . . . . . . . . . . . . . . . . 539
7.1 Introduction . . . . . . . . . . . . . . . . . . . . . . . . . . . . . . . . . . . . . . . . . . . . . . . . . . . . . . . . . . . . . . . . . . . . . . . . . . . . . . . . . . . . . . . . . . . . . . . . . . . . . . . . . . . . . . . . . . . . . . . . . . . . . . . . . . . . . . . . . 542
7.2 Resource potential . . . . . . . . . . . . . . . . . . . . . . . . . . . . . . . . . . . . . . . . . . . . . . . . . . . . . . . . . . . . . . . . . . . . . . . . . . . . . . . . . . . . . . . . . . . . . . . . . . . . . . . . . . . . . . . . . . . . . . . . . . . . . . 543
7.2.1 Global technical potential . . . . . . . . . . . . . . . . . . . . . . . . . . . . . . . . . . . . . . . . . . . . . . . . . . . . . . . . . . . . . . . . . . . . . . . . . . . . . . . . . . . . . . . . . . . . . . . . . . . . . . . . . . . . . . . . . . . . . . . . . . . 544
7.2.2 Regional technical potential . . . . . . . . . . . . . . . . . . . . . . . . . . . . . . . . . . . . . . . . . . . . . . . . . . . . . . . . . . . . . . . . . . . . . . . . . . . . . . . . . . . . . . . . . . . . . . . . . . . . . . . . . . . . . . . . . . . . . . . 5467.2.2.1 Global assessment results by region . . . . . . . . . . . . . . . . . . . . . . . . . . . . . . . . . . . . . . . . . . . . . . . . . . . . . . . . . . . . . . . . . . . . . . . . . . . . . . . . . . . . . . . . . . . . . . . . . . . . . . . . . . . . . . . . . . 5467.2.2.2 Regional assessment results . . . . . . . . . . . . . . . . . . . . . . . . . . . . . . . . . . . . . . . . . . . . . . . . . . . . . . . . . . . . . . . . . . . . . . . . . . . . . . . . . . . . . . . . . . . . . . . . . . . . . . . . . . . . . . . . . . . . . . . . . . . 547
7.2.3 Possible impact of climate change on resource potential . . . . . . . . . . . . . . . . . . . . . . . . . . . . . . . . . . . . . . . . . . . . . . . . . . . . . . . . . . . . . . . . . . . . . . . . . . . . . . . . . 548
7.3 Technology and applications . . . . . . . . . . . . . . . . . . . . . . . . . . . . . . . . . . . . . . . . . . . . . . . . . . . . . . . . . . . . . . . . . . . . . . . . . . . . . . . . . . . . . . . . . . . . . . . . . . . . . . . . . . . . . 550
7.3.1 Technology development and status . . . . . . . . . . . . . . . . . . . . . . . . . . . . . . . . . . . . . . . . . . . . . . . . . . . . . . . . . . . . . . . . . . . . . . . . . . . . . . . . . . . . . . . . . . . . . . . . . . . . . . . . . . . . . 5507.3.1.1 Basic design principles . . . . . . . . . . . . . . . . . . . . . . . . . . . . . . . . . . . . . . . . . . . . . . . . . . . . . . . . . . . . . . . . . . . . . . . . . . . . . . . . . . . . . . . . . . . . . . . . . . . . . . . . . . . . . . . . . . . . . . . . . . . . . . . . . . 5507.3.1.2 Onshore wind energy technology . . . . . . . . . . . . . . . . . . . . . . . . . . . . . . . . . . . . . . . . . . . . . . . . . . . . . . . . . . . . . . . . . . . . . . . . . . . . . . . . . . . . . . . . . . . . . . . . . . . . . . . . . . . . . . . . . . . . . 5517.3.1.3 Offshore wind energy technology . . . . . . . . . . . . . . . . . . . . . . . . . . . . . . . . . . . . . . . . . . . . . . . . . . . . . . . . . . . . . . . . . . . . . . . . . . . . . . . . . . . . . . . . . . . . . . . . . . . . . . . . . . . . . . . . . . . . . 553
7.3.2 International wind energy technology standards . . . . . . . . . . . . . . . . . . . . . . . . . . . . . . . . . . . . . . . . . . . . . . . . . . . . . . . . . . . . . . . . . . . . . . . . . . . . . . . . . . . . . . . . . . . . 554
7.3.3 Power conversion and related grid connection issues . . . . . . . . . . . . . . . . . . . . . . . . . . . . . . . . . . . . . . . . . . . . . . . . . . . . . . . . . . . . . . . . . . . . . . . . . . . . . . . . . . . . . . 555
7.4 Global and regional status of market and industry development . . . . . . . . . . . . . . . . . . . . . . . . . . . . . . . . . . . . . . . . . . . . . . . 556
7.4.1 Global status and trends . . . . . . . . . . . . . . . . . . . . . . . . . . . . . . . . . . . . . . . . . . . . . . . . . . . . . . . . . . . . . . . . . . . . . . . . . . . . . . . . . . . . . . . . . . . . . . . . . . . . . . . . . . . . . . . . . . . . . . . . . . . . 556
7.4.2 Regional and national status and trends . . . . . . . . . . . . . . . . . . . . . . . . . . . . . . . . . . . . . . . . . . . . . . . . . . . . . . . . . . . . . . . . . . . . . . . . . . . . . . . . . . . . . . . . . . . . . . . . . . . . . . . 556
7.4.3 Industry development . . . . . . . . . . . . . . . . . . . . . . . . . . . . . . . . . . . . . . . . . . . . . . . . . . . . . . . . . . . . . . . . . . . . . . . . . . . . . . . . . . . . . . . . . . . . . . . . . . . . . . . . . . . . . . . . . . . . . . . . . . . . . . . . 558
7.4.4 Impact of policies . . . . . . . . . . . . . . . . . . . . . . . . . . . . . . . . . . . . . . . . . . . . . . . . . . . . . . . . . . . . . . . . . . . . . . . . . . . . . . . . . . . . . . . . . . . . . . . . . . . . . . . . . . . . . . . . . . . . . . . . . . . . . . . . . . . . . . 559
7.5 Near-term grid integration issues . . . . . . . . . . . . . . . . . . . . . . . . . . . . . . . . . . . . . . . . . . . . . . . . . . . . . . . . . . . . . . . . . . . . . . . . . . . . . . . . . . . . . . . . . . . . . . . . . . . . . 560
7.5.1 Wind energy characteristics . . . . . . . . . . . . . . . . . . . . . . . . . . . . . . . . . . . . . . . . . . . . . . . . . . . . . . . . . . . . . . . . . . . . . . . . . . . . . . . . . . . . . . . . . . . . . . . . . . . . . . . . . . . . . . . . . . . . . . . . 560
7.5.2 Planning electric systems with wind energy . . . . . . . . . . . . . . . . . . . . . . . . . . . . . . . . . . . . . . . . . . . . . . . . . . . . . . . . . . . . . . . . . . . . . . . . . . . . . . . . . . . . . . . . . . . . . . . . . . . 5627.5.2.1 Electric system models . . . . . . . . . . . . . . . . . . . . . . . . . . . . . . . . . . . . . . . . . . . . . . . . . . . . . . . . . . . . . . . . . . . . . . . . . . . . . . . . . . . . . . . . . . . . . . . . . . . . . . . . . . . . . . . . . . . . . . . . . . . . . . . . . . 5627.5.2.2 Wind power electrical characteristics and grid codes . . . . . . . . . . . . . . . . . . . . . . . . . . . . . . . . . . . . . . . . . . . . . . . . . . . . . . . . . . . . . . . . . . . . . . . . . . . . . . . . . . . . . . . . . . . . . 562

537
Chapter 7 Wind Energy
7.5.2.3 Transmission infrastructure . . . . . . . . . . . . . . . . . . . . . . . . . . . . . . . . . . . . . . . . . . . . . . . . . . . . . . . . . . . . . . . . . . . . . . . . . . . . . . . . . . . . . . . . . . . . . . . . . . . . . . . . . . . . . . . . . . . . . . . . . . . . . 5637.5.2.4 Generation adequacy . . . . . . . . . . . . . . . . . . . . . . . . . . . . . . . . . . . . . . . . . . . . . . . . . . . . . . . . . . . . . . . . . . . . . . . . . . . . . . . . . . . . . . . . . . . . . . . . . . . . . . . . . . . . . . . . . . . . . . . . . . . . . . . . . . . . 563
7.5.3 Operating electric systems with wind energy . . . . . . . . . . . . . . . . . . . . . . . . . . . . . . . . . . . . . . . . . . . . . . . . . . . . . . . . . . . . . . . . . . . . . . . . . . . . . . . . . . . . . . . . . . . . . . . . . 5647.5.3.1 Integration, fl exibility and variability . . . . . . . . . . . . . . . . . . . . . . . . . . . . . . . . . . . . . . . . . . . . . . . . . . . . . . . . . . . . . . . . . . . . . . . . . . . . . . . . . . . . . . . . . . . . . . . . . . . . . . . . . . . . . . . . . 5647.5.3.2 Practical experience with operating electric systems with wind energy . . . . . . . . . . . . . . . . . . . . . . . . . . . . . . . . . . . . . . . . . . . . . . . . . . . . . . . . . . . . . . . . . . . . . . . 566
7.5.4 Results from integration studies . . . . . . . . . . . . . . . . . . . . . . . . . . . . . . . . . . . . . . . . . . . . . . . . . . . . . . . . . . . . . . . . . . . . . . . . . . . . . . . . . . . . . . . . . . . . . . . . . . . . . . . . . . . . . . . . . . 5677.5.4.1 Methodological challenges . . . . . . . . . . . . . . . . . . . . . . . . . . . . . . . . . . . . . . . . . . . . . . . . . . . . . . . . . . . . . . . . . . . . . . . . . . . . . . . . . . . . . . . . . . . . . . . . . . . . . . . . . . . . . . . . . . . . . . . . . . . . . 5687.5.4.2 Increased balancing cost with wind energy . . . . . . . . . . . . . . . . . . . . . . . . . . . . . . . . . . . . . . . . . . . . . . . . . . . . . . . . . . . . . . . . . . . . . . . . . . . . . . . . . . . . . . . . . . . . . . . . . . . . . . . . . 5687.5.4.3 Relative cost of generation adequacy with wind energy . . . . . . . . . . . . . . . . . . . . . . . . . . . . . . . . . . . . . . . . . . . . . . . . . . . . . . . . . . . . . . . . . . . . . . . . . . . . . . . . . . . . . . . . . . 5697.5.4.4 Cost of transmission for wind energy . . . . . . . . . . . . . . . . . . . . . . . . . . . . . . . . . . . . . . . . . . . . . . . . . . . . . . . . . . . . . . . . . . . . . . . . . . . . . . . . . . . . . . . . . . . . . . . . . . . . . . . . . . . . . . . . 569
7.6 Environmental and social impacts . . . . . . . . . . . . . . . . . . . . . . . . . . . . . . . . . . . . . . . . . . . . . . . . . . . . . . . . . . . . . . . . . . . . . . . . . . . . . . . . . . . . . . . . . . . . . . . . . . . . 570
7.6.1 Environmental net benefi ts of wind energy . . . . . . . . . . . . . . . . . . . . . . . . . . . . . . . . . . . . . . . . . . . . . . . . . . . . . . . . . . . . . . . . . . . . . . . . . . . . . . . . . . . . . . . . . . . . . . . . . . . 5707.6.1.1 Direct impacts . . . . . . . . . . . . . . . . . . . . . . . . . . . . . . . . . . . . . . . . . . . . . . . . . . . . . . . . . . . . . . . . . . . . . . . . . . . . . . . . . . . . . . . . . . . . . . . . . . . . . . . . . . . . . . . . . . . . . . . . . . . . . . . . . . . . . . . . . . . . 5707.6.1.2 Indirect lifecycle impacts . . . . . . . . . . . . . . . . . . . . . . . . . . . . . . . . . . . . . . . . . . . . . . . . . . . . . . . . . . . . . . . . . . . . . . . . . . . . . . . . . . . . . . . . . . . . . . . . . . . . . . . . . . . . . . . . . . . . . . . . . . . . . . . . 5717.6.1.3 Indirect variability impacts . . . . . . . . . . . . . . . . . . . . . . . . . . . . . . . . . . . . . . . . . . . . . . . . . . . . . . . . . . . . . . . . . . . . . . . . . . . . . . . . . . . . . . . . . . . . . . . . . . . . . . . . . . . . . . . . . . . . . . . . . . . . . 5717.6.1.4 Net environmental benefi ts . . . . . . . . . . . . . . . . . . . . . . . . . . . . . . . . . . . . . . . . . . . . . . . . . . . . . . . . . . . . . . . . . . . . . . . . . . . . . . . . . . . . . . . . . . . . . . . . . . . . . . . . . . . . . . . . . . . . . . . . . . . . 572
7.6.2 Ecological impacts . . . . . . . . . . . . . . . . . . . . . . . . . . . . . . . . . . . . . . . . . . . . . . . . . . . . . . . . . . . . . . . . . . . . . . . . . . . . . . . . . . . . . . . . . . . . . . . . . . . . . . . . . . . . . . . . . . . . . . . . . . . . . . . . . . . . . 5727.6.2.1 Bird and bat collision fatalities . . . . . . . . . . . . . . . . . . . . . . . . . . . . . . . . . . . . . . . . . . . . . . . . . . . . . . . . . . . . . . . . . . . . . . . . . . . . . . . . . . . . . . . . . . . . . . . . . . . . . . . . . . . . . . . . . . . . . . . . 5727.6.2.2 Habitat and ecosystem modifi cations . . . . . . . . . . . . . . . . . . . . . . . . . . . . . . . . . . . . . . . . . . . . . . . . . . . . . . . . . . . . . . . . . . . . . . . . . . . . . . . . . . . . . . . . . . . . . . . . . . . . . . . . . . . . . . . . 5737.6.2.3 Impact of wind power plants on the local climate . . . . . . . . . . . . . . . . . . . . . . . . . . . . . . . . . . . . . . . . . . . . . . . . . . . . . . . . . . . . . . . . . . . . . . . . . . . . . . . . . . . . . . . . . . . . . . . . . 574
7.6.3 Impacts on human activities and well-being . . . . . . . . . . . . . . . . . . . . . . . . . . . . . . . . . . . . . . . . . . . . . . . . . . . . . . . . . . . . . . . . . . . . . . . . . . . . . . . . . . . . . . . . . . . . . . . . . . 5747.6.3.1 Land and marine usage . . . . . . . . . . . . . . . . . . . . . . . . . . . . . . . . . . . . . . . . . . . . . . . . . . . . . . . . . . . . . . . . . . . . . . . . . . . . . . . . . . . . . . . . . . . . . . . . . . . . . . . . . . . . . . . . . . . . . . . . . . . . . . . . . 5747.6.3.2 Visual impacts . . . . . . . . . . . . . . . . . . . . . . . . . . . . . . . . . . . . . . . . . . . . . . . . . . . . . . . . . . . . . . . . . . . . . . . . . . . . . . . . . . . . . . . . . . . . . . . . . . . . . . . . . . . . . . . . . . . . . . . . . . . . . . . . . . . . . . . . . . . . 5757.6.3.3 Noise, fl icker, health and safety . . . . . . . . . . . . . . . . . . . . . . . . . . . . . . . . . . . . . . . . . . . . . . . . . . . . . . . . . . . . . . . . . . . . . . . . . . . . . . . . . . . . . . . . . . . . . . . . . . . . . . . . . . . . . . . . . . . . . . . . 5757.6.3.4 Property values . . . . . . . . . . . . . . . . . . . . . . . . . . . . . . . . . . . . . . . . . . . . . . . . . . . . . . . . . . . . . . . . . . . . . . . . . . . . . . . . . . . . . . . . . . . . . . . . . . . . . . . . . . . . . . . . . . . . . . . . . . . . . . . . . . . . . . . . . . . 576
7.6.4 Public attitudes and acceptance . . . . . . . . . . . . . . . . . . . . . . . . . . . . . . . . . . . . . . . . . . . . . . . . . . . . . . . . . . . . . . . . . . . . . . . . . . . . . . . . . . . . . . . . . . . . . . . . . . . . . . . . . . . . . . . . . . 576
7.6.5 Minimizing social and environmental concerns . . . . . . . . . . . . . . . . . . . . . . . . . . . . . . . . . . . . . . . . . . . . . . . . . . . . . . . . . . . . . . . . . . . . . . . . . . . . . . . . . . . . . . . . . . . . . . 576
7.7 Prospects for technology improvement and innovation . . . . . . . . . . . . . . . . . . . . . . . . . . . . . . . . . . . . . . . . . . . . . . . . . . . . . . . . . . . . . . . 577
7.7.1 Research and development programmes . . . . . . . . . . . . . . . . . . . . . . . . . . . . . . . . . . . . . . . . . . . . . . . . . . . . . . . . . . . . . . . . . . . . . . . . . . . . . . . . . . . . . . . . . . . . . . . . . . . . . . . 577
7.7.2 System-level design and optimization . . . . . . . . . . . . . . . . . . . . . . . . . . . . . . . . . . . . . . . . . . . . . . . . . . . . . . . . . . . . . . . . . . . . . . . . . . . . . . . . . . . . . . . . . . . . . . . . . . . . . . . . . . 578
7.7.3 Component-level innovation opportunities . . . . . . . . . . . . . . . . . . . . . . . . . . . . . . . . . . . . . . . . . . . . . . . . . . . . . . . . . . . . . . . . . . . . . . . . . . . . . . . . . . . . . . . . . . . . . . . . . . . . 5787.7.3.1 Advanced tower concepts . . . . . . . . . . . . . . . . . . . . . . . . . . . . . . . . . . . . . . . . . . . . . . . . . . . . . . . . . . . . . . . . . . . . . . . . . . . . . . . . . . . . . . . . . . . . . . . . . . . . . . . . . . . . . . . . . . . . . . . . . . . . . . 5787.7.3.2 Advanced rotors and blades . . . . . . . . . . . . . . . . . . . . . . . . . . . . . . . . . . . . . . . . . . . . . . . . . . . . . . . . . . . . . . . . . . . . . . . . . . . . . . . . . . . . . . . . . . . . . . . . . . . . . . . . . . . . . . . . . . . . . . . . . . . 578
538
Wind Energy Chapter 7
7.7.3.3 Reduced energy losses and improved availability . . . . . . . . . . . . . . . . . . . . . . . . . . . . . . . . . . . . . . . . . . . . . . . . . . . . . . . . . . . . . . . . . . . . . . . . . . . . . . . . . . . . . . . . . . . . . . . . . . 5797.7.3.4 Advanced drive trains, generators, and power electronics . . . . . . . . . . . . . . . . . . . . . . . . . . . . . . . . . . . . . . . . . . . . . . . . . . . . . . . . . . . . . . . . . . . . . . . . . . . . . . . . . . . . . . . 5807.7.3.5 Manufacturing learning . . . . . . . . . . . . . . . . . . . . . . . . . . . . . . . . . . . . . . . . . . . . . . . . . . . . . . . . . . . . . . . . . . . . . . . . . . . . . . . . . . . . . . . . . . . . . . . . . . . . . . . . . . . . . . . . . . . . . . . . . . . . . . . . . 5807.7.3.6 Offshore research and development opportunities . . . . . . . . . . . . . . . . . . . . . . . . . . . . . . . . . . . . . . . . . . . . . . . . . . . . . . . . . . . . . . . . . . . . . . . . . . . . . . . . . . . . . . . . . . . . . . . . 580
7.7.4 The importance of underpinning science . . . . . . . . . . . . . . . . . . . . . . . . . . . . . . . . . . . . . . . . . . . . . . . . . . . . . . . . . . . . . . . . . . . . . . . . . . . . . . . . . . . . . . . . . . . . . . . . . . . . . . . 582
7.8 Cost trends . . . . . . . . . . . . . . . . . . . . . . . . . . . . . . . . . . . . . . . . . . . . . . . . . . . . . . . . . . . . . . . . . . . . . . . . . . . . . . . . . . . . . . . . . . . . . . . . . . . . . . . . . . . . . . . . . . . . . . . . . . . . . . . . . . . . . . . . . . 583
7.8.1 Factors that affect the cost of wind energy . . . . . . . . . . . . . . . . . . . . . . . . . . . . . . . . . . . . . . . . . . . . . . . . . . . . . . . . . . . . . . . . . . . . . . . . . . . . . . . . . . . . . . . . . . . . . . . . . . . 583
7.8.2 Historical trends . . . . . . . . . . . . . . . . . . . . . . . . . . . . . . . . . . . . . . . . . . . . . . . . . . . . . . . . . . . . . . . . . . . . . . . . . . . . . . . . . . . . . . . . . . . . . . . . . . . . . . . . . . . . . . . . . . . . . . . . . . . . . . . . . . . . . . . . 5847.8.2.1 Investment costs . . . . . . . . . . . . . . . . . . . . . . . . . . . . . . . . . . . . . . . . . . . . . . . . . . . . . . . . . . . . . . . . . . . . . . . . . . . . . . . . . . . . . . . . . . . . . . . . . . . . . . . . . . . . . . . . . . . . . . . . . . . . . . . . . . . . . . . . . 5847.8.2.2 Operation and maintenance . . . . . . . . . . . . . . . . . . . . . . . . . . . . . . . . . . . . . . . . . . . . . . . . . . . . . . . . . . . . . . . . . . . . . . . . . . . . . . . . . . . . . . . . . . . . . . . . . . . . . . . . . . . . . . . . . . . . . . . . . . . 5847.8.2.3 Energy production . . . . . . . . . . . . . . . . . . . . . . . . . . . . . . . . . . . . . . . . . . . . . . . . . . . . . . . . . . . . . . . . . . . . . . . . . . . . . . . . . . . . . . . . . . . . . . . . . . . . . . . . . . . . . . . . . . . . . . . . . . . . . . . . . . . . . . . . 585
7.8.3 Current conditions . . . . . . . . . . . . . . . . . . . . . . . . . . . . . . . . . . . . . . . . . . . . . . . . . . . . . . . . . . . . . . . . . . . . . . . . . . . . . . . . . . . . . . . . . . . . . . . . . . . . . . . . . . . . . . . . . . . . . . . . . . . . . . . . . . . . . 5867.8.3.1 Investment costs . . . . . . . . . . . . . . . . . . . . . . . . . . . . . . . . . . . . . . . . . . . . . . . . . . . . . . . . . . . . . . . . . . . . . . . . . . . . . . . . . . . . . . . . . . . . . . . . . . . . . . . . . . . . . . . . . . . . . . . . . . . . . . . . . . . . . . . . . 5867.8.3.2 Operation and maintenance . . . . . . . . . . . . . . . . . . . . . . . . . . . . . . . . . . . . . . . . . . . . . . . . . . . . . . . . . . . . . . . . . . . . . . . . . . . . . . . . . . . . . . . . . . . . . . . . . . . . . . . . . . . . . . . . . . . . . . . . . . . 5877.8.3.3 Energy production . . . . . . . . . . . . . . . . . . . . . . . . . . . . . . . . . . . . . . . . . . . . . . . . . . . . . . . . . . . . . . . . . . . . . . . . . . . . . . . . . . . . . . . . . . . . . . . . . . . . . . . . . . . . . . . . . . . . . . . . . . . . . . . . . . . . . . . . 5877.8.3.4 Levelized cost of energy estimates . . . . . . . . . . . . . . . . . . . . . . . . . . . . . . . . . . . . . . . . . . . . . . . . . . . . . . . . . . . . . . . . . . . . . . . . . . . . . . . . . . . . . . . . . . . . . . . . . . . . . . . . . . . . . . . . . . . . 588
7.8.4 Potential for further reductions in the cost of wind energy . . . . . . . . . . . . . . . . . . . . . . . . . . . . . . . . . . . . . . . . . . . . . . . . . . . . . . . . . . . . . . . . . . . . . . . . . . . . . . 5897.8.4.1 Learning curve estimates . . . . . . . . . . . . . . . . . . . . . . . . . . . . . . . . . . . . . . . . . . . . . . . . . . . . . . . . . . . . . . . . . . . . . . . . . . . . . . . . . . . . . . . . . . . . . . . . . . . . . . . . . . . . . . . . . . . . . . . . . . . . . . . 5897.8.4.2 Engineering model estimates . . . . . . . . . . . . . . . . . . . . . . . . . . . . . . . . . . . . . . . . . . . . . . . . . . . . . . . . . . . . . . . . . . . . . . . . . . . . . . . . . . . . . . . . . . . . . . . . . . . . . . . . . . . . . . . . . . . . . . . . . . 5907.8.4.3 Projected levelized cost of wind energy . . . . . . . . . . . . . . . . . . . . . . . . . . . . . . . . . . . . . . . . . . . . . . . . . . . . . . . . . . . . . . . . . . . . . . . . . . . . . . . . . . . . . . . . . . . . . . . . . . . . . . . . . . . . . . 590
7.9 Potential deployment . . . . . . . . . . . . . . . . . . . . . . . . . . . . . . . . . . . . . . . . . . . . . . . . . . . . . . . . . . . . . . . . . . . . . . . . . . . . . . . . . . . . . . . . . . . . . . . . . . . . . . . . . . . . . . . . . . . . . . . . . 591
7.9.1 Near-term forecasts . . . . . . . . . . . . . . . . . . . . . . . . . . . . . . . . . . . . . . . . . . . . . . . . . . . . . . . . . . . . . . . . . . . . . . . . . . . . . . . . . . . . . . . . . . . . . . . . . . . . . . . . . . . . . . . . . . . . . . . . . . . . . . . . . . . 591
7.9.2 Long-term deployment in the context of carbon mitigation . . . . . . . . . . . . . . . . . . . . . . . . . . . . . . . . . . . . . . . . . . . . . . . . . . . . . . . . . . . . . . . . . . . . . . . . . . . . . 591
7.9.3 Conclusions regarding deployment . . . . . . . . . . . . . . . . . . . . . . . . . . . . . . . . . . . . . . . . . . . . . . . . . . . . . . . . . . . . . . . . . . . . . . . . . . . . . . . . . . . . . . . . . . . . . . . . . . . . . . . . . . . . . . 595
References . . . . . . . . . . . . . . . . . . . . . . . . . . . . . . . . . . . . . . . . . . . . . . . . . . . . . . . . . . . . . . . . . . . . . . . . . . . . . . . . . . . . . . . . . . . . . . . . . . . . . . . . . . . . . . . . . . . . . . . . . . . . . . . . . . . . . . . . . . . . . . . . . . . . . . . . . . . . 596

539
Chapter 7 Wind Energy
Executive Summary
Wind energy offers signifi cant potential for near-term (2020) and long-term (2050) greenhouse gas (GHG) emissions reductions. A number of different wind energy technologies are available across a range of applications, but the primary use of wind energy of relevance to climate change mitigation is to generate electricity from larger, grid-connected wind turbines, deployed either on- or offshore. Focusing on these technologies, the wind power capacity installed by the end of 2009 was capable of meeting roughly 1.8% of worldwide electricity demand, and that contribution could grow to in excess of 20% by 2050 if ambitious efforts are made to reduce GHG emissions and to address the other impediments to increased wind energy deployment. Onshore wind energy is already being deployed at a rapid pace in many countries, and no insurmountable technical barriers exist that preclude increased levels of wind energy penetration into electricity supply systems. Moreover, though average wind speeds vary considerably by location, ample technical potential exists in most regions of the world to enable signifi cant wind energy deployment. In some areas with good wind resources, the cost of wind energy is already competitive with current energy market prices, even without considering relative environmental impacts. Nonetheless, in most regions of the world, policy measures are still required to ensure rapid deployment. Continued advances in on- and offshore wind energy technology are expected, however, further reducing the cost of wind energy and improving wind energy’s GHG emissions reduction potential.
The wind energy market has expanded rapidly. Modern wind turbines have evolved from small, simple machines to large, highly sophisticated devices, driven in part by more than three decades of basic and applied research and development (R&D). Typical wind turbine nameplate capacity ratings have increased dramatically since the 1980s, from roughly 75 kW to 1.5 MW and larger; wind turbine rotors now often exceed 80 m in diameter and are positioned on towers exceeding 80 m in height. The resulting cost reductions, along with government policies to expand renewable energy (RE) supply, have led to rapid market development. From a cumulative capacity of 14 GW by the end of 1999, global installed wind power capacity increased 12-fold in 10 years to reach almost 160 GW by the end of 2009. Most additions have been onshore, but 2.1 GW of offshore capacity was installed by the end of 2009, with European coun-tries embarking on ambitious programmes of offshore wind energy deployment. From 2000 through 2009, roughly 11% of all global newly installed net electric capacity additions (in GW) came from new wind power plants; in 2009 alone, that fi gure was likely more than 20%. Total investment in wind power plant installations in 2009 equalled roughly USD2005 57 billion, while direct employment in the wind energy sector has been estimated at 500,000. Nonetheless, wind energy remains a relatively small fraction of worldwide electricity supply, and growth has been concentrated in Europe, Asia and North America. The top fi ve countries in cumulative installed capacity by the end of 2009 were the USA, China, Germany, Spain and India. Policy frameworks continue to play a signifi cant role in wind energy utilization.
The global technical potential for wind energy exceeds current global electricity production. Estimates of global technical potential range from a low of 70 EJ/yr (19,400 TWh/yr) (onshore only) to a high of 450 EJ/yr (125,000 TWh/yr) (onshore and near-shore) among those studies that consider relatively more development constraints. Estimates of the technical potential for offshore wind energy alone range from 15 EJ/yr to 130 EJ/yr (4,000-37,000 TWh/yr) when only considering relatively shallower and near-shore applications; greater technical potential is available if also con-sidering deeper water applications that might rely on fl oating wind turbine designs. Economic constraints, institutional challenges associated with transmission access and operational integration, and concerns about social acceptance and environmental impacts are more likely to restrict growth than is the global technical potential. Ample technical potential also exists in most regions of the world to enable signifi cant wind energy deployment relative to current levels. The wind resource is not evenly distributed across the globe nor uniformly located near population centres, however, and wind energy will therefore not contribute equally in meeting the needs of every country. Research into the effects of global climate change on the geographic distribution and variability of the wind resource is nascent, but research to date suggests that those effects are unlikely to be of a magnitude to greatly impact the global potential for wind energy deployment.

540
Wind Energy Chapter 7
Analysis and operational experience demonstrate that successful integration of wind energy is achievable. Wind energy has characteristics that pose new challenges to electric system planners and operators, such as variable electrical output, limited (but improving) output predictability, and locational dependence. Acceptable wind electricity penetration limits and the operational costs of integration are system-specifi c, but wind energy has been successfully integrated into existing electric systems; in four countries (Denmark, Portugal, Spain, Ireland), wind energy in 2010 was already able to supply from 10 to roughly 20% of annual electricity demand. Detailed analyses and operating experi-ence primarily from certain Organisation for Economic Co-operation and Development (OECD) countries suggest that, at low to medium levels of wind electricity penetration (up to 20% of total electricity demand), the integration of wind energy generally poses no insurmountable technical barriers and is economically manageable. Concerns about (and the costs of) wind energy integration will grow with wind energy deployment, however, and even at lower penetration levels, integration issues must be addressed. Active management through fl exible power generation technologies, wind energy forecasting and output curtailment, and increased coordination and interconnection between electric systems are anticipated. Mass market demand response, bulk energy storage technologies, large-scale deployment of electric vehicles, diverting excess wind energy to fuel production or local heating and geographic diversifi cation of wind power plant siting will also become increasingly benefi cial as wind electricity penetration rises. Wind energy technology advances driven by electric system connection standards will increasingly enable wind power plants to become more active participants in maintaining the operability of the electric system. Finally, signifi cant new transmission infrastruc-ture, both on- and offshore, may be required to access areas with higher-quality wind resources. At low to medium levels of wind electricity penetration, the additional costs of managing variability and uncertainty, ensuring generation adequacy and adding new transmission to accommodate wind energy have been estimated to generally be in the range of US cents2005 0.7 to 3/kWh.
Environmental and social issues will affect wind energy deployment opportunities. The energy used and GHG emissions produced in the direct manufacture, transport, installation, operation and decommissioning of wind turbines are small compared to the energy generated and emissions avoided over the lifetime of wind power plants: the GHG emissions intensity of wind energy is estimated to range from 8 to 20 g CO2 /kWh in most instances, whereas energy payback times are between 3.4 to 8.5 months. In addition, managing the variability of wind power output has not been found to signifi cantly degrade the GHG emissions benefi ts of wind energy. Alongside these benefi ts, however, wind energy also has the potential to produce some detrimental impacts on the environment and on human activities and well-being. The construction and operation of wind power plants impacts wildlife through bird and bat collisions and through habitat and ecosystem modifi cations, with the nature and magnitude of those impacts being site- and species-specifi c. For offshore wind energy, implications for benthic resources, fi sheries and marine life must also be considered. Prominent social concerns include visibility/landscape impacts as well various nuisance effects and possible radar inter-ference. Research is also underway on the potential impact of wind power plants on the local climate. As wind energy deployment increases and as larger wind power plants are considered, these existing concerns may become more acute and new concerns may arise. Though attempts to measure the relative impacts of various electricity supply technologies suggest that wind energy generally has a comparatively small environmental footprint, impacts do exist. Appropriate planning and siting procedures can reduce the impact of wind energy development on ecosystems and local communi-ties, and techniques for assessing, minimizing and mitigating the remaining concerns could be further improved. Finally, though community and scientifi c concerns should be addressed, more proactive planning, siting and permitting proce-dures may be required to enable more rapid growth in wind energy utilization.
Technology innovation can further reduce the cost of wind energy. Current wind turbine technology has been developed largely for onshore applications, and has converged to three-bladed upwind rotors, with variable speed operation. Though onshore wind energy technology is already commercially manufactured and deployed on a large scale, continued incremental advances are expected to yield improved turbine design procedures, more effi cient mate-rials usage, increased reliability and energy capture, reduced operation and maintenance (O&M) costs and longer
541
Chapter 7 Wind Energy
component lifetimes. In addition, as offshore wind energy gains more attention, new technology challenges arise and more radical technology innovations are possible (e.g., fl oating turbines). Wind turbine nameplate capacity ratings of 2 to 5 MW have been common for offshore wind power plants, but 10 MW and larger turbines are under consideration. Advances can also be made through more fundamental research to better understand the operating environment in which wind turbines must operate. For onshore wind power plants built in 2009, levelized generation costs in good to excellent wind resource regimes are estimated to average US cents2005 5 to 10/kWh, reaching US cents2005 15/kWh in lower resource areas. Offshore wind energy has typical levelized generation costs that are estimated to range from US cents2005 10/kWh to more than US cents2005 20/kWh for recently built or planned plants located in relatively shallow water. Reductions in the levelized cost of onshore wind energy of 10 to 30% by 2020 are often reported in the litera-ture. Offshore wind energy is often found to have somewhat greater potential for cost reductions: 10 to 40% by 2020.
Wind energy offers signifi cant potential for near- and long-term GHG emissions reductions. Given the com-mercial maturity and cost of onshore wind energy technology, wind energy offers the potential for signifi cant near-term GHG emissions reductions: this potential is not conditioned on technology breakthroughs, and no insurmountable technical barriers exist that preclude increased levels of wind electricity penetration. As technology advances continue, greater contributions to GHG emissions reductions are possible in the longer term. Based on a review of the literature on the possible future contribution of RE supplies to meeting global energy needs under a range of GHG concentration stabilization scenarios, wind energy’s contribution to global electricity supply could rise from 1.8% by the end of 2009 to 13 to 14% by 2050 in the median scenario for GHG concentration stabilization ranges of 440 to 600 and <440 ppm CO2. At the 75th percentile of reviewed scenarios, and under similarly ambitious efforts to reduce GHG emissions, wind energy’s contribution is shown to grow to 21 to 25% by 2050. Achieving the higher end of this range would be likely to require not only economic support policies of adequate size and predictability, but also an expansion of wind energy utilization regionally, increased reliance on offshore wind energy, technical and institutional solutions to transmission constraints and operational integration concerns, and proactive efforts to mitigate and manage social and environmen-tal concerns. Additional R&D is expected to lead to incremental cost reductions for onshore wind energy, and enhanced R&D expenditures may be especially important for offshore wind energy technology. Finally, for those markets with good wind resources but that are new to wind energy deployment, both knowledge and technology transfer may help facilitate early wind power plant installations.

542
Wind Energy Chapter 7
7.1 Introduction
This chapter addresses the potential role of wind energy in reducing GHG emissions. Wind energy (in many applications) is a mature renew-able energy RE source that has been successfully deployed in many countries. It is technically and economically capable of signifi cant con-tinued expansion, and its further exploitation may be a crucial aspect of global GHG reduction strategies. Though average wind speeds vary considerably by location, the world’s technical potential for wind energy exceeds global electricity production, and ample technical potential exists in most regions of the world to enable signifi cant wind energy deployment.
Wind energy relies, indirectly, on the energy of the sun. A small propor-tion of the solar radiation received by the Earth is converted into kinetic energy (Hubbert, 1971), the main cause of which is the imbalance between the net outgoing radiation at high latitudes and the net incom-ing radiation at low latitudes. The Earth’s rotation, geographic features and temperature gradients affect the location and nature of the result-ing winds (Burton et al., 2001). The use of wind energy requires that the kinetic energy of moving air be converted to useful energy. As a result, the economics of using wind for electricity supply are highly sensitive to local wind conditions and the ability of wind turbines to reliably extract energy over a wide range of typical wind speeds.
Wind energy has been used for millennia (for historical overviews, see, e.g., Gipe, 1995; Ackermann and Soder, 2002; Pasqualetti et al., 2004; Musgrove, 2010). Sailing vessels relied on the wind from before 3,000 BC, with mechanical applications of wind energy in grinding grain, pumping water and powering factory machinery following, fi rst with vertical axis devices and subsequently with horizontal axis turbines. By 200 BC, for example, simple windmills in China were pumping water, while vertical axis windmills were grinding grain in Persia and the Middle East. By the 11th century, windmills were used in food production in the Middle East; returning merchants and crusaders carried this idea back to Europe. The Dutch and others refi ned the windmill and adapted it further for industrial applications such as sawing wood, making paper and draining lakes and marshes. When settlers took this technology to the New World in the late 19th century, they began using windmills to pump water for farms and ranches. Industrialization and rural electrifi -cation, fi rst in Europe and later in the USA, led to a gradual decline in the use of windmills for mechanical applications. The fi rst successful experi-ments with the use of wind to generate electricity are often credited to James Blyth (1887), Charles Brush (1887), and Poul la Cour (1891). The use of wind electricity in rural areas and, experimentally, in larger-scale applications, continued throughout the mid-1900s. However, the use of wind to generate electricity at a commercial scale became viable only in the 1970s as a result of technical advances and government support, fi rst in Denmark at a relatively small scale, then at a much larger scale in California (1980s), and then in Denmark, Germany and Spain (1990s).
The primary use of wind energy of relevance to climate change mitiga-tion is to generate electricity from larger, grid-connected wind turbines, deployed either in a great number of smaller wind power plants or a smaller number of much larger plants. As of 2010, such turbines often stand on tubular towers exceeding 80 m in height, with three-bladed rotors that often exceed 80 m in diameter; commercial machines with rotor diameters and tower heights in excess of 125 m are operating, and even larger machines are under development. Wind power plants are commonly sited on land (termed ‘onshore’ in this chapter): by the end of 2009, wind power plants sited in sea- or freshwater were a rela-tively small proportion of global wind power installations. Nonetheless, as wind energy deployment expands and as the technology advances, offshore wind energy is expected to become a more signifi cant source of overall wind energy supply.
Due to their potential importance to climate change mitigation, this chapter focuses on grid-connected on- and offshore wind turbines for electricity production. Notwithstanding this focus, wind energy has served and will continue to meet other energy service needs. In remote areas of the world that lack centrally provided electricity supplies, smaller wind turbines can be deployed alone or alongside other technologies to meet individual household or community electricity demands; small turbines of this nature also serve marine energy needs. Small island or remote electricity grids can also employ wind energy, along with other energy sources. Even in urban settings that already have ready access to electricity, smaller wind turbines can, with careful siting, be used to meet a portion of building energy needs. New concepts for higher-altitude wind energy machines are also under consideration. Moreover, in addition to electricity supply, wind energy can meet mechanical and propulsion needs in specifi c applications. Though not the focus of this chapter, some of these additional applications and technologies are briefl y summarized in Box 7.1.
Drawing on available literature, this chapter begins by describing the global technical potential for wind energy, the regional distribution of that resource, and the possible impacts of climate change on the resource (Section 7.2). The chapter then reviews the status of and trends in modern onshore and offshore wind energy technology (Section 7.3). The chapter discusses the status of the wind energy market and industry developments, both globally and regionally, and the impact of poli-cies on those developments (Section 7.4). Near-term issues associated with the integration of wind energy into electricity supply systems are addressed (Section 7.5), as is available evidence on the environmental and social impacts of wind energy (Section 7.6). The prospects for fur-ther technology improvement and innovation are summarized (Section 7.7), and historical, current and potential future cost trends are reviewed (Section 7.8). Based on the underpinnings offered in previous sections, the chapter concludes with an examination of the potential future deployment of wind energy, focusing on the GHG reduction and energy scenarios literature (Section 7.9).

543
Chapter 7 Wind Energy
Box 7.1 | Alternative wind energy applications and technologies
Beyond the use of large, modern wind turbines for electricity supply, a number of additional wind energy applications and technologies are currently employed or are under consideration, a subset of which are described here. Though these technologies and applications are at different phases of market development, and each holds a certain level of promise for scaled deployment, none are likely to compete with traditional large on- and offshore wind energy technology from the perspective of GHG emissions reductions, at least in the near to medium term.
Small wind turbines for electricity supply. Smaller-scale wind turbines are used in a wide range of applications. Though wind tur-bines from hundreds of watts to tens of kilowatts in size do not benefi t from the economies of scale that have helped reduce the cost of larger wind turbines, they can be economically competitive with other supply alternatives in areas that do not have access to centrally provided electricity supply, providing electricity services to meet a wide variety of household or community energy needs (Byrne et al., 2007). For rural electrifi cation or isolated areas, small wind turbines can be used on a stand-alone basis for battery charging or can be combined with other supply options (e.g., solar and/or diesel) in hybrid systems. As an example, China had 57 MW of cumulative small wind turbine (<100 kW) capacity installed by the end of 2008 (Li and Ma, 2009); 33 MW were reportedly installed in China in 2009. Small wind turbines are also employed in grid-connected applications for both residential and commercial electricity customers. The use of wind energy in these disparate applications can provide economic and social development benefi ts. In urban settings, however, where the wind resource is highly site-specifi c and can be poor, the GHG emissions savings associated with the displacement of grid electricity can be low or even zero once the manufacture and installation of the turbines are taken into account (Allen et al., 2008; Carbon Trust, 2008a). AWEA (2009) estimates annual global installations of <100 kW wind turbines from leading manufacturers at under 40 MW in 2008.
Wind energy to meet mechanical and propulsion needs. Among the fi rst technologies to harness the energy from the wind were those that used the kinetic energy of the wind as a means of marine propulsion, grinding of grain and water pumping. Though these tech-nologies were fi rst developed long ago, opportunities remain for the expanded use of wind energy to meet a wide range of mechanical and propulsion needs. Using wind energy to pump water to serve domestic, agricultural and ranching needs remains important, for exam-ple, especially in certain remote areas (e.g., Purohit, 2007); the mechanical or electrical use of wind energy can also be applied for, among other things, water desalination and purifi cation (e.g., Miranda and Infi eld, 2002). New concepts to harness the energy of the wind for propulsion are also under development, such as using large kites to complement diesel engines for marine transport. Demonstration projects and analytic studies have found that these systems may yield fuel savings of up to 50%, though this depends heavily on the tech-nology and wind conditions (O’Rourke, 2006; Naaijen and Koster, 2007).
Higher-altitude wind electricity. Higher-altitude wind energy systems have recently received some attention as an alternative approach to generating electricity from the wind (Roberts et al., 2007; Archer and Caldeira, 2009; Argatov et al., 2009; Argatov and Silvennoinen, 2010; Kim and Park, 2010). A principal motivation for the development of this technology is the sizable wind resource present at higher altitudes. Two main approaches to higher-altitude wind energy have been proposed: (1) tethered wind turbines that transmit electricity to earth via cables, and (2) base stations that convert the kinetic energy from the wind collected via kites to electricity at ground level. A variety of concepts are under consideration, operating at altitudes of less than 500 m to more than 10,000 m. Though some research has been conducted on these technologies and on the size of the potential resource, the technology remains in its infancy, and scientifi c, economic and institutional challenges must be overcome before pilot projects are widely deployed and a realistic estimate of the GHG emissions reduction potential of higher-altitude wind energy can be developed.
7.2 Resource potential1
The theoretical potential for wind, as estimated by the global annual fl ux, has been estimated at 6,000 EJ/yr (Rogner et al., 2000). The global tech-nical potential for wind energy, meanwhile, is not fi xed, but is instead
1 See Annex I for defi nitions of the terms used to refer to various types of “resource potential.”
related to the status of the technology and assumptions made regarding other constraints to wind energy development. Nonetheless, a growing number of global wind resource assessments have demonstrated that the world’s technical potential for wind energy exceeds current global electricity production, and that ample technical potential exists in most regions of the world to enable signifi cant wind energy deployment rela-tive to current levels. The wind resource is not evenly distributed across

544
Wind Energy Chapter 7
0.4% of the estimated technical potential) was being used for wind energy supply in 2008 (IEA, 2010a).
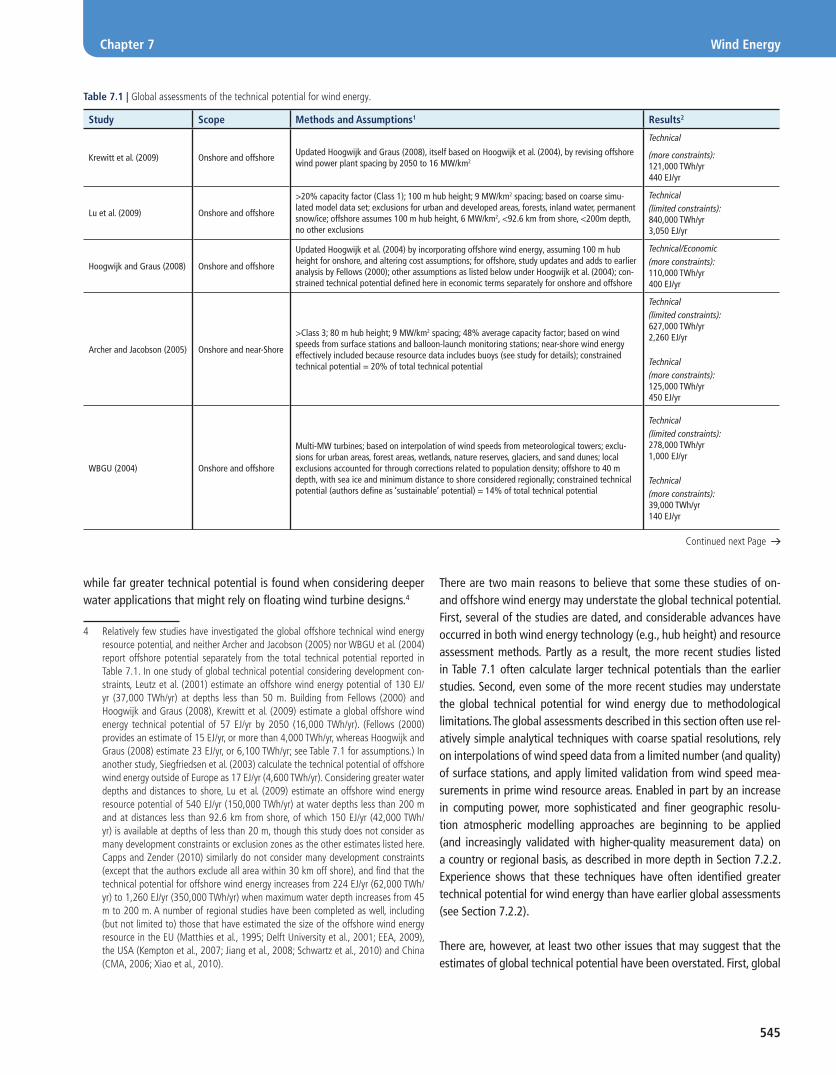
More generally, a number of analyses have been undertaken to estimate the global technical potential for wind energy. The methods and results of these global assessments—some of which include offshore wind energy and some of which are restricted to onshore wind energy—are summarized in Table 7.1.
No standardized approach has been developed to estimate the global technical potential of wind energy: the diversity in data, methods, assumptions and even defi nitions for technical potential complicate comparisons. Consequently, the studies show a wide range of results. Specifi cally, estimates of global technical potential range from a low of 70 EJ/yr (19,400 TWh/yr) (onshore only) to a high of 450 EJ/yr (125,000 TWh/yr) (onshore and near-shore) among those studies that consider relatively more development constraints (identifi ed as ‘more con-straints’ in the table). This range equals from roughly one to six times global electricity production in 2008. If those studies that apply more limited development constraints are also included, the absolute range of technical potential is greater still, from 70 EJ/yr to 3,050 EJ/yr (19,400 to 840,000 TWh/yr). Results vary based in part on whether offshore wind energy is included (and under what assumptions), the wind speed data that are used, the areas assumed available for wind energy develop-ment, the rated output of wind turbines installed per unit of land area, and the assumed performance of wind power plants. The latter is, in part, related to hub height and turbine technology. These factors depend on technical assumptions as well as subjective judgements of develop-ment constraints, thus there is no single ‘correct’ estimate of technical potential.
Though research has generally found the technical potential for offshore wind energy to be smaller than for onshore wind energy, the technical potential is nonetheless sizable. Three of the studies included in Table 7.1 exclude the technical potential of offshore wind energy; even those studies that include offshore wind energy often do so only considering the wind energy technology likely to be deployed in the near to medium term in relatively shallower water and nearer to shore. In practice, the size of the offshore wind energy resource is, at least theoretically, enor-mous, and constraints are primarily economic rather than technical. In particular, water depth, accessibility and grid connection may limit development to relatively near-shore locations in the medium term, though technology improvements are expected, over time, to enable deeper water and more remote installations. Even when only consid-ering relatively shallower and near-shore applications, however, study results span a range from 15 to 130 EJ/yr (4,000 to 37,000 TWh/yr),
the globe, however, and a variety of other regional factors are likely to restrict growth well before any absolute global technical resource limits are encountered. As a result, wind energy will not contribute equally in meeting the needs of every country.
This section summarizes available evidence on the size of the global technical potential of the wind energy resource (Section 7.2.1), the regional distribution of that resource (Section 7.2.2) and the possible impacts of climate change on wind energy resources (Section 7.2.3). It focuses on long-term average annual technical potential; for a discus-sion of interannual, seasonal and diurnal fl uctuations and patterns in the wind resource, as well as shorter-term wind power output variability, see Section 7.5.
7.2.1 Global technical potential
A number of studies have evaluated the global technical potential for wind energy. In general, two methods can be used: fi rst, available wind speed measurements can be interpolated to construct a surface wind distribution; and second, physics-based numerical weather prediction models can be applied. Studies of the global wind energy resource have used varying combinations of these two approaches.2 Additionally, it is important to recognize that estimates of the technical potential for wind energy should not be viewed as fi xed—the potential will change as wind energy technology develops (e.g., taller towers provide access to better wind, or foundation innovation allows offshore plants to be developed in greater water depths) and as more is learned about techni-cal, environmental and social concerns that may infl uence development (e.g., land competition, distance from resource areas to electricity demand centres, etc.).
Synthesizing the available literature, the IPCC’s Fourth Assessment Report identifi ed 600 EJ/yr of onshore wind energy technical potential (IPCC, 2007). Using the direct equivalent method of deriving primary energy equivalence (where electricity supply, in TWh, is translated directly to primary energy, in EJ; see Annex II), the IPCC (2007) estimate of onshore wind energy technical potential is 180 EJ/yr (50,000 TWh/yr), more than two times greater than gross global electricity production in 2008 (73 EJ, or 20,200 TWh).3 Of this 180 EJ/y, only 0.8 EJ (220 TWh,
2 Wind power plant developers may rely upon global and regional wind resource estimates to obtain a general sense for the locations of potentially promising development prospects. However, on-site collection of actual wind speed data at or near turbine hub heights remains essential for most wind power plants of signifi cant scale.
3 The IPCC (2007) cites Johansson et al. (2004), which obtains its data from UNDP/UNEP/WEC (2000), which in turn references WEC (1994) and Grubb and Meyer (1993). To convert from TWh to EJ, the documents cited by IPCC (2007) use the standard conversion, and then divide by 0.3 (i.e.., a method of energy accounting in which RE supply is assumed to substitute for the primary energy of fossil fuel in-puts into fossil power plants, accounting for plant conversion effi ciencies). The direct equivalent method does not take this last step, and instead counts the electricity itself as primary energy (see Annex II), so this chapter reports the IPCC (2007) fi gure at 180 EJ/y, or roughly 50,000 TWh/y.
545
Chapter 7 Wind Energy
Table 7.1 | Global assessments of the technical potential for wind energy.
Study Scope Methods and Assumptions1 Results2
Krewitt et al. (2009) Onshore and offshoreUpdated Hoogwijk and Graus (2008), itself based on Hoogwijk et al. (2004), by revising offshore wind power plant spacing by 2050 to 16 MW/km2
Technical
(more constraints): 121,000 TWh/yr440 EJ/yr
Lu et al. (2009) Onshore and offshore
>20% capacity factor (Class 1); 100 m hub height; 9 MW/km2 spacing; based on coarse simu-lated model data set; exclusions for urban and developed areas, forests, inland water, permanent snow/ice; offshore assumes 100 m hub height, 6 MW/km2, <92.6 km from shore, <200m depth, no other exclusions
Technical (limited constraints):840,000 TWh/yr3,050 EJ/yr
Hoogwijk and Graus (2008) Onshore and offshore
Updated Hoogwijk et al. (2004) by incorporating offshore wind energy, assuming 100 m hub height for onshore, and altering cost assumptions; for offshore, study updates and adds to earlier analysis by Fellows (2000); other assumptions as listed below under Hoogwijk et al. (2004); con-strained technical potential defi ned here in economic terms separately for onshore and offshore
Technical/Economic (more constraints):110,000 TWh/yr400 EJ/yr
Archer and Jacobson (2005) Onshore and near-Shore
>Class 3; 80 m hub height; 9 MW/km2 spacing; 48% average capacity factor; based on wind speeds from surface stations and balloon-launch monitoring stations; near-shore wind energy effectively included because resource data includes buoys (see study for details); constrained technical potential = 20% of total technical potential
Technical (limited constraints):627,000 TWh/yr2,260 EJ/yr
Technical(more constraints):125,000 TWh/yr450 EJ/yr
WBGU (2004) Onshore and offshore
Multi-MW turbines; based on interpolation of wind speeds from meteorological towers; exclu-sions for urban areas, forest areas, wetlands, nature reserves, glaciers, and sand dunes; local exclusions accounted for through corrections related to population density; offshore to 40 m depth, with sea ice and minimum distance to shore considered regionally; constrained technical potential (authors defi ne as ‘sustainable’ potential) = 14% of total technical potential
Technical (limited constraints):278,000 TWh/yr1,000 EJ/yr
Technical(more constraints):39,000 TWh/yr140 EJ/yr
while far greater technical potential is found when considering deeper water applications that might rely on fl oating wind turbine designs.4
4 Relatively few studies have investigated the global offshore technical wind energy resource potential, and neither Archer and Jacobson (2005) nor WBGU et al. (2004) report offshore potential separately from the total technical potential reported in Table 7.1. In one study of global technical potential considering development con-straints, Leutz et al. (2001) estimate an offshore wind energy potential of 130 EJ/yr (37,000 TWh/yr) at depths less than 50 m. Building from Fellows (2000) and Hoogwijk and Graus (2008), Krewitt et al. (2009) estimate a global offshore wind energy technical potential of 57 EJ/yr by 2050 (16,000 TWh/yr). (Fellows (2000) provides an estimate of 15 EJ/yr, or more than 4,000 TWh/yr, whereas Hoogwijk and Graus (2008) estimate 23 EJ/yr, or 6,100 TWh/yr; see Table 7.1 for assumptions.) In another study, Siegfriedsen et al. (2003) calculate the technical potential of offshore wind energy outside of Europe as 17 EJ/yr (4,600 TWh/yr). Considering greater water depths and distances to shore, Lu et al. (2009) estimate an offshore wind energy resource potential of 540 EJ/yr (150,000 TWh/yr) at water depths less than 200 m and at distances less than 92.6 km from shore, of which 150 EJ/yr (42,000 TWh/yr) is available at depths of less than 20 m, though this study does not consider as many development constraints or exclusion zones as the other estimates listed here. Capps and Zender (2010) similarly do not consider many development constraints (except that the authors exclude all area within 30 km off shore), and fi nd that the technical potential for offshore wind energy increases from 224 EJ/yr (62,000 TWh/yr) to 1,260 EJ/yr (350,000 TWh/yr) when maximum water depth increases from 45 m to 200 m. A number of regional studies have been completed as well, including (but not limited to) those that have estimated the size of the offshore wind energy resource in the EU (Matthies et al., 1995; Delft University et al., 2001; EEA, 2009), the USA (Kempton et al., 2007; Jiang et al., 2008; Schwartz et al., 2010) and China (CMA, 2006; Xiao et al., 2010).
There are two main reasons to believe that some these studies of on- and offshore wind energy may understate the global technical potential. First, several of the studies are dated, and considerable advances have occurred in both wind energy technology (e.g., hub height) and resource assessment methods. Partly as a result, the more recent studies listed in Table 7.1 often calculate larger technical potentials than the earlier studies. Second, even some of the more recent studies may understate the global technical potential for wind energy due to methodological limitations. The global assessments described in this section often use rel-atively simple analytical techniques with coarse spatial resolutions, rely on interpolations of wind speed data from a limited number (and quality) of surface stations, and apply limited validation from wind speed mea-surements in prime wind resource areas. Enabled in part by an increase in computing power, more sophisticated and fi ner geographic resolu-tion atmospheric modelling approaches are beginning to be applied (and increasingly validated with higher-quality measurement data) on a country or regional basis, as described in more depth in Section 7.2.2. Experience shows that these techniques have often identifi ed greater technical potential for wind energy than have earlier global assessments (see Section 7.2.2).
There are, however, at least two other issues that may suggest that the estimates of global technical potential have been overstated. First, global
Continued next Page

546
Wind Energy Chapter 7
assessments may overstate the accessibility of the wind resource in remote areas that are far from population centres. Second, the assessments gen-erally use point-source estimates of the wind resource, and assess the global technical potential for wind energy by summing local wind techni-cal potentials. Large-scale atmospheric dynamics, thermodynamic limits, and array effects, however, may bound the aggregate amount of energy that can be extracted by wind power plants on a regional or global basis. Relatively little is known about the nature of these constraints, though early research suggests that the size of the effects are unlikely to be large enough to signifi cantly constrain the use of wind energy in the electricity sector at a global scale (see Section 7.6.2.3).
Despite the limitations of the available literature, based on the above review, it can be concluded that the IPCC (2007) estimate of 180 EJ/yr (50,000 TWh/yr) likely understates the technical potential for wind energy. Moreover, regardless of the exact size of the technical potential, it is evident that the global wind resource is unlikely to be a limiting factor on global on- or offshore wind energy deployment. Instead, economic constraints associated with the cost of wind energy,
institutional constraints and costs associated with transmission access and operational integration, and issues associated with social accep-tance and environmental impacts are likely to restrict growth well before any absolute limit to the global technical potential for wind energy is encountered.
7.2.2 Regional technical potential
7.2.2.1 Global assessment results by region
The global assessments presented in Section 7.2.1 reach varying conclu-sions about the relative technical potential for onshore wind energy among different regions, with Table 7.2 summarizing results from a subset of these assessments. Differences in the regional results from these studies are due to differences in wind speed data and key input parameters, including the minimum wind speed assumed to be exploitable, land use constraints, density of wind energy development, and assumed wind power plant performance (Hoogwijk et al., 2004); differing regional categories also
Study Scope Methods and Assumptions1 Results2
Hoogwijk et al. (2004) Onshore
>4 m/s at 10 m (some less than Class 2); 69 m hub height; 4 MW/km2 spacing; assumptions for availability / array effi ciency; based on interpolation of wind speeds from meteorological towers; exclusions for elevations >2000 m, urban areas, nature reserves, certain forests; reductions in use for many other land-uses; economic potential defi ned here as less than US cents2005 10/kWh
Technical(more constraints):96,000 TWh/yr350 EJ/yr
Economic:(more constraints):53,000 TWh/yr190 EJ/yr
Fellows (2000) Onshore and offshore
50 m hub height; 6 MW/km2 spacing; based on upper-air model data set; exclusions for urban areas, forest areas, nature areas, water bodies and steep slopes; additional maximum density criterion; offshore assumes 60 m hub height, 8 MW/km2 spacing, to 4 0m depth, 5 to 40 km from shore, with 75% exclusion; constrained technical potential defi ned here in economic terms: less than US cents2005 23/kWh in 2020; focus on four regions, with extrapolations to others; some countries omitted altogether
Technical/Economic (more con-straints):46,000 TWh/yr170 EJ/yr
WEC (1994) Onshore>Class 3; 8 MW/km2 spacing; 23% average capacity factor; based on an early global wind resource map; constrained technical potential = 4% of total technical potential
Technical (limited constraints):484,000 TWh/yr1,740 EJ/yr
Technical(more constraints):19,400 TWh/yr70 EJ/yr
Grubb and Meyer (1993) Onshore
>Class 3; 50 m hub height; assumptions for conversion effi ciency and turbine spacing; based on an early global wind resource map; exclusions for cities, forests and unreachable mountain areas, as well as for social, environmental and land use constraints, differentiated by region (results in constrained technical potential = ~10% of total technical potential, globally)
Technical (limited constraints):498,000 TWh/yr 1,800 EJ/yr
Technical(more constraints):53,000 TWh/yr190 EJ/yr
Notes: 1. Where used, wind resource classes refer to the following wind power densities at a 50 m hub height: Class 1 (<200 W/m2), Class 2 (200-300 W/m2), Class 3 (300-400 W/m2), Class 4 (400-500 W/m2), Class 5 (500-600 W/m2), Class 6 (600-800 W/m2) and Class 7 (>800 W/m2). 2. Reporting of resource potential and conversion between EJ and TWh are based on the direct equivalent method (see Annex II). Defi nitions for theoretical, technical, economic, sustainable and market potential are provided in Annex I, though individual authors cited in Table 7.1 often use different defi nitions of these terms. In particular, several of the studies included in the table report technical potential only below a maximum cost threshold. These are identifi ed as ‘economic potential’ in the table though it is acknowledged that this defi nition differs from that provided in Annex I.

547
Chapter 7 Wind Energy
complicate comparisons. Nonetheless, the technical potentials in OECD North America and Eastern Europe/Eurasia are found to be particularly siz-able, whereas some areas of non-OECD Asia and OECD Europe appear to have more limited onshore technical potential. Visual inspection of Figure 7.1, a global wind resource map with a 5- by 5-km resolution, also dem-onstrates limited technical potential in certain areas of Latin America and Africa, though other portions of those continents have signifi cant techni-cal potential. Caution is required in interpreting these results, however, as other studies fi nd signifi cantly different regional allocations of global technical potential (e.g., Fellows, 2000), and more detailed country and regional assessments have reached differing conclusions about, for exam-ple, the wind energy resource in East Asia and other regions (Hoogwijk and Graus, 2008).
Hoogwijk et al. (2004) also compare onshore technical potential against regional electricity consumption in 1996. In most of the 17 regions evaluated, technical onshore wind energy potential exceeded electricity consumption in 1996. The multiple was over fi ve in 10 regions: East Africa, Oceania, Canada, North Africa, South America, Former Soviet Union (FSU),
Central America, West Africa, the USA and the Middle East. Areas in which onshore wind energy technical potential was estimated to be less than a two-fold multiple of 1996 electricity consumption were South Asia (1.9), Western Europe (1.6), East Asia (1.1), South Africa (1), Eastern Europe (1), South East Asia (0.1) and Japan (0.1), though again, caution is warranted in interpreting these results. More recent resource assessments and data on regional electricity consumption would alter these fi gures.
The estimates reported in Table 7.2 exclude offshore wind energy techni-cal potential. Ignoring deeper water applications, Krewitt et al. (2009) estimate that of the 57 EJ/yr (16,000 TWh/yr) of technical offshore resource potential by 2050, the largest opportunities exist in OECD Europe (22% of global potential), the rest of Asia (21%), Latin America (18%) and the transition economies (16%), with lower but still signifi -cant technical potential in North America (12%), OECD Pacifi c (6%) and Africa and the Middle East (4%).
Overall, these studies fi nd that ample technical potential exists in most regions of the world to enable signifi cant wind energy deployment rela-tive to current levels. The wind resource is not evenly distributed across the globe, however, and a variety of other regional factors (e.g., distance of resource from population centres, grid integration, social acceptance) are likely to restrict growth well before any absolute limit to the techni-cal potential of wind energy is encountered. As a result, wind energy will not contribute equally in meeting the energy needs and GHG reduction demands of every region or country.
7.2.2.2 Regional assessment results
The global wind resource assessments described above have histori-cally relied primarily on relatively coarse and imprecise estimates of the wind resource, sometimes relying heavily on measurement stations with relatively poor exposure to the wind (Elliott, 2002; Elliott et al., 2004).5
5 For more on the relative advantages and disadvantages of weather station measurement data and numerical weather prediction models, see Al-Yahyai et al. (2010).
Table 7.2 | Regional allocation of global technical potential for onshore wind energy.1
Grubb and Meyer (1993) WEC (1994) Krewitt et al. (2009)2 Lu et al. (2009)
Region % Region % Region % Region %
Western Europe 9 Western Europe 7 OECD Europe 5 OECD Europe 4
North America 26 North America 26 OECD North America 42 North America 22
Latin America 10 Latin America and Caribbean 11 Latin America 10 Latin America 9
Eastern Europe and Former Soviet Union
20 Eastern Europe and CIS 22 Transition Economies 17Non-OECD Europe and Former Soviet Union
26
Africa 20 Sub-Saharan Africa 7 Africa and Middle East 9 Africa and Middle East 17
Australia 6 Middle East and North Africa 8 OECD Pacifi c 14 Oceania 13
Rest of Asia 9 Pacifi c 14 Rest of Asia 4 Rest of Asia 9
Rest of Asia 4
Notes: 1. Regions shown in the table are defi ned by each individual study. Some regions have been combined to improve comparability among the four studies. 2. Hoogwijk and Graus (2008) and Hoogwijk et al. (2004) show similar results.
5km Global Wind Map
5 km Wind Map at 80m
Wind Speed (m/s)
3 6 9
Figure 7.1 | Example global wind resource map with 5 km x 5 km resolution (3TIER, 2009).

548
Wind Energy Chapter 7
The regional results from these global assessments, as presented in Section 7.2.2.1, should therefore be viewed with some caution, espe-cially in areas where wind measurement data are of limited quantity and quality. In contrast, specifi c country and regional assessments have ben-efi ted from: wind speed data collected with wind resource estimation in mind; sophisticated numerical wind resource prediction techniques; improved model validation; and a dramatic growth in computing power. These advances have allowed the most recent country and regional resource assessments to capture smaller-scale terrain features and tem-poral variations in predicted wind speeds, and at a variety of possible turbine heights.
These techniques were initially applied in the EU6 and the USA7, but there are now publicly available high-resolution wind resource assess-ments covering a large number of regions and countries. The United Nations Environment Program’s Solar and Wind Energy Resource Assessment, for example, provides wind resource information for a large number of its partner countries around the world;8 the European Bank for Reconstruction and Development has developed RE assess-ments in its countries of operation (Black and Veatch, 2003); the World Bank’s Asia Sustainable and Alternative Energy Program has prepared wind resource atlases for the Pacifi c Islands and Southeast Asia;9and wind resource assessments for portions of the Mediterranean region are available through Observatoire Méditerranéen de l’Energie.10 A number of other publicly available country-level assessments have been pro-duced by the US National Renewable Energy Laboratory,11 Denmark’s Risø DTU12 and others. These assessments have sometimes proven espe-cially helpful in catalyzing initial interest in wind energy. To illustrate the advances that have occurred outside of the EU and the USA, Box 7.2 presents details on the status of wind resource assessment in China (a country with signifi cant wind energy deployment) and Russia (a country with signifi cant wind energy technical potential).
These more detailed assessments have generally found the size of the wind resource to be greater than estimated in previous global or regional assessments. This is due primarily to improved data, spatial resolution and analytic techniques, but is also the result of wind turbine technology developments, for example, higher hub heights and improved machine
6 For the latest publicly available European wind resource map, see www.windatlas.dk/Europe/Index.htm. Publicly available assessments for individual EU countries are summarized in EWEA (2009); see also EEA (2009).
7 A large number of publicly available US wind resource maps have been produced at the national and state levels, many of which have subsequently been validated by the National Renewable Energy Laboratory (see www.windpoweringamerica.gov/wind_maps.asp).
8 See http://swera.unep.net/.
9 See go.worldbank.org/OTU2DVLIV0.
10 See www.omenergie.com/.
11 See www.nrel.gov/wind/international_wind_resources.html.
12 See www.windatlas.dk/World/About.html.
effi ciencies (see, e.g., Elliott, 2002; Elliot et al., 2004). Nevertheless, even greater spatial and temporal resolution and enhanced validation of model results with observational data are needed, as is an expanded geographic coverage of these assessments (see, e.g., Schreck et al., 2008; IEA, 2009). These developments will allow further refi nement of estimates of the technical potential, and are likely to highlight regions with high-quality technical potential that have not previously been identifi ed.
7.2.3 Possible impact of climate change on resource potential
Global climate change may alter the geographic distribution and/or the inter- and intra-annual variability of the wind resource, and/or the quality of the wind resource, and/or the prevalence of extreme weather events that may impact wind turbine design and operation. Research in this fi eld is nascent, however, and global and regional climate models do not fully reproduce contemporary wind climates (Goyette et al., 2003) or historical trends (Pryor et al., 2009). Additional uncertainty in wind resource projections under global climate change scenarios derives, in part, from substantial variations in simulated circulation and fl ow regimes when using different climate models (Pryor et al., 2005, 2006; Bengtsson et al., 2009; Pryor and Schoof, 2010). Nevertheless, research to date suggests that it is unlikely that multi-year annual mean wind speeds will change by more than a maximum of ±25% over most of Europe and North America during the present century, while research covering northern Europe suggests that multi-year annual mean wind power densities will likely remain within ±50% of current values (Palutikof et al., 1987, 1992; Breslow and Sailor, 2002; Pryor et al., 2005, 2006; Walter et al., 2006; Bloom et al., 2008; Sailor et al., 2008; Pryor and Schoof, 2010). Fewer studies have been conducted for other regions of the world, though Brazil’s wind resource was shown in one study to be relatively insensitive to (and perhaps to even increase as a result of) global climate change (de Lucena et al., 2009), and simulations for the west coast of South America showed increases in mean wind speeds of up to 15% (Garreaud and Falvey, 2009).
In addition to the possible impact of climate change on long-term aver-age wind speeds, impacts on intra-annual, interannual and inter-decadal variability in wind speeds are also of interest. Wind climates in northern Europe, for example, exhibit seasonality, with the highest wind speeds during the winter (Rockel and Woth, 2007), and some analyses of the northeast Atlantic (1874 to 2007) have found notable differences in temporal trends in winter and summer (X. Wang et al., 2009). Internal climate modes have been found to be responsible for relatively high intra-annual, interannual and inter-decadal variability in wind climates in the mid-latitudes (e.g., Petersen et al., 1998; Pryor et al., 2009). The ability of climate models to accurately reproduce these conditions in current and possible future climates is the subject of intense research (Stoner et al., 2009). Equally, the degree to which historical variability and change in near-surface wind climates is attributable to global cli-mate change or to other factors (Pryor et al., 2009; Pryor and Ledolter,

549
Chapter 7 Wind Energy
Box 7.2 | Advances in wind resource assessment in China and Russia
To illustrate the growing use of sophisticated wind resource assessment tools outside of the EU and the USA, historical and ongoing efforts in China and Russia to better characterize their wind resources are described here. In both cases, the wind energy resource has been found to be sizable compared to present electricity consumption, and recent analyses offer enhanced understanding of the size and location of those resources.
China’s Meteorological Administration (CMA) completed its fi rst wind resource assessment in the 1970s. In the 1980s, a second wind resource investigation was performed based on data from roughly 900 meteorological stations, and a spatial distribution of the resource was delineated. The CMA estimated the availability of 253 GW (510 TWh/yr at a 23% average capacity factor; 1.8 EJ/yr) of onshore technical potential (Xue et al., 2001). A third assessment was based on data from 2,384 meteorological stations, supplemented with data from other sources. Though still mainly based on measured wind speeds at 10 m, most data covered a period of over 50 years, and this assessment led to an estimate of 297 GW (600 TWh/yr at a 23% average capacity factor; 2.2 EJ/yr) of onshore technical potential (CMA, 2006). More recently, improved mesoscale atmospheric models and access to higher-elevation meteorological station data have facili-tated higher-resolution assessments. Figure 7.2 (left panel) shows the results of these investigations, focused on onshore wind resources. Based on this research, the CMA has estimated 2,380 GW of onshore (4,800 TWh/yr at a 23% average capacity factor; 17 EJ/yr) and 200 GW of offshore (610 TWh/yr at a 35% average capacity factor; 2.2 EJ/yr) technical potential (Xiao et al., 2010). Other recent research has similarly estimated far greater technical potential than have past assessments (see, e.g., McElroy et al., 2009).
Considerable progress has also been made in understanding the magnitude and distribution of the wind energy resource in Russia (as well as the other Commonwealth of Independent States (CIS) countries and the Baltic countries), based in part on data from approxi-mately 3,600 surface meteorological stations and 150 upper-air stations. An assessment by Nikolaev et al. (2010) uses these data and meteorological and statistical modelling to estimate the distribution of the wind resource in the region (Figure 7.2 (right panel)). Based on this work and after making assumptions about the characteristics and placement of wind turbines, Nikolaev et al. (2008) estimate that the technical potential for wind energy in Russia is more than 14,000 TWh/yr (50 EJ/yr). The more promising regions of Russia for wind energy development are in the western part of the country, the South Ural area, in western Siberia, and on the coasts of the seas of the Arctic and Pacifi c Oceans.
4<V<5 6<V<7 8<V<9V<3
7<V<8 V>95<V<63<V<4
Annual Mean Wind Speed V [m/s]at Altitude 100m Above Surface
Wind PowerDensity [W/m2]
800750700650600550500450400350300250200150100500
Figure 7.2 | Wind resource maps for (left panel) China (Xiao et al., 2010) and (right panel) Russia, CIS, and the Baltic (Nikolaev et al., 2010).
2010), and whether that variability will change as the global climate continues to evolve, is also being investigated.
Finally, the prevalence of extreme winds and the probability of icing have implications for wind turbine design and operation (X. Wang et
al., 2009). Preliminary studies from northern and central Europe show some evidence of increased wind speed extremes (Pryor et al., 2005; Haugen and Iversen, 2008; Leckebusch et al., 2008), though changes in the occurrence of inherently rare events are diffi cult to quantify, and further research is warranted. Sea ice can impact turbine foundation

550
Wind Energy Chapter 7
loading for offshore plants, and changes in sea ice and/or permafrost conditions may also infl uence access for performing wind power plant O&M (Laakso et al., 2003). One study focusing on northern Europe found substantial declines in sea ice under reasonable climate change scenarios (Claussen et al., 2007). Other meteorological drivers of turbine loading may also be infl uenced by climate change but are likely to be secondary in comparison to changes in resource magnitude, weather extremes, and icing issues (Pryor and Barthelmie, 2010).
Additional research on the possible impact of climate change on the size, geographic distribution and variability of the wind resource is warranted, as is research on the possible impact of climate change on extreme weather events and therefore wind turbine operating environ-ments. Overall, however, research to date suggests that these impacts are unlikely to be of a magnitude that will greatly impact the global potential of wind energy deployment.
7.3 Technology and applications
Modern, commercial grid-connected wind turbines have evolved from small, simple machines to large, highly sophisticated devices. Scientifi c and engineering expertise and advances, as well as improved compu-tational tools, design standards, manufacturing methods, and O&M procedures, have all supported these technology developments. As a result, typical wind turbine nameplate capacity ratings have increased dramatically since the 1980s (from roughly 75 kW to 1.5 MW and larger), while the cost of wind energy has substantially declined. Onshore wind energy technology is already being manufactured and deployed on a commercial basis. Nonetheless, additional R&D advances are antici-pated, and are expected to further reduce the cost of wind energy while enhancing system and component performance and reliability. Offshore wind energy technology is still developing, with greater opportunities for additional advancement.
This section summarizes the historical development and current technol-ogy status of large grid-connected on- and offshore wind turbines (7.3.1), discusses international wind energy technology standards (7.3.2), and reviews power conversion and related grid connection issues (7.3.3); a later section (7.7) describes opportunities for further technical advances.
7.3.1 Technology development and status
7.3.1.1 Basic design principles
Generating electricity from the wind requires that the kinetic energy of moving air be converted to mechanical and then electrical energy, thus the engineering challenge for the wind energy industry is to design cost-effective wind turbines and power plants to perform this conversion. The amount of kinetic energy in the wind that is theoretically available for extraction increases with the cube of wind speed. However, a turbine only captures a portion of that available energy (see Figure 7.3).
Specifi cally, modern large wind turbines typically employ rotors that start extracting energy from the wind at speeds of roughly 3 to 4 m/s (cut-in speed). The Lanchester-Betz limit provides a theoretical upper limit (59.3%) on the amount of energy that can be extracted (Burton et al., 2001). A wind turbine increases power production with wind speed until it reaches its rated power level, often corresponding to a wind speed of 11 to 15 m/s. At still-higher wind speeds, control sys-tems limit power output to prevent overloading the wind turbine, either through stall control, pitching the blades, or a combination of both (Burton et al., 2001). Most turbines then stop producing energy at wind speeds of approximately 20 to 25 m/s (cut-out speed) to limit loads on the rotor and prevent damage to the turbine’s structural components.
Wind turbine design has centred on maximizing energy capture over the range of wind speeds experienced by wind turbines, while seeking to minimize the cost of wind energy. As described generally in Burton et al. (2001), increased generator capacity leads to greater energy capture when the turbine is operating at rated power (Region III). Larger rotor diameters for a given generator capacity, meanwhile, as well as aero-dynamic design improvements, yield greater energy capture at lower wind speeds (Region II), reducing the wind speed at which rated power is achieved. Variable speed operation allows energy extraction at peak effi ciency over a wider range of wind speeds (Region II). Finally, because the average wind speed at a given location varies with the height above ground level, taller towers typically lead to increased energy capture.
To minimize cost, wind turbine design is also motivated by a desire to reduce materials usage while continuing to increase turbine size, increase component and system reliability, and improve wind power plant operations. A system-level design and analysis approach is neces-sary to optimize wind turbine technology, power plant installation and O&M procedures for individual turbines and entire wind power plants. Moreover, optimizing turbine and power plant design for specifi c site
Pow
er
Power inWind
Region I Region II Region III
Rated Power
Power Captured
Rotor RPM
Wind Speed
Cut-Out SpeedRated SpeedCut-In Speed
Figure 7.3 | Conceptual power curve for a modern variable-speed wind turbine (US DOE, 2008).

551
Chapter 7 Wind Energy
conditions has become common as wind turbines, wind power plants and the wind energy market have all increased in size; site-specifi c con-ditions that can impact turbine and plant design include geographic and temporal variations in wind speed, site topography and access, interactions among individual wind turbines due to wake effects, and integration into the larger electricity system (Burton et al., 2001). Wind turbine and power plant design also impacts and is impacted by noise, visual, environmental and public acceptance issues (see Section 7.6).
7.3.1.2 Onshore wind energy technology
In the 1970s and 1980s, a variety of onshore wind turbine confi gurations were investigated, including both horizontal and vertical axis designs (see Figure 7.4). Gradually, the horizontal axis design came to dominate, although confi gurations varied, in particular the number of blades and whether those blades were oriented upwind or downwind of the tower (EWEA, 2009). After a period of further consolidation, turbine designs largely centred (with some notable exceptions) around the three-blade, upwind rotor; locating the turbine blades upwind of the tower prevents the tower from blocking wind fl ow onto the blades and producing extra aerodynamic noise and loading, while three-bladed machines typically have lower noise emissions than two-bladed machines. The three blades are attached to a hub and main shaft, from which power is transferred (sometimes through a gearbox, depending on design) to a generator. The main shaft and main bearings, gearbox, generator and control system are contained within a housing called the nacelle. Figure 7.5 shows the components in a modern wind turbine with a gearbox; in wind turbines without a gearbox, the rotor is mounted directly on the generator shaft.
In the 1980s, larger machines were rated at around 100 kW and primarily relied on aerodynamic blade stall to control power production from the fi xed blades. These turbines generally operated at one or two rotational speeds. As turbine size increased over time, development went from stall control to full-span pitch control in which turbine output is controlled by pitching (i.e., rotating) the blades along their long axis (EWEA, 2009). In addition, a reduction in the cost of power electronics allowed variable speed wind turbine operation. Initially, variable speeds were used to smooth out the torque fl uctuations in the drive train caused by wind turbulence and to allow more effi cient operation in variable and gusty winds. More recently, almost all electric system operators require the continued operation of large wind power plants during electrical faults, together with being able to provide reactive power: these requirements have accelerated the adoption of variable-speed operation with power electronic conversion (see Section 7.3.3 for a summary of power conver-sion technologies, Section 7.5 for a fuller discussion of electric system integration issues, and Chapter 8 for a discussion of reactive power and broader issues with respect to the integration of RE into electricity sys-tems). Modern wind turbines typically operate at variable speeds using full-span blade pitch control. Blades are commonly constructed with composite materials, and towers are usually tubular steel structures that taper from the base to the nacelle at the top (EWEA, 2009).
Over the past 30 years, average wind turbine size has grown signifi -cantly (Figure 7.6), with the largest fraction of onshore wind turbines installed globally in 2009 having a rated capacity of 1.5 to 2.5 MW; the average size of turbines installed in 2009 was 1.6 MW (BTM, 2010). As of 2010, wind turbines used onshore typically stand on 50- to 100-m towers, with rotors that are often 50 to 100 m in diameter; commercial
Horizontal-Axis Turbines Vertical-Axis Turbines
Figure 7.4 | Early wind turbine designs, including horizontal and vertical axis turbines (South et al., 1983).

552
Wind Energy Chapter 7
machines with rotor diameters and tower heights in excess of 125 m are operating, and even larger machines are under development. Modern turbines operate with rotational speeds ranging from 12 to 20 revolu-tions per minute (RPM), which compares to the faster and potentially more visually disruptive speeds exceeding 60 RPM common of the smaller turbines installed during the 1980s.13 Onshore wind turbines are typically grouped together into wind power plants, sometimes also called wind projects or wind farms. These wind power plants are often 5 to 300 MW in size, though smaller and larger plants do exist.
The main reason for the continual increase in turbine size to this point has been to minimize the levelized generation cost of wind energy
13 Rotational speed decreases with larger rotor diameters. The acoustic noise resulting from tip speeds greater than 70 to 80 m/s is the primary design criterion that governs rotor speed.
by: increasing electricity production (taller towers provide access to a higher-quality wind resource, and larger rotors allow a greater exploi-tation of those winds as well as more cost-effective exploitation of lower-quality wind resource sites); reducing investment costs per unit of capacity (installation of a fewer number of larger turbines can, to a point, reduce overall investment costs); and reducing O&M costs (larger turbines can reduce maintenance costs per unit of capacity) (EWEA, 2009). For onshore turbines, however, additional growth in turbine size may ultimately be limited by not only engineering and materials usage constraints (discussed in Section 7.7), but also by the logistical con-straints (or cost of resolving those constraints) of transporting the very large blades, tower, and nacelle components by road, as well as the cost of and diffi culty in obtaining large cranes to lift the components into place. These same constraints are not as binding for offshore turbines, so future turbine scaling to the sizes shown in Figure 7.6 are more likely to be driven by offshore wind turbine design considerations.
WindDirectionFor anUpwindRotor
RotorDiameter
DDireectioononioFFor aan
Swept Areaof Blades
Transformer
Rotor Blade
Nacelle withGearbox andGenerator
HubHeight
Tower
Hub
Tower
Blades
YawMotor
Wind Vane
High-SpeedShaft
YawDrive
Gear Box
Low-SpeedShaft
WindDirection
WindDirection
Nacelle
Pitch
Rotor
Brake
AnemometerController
Generator
Figure 7.5 | Basic components of a modern, horizontal-axis wind turbine with a gearbox (Design by the National Renewable Energy Laboratory (NREL)).

553
Chapter 7 Wind Energy
As a result of these and other developments, onshore wind energy tech-nology is already being commercially manufactured and deployed on a large scale. Moreover, modern wind turbines have nearly reached the theoretical maximum of aerodynamic effi ciency, with the coeffi cient of performance rising from 0.44 in the 1980s to about 0.50 by the mid 2000s.14 The value of 0.50 is near the practical limit dictated by the drag of aerofoils and compares with the Lanchester-Betz theoretical limit of 0.593 (see Section 7.3.1.1). The design requirement for wind turbines is normally 20 years with 4,000 to 7,000 hours of operation (at and below rated power) each year depending on the characteristics of the local wind resource. Given the challenges of reliably meeting this design requirement, O&M teams work to maintain high plant availabil-ity despite component failure rates that have, in some instances, been higher than expected (Echavarria et al., 2008). Though wind turbines are reportedly under-performing in some contexts (Li, 2010), data collected through 2008 show that modern onshore wind turbines in mature mar-kets can achieve an availability of 97% or more (Blanco, 2009; EWEA, 2009; IEA, 2009).
These results demonstrate that the technology has reached suffi cient commercial maturity to allow large-scale manufacturing and deploy-ment. Nonetheless, additional advances to improve reliability, increase electricity production and reduce costs are anticipated, and are discussed in Section 7.7. Additionally, most of the historical technology advances have occurred in developed countries. Increasingly, however, developing countries are investigating the use of wind energy, and opportunities for
14 Wind turbines achieve maximum aerodynamic effi ciency when operating at wind speeds corresponding to power levels below the rated power level (see Region II in Figure 7.3). Aerodynamic effi ciency is limited by the control system when operating at speeds above rated power (see Region III in Figure 7.3).
technology transfer in wind turbine design, component manufacturing and wind power plant siting exist. Extreme environmental conditions, such as icing or typhoons, may be more prominent in some of these mar-kets, providing impetus for continuing research. Other aspects unique to less-developed countries, such as minimal transportation infrastructure, could also infl uence wind turbine designs if and as these markets grow.
7.3.1.3 Offshore wind energy technology
The fi rst offshore wind power plant was built in 1991 in Denmark, consisting of eleven 450 kW wind turbines. Offshore wind energy tech-nology is less mature than onshore, and has higher investment and O&M costs (see Section 7.8). By the end of 2009, just 1.3% of global installed wind power capacity was installed offshore, totalling 2,100 MW (GWEC, 2010a).
The primary motivation to develop offshore wind energy is to provide access to additional wind resources in areas where onshore wind energy devel-opment is constrained by limited technical potential and/or by planning and siting confl icts with other land uses. Other motivations for developing offshore wind energy include: the higher-quality wind resources located at sea (e.g., higher average wind speeds and lower shear near hub height; wind shear refers to the general increase in wind speed with height); the ability to use even larger wind turbines due to avoidance of certain land-based transportation constraints and the potential to thereby gain additional economies of scale; the ability to build larger power plants than onshore, gaining plant-level economies of scale; and a potential reduction in the need for new, long-distance, land-based transmission infrastructure
Hub
Hei
ght
(m)
0
20
40
60
80
100
120
140
160
180
200
220
240
260
320
300
280 Past and Present Wind Turbines
125m5,000kW
150m10,000kW
250m20,000kW
100m3,000kW
80m1,800kW70m
1,500kW
50m750kW
30m300kW
17m75kW
FutureFuture2010-?2010-?2005-2010
2000-2005
1995-2000
1990-1995
1980-1990
Rotor Diameter (m) Rating (kW)
Future WindTurbines
Figure 7.6 | Growth in size of typical commercial wind turbines (Design by NREL).

554
Wind Energy Chapter 7
to access distant onshore wind energy15 (Carbon Trust, 2008b; Snyder and Kaiser, 2009b; Twidell and Gaudiosi, 2009). These factors, combined with a signifi cant offshore wind resource potential, have created con-siderable interest in offshore wind energy technology in the EU and, increasingly, in other regions, despite the typically higher costs relative to onshore wind energy.
Offshore wind turbines are typically larger than onshore, with name-plate capacity ratings of 2 to 5 MW being common for offshore wind power plants built from 2007 to 2009, and even larger turbines are under development. Offshore wind power plants installed from 2007 to 2009 were typically 20 to 120 MW in size, with a clear trend towards larger turbines and power plants over time. Water depths for most off-shore wind turbines installed through 2005 were less than 10 m, but from 2006 to 2009, water depths from 10 to more than 20 m were common. Distance to shore has most often been below 20 km, but aver-age distance has increased over time (EWEA, 2010a). As experience is gained, water depths are expected to increase further and more exposed locations with higher winds will be utilized. These trends will impact the wind resource characteristics faced by offshore wind power plants, as well as support structure design and the cost of offshore wind energy. A continued transition towards larger wind turbines (5 to 10 MW, or even larger) and wind power plants is also anticipated as a way of reduc-ing the cost of offshore wind energy through turbine- and plant-level economies of scale.
To date, offshore turbine technology has been very similar to onshore designs, with some modifi cations and with special foundations (Musial, 2007; Carbon Trust, 2008b). The mono-pile foundation is the most com-mon, though concrete gravity-based foundations have also been used with some frequency; a variety of other foundation designs (includ-ing fl oating designs) are being considered and in some instances used (Breton and Moe, 2009), especially as water depths increase, as discussed in Section 7.7. In addition to differences in foundations, modifi cation to offshore turbines (relative to onshore) include struc-tural upgrades to the tower to address wave loading; air conditioned and pressurized nacelles and other controls to prevent the effects of corrosive sea air from degrading turbine equipment; and personnel access platforms to facilitate maintenance. Additional design changes for marine navigational safety (e.g., warning lights, fog signals) and to minimize expensive servicing (e.g., more extensive condition monitor-ing, onboard service cranes) are common. Wind turbine tip speed could be chosen to be greater than for onshore turbines because concerns about noise are reduced for offshore power plants—higher tip speeds can sometimes lead to lower torque and lighter drive train components for the same power output. In addition, tower heights are sometimes
15 Of course, transmission infrastructure is needed to connect offshore wind power plants with electricity demand centres, and the per-kilometre cost of offshore trans-mission typically exceeds that for onshore lines. Whether offshore transmission needs are more or less extensive than those needed to access onshore wind energy varies by location.
lower than used for onshore wind power plants due to reduced wind shear offshore relative to onshore.
Lower power plant availabilities and higher O&M costs have been com-mon for offshore wind energy relative to onshore wind both because of the comparatively less mature state of offshore wind energy technology and because of the inherently greater logistical challenges of maintain-ing and servicing offshore turbines (Carbon Trust, 2008b; UKERC, 2010). Wind energy technology specifi cally tailored for offshore applications will become more prevalent as the offshore market expands, and it is expected that larger turbines in the 5 to 10 MW range may come to dominate this market segment (EU, 2008). Future technical advance-ment possibilities for offshore wind energy are described in Section 7.7.
7.3.2 International wind energy technology standards
Wind turbines in the 1970s and 1980s were designed using simplifi ed design models, which in some cases led to machine failures and in other cases resulted in design conservatism. The need to address both of these issues, combined with advances in computer processing power, moti-vated designers to improve their calculations during the 1990s (Quarton, 1998; Rasmussen et al., 2003). Improved design and testing methods have been codifi ed in International Electrotechnical Commission (IEC) standards, and the rules and procedures for Conformity Testing and Certifi cation of Wind Turbines (IEC, 2010) relies upon these standards. Certifi cation agencies rely on accredited design and testing bodies to provide traceable documentation of the execution of rules and specifi ca-tions outlined in the standards in order to certify turbines, components or entire wind power plants. The certifi cation system assures that a wind turbine design or wind turbines installed in a given location meet com-mon guidelines relating to safety, reliability, performance and testing. Figure 7.7(a) illustrates the design and testing procedures required to obtain a wind-turbine type certifi cation. Plant certifi cation, shown in Figure 7.7(b), requires a type certifi cate for the turbine and includes pro-cedures for evaluating site conditions and turbine design parameters associated with that specifi c site, as well as other site-specifi c conditions including soil properties, installation and plant commissioning.
Insurance companies, fi nancing institutions and power plant owners normally require some form of certifi cation for plants to proceed, and the IEC standards therefore provide a common basis for certifi cation to reduce uncertainty and increase the quality of wind turbine products available in the market (EWEA, 2009). In emerging markets, the lack of highly qualifi ed testing laboratories and certifi cation bodies limits the opportunities for manufacturers to obtain certifi cation according to IEC standards and may lead to lower-quality products. As markets mature and design margins are compressed to reduce costs, reliance on interna-tionally recognized standards is likely to become even more widespread to assure consistent performance, safety and reliability of wind turbines.

555
Chapter 7 Wind Energy
7.3.3 Power conversion and related grid connection issues
From an electric system reliability perspective, an important part of the wind turbine is the electrical conversion system. For large grid-connected turbines, electrical conversion systems come in three broad forms. Fixed-speed induction generators were popular in earlier years for both stall-regulated and pitch-controlled turbines; in these arrangements, wind turbines were net consumers of reactive power that had to be supplied by the electric system (see Ackermann, 2005). For modern turbines, these designs have now been largely replaced with variable-speed machines. Two arrangements are common, doubly-fed induction generators and
synchronous generators with a full power electronic converter, both of which are almost always coupled with pitch-controlled rotors. These variable-speed designs essentially decouple the rotating masses of the turbine from the electric system, thereby offering a number of power quality advantages over earlier turbine designs (Ackermann, 2005; EWEA, 2009). For example, these turbines can provide real and reactive power as well as some fault ride-through capability, which are increasingly being required by electric system operators (these requirements and the institu-tional elements of wind energy integration are addressed in Section 7.5). These designs differ from the synchronous generators found in most large-scale fossil fuel-powered plants, however, in that they result in no intrinsic inertial response capability, that is, they do not increase (decrease) power
Design Evaluation
(a) Wind Turbine Type Certification Procedure (b) Wind Project Certification Procedure
Design Basis Evaluation
Foundation Design Evaluation
Foundation Manufacturing
Evaluation
ManufacturingEvaluation
Final Evaluation
Type Testing
Type CharacteristicsMeasurements
Type Certificate
Optional Module
Design Basis Evaluation
Site ConditionsAssessment
Integrated LoadAnalysis
Support StructureDesign Evaluation
Wind Turbine/RNADesign Evaluation
Support StructureManuf. Surveillance
Transportation &Install Surveillance
CommissioningSurveillance
Wind Turbine/RNAManuf. Surveillance
Other InstallationsManuf. Surveillance
Operational &Maintainance Surveillance
Other InstallationsDesign Evaluation
Final Evaluation
Project CharacteristicsMeasurements
Type Certificate
Optional Module
Project Certificate
Figure 7.7 | Modules for (a) turbine type certifi cation and (b) wind power plant certifi cation (IEC, 2010).
Notes: RNA refers to Rotor Nacelle Assembly. The authors thank the IEC for permission to reproduce information from its International Standard IEC 61400-22 ed.1.0 (2010). All such extracts are copyright of IEC, Geneva, Switzerland. All rights reserved. Further information on the IEC is available from www.iec.ch. IEC has no responsibility for the placement and context in which the extracts and contents are reproduced by the authors, nor is IEC in any way responsible for the other content or accuracy therein. Copyright © 2010 IEC Geneva, Switzerland, www.iec.ch.

556
Wind Energy Chapter 7
output in synchronism with system power imbalances. This lack of inertial response is an important consideration for electric system planners because less overall inertia in the electric system makes the maintenance of stable system operation more challenging (Gautam et al., 2009). Wind turbine manufacturers have recognized this lack of intrinsic inertial response as a possible long-term impediment to wind energy and are actively pursu-ing a variety of solutions; for example, additional turbine controls can be added to provide inertial response (Mullane and O’Malley, 2005; Morren et al., 2006).
7.4 Global and regional status of market and industry development
The wind energy market expanded substantially in the 2000s, demon-strating the commercial and economic viability of the technology and industry, and the importance placed on wind energy development by a number of countries through policy support measures. Wind energy expansion has been concentrated in a limited number of regions, how-ever, and wind energy remains a relatively small fraction of global electricity supply. Further expansion of wind energy, especially in regions of the world with little wind energy deployment to date and in offshore locations, is likely to require additional policy measures.
This section summarizes the global (Section 7.4.1) and regional (Section 7.4.2) status of wind energy deployment, discusses trends in the wind energy industry (Section 7.4.3) and highlights the importance of policy actions for the wind energy market (Section 7.4.4).
7.4.1 Global status and trends
Wind energy has quickly established itself as part of the mainstream electricity industry. From a cumulative capacity of 14 GW at the end of 1999, global installed wind power capacity increased 12-fold in 10 years to reach almost 160 GW by the end of 2009, an average annual increase in cumulative capacity of 28% (see Figure 7.8). Global annual wind power capacity additions equalled more than 38 GW in 2009, up from 26 GW in 2008 and 20 GW in 2007 (GWEC, 2010a).
The majority of the capacity has been installed onshore, with offshore installations constituting a small proportion of the total market. About 2.1 GW of offshore wind turbines were installed by the end of 2009; 0.6 GW were installed in 2009, including the fi rst commercial offshore wind power plant outside of Europe, in China (GWEC, 2010a). Many of these offshore installations have taken place in the UK and Denmark. Signifi cant offshore wind power plant development activity, however, also exists in, at a mini-mum, other EU countries, the USA, Canada and China (e.g., Mostafaeipour, 2010). Offshore wind energy is expected to develop in a more signifi cant way in the years ahead as the technology advances and as onshore wind energy sites become constrained by local resource availability and/or siting challenges in some regions (BTM, 2010; GWEC, 2010a).
The total investment cost of new wind power plants installed in 2009 was USD2005 57 billion (GWEC, 2010a). Direct employment in the wind energy sector in 2009 has been estimated at roughly 190,000 in the EU and 85,000 in the USA. Worldwide, direct employment has been estimated at approximately 500,000 (GWEC, 2010a; REN21, 2010).
Despite these trends, wind energy remains a relatively small fraction of worldwide electricity supply. The total wind power capacity installed by the end of 2009 would, in an average year, meet roughly 1.8% of worldwide electricity demand, up from 1.5% by the end of 2008, 1.2% by the end of 2007, and 0.9% by the end of 2006 (Wiser and Bolinger, 2010).
7.4.2 Regional and national status and trends
The countries with the highest total installed wind power capacity by the end of 2009 were the USA (35 GW), China (26 GW), Germany (26 GW), Spain (19 GW) and India (11 GW). After its initial start in the USA in the 1980s, wind energy growth centred on countries in the EU and India dur-ing the 1990s and the early 2000s. In the late 2000s, however, the USA and then China became the locations for the greatest annual capacity addi-tions (Figure 7.9).
Regionally, Europe continues to lead the market with 76 GW of cumula-tive installed wind power capacity by the end of 2009, representing 48% of the global total (Asia represented 25%, whereas North America
Ann
ual C
apac
ity
Add
itio
ns [G
W]
Cum
ulat
ive
Capa
city
[GW
]
30
60
90
120
150
180
00
10
20
30
40
50
60
Annual Wind Power Installations (Left Axis)
Cumulative Wind Power Capacity (Right Axis)
1990 1991 1992 1993 1994 1995 1996 1997 1998 1999 2000 2001 2002 2003 2004 2005 2006 2007 2008 2009
Figure 7.8 | Global annual wind power capacity additions and cumulative capacity (Data sources: GWEC, 2010a; Wiser and Bolinger, 2010).

557
Chapter 7 Wind Energy
represented 24%). Notwithstanding the continuing growth in Europe, the trend over time has been for the wind energy industry to become less reliant on a few key markets, and other regions of the world have increasingly become the dominant markets for wind energy growth. The annual growth in the European wind energy market in 2009, for exam-ple, accounted for just 28% of the total new wind power additions in that year, down from over 60% in the early 2000s (GWEC, 2010a). More than 70% of the annual wind power capacity additions in 2009 occurred outside of Europe, with particularly signifi cant growth in Asia (40%) and North America (29%) (Figure 7.10). Even in Europe, though Germany and Spain have been the strongest markets during the 2000s, there is a trend towards less reliance on these two countries.
Despite the increased globalization of wind power capacity additions, the market remains concentrated regionally. As shown in Figure 7.10, Latin America, Africa and the Middle East, and the Pacifi c regions have installed
relatively little wind power capacity despite signifi cant technical potential in each region, as presented earlier in Section 7.2. And, even in the regions of signifi cant growth, most of that growth has occurred in a limited number of countries. In 2009, for example, 90% of wind power capacity additions occurred in the 10 largest markets, and 62% was concentrated in just two countries: China (14 GW, 36%) and the USA (10 GW, 26%).
In both Europe and the USA, wind energy represents a major new source of electric capacity additions. From 2000 through 2009, wind energy was the second-largest new resource added in the USA (10% of all gross capacity additions) and EU (33% of all gross capacity additions) in terms of nameplate capacity, behind natural gas but ahead of coal. In 2009, 39% of all capacity additions in the USA and 39% of all additions in the EU came from wind energy (Figure 7.11). In China, 5% of the net capac-ity additions from 2000 to 2009 and 16% of the net additions in 2009 came from wind energy. On a global basis, from 2000 through 2009,
Cum
ulat
ive
Win
d Po
wer
Cap
acit
y [G
W]
0
5
10
15
20
25
35
40
30
2006
2007
2008
2009
USUS ChinaChina GermanyGermany SpainSpain IndiaIndia ItalyItaly FranceFrance UK Portugal Denmark
Figure 7.9 | Top-10 countries in cumulative wind power capacity (Date source: GWEC, 2010a).
0
2
4
6
8
10
12
14
16
Europe North America Asia Latin America Africa &Middle East
Pacific
Annual
Cap
acit
y A
dd
itio
ns,
by
Reg
ion [
GW
]
2006
2007
2008
2009
Figure 7.10 | Annual wind power capacity additions by region (Data source: GWEC, 2010a).
Note: Regions shown in the fi gure are defi ned by the study.

558
Wind Energy Chapter 7
A number of countries are beginning to achieve relatively high levels of annual wind electricity penetration in their respective electric systems. Figure 7.12 presents data for the end of 2009 (and the end of 2006, 2007 and 2008) on installed wind power capacity, translated into projected annual electricity supply, and divided by electricity consumption. On this basis, and focusing only on the 20 countries with the greatest cumu-lative wind power capacity, at the end of 2009, wind power capacity was capable of supplying electricity equal to roughly 20% of Denmark’s annual electricity demand, 14% of Portugal’s, 14% of Spain’s, 11% of Ireland’s and 8% of Germany’s (Wiser and Bolinger, 2010).17
7.4.3 Industry development
The growing maturity of the wind energy sector is illustrated not only by wind power capacity additions, but also by trends in the wind energy industry. In particular, major established companies from outside the traditional wind energy industry have become increasingly involved in the sector. For example, there has been a shift in the type of companies developing, owning and operating wind power plants, from relatively small independent power plant developers to large power generation
companies (including electric utilities) and large independent power plant developers. With respect to wind turbine and component manu-facturing, the increase in the size and geographic spread of the wind energy market, along with manufacturing localization requirements in some countries, has brought in new players. The involvement of these new players has, in turn, encouraged a greater globalization of the industry. Manufacturer product strategies are shifting to address larger
17 Because of interconnections among electricity grids, these percentages do not neces-sarily equate to the amount of wind electricity consumed within each country.
Perc
ent
of N
amep
late
Ele
ctri
c Ca
paci
ty A
ddit
ions
[%]
0
10
20
30
40
50
70
80
90
100
60
Other
Coal
Natural Gas
Wind
EU
2000-2009 2009
201 GW 25 GW26 GW324 GW
US EU US
Total Additions
Figure 7.11 | Relative contribution of electricity supply types to gross capacity additions in the EU and the USA (Data sources: EWEA, 2010b; Wiser and Bolinger, 2010).
Note: The ‘other’ category includes other forms of renewable energy, nuclear energy, and fuel oil.
Figure 7.12 | Approximate annual average wind electricity penetration in the twenty countries with the greatest installed wind power capacity (Wiser and Bolinger, 2010).
Proj
ecte
d W
ind
Elec
tric
ity
as a
Pr
opor
tion
of E
lect
rici
ty C
onsu
mpt
ion
[%]
0
2
4
6
8
10
14
16
18
20
22
12
Approximate Wind Penetration, End of 2009
Approximate Wind Penetration, End of 2008
Approximate Wind Penetration, End of 2007
Approximate Wind Penetration, End of 2006
Den
mar
k
Port
ugal
Spai
n
Irel
and
Ger
man
y
Gre
ece
Net
herl
ands UK
Ital
y
Indi
a
Aus
tria US
Swed
en
Fran
ce
Aus
tral
ia
Cana
da
Turk
ey
Chin
a
Braz
il
Japa
n
TOTA
L
roughly 11% of all newly installed net electric capacity additions came from new wind power plants; in 2009 alone, that fi gure was probably more than 20%.16
16 Worldwide capacity additions from 2000 through 2007 come from historical data from the US Energy Information Administration. Capacity additions for 2008 and 2009 are estimated based on historical capacity growth from 2000 to 2007. The fo-cus here is on capacity additions in GW terms, though it is recognized that electricity generation technologies often have widely divergent average capacity factors, and that the contribution of wind energy to new electricity demand (in GWh terms) may differ from what is presented here.

559
Chapter 7 Wind Energy
scale power plants, higher capacity and offshore turbines, and lower wind speeds. More generally, the signifi cant contribution of wind energy to new electric capacity investment in several regions of the world has attracted a broad range of players across the industry supply chain, from local site-focused engineering fi rms to global vertically integrated utilities. The industry’s supply chain has also become increasingly com-petitive as a multitude of fi rms seek the most profi table balance between vertical integration and specialization (BTM, 2010; GWEC, 2010a).
Despite these trends, the global wind turbine market remains somewhat regionally segmented, with just six countries hosting the majority of wind turbine manufacturing (China, Denmark, India, Germany, Spain and the USA). With markets developing differently, market share for tur-bine supply has been marked by the emergence of national industrial champions, the entry of highly focused technology innovators and the arrival of new start-ups licensing proven technology from other regions (Lewis and Wiser, 2007). Regardless, the industry continues to globalize: Europe’s turbine and component manufacturers have penetrated the North American and Asian markets, and the growing presence of Asian manufacturers in Europe and North America is expected to become more pronounced in the years ahead. Chinese wind turbine manufacturers, in particular, are dominating their home market, and will increasingly seek export opportunities. Wind turbine sales and supply chain strategies are therefore expected to continue to take on a more international dimen-sion as volumes increase.
Amidst the growth in the wind energy industry also come challenges. As discussed further in Section 7.8, from 2005 through 2008, supply chain dif-fi culties caused by growing demand for wind energy strained the industry, and prices for wind turbines and turbine components increased to compen-sate for this imbalance. Commodity price increases, the availability of skilled labour and other factors also played a role in pushing wind turbine prices higher, while the underdeveloped supply chain for offshore wind power plants strained that portion of the industry. Overcoming supply chain diffi -culties is not simply a matter of ramping up the production of wind turbine components to meet the increased levels of demand. Large-scale invest-ment decisions are more easily made based on a sound long-term outlook for the industry. In most markets, however, both the projections and actual demand for wind energy depend on a number of factors, some of which are outside of the control of the industry, such as political frameworks and policy measures.
7.4.4 Impact of policies18
The deployment of wind energy must overcome a number of challenges that vary in type and magnitude depending on the wind energy appli-cation and region.19 The most signifi cant challenges to wind energy deployment are summarized here. Perhaps most importantly, in many
18 Non-technology-specifi c policy issues are covered in Chapter 11 of this report.
19 For a broader discussion of barriers and market failures associated with renewable energy, see Sections 1.4 and 11.1, respectively.
(though not all) regions of the world, wind energy is more expensive than current energy market prices, at least if environmental impacts are not internalized and monetized (NRC, 2010a). Wind energy also faces a number of other challenges, some of which are somewhat unique to wind energy or are at least particularly relevant to this sector. Some of the most critical challenges include: (1) concerns about the impact of wind energy’s variability on electricity reliability; (2) challenges to building the new transmission infrastructure both on- and offshore (and within country and cross-border) needed to enable access to the most attractive wind resource areas; (3) cumbersome and slow planning, sit-ing and permitting procedures that impede wind energy deployment; (4) the technical advancement needs and higher cost of offshore wind energy technology; and (5) lack of institutional and technical knowledge in regions that have not experienced substantial wind energy deploy-ment to this point.
As a result of these challenges, growth in the wind energy sector is affected by and responsive to political frameworks and a wide range of government policies. During the past two decades, a signifi cant number of developed countries and, more recently, a growing number of developing nations have laid out RE policy frameworks that have played a major role in the expansion of the wind energy market. These efforts have been motivated by the environmental, fuel diversity, and economic development impacts of wind energy deployment, as well as the potential for reducing the cost of wind energy over time. An early signifi cant effort to deploy wind energy at a commercial scale occurred in California, with a feed-in tariff and aggressive tax incentives spurring growth in the 1980s (Bird et al., 2005). In the 1990s, wind energy deploy-ment moved to Europe, with feed-in tariff policies initially established in Denmark and Germany, and later expanding to Spain and then a number of other countries (Meyer, 2007); renewable portfolio standards have been implemented in other European countries and, more recently, European renewable energy policies have been motivated in part by the EU’s binding 20%-by-2020 target for renewable energy. In the 2000s, growth in the USA (Bird et al., 2005; Wiser and Bolinger, 2010), China (Li et al., 2007; Li, 2010; Liu and Kokko, 2010), and India (Goyal, 2010) was based on varied policy frameworks, including renewable portfolio stan-dards, tax incentives, feed-in tariffs and government-overseen bidding. Still other policies have been used in a number of countries to directly encourage the localization of wind turbine and component manufactur-ing (Lewis and Wiser, 2007).
Though economic support policies differ, and a healthy debate exists over the relative merits of different approaches, a key fi nding is that both policy transparency and predictability are important (see Chapter 11). Moreover, though it is not uncommon to focus on economic poli-cies for wind energy, as noted above and as discussed elsewhere in this chapter and in Chapter 11, experience shows that wind energy markets are also dependent on a variety of other factors (e.g., Valentine, 2010). These include local resource availability, site planning and approval pro-cedures, operational integration into electric systems, transmission grid expansion, wind energy technology improvements, and the availability of institutional and technical knowledge in markets unfamiliar with

560
Wind Energy Chapter 7
wind energy (e.g., IEA, 2009). For the wind energy industry, these issues have been critical in defi ning both the size of the market opportunity in each country and the rules for participation in those opportunities; many countries with sizable wind resources have not deployed signifi -cant amounts of wind energy as a result of these factors. Given the challenges to wind energy listed earlier, successful frameworks for wind energy deployment might consider the following elements: sup-port systems that offer adequate profi tability and that ensure investor confi dence; appropriate administrative procedures for wind energy planning, siting and permitting; a degree of public acceptance of wind power plants to ease implementation; access to the existing transmis-sion system and strategic transmission planning and new investment for wind energy; and proactive efforts to manage wind energy’s inher-ent output variability and uncertainty. In addition, R&D by government and industry has been essential to enabling incremental improvements in onshore wind energy technology and to driving the improvements needed in offshore wind energy technology. Finally, for those markets that are new to wind energy deployment, both knowledge (e.g., wind resource mapping expertise) and technology transfer (e.g., to develop local wind turbine manufacturers and to ease grid integration) can help facilitate early installations.
7.5 Near-term grid integration issues20
As wind energy deployment has increased, so have concerns about the integration of that energy into electric systems (e.g., Fox et al., 2007). The nature and magnitude of the integration challenge will be system specifi c and will vary with the degree of wind electricity penetration. Moreover, as discussed in Chapter 8, integration challenges are not unique to wind energy: adding any type of generation technology to an electric system, particularly location-constrained variable generation, presents challenges. Nevertheless, analysis and operating experience primarily from certain OECD countries (where most of the wind energy deployment has occurred, until recently, see Section 7.4.2) suggest that, at low to medium levels of wind electricity penetration (defi ned here as up to 20% of total annual average electrical energy demand),21 the integration of wind energy generally poses no insurmountable technical barriers and is economically manageable. In addition, increased oper-ating experience with wind energy along with improved technology, altered operating and planning practices and additional research should facilitate the integration of even greater quantities of wind energy. Even at low to medium levels of wind electricity penetration, however, certain (and sometimes system-specifi c) technical and/or institutional chal-lenges must be addressed.
20 Non-technology-specifi c issues related to integration of RE sources in current and future energy systems are covered in Chapter 8 of this report.
21 This level of penetration was chosen to loosely separate the integration needs for wind energy in the relatively near term from the broader, longer-term, and non-wind-specifi c discussion of electric system changes provided in Chapter 8. In addition, the majority of operational experience and literature on the integration of wind energy addresses penetration levels below 20%.
The integration issues covered in this section include how to address wind power variability and uncertainty, the possible need for additional transmission capacity to enable remotely located wind power plants to meet the needs of electricity demand centres, and the development of technical standards for connecting wind power plants with electric sys-tems. The focus is on those issues faced at low to medium levels of wind electricity penetration (up to 20%). Even higher levels of penetration may depend on or benefi t from the availability of additional fl exibility options, such as: further increasing the fl exibility of other electricity gen-eration plants (fossil and otherwise); mass-market demand response; large-scale deployment of electric vehicles and their associated contri-butions to system fl exibility through controlled battery charging; greater use of wind power curtailment and output control or diverting excess wind energy to fuel production or local heating; increased deployment of bulk energy storage technologies; and further improvements in the interconnections between electric systems. The deployment of a diver-sity of RE technologies may also help facilitate overall electric system integration. Many of these options relate to broader developments within the energy sector that are not specifi c to wind energy, however, and most are therefore addressed in Chapter 8.
This section begins by describing the specifi c characteristics of wind energy that present integration challenges (Section 7.5.1). The section then discusses how these characteristics impact issues associated with the planning (Section 7.5.2) and operation (Section 7.5.3) of electric systems to accommodate wind energy, including a selective discussion of actual operating experience. Finally, Section 7.5.4 summarizes the results of various studies that have quantifi ed the technical issues and economic costs of integrating increased quantities of wind energy.
7.5.1 Wind energy characteristics
Several important characteristics of wind energy are different from those of many other generation sources. These characteristics must be considered in electric system planning and operation to ensure the reli-able and economical operation of the electric power system.
The fi rst characteristic to consider is that the quality of the wind resource and therefore the cost of wind energy is location dependent. As a result, regions with the highest-quality wind resources may not be situ-ated near population centres that have high electricity demands (e.g., Hoppock and Patiño-Echeverri, 2010; Liu and Kokko, 2010). Additional transmission infrastructure is therefore sometimes economically justi-fi ed (and is often needed) to bring wind energy from higher-quality wind resource areas to electricity demand centres as opposed to utilizing lower-quality wind resources that are located closer to demand centres and that may require less new transmission investment (see Sections 7.5.2.3 and 7.5.4.3).
The second important characteristic is that wind energy is weather dependent and therefore variable—the power output of a wind power plant varies from zero to its rated capacity depending on prevailing

561
Chapter 7 Wind Energy
weather conditions. Variations can occur over multiple time scales, from shorter-term sub-hourly fl uctuations to diurnal, seasonal, and ever inter-annual fl uctuations (e.g., Van der Hoven, 1957; Justus et al., 1979; Wan and Bucaneg, 2002; Apt, 2007; Rahimzadeh et al., 2011). The nature of these fl uctuations and patterns is highly site- and region-specifi c. Figure 7.13 illustrates some elements of this variability by showing the scaled output of an individual wind turbine, a small collection of wind power plants, and a large collection of wind power plants in Germany over 10 consecutive days. An important aspect of wind power variability for elec-tric system operations is the rate of change in wind power output over different relatively short time periods; Figure 7.13 demonstrates that the aggregate output of multiple wind power plants changes much more dramatically over relatively longer periods (multiple hours) than over very short periods (minutes). An important aspect of wind power variability for the purpose of electric sector planning, on the other hand, is the cor-relation of wind power output with the periods of time when electric system reliability is at greatest risk, typically periods of high electricity demand. In this case, the diurnal, seasonal, and even interannual patterns of wind power output (and the correlation of those patterns with electric-ity demand) can impact the capacity credit assigned by system planners to wind power plants, as discussed further in Section 7.5.3.4.
Third, in comparison with many other types of power plants, wind power output has lower levels of predictability. Forecasts of wind power
output use various approaches and have multiple goals, and signifi cant improvements in forecasting accuracy have been achieved in recent years (e.g., Costa et al., 2008). Despite those improvements, however, forecasts remain imperfect. In particular, forecasts are less accurate over longer forecast horizons (multiple hours to days) than over shorter periods (e.g., H. Madsen et al., 2005), which, depending on the charac-teristics of the electric system, can have implications for the ability of that system and related trading markets to manage wind power vari-ability and uncertainty (Usaola, 2009; Weber, 2010).
The aggregate variability and uncertainty of wind power output depends, in part, on the degree of correlation between the outputs of different geographically dispersed wind power plants. This correlation between the outputs of wind power plants, in turn, depends on the geographic deployment of the plants and the regional characteristics of weather patterns, especially wind speeds. Generally, the output of wind power plants that are farther apart are less correlated with each other, and variability over shorter time periods (minutes) is less cor-related than variability over longer time periods (multiple hours) (e.g., Wan et al., 2003; Sinden, 2007; Holttinen et al., 2009; Katzenstein et al., 2010). This lack of perfect correlation results in a smoothing effect associated with geographic diversity when the output of multiple wind turbines and power plants are combined, as illustrated in Figure 7.13: the aggregate scaled variability shown for groups of wind power
Figure 7.13 | Example time series of wind power output scaled to wind power capacity for a single wind turbine, a group of wind power plants, and all wind power plants in Germany over a 10-day period in 2006 (Durstewitz et al., 2008)
Nor
mal
ized
Win
d Po
wer
Date
15-Dec-06 17-Dec-0613-Dec-0611-Dec-069-Dec-067-Dec-06
0.4
0.3
0.2
0.1
0
0.9
1.0
0.8
0.7
0.6
0.5
Single Turbine
Group of Wind PlantsAll German Wind Power
562
Wind Energy Chapter 7
plants over a region is less than the scaled output of a single wind turbine. This apparent smoothing of aggregated output is due to the decreasing correlation of output between different wind power plants as distance between those plants increases. If, on the other hand, the output of multiple wind turbines and power plants was perfectly corre-lated, then the aggregate variability would be equivalent to the scaled variability of a single turbine. With suffi cient transmission capacity between wind power plants, the observed geographic smoothing effect has implications for the variability of aggregate wind power output that electric systems must accommodate, and also infl uences forecast accuracy because accuracy improves with the number and diversity of wind power plants considered (e.g., Focken et al., 2002).
7.5.2 Planning electric systems with wind energy
Detailed system planning for new generation and transmission infra-structure is used to ensure that the electric system can be operated reliably and economically in the future. Advanced planning is required due, in part, to the long time horizons required to build new electricity infrastructure. More specifi cally, electric system planners22 must evalu-ate the adequacy of transmission to deliver electricity to demand centres and the adequacy of generation to maintain a balance between sup-ply and demand under a variety of operating conditions. Though not an exhaustive list, four technical planning issues are prominent when considering increased reliance on wind energy: the need for accurate electric system models of wind turbines and power plants; the devel-opment of technical standards for connecting wind power plants with electric systems (i.e., grid codes); the broader transmission infrastructure needs of electric systems with wind energy; and the maintenance of overall generation adequacy with increased wind electricity penetration.
7.5.2.1 Electric system models
Computer-based simulation models are used extensively to evaluate the ability of the electric system to accommodate new generation, changes in demand and changes in operational practices. An important role of electric system models is to demonstrate the ability of an electric system to recover from severe events or contingencies. Generic models of typi-cal synchronous generators have been developed and validated over a period of multiple decades, and are used in industry standard software tools (e.g., power system simulators and analysis models) to study how the electric system and all its components will behave during system events or contingencies. Similar generic models of wind turbines and wind power plants are in the process of being developed and validated. Because wind turbines have electrical characteristics that differ from typical synchronous generators, this modelling exercise requires signifi -cant effort. As a result, though considerable progress has been made,
22 Electric system planners (or organizations that plan electric systems) is used here as a generic term that refers to planners within any organization that regulates, operates components of, or builds infrastructure for the electric system.
this progress is not complete, and increased deployment of wind energy will require improved and validated models to allow planners to better assess the capability of electric systems to accommodate wind energy (Coughlan et al., 2007; NERC, 2009).
7.5.2.2 Wind power electrical characteristics and grid codes
As wind power capacity has increased, so has the need for wind power plants to become more active participants in maintaining (rather than passively depending on) the operability and power quality of the electric system. Focusing here primarily on the technical aspects of grid connec-tion, the electrical performance of wind turbines in interaction with the grid is often verifi ed in accordance with international standards for the characteristics of wind turbines, in which methods to assess the impact of one or more wind turbines on power quality are specifi ed (IEC, 2008). Additionally, an increasing number of electric system operators have implemented technical standards (sometimes called ‘grid codes’) that wind turbines and/or wind power plants (and other power plants) must meet when connecting to the grid to help prevent equipment or facilities from adversely affecting the electric system during normal operation and contingencies (see also Chapter 8). Electric system models and operating experience are used to develop these requirements, which can then typically be met through modifi cations to wind turbine design or through the addition of auxiliary equipment such as power conditioning devices. In some cases, the unique characteristics of specifi c generation types are addressed in grid codes, resulting in wind-specifi c grid codes (e.g., Singh and Singh, 2009).
Grid codes often require ‘fault ride-through’ capability, or the ability of a wind power plant to remain connected and operational during brief but severe changes in electric system voltage (Singh and Singh, 2009). The requirement for fault ride-through capability was in response to the increasing penetration of wind energy and the signifi cant size of indi-vidual wind power plants. Electric systems can typically maintain reliable operation when small individual power plants shut down or disconnect from the system for protection purposes in response to fault conditions. When a large amount of wind power capacity disconnects in response to a fault, however, that disconnection can exacerbate the fault conditions. Electric system planners have therefore increasingly specifi ed that wind power plants must meet minimum fault ride-through standards similar to those required of other large power plants. System-wide approaches have also been adopted: in Spain, for example, wind power output may be curtailed in order to avoid potential reliability issues in the event of a fault; the need to employ this curtailment, however, is expected to decrease as fault ride-through capability is added to new and exist-ing wind power plants (Rivier Abbad, 2010). Reactive power control to help manage voltage is also often required by grid codes, enabling wind turbines to improve voltage stability margins particularly in weak parts of the electric system (Vittal et al., 2010). Requirements for wind tur-bine inertial response to improve system stability after disturbances are less common, but are under consideration (Hydro-Quebec TransEnergie,

563
Chapter 7 Wind Energy
2006; Doherty et al., 2010). Active power control (including limits on how quickly wind power plants can change their output) and frequency con-trol are also sometimes required (Singh and Singh, 2009). Finally, controls can be added to wind power plants to enable benefi cial dampening of inter-area oscillations during dynamic events (Miao et al., 2009).
7.5.2.3 Transmission infrastructure
As noted earlier, the highest-quality wind resources (whether on- or off-shore) are often located at a distance from electricity demand centres. As a result, even at low to medium levels of wind electricity penetration, the addition of large quantities of wind energy in areas with the stron-gest wind resources may require signifi cant new additions or upgrades to the transmission system (see also Chapter 8). Transmission adequacy evaluations must consider any tradeoffs between the costs of expand-ing the transmission system to access higher-quality wind resources and the costs of accessing lower-quality wind resources that require less transmission investment (e.g., Hoppock and Patiño-Echeverri, 2010). In addition, evaluations of new transmission capacity need to account for the relative smoothing benefi ts of aggregating wind power plants over large areas, the amount of transmission capacity devoted to managing the remaining variability of wind power output, and the broader non-wind-specifi c advantages and disadvantages of transmission expansion (Burke and O’Malley, 2010).
Irrespective of the costs and benefi ts of transmission expansion to accommodate increased wind energy deployment, one of the primary challenges is the long time it can take to plan, site, permit and con-struct new transmission infrastructure relative to the shorter time it often takes to add new wind power plants. Depending on the legal and regulatory framework in any particular region, the institutional chal-lenges of transmission expansion, including cost allocation and siting, can be substantial (e.g., Benjamin, 2007; Vajjhala and Fischbeck, 2007; Swider et al., 2008). Enabling increased penetration of wind electricity may therefore require the creation of regulatory and legal frameworks for proactive rather than reactive transmission planning (Schumacher et al., 2009). Estimates of the cost of the new transmission required to achieve low to medium levels of wind electricity penetration in a variety of locations around the world are summarized in Section 7.5.4.
7.5.2.4 Generation adequacy
Though methods and objectives vary from region to region, generation adequacy evaluations are generally used to assess the capability of gen-eration resources to reliably meet electricity demand. Planners often evaluate the long-term reliability of the electric system by estimating the probability that the system will be able to meet expected demand in the future, as measured by a statistical metric called the load-carrying capability of the system. Each electricity supply resource contributes some fraction of its nameplate capacity to the overall capability of the
system, as indicated by the capacity credit assigned to the resource.23
Although there is not a strict, uniform defi nition of capacity credit, the capacity credit of a generator is usually a ‘system’ characteristic in that it is determined not only by the generator’s characteristics but also by the characteristics of the electric system to which that genera-tor is connected, particularly the temporal profi le of electricity demand (Amelin, 2009).
The contribution of wind energy to long-term reliability can be evalu-ated using standard approaches, and wind power plants are typically found to have a capacity credit of 5 to 40% of nameplate capacity (see Figure 7.14). The correlation between wind power output and electri-cal demand is an important determinant of the capacity credit of an individual wind power plant. In many cases, wind power output is uncor-related or is weakly negatively correlated with periods of high electricity demand, reducing the capacity credit of wind power plants; this is not always the case, however, and wind power output in the UK, for exam-ple, has been found to be weakly positively correlated with periods of high demand (Sinden, 2007). These correlations are case specifi c as they depend on the diurnal, seasonal and yearly characteristics of both wind power output and electricity demand. A second important character-istic of the capacity credit for wind energy is that its value generally decreases as wind electricity penetration levels rise, because the capac-ity credit of a generator is greater when power output is well-correlated with periods of time when there is a higher risk of a supply shortage. As the level of wind electricity penetration increases, however, assum-ing that the outputs of wind power plants are positively correlated, the period of greatest risk will shift to times with low average levels of wind energy supply (Hasche et al., 2010). Aggregating wind power plants over larger areas may reduce the correlation between wind power out-puts, as described earlier, and can slow the decline in capacity credit as wind electricity penetration increases, though adequate transmission capacity is required to aggregate the output of wind power plants in this way (Tradewind, 2009; EnerNex Corp, 2010).24
The relatively low average capacity credit of wind power plants (com-pared to fossil fuel-powered units, for example) suggests that systems with large amounts of wind energy will also tend to have signifi cantly more total nameplate generation capacity (wind and non-wind) to meet the same peak electricity demand than will electric systems without large amounts of wind energy. Some of this generation capacity will operate infrequently, however, and the mix of other generation in an electric system with large amounts of wind energy will tend (on eco-nomic grounds) to increasingly shift towards more fl exible ‘peaking’
23 As an example, the addition of a very reliable 100 MW fossil unit in a system with numerous other reliable units will usually increase the load-carrying capability of the system by at least 90 MW, leading to a greater than 90% capacity credit for the fossil unit.
24 Generation resource adequacy evaluations are also beginning to include the capabil-ity of the system to provide adequate fl exibility and operating reserves to accom-modate more wind energy (NERC, 2009). The increased demand from wind energy for operating reserves and fl exibility is addressed in Section 7.5.3.
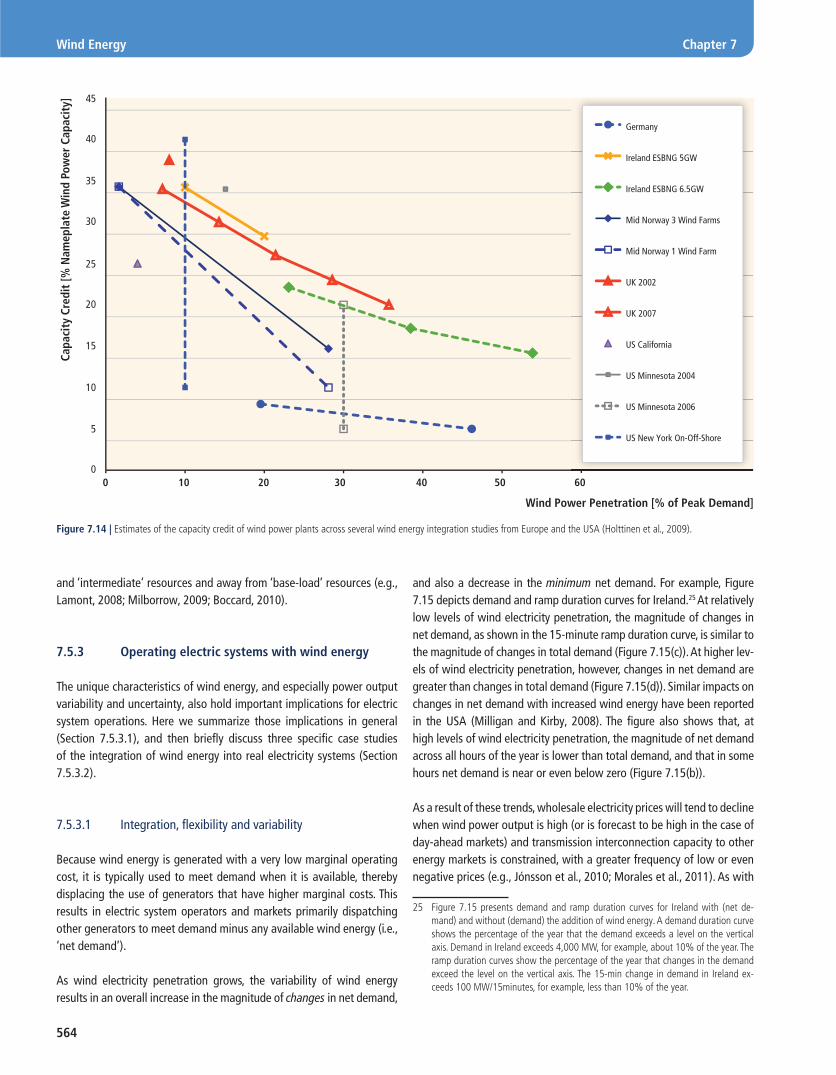
564
Wind Energy Chapter 7
and ‘intermediate’ resources and away from ‘base-load’ resources (e.g., Lamont, 2008; Milborrow, 2009; Boccard, 2010).
7.5.3 Operating electric systems with wind energy
The unique characteristics of wind energy, and especially power output variability and uncertainty, also hold important implications for electric system operations. Here we summarize those implications in general (Section 7.5.3.1), and then briefl y discuss three specifi c case studies of the integration of wind energy into real electricity systems (Section 7.5.3.2).
7.5.3.1 Integration, fl exibility and variability
Because wind energy is generated with a very low marginal operating cost, it is typically used to meet demand when it is available, thereby displacing the use of generators that have higher marginal costs. This results in electric system operators and markets primarily dispatching other generators to meet demand minus any available wind energy (i.e., ‘net demand’).
As wind electricity penetration grows, the variability of wind energy results in an overall increase in the magnitude of changes in net demand,
and also a decrease in the minimum net demand. For example, Figure 7.15 depicts demand and ramp duration curves for Ireland.25 At relatively low levels of wind electricity penetration, the magnitude of changes in net demand, as shown in the 15-minute ramp duration curve, is similar to the magnitude of changes in total demand (Figure 7.15(c)). At higher lev-els of wind electricity penetration, however, changes in net demand are greater than changes in total demand (Figure 7.15(d)). Similar impacts on changes in net demand with increased wind energy have been reported in the USA (Milligan and Kirby, 2008). The fi gure also shows that, at high levels of wind electricity penetration, the magnitude of net demand across all hours of the year is lower than total demand, and that in some hours net demand is near or even below zero (Figure 7.15(b)).
As a result of these trends, wholesale electricity prices will tend to decline when wind power output is high (or is forecast to be high in the case of day-ahead markets) and transmission interconnection capacity to other energy markets is constrained, with a greater frequency of low or even negative prices (e.g., Jónsson et al., 2010; Morales et al., 2011). As with
25 Figure 7.15 presents demand and ramp duration curves for Ireland with (net de-mand) and without (demand) the addition of wind energy. A demand duration curve shows the percentage of the year that the demand exceeds a level on the vertical axis. Demand in Ireland exceeds 4,000 MW, for example, about 10% of the year. The ramp duration curves show the percentage of the year that changes in the demand exceed the level on the vertical axis. The 15-min change in demand in Ireland ex-ceeds 100 MW/15minutes, for example, less than 10% of the year.
Capa
city
Cre
dit
[% N
amep
late
Win
d Po
wer
Cap
acit
y]
0
5
10
15
20
25
30
35
40
45
0 10 20 30
Wind Power Penetration [% of Peak Demand]
40 50 60
Germany
Ireland ESBNG 5GW
Ireland ESBNG 6.5GW
Mid Norway 3 Wind Farms
Mid Norway 1 Wind Farm
UK 2002
UK 2007
US California
US Minnesota 2004
US Minnesota 2006
US New York On-Off-Shore
Figure 7.14 | Estimates of the capacity credit of wind power plants across several wind energy integration studies from Europe and the USA (Holttinen et al., 2009).

565
Chapter 7 Wind Energy
adding any low marginal cost resource to an electric system, increased wind electricity penetrations will therefore tend to reduce average wholesale prices in the short term (before changes are made to the mix of other generation sources) as wind energy displaces power sources with higher marginal costs. Price volatility will also tend to increase as the variability and uncertainty in wind power output ensures that wind energy will not always be available to displace higher marginal cost generators. In the long run, however, the average effect of wind energy on wholesale electricity prices is not as clear because the relationships between investment costs, O&M costs and wholesale price signals will begin to infl uence decisions about the expansion of transmission inter-connections, generator retirement and the type of new generation that is built (Morthorst, 2003; Førsund et al., 2008; Lamont, 2008; Sáenz de Miera et al., 2008; Sensfuß et al., 2008; Söder and Holttinen, 2008; MacCormack et al., 2010).
These price impacts are a refl ection of the fact that increased wind energy deployment will require some other generating units to oper-ate in a more fl exible manner than required without wind energy. At low to medium levels of wind electricity penetration, the increase in minute-to-minute variability will depend on the exact level of wind
electricity penetration, the degree of geographic smoothing, and electric system size, but is generally expected to be relatively small and there-fore inexpensive to manage in large electric systems (J. Smith et al., 2007). The more signifi cant operational challenges relate to the variabil-ity and commensurate increased need for fl exibility to manage changes in wind power output over one to six hours (Doherty and O’Malley, 2005; Holttinen et al., 2009). Incorporating state-of-the-art forecasting of wind energy over multiple time horizons into electric system opera-tions can reduce the need for fl exibility from other generators, and has been found to be especially important as wind electricity penetration levels increase (e.g., Doherty et al., 2004; Tuohy et al., 2009; GE Energy, 2010). Nonetheless, even with high-quality forecasts and geographi-cally dispersed wind power plants, additional start-ups and shut-downs, part-load operation, and ramping will be required from fossil genera-tion units to maintain the supply/demand balance (e.g., Göransson and Johnsson, 2009; Troy et al., 2010).
This additional fl exibility is not free, as it increases the amount of time that fossil fuel-powered units are operated at less effi cient part-load conditions (resulting in lower than expected reductions in production costs and emissions from fossil generators as described in Sections
Figure 7.15 | Demand duration and 15-minute ramp duration curves for Ireland in (a, c) 2008 (wind energy represents 7.5% of total annual average electricity demand), and (b, d) projected for high wind electricity penetration levels (wind energy represents 40% of total annual average electricity demand).1 Source: Data from www.eirgrid.com.
Note: 1. Projected demand and ramp duration curves are based on scaling 2008 data (demand is scaled by 1.27 and wind energy is scaled on average by 7). Ramp duration curves show the cumulative probability distributions of 15-minute changes in demand and net demand.
Pow
er [M
W]
(a) Demand Duration Curve
Probability10.80.60.40.20
5,000
4,000
3,000
2,000
1,000
Ram
p [M
W/1
5 m
inut
es]
(c) Ramp Duration Curve
Probability10.80.60.40.20
400
100
200
300
0
-200
-100
-300
Pow
er [M
W]
(b) Demand Duration Curve (Projected)
Probability10.80.60.40.20
6,000
4,000
2,000
0
-2,000
Ram
p [M
W/1
5 m
inut
es]
(d) Ramp Duration Curve (Projected)
Probability10.80.60.40.20
400
200
0
-200
-400
Demand Net Demand
Demand Net Demand
Demand Net Demand
Demand Net Demand

566
Wind Energy Chapter 7
7.5.4 and 7.6.1.3, respectively), increases wear and tear on boilers and other equipment, increases maintenance costs, and reduces power plant life (Denny and O’Malley, 2009). Various kinds of economic incentives can be used to ensure that the operational fl exibility of other genera-tors is made available to system operators. Some electricity systems, for example, have day-ahead, intra-day, and/or hour-ahead markets for electricity, as well as markets for reserves, balancing energy and other ancillary services. These markets can provide pricing signals for increased (or decreased) fl exibility when needed as a result of rapid changes in or poorly predicted wind power output, and can therefore reduce the cost of integrating wind energy (J. Smith et al., 2007; Göransson and Johnsson, 2009). Markets with shorter scheduling periods have also been found to be more responsive to variability and uncertainty, thereby facilitat-ing wind energy integration (Holttinen, 2005; Kirby and Milligan, 2008; Tradewind, 2009). In addition, coordinated electric system operations across larger areas has been shown to benefi t wind energy integration, and increased levels of wind energy supply may therefore tend to moti-vate greater investments in and electricity trade across transmission interconnections (Milligan and Kirby, 2008; Denny et al., 2010). Where wholesale electricity markets do not exist, other planning methods or incentives would be needed to ensure that generating plants are fl exible enough to accommodate increased deployment of wind energy.
Planning systems and incentives may also need to be adopted to ensure that new generating plants are suffi ciently fl exible to accom-modate expected wind energy deployment. Moreover, in addition to fl exible fossil fuel-powered units, hydropower stations, bulk energy storage, large-scale deployment of electric vehicles and their associated contributions to system fl exibility through controlled battery charging, diverting excess wind energy to fuel production or local heating, and various forms of demand response can also be used to facilitate the inte-gration of wind energy. The deployment of a diversity of RE technologies may also help facilitate overall electric system integration. The role of some of these technologies (as well as some of the operational and planning methods noted earlier) in electric systems is described in more detail in Chapter 8 because they are not all specifi c to wind energy and because some are more likely to be used at higher levels of wind elec-tricity penetration than considered here (up to 20%). Wind power plants, meanwhile, can provide some fl exibility by briefl y curtailing output to provide downward regulation or, in extreme cases, curtailing output for extended periods to provide upward regulation. Modern controls on wind power plants can also use curtailment to limit or even (partially) control ramp rates (Fox et al., 2007). Though curtailing wind power out-put is a simple and often times readily available source of fl exibility, there are sizable opportunity costs associated with curtailing plants that have low operating costs before reducing the output of other plants that have high fuel costs. These opportunity costs should be compared to the possible benefi ts of curtailment (e.g., reduced part-load effi ciency pen-alties and wear and tear for fossil generators, and avoidance of certain transmission investments) when determining the prevalence of its use.
7.5.3.2 Practical experience with operating electric systems with wind energy
Actual operating experience in different parts of the world demon-strates that electric systems can operate reliably with increased contributions of wind energy (Söder et al., 2007). In four countries, as discussed earlier, wind energy in 2010 was already able to supply from 10 to roughly 20% of annual electricity demand. The three examples reported here demonstrate the challenges associated with this opera-tional integration, and the methods used to manage the additional variability and uncertainty associated with wind energy. Naturally, these impacts and management methods vary across regions for rea-sons of geography, electric system design and regulatory structure, and additional examples of wind energy integration associated with operations, curtailment and transmission are described in Chapter 8. Moreover, as more wind energy is deployed in diverse regions and elec-tric systems, additional knowledge about the impacts of wind power output on electric systems will be gained. To date, for example, there is little experience with severe contingencies (i.e., faults) during times with high instantaneous wind electricity penetration. Though existing experience demonstrates that electric systems can operate with wind energy, further analysis is required to determine whether electric sys-tems are maintaining the same level of overall security, measured by the ability of the system to withstand major contingencies, with and without wind energy, and depending on various management options. Limited analysis (e.g., EirGrid and SONI, 2010; Eto et al., 2010) sug-gests that particular systems are able to survive such conditions but, if primary frequency control reserves are reduced as thermal genera-tion is increasingly displaced by wind energy, additional management options may be needed to maintain adequate frequency response. The security of the electric system with high instantaneous wind electricity penetrations is described in more detail in Chapter 8.
Denmark has the highest wind electricity penetration of any country in the world, with wind energy supply equating to approximately 20% of total annual electricity demand. Total wind power capacity installed by the end of 2009 equalled 3.4 GW, while the peak demand in Denmark was 6.5 GW. Much of the wind power capacity (2.7 GW) is located in western Denmark, resulting in instantaneous wind power output exceeding total demand in western Denmark in some instances (see Figure 7.16). The Danish example demonstrates the benefi ts of having access to markets for fl exible resources and having strong transmis-sion interconnections to neighbouring countries. Denmark’s electricity systems operate without serious reliability issues in part because the country is well interconnected to two different electric systems. In con-junction with wind power output forecasting, this allows wind energy to be exported to other markets and helps the Danish operators manage wind power variability. The interconnection with the Nordic system, in particular, provides access to fl exible hydropower resources, and bal-ancing the Danish system is much more diffi cult during periods when
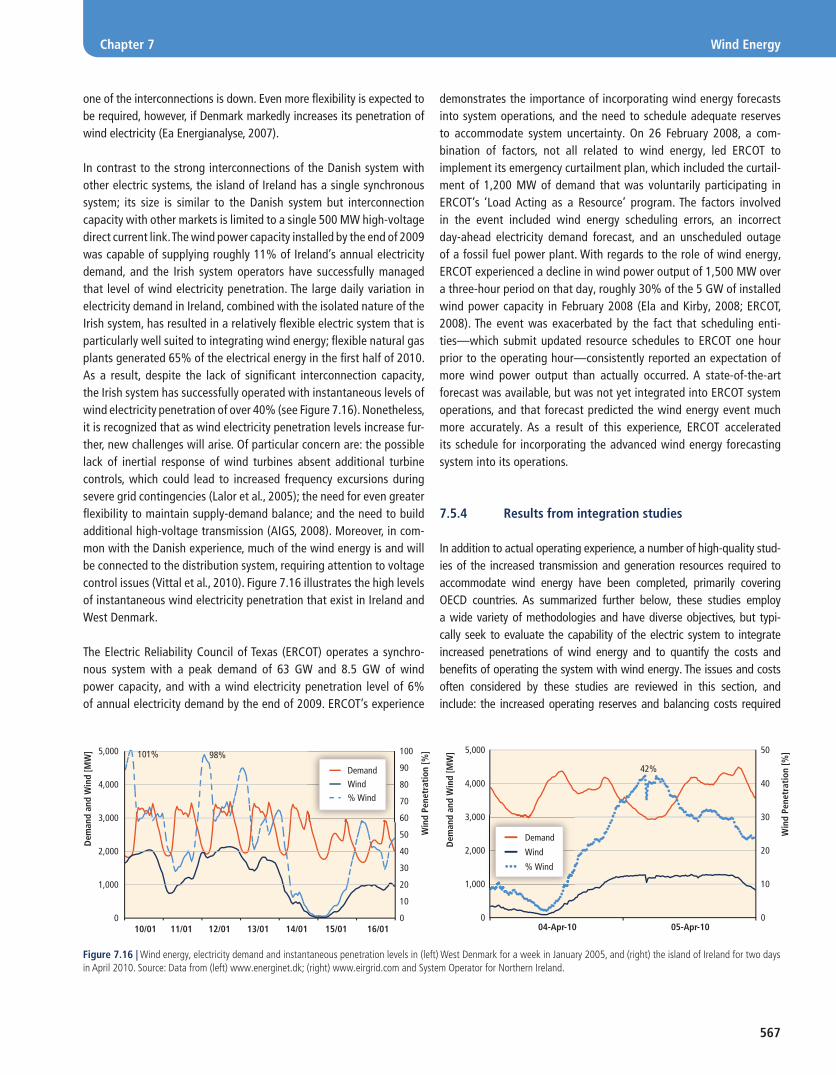
567
Chapter 7 Wind Energy
demonstrates the importance of incorporating wind energy forecasts into system operations, and the need to schedule adequate reserves to accommodate system uncertainty. On 26 February 2008, a com-bination of factors, not all related to wind energy, led ERCOT to implement its emergency curtailment plan, which included the curtail-ment of 1,200 MW of demand that was voluntarily participating in ERCOT’s ‘Load Acting as a Resource’ program. The factors involved in the event included wind energy scheduling errors, an incorrect day-ahead electricity demand forecast, and an unscheduled outage of a fossil fuel power plant. With regards to the role of wind energy, ERCOT experienced a decline in wind power output of 1,500 MW over a three-hour period on that day, roughly 30% of the 5 GW of installed wind power capacity in February 2008 (Ela and Kirby, 2008; ERCOT, 2008). The event was exacerbated by the fact that scheduling enti-ties—which submit updated resource schedules to ERCOT one hour prior to the operating hour—consistently reported an expectation of more wind power output than actually occurred. A state-of-the-art forecast was available, but was not yet integrated into ERCOT system operations, and that forecast predicted the wind energy event much more accurately. As a result of this experience, ERCOT accelerated its schedule for incorporating the advanced wind energy forecasting system into its operations.
7.5.4 Results from integration studies
In addition to actual operating experience, a number of high-quality stud-ies of the increased transmission and generation resources required to accommodate wind energy have been completed, primarily covering OECD countries. As summarized further below, these studies employ a wide variety of methodologies and have diverse objectives, but typi-cally seek to evaluate the capability of the electric system to integrate increased penetrations of wind energy and to quantify the costs and benefi ts of operating the system with wind energy. The issues and costs often considered by these studies are reviewed in this section, and include: the increased operating reserves and balancing costs required
one of the interconnections is down. Even more fl exibility is expected to be required, however, if Denmark markedly increases its penetration of wind electricity (Ea Energianalyse, 2007).
In contrast to the strong interconnections of the Danish system with other electric systems, the island of Ireland has a single synchronous system; its size is similar to the Danish system but interconnection capacity with other markets is limited to a single 500 MW high-voltage direct current link. The wind power capacity installed by the end of 2009 was capable of supplying roughly 11% of Ireland’s annual electricity demand, and the Irish system operators have successfully managed that level of wind electricity penetration. The large daily variation in electricity demand in Ireland, combined with the isolated nature of the Irish system, has resulted in a relatively fl exible electric system that is particularly well suited to integrating wind energy; fl exible natural gas plants generated 65% of the electrical energy in the fi rst half of 2010. As a result, despite the lack of signifi cant interconnection capacity, the Irish system has successfully operated with instantaneous levels of wind electricity penetration of over 40% (see Figure 7.16). Nonetheless, it is recognized that as wind electricity penetration levels increase fur-ther, new challenges will arise. Of particular concern are: the possible lack of inertial response of wind turbines absent additional turbine controls, which could lead to increased frequency excursions during severe grid contingencies (Lalor et al., 2005); the need for even greater fl exibility to maintain supply-demand balance; and the need to build additional high-voltage transmission (AIGS, 2008). Moreover, in com-mon with the Danish experience, much of the wind energy is and will be connected to the distribution system, requiring attention to voltage control issues (Vittal et al., 2010). Figure 7.16 illustrates the high levels of instantaneous wind electricity penetration that exist in Ireland and West Denmark.
The Electric Reliability Council of Texas (ERCOT) operates a synchro-nous system with a peak demand of 63 GW and 8.5 GW of wind power capacity, and with a wind electricity penetration level of 6% of annual electricity demand by the end of 2009. ERCOT’s experience
Dem
and
and
Win
d [M
W]
16/0115/0114/0113/0112/0111/0110/01
101% 98%
Demand
100
90
80
70
60
50
40
30
20
10
0
Win
d Pe
netr
atio
n [%
]5,000
4,000
3,000
2,000
1,000
0
% Wind Wind
Figure 7.16 | Wind energy, electricity demand and instantaneous penetration levels in (left) West Denmark for a week in January 2005, and (right) the island of Ireland for two days in April 2010. Source: Data from (left) www.energinet.dk; (right) www.eirgrid.com and System Operator for Northern Ireland.
Dem
and
and
Win
d [M
W]
05-Apr-1004-Apr-10
42%
Demand
50
40
30
20
10
0
Win
d Pe
netr
atio
n [%
] 5,000
4,000
3,000
2,000
1,000
0
% Wind
Wind

568
Wind Energy Chapter 7
to accommodate the variability and uncertainty in net demand caused by wind energy; the requirement to maintain suffi cient generation adequacy; and the possible need for additional transmission infrastructure. The stud-ies also frequently analyze the benefi ts of adding wind energy, including avoided fossil fuel consumption and CO2 emissions, though these ben-efi ts are not reviewed in this section. This section focuses on the general results of these studies as a whole; see Chapter 8 for brief descriptions of individual study results, including some studies that have investigated somewhat higher levels of wind electricity penetration than considered here.
7.5.4.1 Methodological challenges
Estimating the incremental impacts and costs of wind energy integra-tion is diffi cult due to the complexity of electric systems and study data requirements. One of the most signifi cant challenges in executing these studies is simulating wind power output data at high time resolutions for a chosen future wind electricity penetration level and for a suffi cient duration for the results of the analysis to accurately depict worst-case conditions and correlations of wind and electricity demand. These data are then used in electric system simulations to mimic system planning and operations, thereby quantifying the impacts, costs and benefi ts of wind energy integration.
Addressing all integration impacts requires several different simula-tion models that operate over different time scales, and most individual studies therefore focus on a subset of the potential issues. The results of wind energy integration studies are also dependent on pre-existing differences in electric system designs and regulatory environments: important differences include generation capacity mix and the fl ex-ibility of that generation, the variability of demand and the strength and breadth of the transmission system. In addition, study results differ and are hard to compare because standard methodologies and even defi nitions have not been developed, though signifi cant progress has been made in developing agreement on many high-level study design principles (Holttinen et al., 2009). The fi rst-generation integration stud-ies, for example, used models that were not designed to fully refl ect the variability and uncertainty of wind energy, resulting in studies that addressed only parts of the larger system. More recent studies, on the other hand, have used models that can incorporate the uncertainty of wind power output from the day-ahead time scale to some hours ahead of delivery (e.g., Meibom et al., 2009; Tuohy et al., 2009). Integration studies are also increasingly simulating high wind electricity penetration scenarios over entire synchronized systems (not just individual, smaller balancing areas) (e.g., Tradewind, 2009; EnerNex Corp, 2010; GE Energy, 2010). Finally, only recently have studies begun to explore in more depth the capability of electric systems to maintain primary frequency con-trol during system contingencies with high penetrations of wind energy (e.g., EirGrid and SONI, 2010; Eto et al., 2010).
Regardless of the challenges of executing and comparing such studies, the results, as described in more detail below, demonstrate that the cost of
integrating up to 20% wind energy into electric systems is, in most cases, modest but not insignifi cant. Specifi cally, at low to medium levels of wind electricity penetration (up to 20% wind energy), the available literature (again, primarily from a subset of OECD countries) suggests that the additional costs of managing electric system variability and uncertainty, ensuring generation adequacy and adding new transmission to accom-modate wind energy will be system specifi c but generally in the range of US cents2005 0.7 to 3/kWh.26 Concerns about (and the costs of) wind energy integration will grow with wind energy deployment and, even at lower penetration levels, integration issues must be actively managed.
7.5.4.2 Increased balancing cost with wind energy
The additional variability and uncertainty in net demand caused by increased wind energy supply results in higher balancing costs, in part due to increases in the amount of short-term reserves procured by sys-tem operators. A number of signifi cant integration studies from Europe and the USA have concluded that accommodating wind electricity pen-etrations of up to (and in a limited number of cases, exceeding) 20% is technically feasible, but not without challenges (R. Gross et al., 2007; J. Smith et al., 2007; Holttinen et al., 2009; Milligan et al., 2009). The estimated increase in short-term reserve requirements in eight stud-ies summarized by Holttinen et al. (2009) has a range of 1 to 15% of installed wind power capacity at 10% wind electricity penetration, and 4 to 18% of installed wind power capacity at 20% wind electric-ity penetration. Those studies that predict a need for higher levels of reserves generally assume that day-ahead uncertainty and/or multi-hour variability of wind power output is handled with short-term reserves. In contrast, markets that are optimized for wind energy will generally be designed so that additional opportunities to balance supply and demand exist, reducing the reliance on more expensive short-term reserves (e.g., Weber, 2010). Notwithstanding the differences in results and methods, however, the studies reviewed by Holttinen et al. (2009) fi nd that, in general, wind electricity penetrations of up to 20% can be accommodated with increased balancing costs of roughly US cents 0.14 to 0.56/kWh27 of wind energy generated (Figure 7.17). State-of-the-art wind energy forecasts are often found to be a key factor in minimizing the impact of wind energy on market operations. Although defi nitions and methodologies for calculating increased balancing costs differ, and several open issues remain in estimating these costs, similar results are reported by R. Gross et al. (2007), J. Smith et al. (2007), and Milligan et al. (2009).
26 This cost range is based on the assumption that there may be electric systems where all three cost components (balancing costs, generation adequacy costs and transmis-sion costs) are simultaneously at the low end of the range reported for each of these costs in the literature or conversely where all three cost components are simultane-ously at the high end of the range. As reported below, the cost range for managing wind energy’s variability and uncertainty (US cents2005 0.14 to 0.56/kWh), ensuring generation adequacy (US cents2005 0.58 to 0.96/kWh), and adding new transmission (US cents2005 0 to 1.5/kWh) sums to roughly US cents2005 0.7 to 3/kWh. Using a somewhat similar approach, IEA (2010b) developed estimates that are also broadly within this range.
27 Conversion to 2005 dollars is not possible given the range of study-specifi c assumptions.

569
Chapter 7 Wind Energy
7.5.4.3 Relative cost of generation adequacy with wind energy
The benefi ts of adding a wind power plant to an electric system are often compared to the benefi ts of a base-load, or fully utilized, plant that generates an equivalent amount of energy on an annual basis (a com-parator plant). The comparator plant is typically assumed to have a high capacity credit, close to 100% of its nameplate capacity. Wind energy, on the other hand, was shown in Section 7.5.2.4 to have a capacity credit of 5 to 40% of its nameplate capacity. The resulting contribution of the wind plant to generation adequacy is therefore often lower than the contribution of an energy-equivalent comparator plant per unit of energy generated, and wind energy is typically less valuable than the comparator plant from the perspective of meeting generation adequacy targets. Using this framework, R. Gross et al. (2007) estimate that the difference between the contribution to generation adequacy of a wind power plant and an energy-equivalent base-load plant can result in a US cents2005 0.58 to 0.96/kWh generation adequacy cost for wind energy relative to a comparator plant at wind electricity penetration levels up to
20%. Using a somewhat different approach, Boccard (2010) provides a comparable estimate of the generation adequacy cost of wind energy in several European countries. As discussed earlier, the methodology used to assess generation adequacy, the correlation of wind power output
to electricity demand, the geographic distribution of wind power plant siting and the level of wind electricity penetration will all impact the capacity credit estimated for wind energy, and therefore the relative cost of generation adequacy.
7.5.4.4 Cost of transmission for wind energy
Finally, a number of assessments of the need for and cost of upgrad-ing or building large-scale transmission infrastructure between wind resource regions and demand centres have similarly found modest, but not insignifi cant, costs.28 The transmission cost for achieving 20% wind electricity penetration in the USA, for example, was estimated to add about USD2005 150 to 290/kW to the investment cost of wind power plants (US DOE, 2008). The cost of this transmission expansion was found to be justifi ed because of the higher quality of the wind resources accessed if the transmission were to be built relative to accessing only lower-quality wind resources with less transmission expansion. More
28 These costs are distinct from the costs to connect individual wind power plants to the transmission system; connection costs are often included in estimates of the invest-ment costs of wind power plants (see Section 7.8).
Incr
ease
in B
alan
cing
Cos
t [U
Scen
t/kW
h W
ind]
0.0
Wind Electricity Penetration [% of Annual Electricity Demand]
0 5 10 15 20 25 30
0,1
0.2
0.3
0.4
0.5
0.6
Nordic 2004
Finland 2004
UK, 2002
UK, 2007
Ireland
Colorado US
Minnesota 2004
Minnesota 2006
California US
Pacificorp US
Greennet Germany
Greennet Denmark
Greennet Finland
Greennet Norway
Greennet Sweden
Figure 7.17 | Estimates of the increase in balancing costs due to wind energy from several wind energy integration studies in Europe and the USA (Holttinen et al., 2009).1
Note: 1. Conversion to 2005 dollars is not possible given the range of study-specifi c assumptions.

570
Wind Energy Chapter 7
detailed assessments of the transmission needed to accommodate increased wind energy deployment in the USA have found a wide range of results, with estimated costs ranging from very low to sometimes reaching (or even exceeding) USD2005 400/kW (JCSP, 2009; Mills et al., 2009a; EnerNex Corp, 2010). Large-scale transmission for cases with increased wind energy has also been considered in Europe (Czisch and Giebel, 2000) and China (Lew et al., 1998). Results from country-specifi c transmission assessments in Europe have resulted in varied estimates of the cost of new large-scale transmission; Auer et al. (2004) and EWEA (2005) identifi ed transmission costs for a number of European studies, with cost estimates that are somewhat lower than those found in the USA. Holttinen et al. (2009) reviewed wind energy transmission costs from several European national case studies, and found costs ranging from USD2005 0/kW to as high as USD2005 310/kW.
Transmission expansion for wind energy can be justifi ed by the reduc-tion in congestion costs that would occur for the same level of wind energy deployment without transmission expansion. A European-wide study, for example, identifi ed several transmission upgrades between nations and between high-quality offshore wind resource areas that would reduce transmission congestion and ease wind energy integra-tion (Tradewind, 2009). The avoided congestion costs associated with transmission expansion were similarly found to justify transmission investments in two US-based detailed integration studies of high wind electricity penetrations (Milligan et al., 2009). At the same time, it is not always appropriate to fully assign the cost of transmission expansion to wind energy deployment. In some cases, these transmission expansion costs can be justifi ed for reasons beyond wind energy, as new transmis-sion can have wider benefi ts including increased electricity reliability, decreased pre-existing congestion and reduced market power (Budhraja et al., 2009). Moreover, wind energy is not unique in potentially requir-ing new transmission investment; other energy technologies may also require new transmission, and the costs summarized above do not all represent truly incremental costs.
Notwithstanding these important caveats, at the higher end of the range from the available literature (USD2005 400/kW), transmission expansion costs add roughly US cents2005 1.5/kWh to the levelized cost of wind energy. At the lower end, effectively no new transmission costs would need to be specifi cally assigned to the support of wind energy.
7.6 Environmental and social impacts29
Wind energy has signifi cant potential to reduce (and already is reducing) GHG emissions, together with the emissions of other air pollutants, by displacing fossil fuel-based electricity generation. Because of the com-mercial readiness (Section 7.3) and cost (Section 7.8) of the technology, wind energy can be immediately deployed on a large scale (Section 7.9). As with other industrial activities, however, wind energy also has the
29 A comprehensive assessment of social and environmental impacts of all RE sources covered in this report can be found in Chapter 9.
potential to produce some detrimental impacts on the environment and on human activities and well-being, and many local and national gov-ernments have established planning, permitting and siting requirements to reduce those impacts. These potential concerns need to be taken into account to ensure a balanced view of the advantages and disadvantages of wind energy, especially if wind energy is to expand on a large scale.
This section summarizes the best available knowledge about the most relevant environmental net benefi ts of wind energy (Section 7.6.1), while also addressing ecological impacts (Section 7.6.2), impacts on human activities and well-being (Section 7.6.3), public attitudes and acceptance (Section 7.6.4) and processes for minimizing social and envi-ronmental concerns (Section 7.6.5).
7.6.1 Environmental net benefi ts of wind energy
The environmental benefi ts of wind energy come primarily from displac-ing the emissions from fossil fuel-based electricity generation. However, the manufacturing, transport, installation, operation and decommission-ing of wind turbines induces some indirect negative effects, and the variability of wind power output also impacts the operations and emis-sions of fossil fuel-fi red plants. Such effects need to be subtracted from the gross benefi ts of wind energy in order to estimate net benefi ts. As shown below, these latter effects are modest compared to the net GHG reduction benefi ts of wind energy.
7.6.1.1 Direct impacts
The major environmental benefi ts of wind energy (as well as other forms of RE) result from displacing electricity generation from fossil fuel-based power plants, as the operation of wind turbines does not directly emit GHGs or other air pollutants. Similarly, unlike some other generation sources, wind energy requires insignifi cant amounts of water, produces little waste and requires no mining or drilling to obtain its fuel supply (see Chapter 9).
Estimating the environmental benefi ts of wind energy is somewhat complicated by the operational characteristics of the electric system and the decisions that are made about investments in new power plants to economically meet electricity demand (Deutsche Energie-Agentur, 2005; NRC, 2007; Pehnt et al., 2008). In the short run, increased wind energy will typically displace the operations of existing fossil fuel-based plants that are otherwise on the margin. In the longer term, however, new generating plants may be needed, and the presence of wind energy can infl uence what types of power plants are built; specifi cally, increased wind energy will tend to favour on economic grounds fl exible peaking/intermediate plants that operate less frequently over base-load plants (Kahn, 1979; Lamont, 2008). Because the impacts of these factors are both complicated and system specifi c, the benefi ts of wind energy will also be system specifi c and are diffi cult to forecast with precision.

571
Chapter 7 Wind Energy
Nonetheless, it is clear that the direct impact of wind energy is to reduce air pollutants and GHG emissions. Depending on the characteristics of the electric system into which wind energy is integrated and the amount of wind energy supply, the reduction of air pollution and GHG emissions may be substantial. Globally, it has been estimated that the roughly 160 GW of wind power capacity already installed by the end of 2009 could generate 340 TWh/yr (1.2 EJ/yr) of electricity and save more than 0.2 Gt CO2/yr (GWEC, 2010b).30
7.6.1.2 Indirect lifecycle impacts
Some indirect environmental impacts of wind energy arise from the manufacturing, transport, installation and operation of wind turbines, and their subsequent decommissioning. Life-cycle assessment (LCA) procedures based on ISO 14040 and ISO 14044 standards (ISO, 2006) have been used to analyze these impacts. Though these studies may include a range of environmental impact categories, LCA studies for wind energy have often been used to determine the lifecycle GHG emis-sions per unit of wind electricity generated (allowing for full fuel-cycle comparisons with other forms of electricity production). The results of a comprehensive review of LCA studies published since 1980 are sum-marized in Figure 7.18.
Figure 7.18 shows that the majority of lifecycle GHG emission estimates cluster between about 8 and 20 g CO2eq/kWh, with some estimates reaching 80 g CO2eq/kWh.31 Where studies have identifi ed the signifi -cance of different stages of the lifecycle of a wind power plant, it is clear that emissions from the manufacturing stage dominate overall lifecycle GHG emissions (e.g., Jungbluth et al., 2005). Variability in estimates stems from differences in study context (e.g., wind resource, techno-logical vintage), technological performance (e.g., capacity factor) and methods (e.g., LCA system boundaries).32
In addition to lifecycle GHG emissions, many of these studies also report on the energy payback time of wind power plants (i.e., the amount of time a wind power plant must operate in order produce an equivalent amount of energy that was required to build, operate and decommission it). Among 50 estimates from 20 studies passing screens for quality and relevance, the median reported energy payback time for wind power plants is 5.4 months, with a 25th to 75th percentile range of 3.4 months to 8.5 months (see also Chapter 9).
30 This calculation assumes that wind energy, on average, offsets fossil generation with an emissions factor reasonably similar to natural gas, and that wind power plants have an average capacity factor of roughly 24%.
31 Note that the distributions shown in Figure 7.18 do not represent an assessment of likelihood; the fi gure simply reports the distribution of currently published literature estimates passing screens for quality and relevance. See Annex II.5.2 for a further description of the literature search methods.
32 Efforts to harmonize the methods and assumptions of these studies are recommended such that more robust estimates of central tendency and variability can be realized. Further LCA studies to increase the number of estimates for some technologies (e.g., fl oating offshore wind turbines) would also be benefi cial.
The lifecycle impacts of wind energy in comparison to other energy tech-nologies are covered in Chapter 9, including not just GHG emissions and energy payback, but also local air pollutants, water consumption, land use and other impact categories.
7.6.1.3 Indirect variability impacts
Another concern that is sometimes raised is that the temporal variabil-ity and limited predictability of wind energy will limit the GHG emissions benefi ts of wind energy by increasing the short-term balancing reserves required for an electric system operator to maintain reliability (relative to the balancing reserve requirement without wind energy). Short-term reserves are generally provided by generating plants that are online and synchronized with the grid, and plants providing these reserves may be part-loaded to maintain the fl exibility to respond to short-term fl uctua-tions. Part-loading fossil fuel-based generators decreases the effi ciency of the plants and therefore creates a fuel effi ciency and GHG emissions penalty relative to a fully loaded plant. Analyses of the emissions benefi ts of wind energy do not always account for this effect.
Figure 7.18 | Lifecycle GHG emissions of wind energy technologies (unmodifi ed lit-erature values, after quality screen). ‘Offshore’ represents relatively shallow offshore installations except for one fl oating offshore estimate. See Annex II.5.2 for details about the literature search and the literature citations contributing to the estimates displayed.
Maximum
75th Percentile
Median
25th Percentile
Minimum
0
10
20
30
40
50
60
70
80
90
Life
cycl
e G
HG
Em
issi
ons
[g C
O2 eq
/kW
h]
References:
Estimates: 126
49
107
44
16
12
Onshore All Values Offshore

572
Wind Energy Chapter 7
R. Gross et al. (2007) performed an extensive literature review of the costs and impacts of variable electricity supply; over 200 reports and articles were reviewed. The review included a number of analyses of the fuel sav-ings and GHG emissions benefi ts33 of wind energy that accounted for the increase in necessary balancing reserves and the reduction in part-load effi ciency of fossil fuel-powered plants. The effi ciency penalty due to the variability of wind power output in four studies that explicitly addressed the issue ranged from near 0% to as much as 7%, for up to 20% wind electricity penetration (R. Gross et al., 2006). Pehnt et al. (2008) calcu-lated an emission penalty of 3 to 8% for a wind electricity penetration of 12%, with the range refl ecting varying types of other power plants built in future years.34 In short, at low to medium levels of wind electric-ity penetration, “there is no evidence available to date to suggest that in aggregate effi ciency reductions due to load following amount to more than a few percentage points” (Gross and Heptonstall, 2008).35
7.6.1.4 Net environmental benefi ts
The precise balance of positive and negative environmental and health effects of wind energy is system specifi c, but can in general be docu-mented by the difference in estimated external costs for wind energy and other electricity supply options (see Chapter 10). Monetized fi gures for climate change damages, human health impacts, material damages and agricultural losses show signifi cant benefi ts from wind energy (e.g., Krewitt and Schlomann, 2006). Krewitt and Schlomann (2006) also qualitatively assess the direction of possible impacts associated with other damage categories (ecosystem effects, large accidents, security of supply and geopolitical effects), fi nding that the net benefi ts of RE sources tend to be underestimated by not including these impacts in the monetized results. The environmental damages associated with other forms of electricity generation and benefi ts associated with wind energy have been summarized many times in the broader externalities litera-ture (e.g., EC, 2003; Owen, 2004; Sundqvist, 2004; NRC, 2010a), and are highlighted in Chapters 9 and 10.
7.6.2 Ecological impacts
There are, nonetheless, ecological impacts that need to be taken into account when assessing wind energy. Potential ecological impacts of
33 Because GHG emissions are generally proportional to fuel consumption for a single fossil fuel-fi red plant, the GHG emissions penalty is similar to the fuel effi ciency penalty.
34 Accounting for only the start-up and minimum load requirements of fossil generators (but not including the part-load effi ciency penalty), Göransson and Johnsson (2009) estimate an emission penalty of 5%.
35 Katzenstein and Apt (2009) conclude that the effi ciency penalty could be as high as 20%, but inaccurately assume that every wind power plant requires spinning reserves equivalent to the nameplate capacity of the wind plant. Accounting for the smoothing benefi ts of geographic diversity (see Section 7.5) and the ability to commit and de-commit thermal plants lowers the estimated effi ciency penalty substantially (Mills et al., 2009b).
concern for onshore wind power plants include the population-level con-sequences of bird and bat collision fatalities and more indirect habitat and ecosystem modifi cations. For offshore wind energy, the aforemen-tioned impacts as well as implications for benthic resources, fi sheries and marine life more generally must be considered. Finally, the possible impacts of wind energy on the local climate have received attention. The focus here is on impacts associated with wind power plants them-selves, but associated infrastructure also has impacts to consider (e.g., transmission lines, transportation to site etc.). In addition, though more systematic assessments are needed to evaluate the relative impacts of different forms of energy supply, especially within the context of the varying contributions of these energy sources towards global climate change, those comparisons are not provided here but are instead dis-cussed in Chapter 9.
7.6.2.1 Bird and bat collision fatalities
Bird and bat fatalities through collisions with wind turbines are among the most publicized environmental concerns associated with wind power plants. Populations of many species of birds and bats are in decline, leading to concerns about the effects of wind energy on vulner-able species.
Though much remains unknown about the nature and population-level implications of these impacts, avian fatality rates are power plant- and species-specifi c, and can vary with region, site characteristics, season, weather, turbine size, height and design, and other factors. Focusing on all bird species combined, the US National Research Council (NRC) sur-veyed the available (limited) literature through early 2007 and found bird mortality estimates that range from 0.95 to 11.67/MW/yr (NRC, 2007); other results, including those from Europe, provide a reason-ably similar range of estimates (e.g., De Lucas et al., 2004; Drewitt and Langston, 2006; Everaert and Stienen, 2007; Kuvlesky et al., 2007). Though most of the bird fatalities reported in the literature are of songbirds (Passeriformes), which are the most abundant bird group in terrestrial ecosystems (e.g., Erickson et al., 2005; NRC, 2007), raptor fatalities are considered to be of greater concern as their populations tend to be relatively small. Compared to songbird fatalities, raptor fatali-ties have been found to be relatively low; nonetheless, these impacts are site specifi c, and there are cases in which raptor fatalities (and the potential for population-level effects) have raised concerns (e.g., Barrios and Rodriguez, 2004; Kuvlesky et al., 2007; NRC, 2007; Smallwood and Thelander, 2008). As offshore wind energy has increased, concerns have also been raised about seabirds (e.g., Garthe and Hüppop, 2004). More research is needed and impacts will again be species specifi c (Desholm, 2009), but the limited research to date does not suggest that offshore plants pose a disproportionately large risk to birds relative to onshore wind energy (e.g., Dong Energy et al., 2006); Desholm and Kahlert (2005), for example, fi nd that seabirds tend to detect and avoid large offshore wind power plants.

573
Chapter 7 Wind Energy
Bat fatalities have not been researched as extensively as bird fatalities at wind power plants, and data allowing reliable assessments of bat fatalities are somewhat limited (Dürr and Bach, 2004; Kunz et al., 2007b; NRC, 2007; Cryan and Barclay, 2009). Several wind power plants have reported sizable numbers of bat fatalities, but other studies have shown low fatality rates. Surveying the available literature through early 2007, the NRC (2007) reported observed bat fatalities ranging from 0.8 to 41.1 bats per MW per year; a later review of 21 studies by Arnett et al. (2008) found fatality rates of 0.2 to 53.3 bats per MW per year. The specifi c role of different infl uences such as site characteristics, weather conditions, and turbine size, placement and operation remain somewhat uncertain due to the lack of extensive and comparable studies (e.g., Kunz et al., 2007b; Arnett et al., 2008). The impact of wind power plants on bat populations is of particular contemporary concern, because bats are long-lived and have low reproduction rates, because of the patterns of bat mortality at wind power plants (e.g., research has shown that bats may be attracted to wind turbine rotors), and because of uncertainty about the current size of bat populations (e.g., Barclay et al., 2007; Horn et al., 2008).
Signifi cant uncertainty remains about the causal mechanisms underly-ing fatality rates and the effectiveness of mitigation measures, leading to limited ability to predict bird and bat fatality rates. Nonetheless, pos-sible approaches to reducing fatalities that have been reported include siting power plants in areas with lower bird and bat population densi-ties, placing turbines in areas with low prey density, and using different numbers, types and sizes of turbines. Recent research also suggests that limiting the operation of wind turbines during low wind situations may result in considerable reductions in bat fatalities (Baerwald et al., 2009; Arnett et al., 2011).
The magnitude and population-level consequences of bird and bat collision fatalities can also be viewed in the context of other fatalities caused by human activities. The number of bird fatalities at existing wind power plants appears to be orders of magnitude lower than other anthropogenic causes of bird deaths (e.g., vehicles, buildings and win-dows, transmission lines, communications towers, house cats, pollution and other contaminants) (Erickson et al., 2005; NRC, 2007). Moreover, it has been suggested that onshore wind power plants are not currently causing meaningful declines in bird population levels (NRC, 2007), and that other energy supply options also impact birds and bats through collisions, habitat modifi cations and contributions to global climate change (Lilley and Firestone, 2008; Sovacool, 2009; NABCI, 2010). These assessments are based on aggregate comparisons, however, and the cumulative population-level impacts of wind energy development on some species where biologically signifi cant impacts are possible remain uncertain (especially vis-à-vis bats). Improved methods to assess these population-level impacts and their possible mitigation are needed (Kunz et al., 2007a), as are robust comparisons between the impacts of wind energy and other electricity supply options.
7.6.2.2 Habitat and ecosystem modifi cations
The habitat and ecosystem modifi cation impacts of wind power plants on fl ora and fauna include, but are not limited to, avoidance of or displace-ment from an area, habitat destruction and reduced reproduction (e.g., Drewitt and Langston, 2006; NRC, 2007; Stewart et al., 2007). The relative biological signifi cance of these impacts, compared to bird and bat colli-sion fatalities, remains unclear. Moreover, the nature of these impacts will depend in part on the ecosystem into which wind power plants are inte-grated. Wind power plants are often installed in agricultural landscapes or on brown-fi eld sites. In such cases, very different habitat and ecosys-tem impacts might be expected compared to wind power plants that are sited on previously undisturbed forested ridges or native grasslands. The development of wind power plants in largely undisturbed forests may, for example, lead to additional habitat destruction and fragmentation for intact forest-dependent species due to forest clearing for access roads, turbine foundations and power lines (e.g., Kuvlesky et al., 2007; NRC, 2007). Because habitat modifi cation impacts are highly site and species specifi c (and affected by whether the wind power plant is located on- or offshore), they are ideally addressed (with mitigation measures) in the sit-ing process; concerns for these impacts have also led to broader planning ordinances in some countries prohibiting the construction of wind power plants in ecologically sensitive areas.
The impacts of wind power plants on marine life have moved into focus as wind energy development starts to occur offshore and, as part of the licensing procedures for offshore wind power plants, a number of studies on the possible impacts of wind power plants on marine life and eco-systems have been conducted. As Michel et al. (2007) point out, there are “several excellent reviews...on the potential impacts of offshore wind parks on marine resources; most are based on environmental impact assessments and monitoring programs of existing offshore wind parks in Europe…”. The localized impacts of offshore wind energy on marine life vary between the installation, operation and decommissioning phases, depend greatly on site-specifi c conditions, and may be negative or posi-tive (e.g., Wahlberg and Westerberg, 2005; Dong Energy et al., 2006; Köller et al., 2006; P. Madsen et al., 2006; Michel et al., 2007; Wilhelmsson and Malm, 2008; Punt et al., 2009; Tougaard et al., 2009; Wilson and Elliott, 2009; Kikuchi, 2010). Potential negative impacts include underwater sounds and vibrations (especially during construction), electromagnetic fi elds, physical disruption and the establishment of invasive species. The physical structures may, however, create new breeding grounds or shelters and act as artifi cial reefs or fi sh aggregation devices (e.g., Wilhelmsson et al., 2006). Additional research is warranted on these impacts and their long-term and population-level consequences, especially in comparison to other sources of energy supply, but the impacts do not appear to be disproportionately large. In advance of conclusive fi ndings, however, con-cerns about the impacts of offshore wind energy on marine life (and bird populations) have led to national zoning efforts in some countries that exclude the most sensitive areas from development.

574
Wind Energy Chapter 7
7.6.2.3 Impact of wind power plants on the local climate
The possible impact of wind power plants on the local climate has also been the focus of some research. Wind power plants extract momen-tum from the air fl ow and thus reduce the wind speed behind the turbines, and also increase vertical mixing by introducing turbulence across a range of length scales (Petersen et al., 1998; Baidya Roy and Traiteur, 2010). These two processes are described by the term ‘wind turbine wake (Barthelmie et al., 2004). Though intuitively turbine wakes must increase vertical mixing of the near-surface layer, and thus may increase the atmosphere-surface exchange of heat, water vapour and other parameters, the magnitude of the effect remains uncertain. One study using blade element momentum theory suggests that even very large-scale wind energy deployment, suffi cient to supply global energy needs, would remove less than 1/10,000th of the total energy within the lowest 1 km of the atmosphere (Sta. Maria and Jacobson, 2009). Other studies have sought to quantify more local effects by treating large wind power plants as a block of enhanced surface roughness length or an elevated momentum sink in regional and global models. These studies have typically modelled scenarios of substantial wind energy deployment, and have found changes in local surface temperature of up to or even exceeding 1°C and in surface winds of several metres per second over (and even extending beyond) the areas of wind power plant installation (Keith et al., 2004; Kirk-Davidoff and Keith, 2008; C. Wang and Prinn, 2010); these local effects could also impact rainfall, radiation, clouds, wind direction and other climate variables. Though the global average impact of these local changes is much less pro-nounced, the local changes could have implications for ecosystems and human activities.
The assumptions and methods used by these studies may not, however, accurately represent the mechanisms by which wind turbines interact with the atmosphere. Studies often incorrectly assume that wind tur-bines act as invariant momentum sinks,36 that turbine densities are above what is the norm, and that wind energy deployment occurs at a more substantial and geographically concentrated scale than is likely. Observed data from and models of large offshore wind power plants, for example, indicate that they may be of suffi cient scale to perceptibly interact with the entire (relatively shallow) atmospheric boundary layer (Frandsen et al., 2006), but onsite measurements and remotely sensed near-surface wind speeds suggest that wake effects from large develop-ments may no longer be discernible in near-surface wind speeds and turbulence intensity at approximately 20 km downwind (Christiansen and Hasager, 2005, 2006; Frandsen et al., 2009). As a result, the impact of wind energy on local climates remains uncertain. More generally, it should also be recognized that wind turbines are not the only struc-tures to potentially impact local climate variables, and that any impacts caused by increased wind energy deployment should be placed in the context of other anthropogenic climate infl uences (Sta. Maria and Jacobson, 2009).
36 In these instances, the aerodynamic effect of wind turbines is treated via an increase in assumed surface roughness, in effect assuming that the turbines are operating all of the time to decrease wind speeds.
7.6.3 Impacts on human activities and well-being
In addition to ecological consequences, wind energy development impacts human activities and well-being in various ways. The primary impacts addressed here include: land and marine usage; visual impacts; proximal ‘nuisance’ impacts that might occur in close range to the tur-bines such as noise, fl icker, health and safety; and property value impacts.
7.6.3.1 Land and marine usage
Wind turbines are sizable structures, and wind power plants can encom-pass a large area (5 to 10 MW per km2 is often assumed), thereby using space that might otherwise be used for other purposes.37 The land footprint specifi cally disturbed by onshore wind turbines and their sup-porting roads and infrastructure, however, typically ranges from 2 to 5% of the total area encompassed by a wind power plant, allowing agriculture, ranching and certain other activities to continue within the area. Some forms of land use may be precluded from the area, such as housing developments, airport approaches and some radar installa-tions. Nature reserves and historical and/or sacred sites are also often particularly sensitive. Somewhat similar issues apply to offshore wind power plants.
The possible impacts of wind power plants on aviation, shipping, fi sh-ing, communications and radar must also be considered, and depend on the placement of wind turbines and power plants. By avoiding airplane landing corridors and shipping routes, the interference of wind power plants with shipping and aviation can be kept to a minimum (Hohmeyer et al., 2005). Integrated marine spatial planning and integrated coastal zone management approaches are also starting to include offshore wind energy, thereby helping to assess the ecological impacts and economic and social benefi ts for coastal regions from alternative marine and coastal uses, and to minimize confl ict among those uses (e.g., Murawski, 2007; Ehler and Douvere, 2009; Kannen and Burkhard, 2009).
Electromagnetic interference (EMI) associated with wind turbines can take various forms (e.g., Krug and Lewke, 2009). In general, wind turbines can interfere with detection of signals through refl ection and blockage of electromagnetic waves and creation of large refl ected radar returns, including Doppler produced by the rotation of turbine blades. Many EMI effects can be avoided by appropriate siting, for example, not locating wind turbines in close proximity to transmitters or receivers or relying on landscape terrain to mask the turbines (Summers, 2000; Hohmeyer et al., 2005). Moreover, there are no fundamental physical constraints preventing mitigation of EMI impacts (Brenner et al., 2008). In the case of military (or civilian) radar, reports have concluded that radar systems can sometimes be modifi ed to ensure that aircraft safety and national defence are maintained (Butler and Johnson, 2003; Brenner et al., 2008). In particular, radar systems may have to be replaced or upgraded, or gap-fi lling and signal fusion systems installed, at some cost. In addition,
37 Chapter 9 addresses relative land use associated with multiple energy sources.

575
Chapter 7 Wind Energy
research is underway to investigate wind turbine design changes that may mitigate adverse impacts by making turbines less refl ective to radar systems. EMI impacts can also extend to television, global positioning systems and communications systems, however, where they exist, these impacts can generally be managed by appropriate siting of wind power plants and through technical solutions.
7.6.3.2 Visual impacts
Visual impacts, and specifi cally how wind turbines and related infra-structures fi t into the surrounding landscape, are often among the top concerns of communities considering wind power plants (Firestone and Kempton, 2007; NRC, 2007; Wolsink, 2007; Wustenhagen et al., 2007; Firestone et al., 2009; Jones and Eiser, 2009), of those living near exist-ing wind power plants (Thayer and Hansen, 1988; Krohn and Damborg, 1999; Warren et al., 2005) and of institutions responsible for overseeing wind energy development (Nadaï and Labussière, 2009). Concerns have been expressed for on- and offshore wind energy (Ladenburg, 2009; Haggett, 2011). To capture the strongest and most consistent winds, wind turbines are often sited at high elevations and where there are few obstructions relative to the surrounding area. Moreover, wind turbines and power plants have grown in size, making the turbines and related transmission infrastructure more visible. Finally, as wind power plants increase in number and geographic spread, plants are being located in a wider diversity of landscapes (and, with offshore wind energy, unique seascapes as well), including areas that are more highly valued.
Though concerns about visibility cannot be fully mitigated, many jurisdictions require an assessment of visual impacts as part of the siting process, including defi ning the geographic scope of impact and preparing photo and video montages depicting the area before and after wind energy development. Other recommendations that have emerged to minimize visual intrusion include using turbines of similar size and shape, using light-coloured paints, choosing a smaller number of larger turbines over a larger number of smaller ones, burying con-nection cabling and ensuring that blades rotate in the same direction (e.g., Hohmeyer et al., 2005). More generally, a rethinking of traditional concepts of ‘landscape’ to include wind turbines has sometimes been recommended (Pasqualetti et al., 2002) including, for example, setting aside areas in advance where development can occur and others where it is precluded, especially when such planning allows for public involve-ment (Nadaï and Labussière, 2009).
7.6.3.3 Noise, fl icker, health and safety
A variety of proximal ‘nuisance’ effects are also sometimes raised with respect to wind energy development, the most prominent of which is noise. Noise from wind turbines can be a problem, especially for those living within close range. Possible impacts can be characterized as both audible and sub-audible (i.e., infrasound). There are claims that sub-audible sound, that is, below the nominal audible frequency
range, may cause health effects (Alves-Pereira and Branco, 2007), but a variety of studies (Jakobsen, 2005; Leventhall, 2006) and govern-ment reports (e.g., FANM, 2005; MDOH, 2009; CMOH, 2010; NHMRC, 2010) have not found suffi cient evidence to support those claims to this point. Regarding audible noise from turbines, environmental noise guidelines (EPA, 1974, 1978; WHO, 1999, 2009) are generally believed to be suffi cient to ensure that direct physiological health effects (e.g., hearing loss) are avoided (McCunney and Meyer, 2007). Some nearby residents, however, do experience annoyance from wind turbine sound (Pedersen and Waye, 2007, 2008; Pedersen et al., 2010), which can impact sleep patterns and well-being. This annoyance is correlated with acoustic factors (e.g., sound levels and characteristics) and also with non-acoustic factors (e.g., visibility of, or attitudes towards, the turbines) (Pedersen and Waye, 2007, 2008; Pedersen et al., 2010). Concerns about noise emissions may be especially great when hub-height wind speeds are high, but ground-level speeds are low (i.e., conditions of high wind shear). Under such conditions, the lack of wind-induced background noise at ground level coupled with higher sound levels from the turbines has been linked to increased audibil-ity and in some cases annoyance (van den Berg, 2004, 2005, 2008; Prospathopoulos and Voutsinas, 2005).
Signifi cant efforts have been made to reduce the sound levels emitted by wind turbines. As a result, mechanical sounds from modern turbines (e.g., gearboxes and generators) have been substantially reduced. Aeroacoustic noise is now the dominant concern (Wagner et al., 1996), and some of the specifi c aeroacoustic characteristics of wind turbines (e.g., van den Berg, 2005) have been found to be particularly detectable (Fastl and Zwicker, 2007) and annoying (Bradley, 1994; Bengtsson et al., 2009). Reducing aeroacoustic noise can be most easily accomplished by reducing blade speed, but different tip shapes and airfoil designs have also been explored (Migliore and Oerlemans, 2004; Lutz et al., 2007). In addition, the predictive models and environmental regulations used to manage these impacts have improved to some degree. Specifi cally, in some jurisdictions, both the wind shear and maximum sound power levels under all operating conditions are taken into account when estab-lishing regulations (Bastasch et al., 2006). Absolute maximum sound levels during the day (e.g., 55 A-weighted decibels, dBA) and night (e.g., 45 dBA) can also be coupled with maximum levels that are set rela-tive to pre-existing background sound levels (Bastasch et al., 2006). In other jurisdictions, simpler and cruder setbacks mandate a minimum distance between turbines and other structures (MOE, 2009). Despite these efforts, concerns about noise impacts remain a barrier to wind energy deployment in some areas.
In addition to sound impacts, rotating turbine blades can also cast mov-ing shadows (i.e., shadow fl icker), which may be annoying to residents living close to wind turbines. Turbines can be sited to minimize these concerns, or the operation of wind turbines can be stopped during acute periods (Hohmeyer et al., 2005). Finally, wind turbines can shed parts of or whole blades as a result of an accident or icing (or more broadly, blades can shed built-up ice, or turbines could collapse entirely). Wind energy technology certifi cation standards are aimed at reducing such

576
Wind Energy Chapter 7
accidents (see Section 7.3.2), and setback requirements further reduce the remaining risks. In practice, fatalities and injuries have been rare (see Chapter 9 for a comparison of accident risks among energy genera-tion technologies).
7.6.3.4 Property values
Concerns that the visibility of wind power plants may translate into negative impacts on residential property values at the local level have sometimes been expressed (Firestone et al., 2009; Graham et al., 2009; Jones and Eiser, 2009). Further, if various proximal nuisance effects are prominent, such as turbine noise or shadow fl icker, additional impacts on local property values might occur. Although these concerns may be reasonable given effects found for other environmental disamenities (e.g., high-voltage transmission lines, fossil-fuelled power plants and landfi lls; see Simons, 2006), published research has not found strong evidence of any widespread effect for wind power plants (e.g., Sims and Dent, 2007; Sims et al., 2008; Hoen et al., 2011). This might be explained by the setbacks normally employed between homes and wind turbines; studies on the impacts of transmission lines on property values, for example, sometimes fi nd that effects can fade at distances of 100 m (e.g., Des Rosiers, 2002). Alternatively, any effects may be too infre-quent and/or small to distinguish statistically based on historical data. Finally, turbine noise and other effects might be diffi cult to assess when homes are sold, and therefore might not be fully priced into the market. More research is needed on the subject, but based on other disamenity research (e.g., Boyle and Kiel, 2001; T. Jackson, 2001; Simons and Saginor, 2006), it is likely that any effects that do exist are most pronounced within short distances from wind turbines and in the period immediately following a wind power plant announcement, when risks are most diffi cult to quantify (Wolsink, 2007).
7.6.4 Public attitudes and acceptance
Despite the possible impacts described above, surveys have consis-tently found wind energy to be widely accepted by the general public (e.g., Warren et al., 2005; Jones and Eiser, 2009; Klick and Smith, 2010; Swofford and Slattery, 2010). Translating this broad support into increased deployment (closing the ‘social gap’, see, e.g., Bell et al., 2005), however, often requires the support of local host communities and/or decision makers (Toke, 2006; Toke et al., 2008). To that end, a number of concerns exist that might temper the enthusiasm of these stakeholders about wind energy, such as land and marine use, and the visual, proximal and property value impacts discussed previously.
In general, research has found that public concern about wind energy development is greatest directly after the announcement of a wind power plant, but that acceptance increases after construction when actual impacts can be assessed (Wolsink, 1989; Warren et al., 2005; Eltham et al., 2008). Some studies have found that those most famil-iar with existing wind power plants, including those who live closest
to them, are more accepting (or less concerned) than those less famil-iar and farther away (Krohn and Damborg, 1999; Warren et al., 2005), but other research has found the opposite to be true (van der Horst, 2007; Swofford and Slattery, 2010). Possible explanations for this apparent discrepancy include differences in attitudes towards proposed versus existing wind power plants (Swofford and Slattery, 2010), the pre-existing characteristics and values of the local community (van der Horst, 2007) and the degree of trust that the local community has concerning the development process and its outcome (Thayer and Freeman, 1987; Jones and Eiser, 2009). Research has also found that pre-construction attitudes can linger after the turbines are erected: for example, those opposed to a wind power plant’s development have been found to consider the eventual plant to be noisier and more visually intrusive that those who favoured the same plant in the pre-construction time period (Krohn and Damborg, 1999; Jones and Eiser, 2009). Some research has found that concerns can be compounding. For instance, those who found turbines to be visually intrusive also found the noise from those turbines to be more annoying (Pedersen and Waye, 2004). Finally, in some contexts at least, there appears to be some pref-erence for offshore over onshore wind energy development, though these preferences are dependent on the specifi c offshore power plant location (Ladenburg, 2009) and are far from universal (Haggett, 2011).
7.6.5 Minimizing social and environmental concerns
As wind energy deployment increases and as larger wind power plants are considered, existing concerns may become more acute and new concerns may arise. Regardless of the type and degree of social and envi-ronmental concerns, however, addressing them directly is an essential part of any successful wind power-planning and plant-siting process.38 To that end, involving the local community in the planning and siting process has sometimes been shown to improve outcomes (Loring, 2007; Toke et al., 2008; Jones and Eiser, 2009; Nadaï and Labussière, 2009). This might include, for example, allowing the community to weigh in on alternative wind power plant and turbine locations, and improving education by hosting visits to existing wind power plants. Public atti-tudes have been found to improve when the development process is perceived as being transparent (Wolsink, 2000; C. Gross, 2007; Loring, 2007). Further, experience suggests that local ownership of wind power plants and other benefi t-sharing mechanisms can improve public atti-tudes towards wind energy development (C. Gross, 2007; Wolsink, 2007; Jones and Eiser, 2009).
Proper planning for both on- and offshore wind energy developments can also help to minimize social and environmental impacts, and a number of siting guidelines have been developed (e.g., S. Nielsen, 1996; NRC, 2007; AWEA, 2008). Appropriate planning and siting will gener-ally avoid placing wind turbines too close to dwellings, streets, railroad lines, airports, radar sites and shipping routes, and will avoid areas of
38 Chapter 11 provides a complementary summary of the extensive literature on plan-ning and siting for RE.

577
Chapter 7 Wind Energy
heavy bird and bat activity; a variety of pre-construction studies are often conducted to defi ne these impacts and their mitigation. Habitat fragmentation and ecological impacts both on- and offshore can often be minimized by careful placement of wind turbines and power plants and by proactive governmental planning for wind energy deployment. Examples of such planning can be found in many jurisdictions around the world. Planning and siting regulations vary dramatically by jurisdiction, however, with varying levels of stringency and degrees of centralization versus local control. These differences can impact the environmental and social outcomes of wind energy development, as well as the speed and ease of that development (e.g., Pettersson et al., 2010).
Although an all-encompassing numerical comparison of the full external costs and benefi ts of wind energy is impossible, as some impacts are very diffi cult to monetize, available evidence suggests that the positive environmental and social effects of wind energy generally outweigh the negative impacts that remain after careful planning and siting pro-cedures are followed (see, e.g., Jacobson, 2009). In practice, however, complicated and time-consuming planning and siting processes are key obstacles to wind energy development in some countries and contexts (e.g., Bergek, 2010; Gibson and Howsam, 2010). In part, this is because even if the environmental and social impacts of wind energy are mini-mized through proper planning and siting procedures and community involvement, some impacts will remain. Efforts to better understand the nature and magnitude of these remaining impacts, together with efforts to minimize and mitigate those impacts, will therefore need to be pur-sued in concert with increasing wind energy deployment.
7.7 Prospects for technology improvement and innovation39
Over the past three decades, innovation in wind turbine design has led to signifi cant cost reductions, while the capacity and physical size of individual turbines has grown markedly (EWEA, 2009). The ‘square-cube law’ is a mathematical relationship that states that as the diameter of a wind turbine increases, its theoretical energy output increases by the square of the rotor diameter, while the volume of material (and there-fore its mass and cost) required to scale at the same rate increases as the cube of the rotor diameter, all else being equal (Burton et al., 2001). As a result, at some size, the cost of a larger turbine will grow faster than the resulting energy output and revenue, making further size increases uneconomic. To date, engineers have successfully worked around this relationship, preventing signifi cant increases in the cost of wind energy as turbines have grown larger by optimizing designs with increasing turbine size, by reducing materials use and by using lighter, yet stronger, materials.
Signifi cant opportunities remain for design optimization of on- and offshore wind turbines and power plants, and sizable cost reductions
39 Section 10.5 offers a complementary perspective on drivers of and trends in techno-logical progress across RE technologies.
remain possible in the years ahead, though improvements are likely to be more incremental in nature than radical changes in fundamental design. Engineering around the ‘square-cube law’ remains a fundamen-tal objective of research efforts aimed at further reducing the levelized cost of energy from wind, especially for offshore installations where sig-nifi cant additional up-scaling is anticipated. Breakthrough technologies from other fi elds may also fi nd applications in wind energy, including new materials (e.g., superconducting generators) and sensors (provid-ing active aerodynamic control along the entire span of a blade), which may yield even larger turbines in the future, up to or exceeding 10 MW.
This section describes R&D programs in wind energy (Section 7.7.1), system-level design and optimization approaches that may yield fur-ther reductions in the levelized generation cost of wind energy (Section 7.7.2), component-level opportunities for innovation in wind energy technology (Section 7.7.3) and the need to improve the scientifi c under-pinnings of wind energy technology (Section 7.7.4).40
7.7.1 Research and development programmes
Public and private R&D programmes have played a major role in the technical advances seen in wind energy over the last decades (Klaassen et al., 2005; Lemming et al., 2009). Government support for R&D, in collaboration with industry, has led to system- and component-level technology advances, as well as improvements in resource assessment, technical standards, electric system integration, wind energy forecasting and other areas. From 1974 to 2006, government R&D budgets for wind energy in International Energy Agency (IEA) countries totalled USD2005
3.8 billion, representing an estimated 10% share of RE R&D budgets and 1% of total energy R&D expenditures (IEA, 2008; EWEA, 2009). In 2008, OECD research funding for wind energy totalled USD2005 180 million, or 1.5% of all energy R&D funding; additional funding was provided by non-OECD countries. Government-sponsored R&D programs have often emphasized longer-term innovation, while industry-funded R&D has focused on shorter-term production, operation and installation issues. Though data on industry R&D funding are scarce, EWEA (2009), Carbon Trust (2008b) and Wiesenthal et al. (2009) fi nd that the ratio of turbine manufacturer R&D expenditures to net revenue typically ranges from 2 to 3%, while Wiesenthal et al. (2009) fi nd that corporate wind energy R&D in the EU is three times as large as government R&D investments.
Wind energy research strategies have often been developed through government and industry collaborations, historically centred on Europe and the USA, though there has been growth in public and private R&D in other countries as well (e.g., Tan, 2010). In a study to explore the technical and economic feasibility of meeting 20% of electricity demand
40 This section focuses on scientifi c and engineering challenges directly associated with reducing the cost of wind energy, but additional research areas of importance in-clude: research on the integration of wind energy into electric systems and grid compatibility (e.g., forecasting, storage, power electronics); social science research on policy measures and social acceptance; and scientifi c research to understand the impacts of wind energy on the environment and on human activities and well-being. These issues are addressed only peripherally in this section.

578
Wind Energy Chapter 7
in the USA with wind energy, the US Department of Energy (US DOE) found that key areas for further research included continued develop-ment of turbine technology, improved and expanded manufacturing processes, electric system integration of wind energy, and siting and environmental concerns (US DOE, 2008). The European Wind Energy Technology Platform (TPWind), meanwhile, has developed a roadmap through 2020 that is expected to form the basis for future European wind energy R&D strategies, with the following areas of focus: wind power systems (new turbines and components); offshore deployment and operation (offshore structures, installation and O&M protocols); wind energy integration (grid integration); and wind energy resources (wind resource assessment and design conditions) (EU, 2008; EC, 2009). In general, neither of these planning efforts requires a radical change in the fundamental design of wind turbines: instead, the path forward is seen as many evolutionary steps, executed through incremental technol-ogy advances, that may nonetheless result in signifi cant improvements in the levelized cost of wind energy as well as larger turbines, up to or exceeding 10 MW.
7.7.2 System-level design and optimization
Wind power plants and turbines are sophisticated and complex sys-tems that require integrated design approaches to optimize cost and performance. At the plant level, considerations include the selection of a wind turbine for a given wind resource regime, wind turbine siting, spacing, and installation procedures, O&M methodologies and electric system integration. Optimization of wind turbines and power plants therefore requires a whole-system perspective that evaluates not only the wind turbine as an individual aerodynamic device, mechanical structure and control system, but that also considers the interaction of the individual turbines at a plant level (EU, 2008).
Studies have identifi ed a number of areas where technology advances could result in changes in the investment cost, annual energy pro-duction, reliability, O&M cost, and electric system integration of wind energy. Examples of studies that have explored the impacts of advanced concepts include those conducted by the US DOE under the Wind Partnership for Advanced Component Technologies (WindPACT) project (GEC, 2001; Griffi n, 2001; Shafer et al., 2001; D. Smith, 2001; Malcolm and Hansen, 2006). One assessment of the possible impacts of technical advances on onshore wind energy production and turbine-level investment costs is summarized in Table 7.3 (US DOE, 2008). Though not all of these improvements may be achieved, there is suf-fi cient potential to warrant continued R&D. The most likely scenario, as shown in Table 7.3, is a sizeable increase in energy production with a modest drop in investment cost (compared to 2002 levels, which is the baseline for the estimates in Table 7.3). Meanwhile, under the EU-funded UPWIND project, a system-level analysis of the potential challenges (e.g., manufacturing processes, installation processes and structural integrity) and design solutions for very large (up to 20 MW) onshore and offshore wind turbine systems is underway. This project similarly includes the development of a model to evaluate the impact
of potential technical innovations on the system-level cost of wind energy (Sieros et al., 2011).
7.7.3 Component-level innovation opportunities
The potential areas of innovation outlined in Table 7.3 are further described in Sections 7.7.3.1 through 7.7.3.5. Though Table 7.3 is tar-geted towards wind turbines designed for onshore applications, the component-level innovations identifi ed therein will impact both on- and offshore wind energy. In fact, some of these innovations will be more important for offshore wind energy technology due to the earlier state of and greater operational challenges facing that technology. Additional advances that are more specifi c to offshore wind energy are described in Section 7.7.3.6.
7.7.3.1 Advanced tower concepts
Taller towers allow the rotor to access higher wind speeds in a given location, increasing annual energy capture. The cost of large cranes and transportation, however, acts as a limit to tower height. As a result, research is being conducted into several novel tower designs that would eliminate the need for cranes for very high, heavy lifts. One concept is the telescoping or self-erecting tower, while other designs include lifting dollies or tower-climbing cranes that use tower-mounted tracks to lift the nacelle and rotor to the top of the tower. Still other developments aim to increase the height of the tower with-out unduly sacrifi cing material demands through the use of different materials, such as concrete and fi breglass, or different designs, such as space-frame construction or panel sections (see, e.g., GEC, 2001; Malcolm, 2004; Lanier, 2005).
7.7.3.2 Advanced rotors and blades
Due to technology advances, blade mass has been scaling at roughly an exponent of 2.4 to rotor diameter, compared to the expected exponent of 3.0 based on the ‘square-cube’ law (Griffi n, 2001). The signifi cance of this development is that wind turbine blades have become lighter for a given length over time. If advanced R&D can provide even better blade design methods, coupled with better materials (such as carbon fi bre composites) and advanced manufacturing methods, then it will be possi-ble to continue to innovate around the square-cube law in blade design. One approach to reducing cost involves developing new blade airfoil shapes that are much thicker where strength is most required, near the blade root, allowing inherently better structural properties and reducing overall mass (K. Jackson et al., 2005; Chao and van Dam, 2007). These airfoil shapes potentially offer equivalent aerodynamic performance, but have yet to be proven in the fi eld. Another approach to increas-ing blade length while limiting increased material demand is to reduce the fatigue loading on the blade. Blade fatigue loads can be reduced by controlling the blade’s aerodynamic response to turbulent wind by

579
Chapter 7 Wind Energy
Table 7.3 | Areas of potential technology improvement from a 2002 baseline onshore wind turbine (based on US DOE, 2008).1
Technical Area Potential AdvancesIncrements from Baseline (Best/Expected/Least)
Annual Energy Production (%) Turbine Investment Cost (%)
Advanced Tower Concepts
• Taller towers in diffi cult locations• New materials and/or processes• Advanced structures/foundations• Self-erecting, initial or for service
+11/+11/+11 +8/+12/+20
Advanced (Enlarged) Rotors
• Advanced materials • Improved structural-aero design• Active controls• Passive controls• Higher tip speed/lower acoustics
+35/+25/+10 -6/-3/+3
Reduced Energy Losses and Improved Availability
• Reduced blade soiling losses• Damage-tolerant sensors• Robust control systems• Prognostic maintenance
+7/+5/0 0/0/0
Advanced Drive Trains(Gearboxes and Generators and Power Electronics)
• Fewer gear stages or direct drive• Medium/low-speed generators• Distributed gearbox topologies• Permanent-magnet generators• Medium-voltage equipment• Advanced gear tooth profi les• New circuit topologies• New semiconductor devices• New materials
+8/+4/0 -11/-6/+1
Manufacturing Learning
• Sustained, incremental design and process improvements
• Large-scale manufacturing• Reduced design loads
0/0/0 -27/-13/-3
Totals +61/+45/+21 -36/-10/+21
Note: 1. The baseline for these estimates was a 2002 turbine system in the USA. There have already been sizeable improvements in capacity factor since 2002, from just over 30% to almost 35%, while investment costs have increased due to large increases in commodity costs in conjunction with a drop in the value of the US dollar. Therefore, working from a 2008 baseline, one might expect a more modest increase in capacity factor, but the 10% investment cost reduction is still quite possible (if not conservative), particularly from the higher 2008 starting point. Finally, the table does not consider any changes in the overall wind turbine design concept (e.g., two-bladed turbines).
using mechanisms that vary the angle of attack of the blade airfoil rela-tive to the wind infl ow. This is primarily accomplished with full-span blade pitch control. An elegant concept, however, is to build passive means of reducing loads directly into the blade structure (Ashwill, 2009). By carefully tailoring the structural properties of the blade using the unique attributes of composite materials, for example, blades can be built in a way that couples the bending deformation of the blade result-ing from the wind with twisting deformation that passively mimics the motion of blade pitch control. Another approach is to build the blade in a curved shape so that the aerodynamic load fl uctuations apply a twisting movement to the blade, which will vary the angle of attack (Ashwill, 2009). Because wind infl ow displays a complex variation of speed and character across the rotor area, partial blade span actuation and sensing strategies to maximize load reduction are also promising (Buhl et al., 2005; Lackner and van Kuik, 2010). Devices such as trail-ing edge fl aps and micro-tabs, for example, are being investigated, but new sensors may need to be developed for this purpose, with a goal of creating ‘smart’ blades with embedded sensors and actuators to control local aerodynamic effects (Andersen et al., 2006; Berg et al., 2009). To fully achieve these new designs, a better understanding of wind turbine
aeroelastic, aerodynamic and aeroacoustic responses to complicated blade motion will be needed, as will control algorithms to incorporate new sensors and actuators in wind turbine operation.
7.7.3.3 Reduced energy losses and improved availability
Advanced turbine control and condition monitoring are expected to provide a primary means to improve turbine reliability and availability, reduce O&M costs and ultimately increase energy capture, for both individual turbines and wind power plants, on- and offshore. Advanced controllers are envisioned that can better control the turbine during turbulent winds and thereby reduce fatigue loading and extend blade life (Bossanyi, 2003; Stol and Balas, 2003; Wright, 2004), monitor and adapt to wind conditions to increase energy capture and reduce the impact of blade soiling or erosion (Johnson et al., 2004; Johnson and Fingersh, 2008; Frost et al., 2009) and anticipate and protect against damaging wind gusts by using new sensors to detect wind speeds immediately ahead of the blade (T. Larsen et al., 2004; Hand and Balas, 2007). Condition-monitoring systems of the future are expected to

580
Wind Energy Chapter 7
track and monitor ongoing conditions at critical locations in the tur-bine and report incipient failure possibilities and damage evolution, so that improved maintenance procedures can minimize outages and downtimes (Hameed et al., 2010). The full development of advanced control and monitoring systems of this nature will require consider-able operational experience, and optimization algorithms will likely be turbine-specifi c; the general approach, however, should be transfer-able between turbine designs and confi gurations.
7.7.3.4 Advanced drive trains, generators, and power electronics
Several unique turbine designs are under development or in early com-mercial deployment to reduce drive train weight and cost while improving reliability (Poore and Lettenmaier, 2003; Bywaters et al., 2004; EWEA, 2009). One option, already in limited commercial use, is a direct-drive gen-erator (removing the need for a gearbox); more than 10% of the additional wind power capacity installed in 2009 used fi rst-generation direct drive turbines (BTM, 2010), but additional design advances are envisioned. The trade-off is that the slowly rotating generator must have a high pole count and be large in diameter, imposing a weight penalty. The availability and cost of rare-earth permanent magnets is expected to signifi cantly affect the size and cost of future direct-drive generator designs, as permanent-magnet designs tend to be more compact and potentially lightweight, as well as reducing electrical losses in the windings.
Various additional drive train confi gurations are being explored and commercially deployed. A hybrid of the current geared and direct-drive approaches is the use of a single-stage drive using a low- or medium-speed generator. This allows the use of a generator that is signifi cantly smaller and lighter than a comparable direct-drive design, and reduces (but does not eliminate) reliance on a gearbox. Another approach is the distributed drive train, where rotor torque is distributed to multiple smaller generators (rather than a single, larger one), reducing com-ponent size and (potentially) weight. Still other innovative drive train concepts are under development.
Power electronics that provide full power conversion from variable fre-quency alternating current (AC) electricity to constant frequency 50 or 60 Hz are also capable of providing ancillary grid services. The growth in turbine size is driving larger power electronic components as well as innovative higher-voltage circuit topologies. In the future, it is expected that wind turbines will use higher-voltage generators and converters than are used today (Erdman and Behnke, 2005), and therefore also make use of higher-voltage and higher-capacity circuits and transistors. New power conversion devices will need to be fully compliant with emerging grid codes to ensure that wind power plants do not degrade the reliability of the electric system.
7.7.3.5 Manufacturing learning
Manufacturing learning refers to the learning by doing achieved in serial production lines with repetitive manufacturing (see Section 7.8.4 for a broader discussion of learning in wind energy technology). Though tur-bine manufacturers already are beginning to operate at signifi cant scale, as the industry expands further, additional cost savings can be expected. For example, especially as turbines increase in size, concepts such as manufacturing at wind power plant sites and segmented blades are being explored to reduce transportation challenges and costs. Further increases in manufacturing automation and optimized processes will also contribute to cost reductions in the manufacturing of wind turbines and components.
7.7.3.6 Offshore research and development opportunities
The cost of offshore wind energy exceeds that of onshore wind energy due, in part, to higher O&M costs as well as more expensive installa-tion and support structures. The potential component-level technology advances described above will contribute to lower offshore wind energy costs, and some of those possible advances may even be largely driven by the unique needs of offshore wind energy applications. In addition, several areas of possible advancement are more specifi c to offshore wind energy, including O&M strategies, installation and assembly schemes, support structure design and the development of larger tur-bines, possibly including new turbine concepts.
Offshore wind turbines operate in harsh environments driven by both wind and wave conditions that can make access to turbines challeng-ing or even impossible for extended periods (Breton and Moe, 2009). A variety of methods to provide greater access during a range of con-ditions are under consideration and development, including infl atable boats or helicopters (Van Bussel and Bierbooms, 2003). Sophisticated O&M approaches that include remote assessments of turbine operabil-ity and the scheduling of preventative maintenance to maximize access during favourable conditions are also being investigated, and employed (Wiggelinkhuizen et al., 2008). The development of more reliable turbine components, even if more expensive on a fi rst-cost basis, is also expected to play a major role in reducing the overall levelized cost of offshore wind energy. Efforts are underway to more thoroughly analyze gearbox dynamics, for example, to contribute to more reliable designs (Peeters et al., 2006; Heege et al., 2007). A number of the component-level inno-vations described earlier, such as advanced direct-drive generators and passive blade controls, may also improve overall technology reliability.
Offshore wind turbine transportation and installation is not directly restricted by road or other land-based infrastructure limits. As a result, though offshore wind turbines are currently installed as individual

581
Chapter 7 Wind Energy
components, concepts are being considered where fully assembled turbines are transported on special-purpose vessels and mounted on previously installed support structures. In addition to creating the ves-sels needed for such installation practices, ports and staging areas would need to be designed to effi ciently perform the assembly processes.
Additional R&D is required to improve support structure design for off-shore turbines. Foundation structure innovation offers the potential to access deeper waters, thereby increasing the technical potential of wind energy (Breton and Moe, 2009). Offshore turbines have histori-cally been installed primarily in relatively shallow water, up to 30 m, on a mono-pile structure that is essentially an extension of the tower, but gravity-based structures have become more common. Other con-cepts that are more appropriate for deeper water depths include fi xed-bottom space-frame structures, such as jackets and tripods, and fl oating platforms, such as spar- buoys, tension-leg platforms, semi-submersibles, or hybrids of these concepts. Offshore wind tur-bine support structures may undergo dynamic responses associated with wind and wave loads, requiring an integrated analysis of the rotor, tower and support structure supplemented with improved estimates of soil stiffness and scour conditions specifi c to offshore support structures (F. Nielsen et al., 2009). Floating wind turbines fur-ther increase the complexity of turbine design due to the additional motion of the base but, if cost effective, could: (1) offer access to signifi cant additional wind resource areas; (2) encourage technology standardization whereby turbine and support structure design would be largely independent of water depths and seabed conditions; and (3) lead to simplifi ed installation (e.g., full turbine assembly could occur in sheltered water) and decommissioning practices (EWEA,
2009). In 2009, the fi rst full-scale fl oating wind turbine pilot plant was deployed off the coast of Norway at a 220 m depth. Figure 7.19 depicts some of the foundation concepts (left) in use or under con-sideration in the near term, while also (right) illustrating the concept of fl oating wind turbines, which are being considered for the longer term.
Future offshore wind turbines may be larger, lighter and more fl ex-ible. Offshore wind turbine size is not restricted in the same way as onshore wind energy technology, and the relatively higher cost of offshore foundations provides additional motivation for larger tur-bines (EWEA, 2009). As a result, turbines of 10 MW or larger are under consideration. Future offshore turbine designs can benefi t from many of the possible component-level advances described pre-viously. Nonetheless, the development of large turbines for offshore applications remains a signifi cant research challenge, requiring con-tinued advancement in component design and system-level analysis. Concepts that reduce the weight of the blades, tower and nacelle become more important as size increases, providing opportunities for greater advancement than may be incorporated in onshore wind energy technology. In addition to larger turbines, design criteria for offshore applications may be relaxed in cases where noise and visual impacts are of lesser concern. As a result, other advanced turbine concepts are under investigation, including two-bladed and down-wind turbines. Downwind turbine designs may allow less-costly yaw mechanisms, and the use of softer, more fl exible blades (Breton and Moe, 2009). Finally, innovative turbine concepts and signifi cant up-scaling of existing designs will require improved turbine modelling to better capture the operating environment in which offshore turbines
Figure 7.19 | Offshore wind turbine foundation designs: (left) near-term concepts and (right) fl oating offshore turbine concept. Sources: (left) UpWind (UpWind.eu) and (right) NREL.
Monopile Tri-Pod Jacket Suction Caisson Gravity Base
Ballast Stabilized “Spar-Buoy”with Catenary Mooring Drag Embedded Anchors
Mooring Line StabilizedTension Leg Platform with Suction Pile Anchors
Buoyancy Stabilized“Barge” with CatenaryMooring Lines
Floating Wind Turbine Concepts

582
Wind Energy Chapter 7
are installed, including the dynamic response of turbines to wind and wave loading (see Section 7.7.4).
7.7.4 The importance of underpinning science
Although wind energy technology is being deployed at a rapid scale today, signifi cant potential remains for continued innovation to further reduce cost and improve performance. International wind turbine design and safety standards dictate the level of analysis and testing required prior to commercializing new concepts. At the same time, technical innovation will push the design criteria and analysis tools to the lim-its of physical understanding. A signifi cant effort is therefore needed to enhance fundamental understanding of the wind turbine and power plant operating environment in order to facilitate a new generation of reliable, safe, cost-effective wind turbines and to further optimize wind power plant siting and design.
Wind turbines operate in a challenging environment, and are designed to withstand a wide range of conditions with minimal attention. Wind turbines are complex, nonlinear, dynamic systems forced by gravity, cen-trifugal, inertial and gyroscopic loads as well as unsteady aerodynamic, hydrodynamic (for offshore) and corrosion impacts. Modern wind tur-bines also operate in a layer of the atmosphere (from 50 to 200 m) that is complex, and are impacted by phenomena that occur over scales ranging from microns to thousands of kilometres. Accurate, reliable wind measurements and computations across these scales are important. In addition, fundamental scientifi c research in a number of areas can improve physical understanding of this operating environment (includ-ing extreme weather events) and its impact on wind turbines and power plants. Research in the areas of aeroelastics, unsteady aerodynamics, aeroacoustics, advanced control systems and atmospheric sciences, for example, has yielded improved design capabilities in the past, and continued research in these areas is anticipated to continue to improve mathematical models and experimental data, which, in turn, will reduce the risk of unanticipated turbine failures, increase the reliability of the technology and encourage further design innovation.
Although the physics are strongly coupled, four primary spatio-temporal levels require additional research: (1) wind conditions that affect individ-ual turbines; (2) wind power plant siting and array effects; (3) mesoscale atmospheric processes; and (4) global and local climate effects.
Wind conditions that affect individual turbines encompass detailed characterizations of wind fl ow fi elds and the interaction of those fl ows with wind turbines. Wind turbine aerodynamics are complicated by three-dimensional effects in rotating blade fl ow fi elds that are unsteady and create load oscillations linked to dynamic stall. Understanding these aerodynamic effects, however, is critical for making load predictions that are accurate enough for use in turbine design. To this point, these effects have been identifi ed and quantifi ed based on wind tunnel and fi eld experiments (Schreck et al., 2000, 2001; Schreck and Robinson, 2003; H.
Madsen et al., 2010), and empirical models of these effects have been developed (Bierbooms, 1992; Du and Selig, 1998; Snel, 2003; Leishman, 2006). Currently, these aerodynamic models rely on blade-element moment methods (Spera, 2009) augmented with analytically and empiri-cally based models to calculate the aerodynamic forces along the span of the blade. The availability of effective computational fl uid dynamics codes and their potential to deliver improved predictive accuracy, however, is prompting broader application (M.O. Hansen et al., 2006). Aeroelastic models, meanwhile, are used to translate aerodynamic forces into struc-tural responses throughout the turbine system. As turbines grow in size and are optimized, the structural fl exibility of the components will neces-sarily increase, causing more of the turbine’s vibration frequencies to play a prominent role. To account for these effects, future aeroelastic tools will have to better model large variations in the wind infl ow across the rotor, higher-order vibration modes, nonlinear blade defl ection, and aeroelastic damping and instability (Quarton, 1998; Rasmussen et al., 2003; Riziotis et al., 2004; M.H. Hansen, 2007). The application of novel load-mitigation control technologies to blades (e.g., deformable trailing edges) (Buhl et al., 2005) will require analysis based on aeroelastic tools that are adapted for these architectures. Similarly, exploration of control systems that uti-lize wind speed measurements in advance of the blade, such as light detection and ranging (Harris et al., 2006) or pressure probe measure-ments (T. Larsen et al., 2004), will also require improved aeroelastic tools. Offshore wind energy will require that aeroelastic tools better model the coupled dynamic response of the wind turbine and the foundation/support platform, as subjected to combined wind and wave loads (Passon and Kühn, 2005; Jonkman, 2009). Finally, aeroacoustic noise (i.e., the noise of turbine blades) is an issue for wind turbines (Wagner et al., 1996), and increasingly sophisticated tools are under development to better understand and manage these effects (Wagner et al., 1996; Moriarty and Migliore, 2003; Zhu et al., 2005, 2007; Shen and Sörensen, 2007). As turbine aerodynamic, aeroelastic and aeroacoustic modelling advances, the crucial role (e.g., Simms et al., 2001) of research-grade turbine aerodynamics experiments (Hand et al., 2001; Snel et al., 2009) grows ever more evident, as does the need for future high-quality labo-ratory and fi eld experiments. Even though wind turbines now extract energy from the wind at levels approaching the theoretical maximum, improved understanding of aerodynamic phenomena will allow more accurate calculation of loads and thus the development of lighter, less costly, more reliable and higher-performing turbines.
Wind power plant siting and array effects impact energy production and equipment reliability at the power plant level. As wind power plants grow in size and move offshore, such impacts become more important. Rotor wakes create aeroelastic effects on downwind turbines (G. Larsen et al., 2008). Improved models of wind turbine wakes (Thomsen and Sørensen, 1999; Frandsen et al., 2009; Barthelmie and Jensen, 2010) will therefore yield more reliable predictions of energy capture and better estimates of fatigue loading in large, multiple-row wind power plants, both on- and offshore. This improved understanding may then lead to wind turbine and power plant designs intended to minimize energy cap-ture degradations and manage wake-based load impacts.

583
Chapter 7 Wind Energy
Planetary boundary layer research is important for accurately determin-ing wind fl ow and turbulence in the presence of various atmospheric stability effects and complex land surface characteristics. Research in mesoscale atmospheric processes aims at improving the fundamental understanding of mesoscale and local wind fl ows (Banta et al., 2003; Kelley et al., 2004). In addition to its contribution towards understanding turbine-level aerodynamic and array wake effects, a better understand-ing of mesoscale atmospheric processes will yield improved wind energy resource assessments and forecasting methods. Physical and statistical modelling to resolve spatial scales in the 100- to 1,000-m range, a nota-ble gap in current capabilities (Wyngaard, 2004), could occupy a central role of this research.
Finally, additional research is warranted on the interaction between global and local climate effects, and wind energy. Specifi cally, work is needed to identify and understand historical trends in wind resource variability in order to increase the reliability of future wind energy per-formance predictions. As discussed earlier in this chapter, further work is also warranted on the possible impacts of climate change on wind energy resource conditions, and on the impact of wind energy develop-ment on local, regional and global climates.
Signifi cant progress in many of the above areas requires interdisciplinary research. Also crucial is the need to use experiments and observations in a coordinated fashion to support and validate computation and theory. Models developed in this way will help improve: (1) wind turbine design; (2) wind power plant performance estimates; (3) wind resource assess-ments; (4) short-term wind energy forecasting; and (5) estimates of the impact of large-scale wind energy deployment on the local climate, as well as the impact of potential climate change effects on wind resources.
7.8 Cost trends41
Though the cost of wind energy has declined signifi cantly since the 1980s, policy measures are currently required to ensure rapid deploy-ment in most regions of the world (e.g., NRC, 2010b). In some areas with good wind resources, however, the cost of wind energy is competi-tive with current energy market prices (e.g., Berry, 2009; IEA, 2009; IEA and OECD, 2010). Moreover, continued technology advances in on- and offshore wind energy are expected (Section 7.7), supporting further cost reductions. The degree to which wind energy is utilized globally and regionally will depend largely on the economic performance of wind energy compared to alternative power sources.
This section describes the factors that affect the cost of wind energy (Section 7.8.1), highlights historical trends in the cost and performance of wind power plants (Section 7.8.2), summarizes data and estimates the levelized generation cost of wind energy in 2009 (Section 7.8.3),
41 Discussion of costs in this section is largely limited to the perspective of private investors. Chapters 1 and 8 to 11 offer complementary perspectives on cost issues covering, for example, costs of integration, external costs and benefi ts, economy-wide costs and costs of policies.
and summarizes forecasts of the potential for further cost reductions (Section 7.8.4). The economic competitiveness of wind energy in com-parison to other energy sources, which necessarily must also include other factors such as subsidies and environmental externalities, is not covered in this section.42 Moreover, the focus in this section is on wind energy generation costs; the costs of integration and transmission are generally not covered here, but are instead discussed in Section 7.5, though costs associated with grid connection are sometimes included in the investment cost fi gures presented in this section.
7.8.1 Factors that affect the cost of wind energy
The levelized cost of energy from on- and offshore wind power plants is affected by fi ve primary factors: annual energy production, investment costs, O&M costs, fi nancing costs and the assumed economic life of the plant.43 Available support policies can also infl uence the cost (and price) of wind energy, as well as the cost of other electricity supply options, but these factors are not addressed here.
The nature of the wind resource, which varies geographically and tempo-rally, largely determines the annual energy production from a prospective wind power plant, and is among the most important economic factors (Burton et al., 2001). Precise micro-siting of wind power plants and even individual turbines is critical for maximizing energy production. The trend towards turbines with larger rotor diameters and taller towers has led to increases in annual energy production per unit of installed capacity, and has also allowed wind power plants in lower-resource areas to become more economically competitive. Larger wind power plants, meanwhile, have led to consideration of array effects whereby the production of downwind turbines is affected by those turbines located upwind. Offshore power plants will, generally, be exposed to better wind resources than will onshore plants (EWEA, 2009).
Wind power plants are capital intensive and, over their lifetime, the initial investment cost ranges from 75 to 80% of total expenditure, with O&M costs contributing the balance (Blanco, 2009; EWEA, 2009). The invest-ment cost includes the cost of the turbines (turbines, transportation to site, and installation), grid connection (cables, sub-station, connection), civil works (foundations, roads, buildings), and other costs (engineering, licens-ing, permitting, environmental assessments and monitoring equipment). Table 7.4 shows a rough breakdown of the investment cost components for modern wind power plants. Turbine costs comprise more than 70% of total investment costs for onshore wind power plants. The remaining investment costs are highly site-specifi c. Offshore wind power plants are dominated by these other costs, with the turbines often contributing less than 50% of the total. Site-dependent characteristics such as water depth and distance to shore signifi cantly affect grid connection, civil works and
42 The environmental impacts and costs of RE and non-RE sources are summarized in Chapters 9 and 10, respectively.
43 Decommissioning costs also exist, but are not expected to be sizable in most in-stances.

584
Wind Energy Chapter 7
other costs. Offshore turbine foundations and internal electric grids are also considerably more costly than those for onshore power plants.
The O&M costs of wind power plants include fi xed costs such as land leases, insurance, taxes, management, and forecasting services, as well as variable costs related to the maintenance and repair of turbines, including spare parts. O&M comprises approximately 20% of total wind power plant expenditure over a plant’s lifetime (Blanco, 2009), with roughly 50% of total O&M costs associated directly with maintenance, repair and spare parts (EWEA, 2009). O&M costs for offshore wind energy are higher than for onshore due to the less mature state of technology as well as the challenges and costs of accessing offshore turbines, especially in harsh weather conditions (Blanco, 2009).
Financing arrangements, including the cost of debt and equity and the proportional use of each, can also infl uence the cost of wind energy, as can the expected operating life of the wind power plant. For example, ownership and fi nancing structures have evolved in the USA that minimize the cost of capital while taking advantage of available incentives (Bolinger et al., 2009). Other research has found that the predictability of the policy measures supporting wind energy can have a sizable impact on fi nancing costs, and therefore the ultimate cost of wind energy (Wiser and Pickle, 1998; Dinica, 2006; Dunlop, 2006; Agnolucci, 2007). Because offshore wind power plants are still relatively new, with greater performance risk, higher fi nancing costs are experienced than for onshore plants (Dunlop, 2006; Blanco, 2009), and larger fi rms tend to dominate offshore wind energy development and ownership (Markard and Petersen, 2009).
7.8.2 Historical trends
7.8.2.1 Investment costs
From the beginnings of commercial wind energy deployment to roughly 2004, the average investment costs of onshore wind power plants dropped, while turbine size grew signifi cantly.44 With each generation
44 Investment costs presented here and later in Section 7.8 (as well as all resulting lev-elized cost of energy estimates) generally include the cost of the turbines (turbines, transportation to site and installation), grid connection (cables, sub-station, connec-tion, but not more general transmission expansion costs), civil works (foundations, roads, buildings), and other costs (engineering, licensing, permitting, environmental assessments, and monitoring equipment). Whether the cost of connecting to the grid is included varies by data source, and is sometimes unclear; costs associated with strengthening the ‘backbone’ transmission system are generally excluded.
of wind turbine technology during this period, design improvements and turbine scaling led to decreased investment costs. Historical invest-ment cost data from Denmark and the USA demonstrate this trend (Figure 7.20). From 2004 to 2009, however, investment costs increased. Some of the reasons behind these increased costs are described in Section 7.8.3.
There is far less experience with offshore wind power plants, and the investment costs of offshore plants are highly site-specifi c. Nonetheless, the investment costs of offshore plants have historically been 50 to more than 100% higher than for onshore plants (BWEA and Garrad Hassan, 2009; EWEA, 2009). Moreover, offshore wind power plants built to date have generally been constructed in relatively shallow water and relatively close to shore (see Section 7.3); higher costs would be experienced for deeper water and more distant facilities. Figure 7.21 presents investment cost data for operating and announced offshore wind power plants. Offshore costs have been infl uenced by some of the same factors that caused rising onshore costs from 2004 through 2009 (as well as several unique factors), as described in Section 7.8.3, leading to a doubling of the average investment cost of offshore plants from 2004 through 2009 (BWEA and Garrad Hassan, 2009; UKERC, 2010).
7.8.2.2 Operation and maintenance
Modern turbines that meet IEC standards are designed for a 20-year life, and plant lifetimes may exceed 20 years if O&M costs remain at an acceptable level. Few wind power plants were constructed 20 or more years ago, however, and there is therefore limited experience in plant operations over this entire time period (Echavarria et al., 2008). Moreover, those plants that have reached or exceeded their 20-year lifetime tend to have turbines that are much smaller and less sophisti-cated than their modern counterparts. Early turbines were also designed using more conservative criteria, though they followed less stringent standards than today’s designs. As a result, early plants only offer lim-ited guidance for estimating O&M costs for more recent turbine designs.
In general, O&M costs during the fi rst couple of years of a wind power plant’s life are covered, in part, by manufacturer warranties that are included in the turbine purchase, resulting in lower ongoing costs than in subsequent years. Newer turbine models also tend to have lower ini-tial O&M costs than older models, with maintenance costs increasing
Table 7.4 | Investment cost distribution for on- and offshore wind power plants (Data sources: Blanco, 2009; EWEA, 2009).
Cost Component Onshore (%) Offshore (%)1
Turbine 71–76 37–49
Grid connection 10–12 21–23
Civil works 7–9 21–25
Other investment costs 5–8 9–15
Note: 1. Offshore cost categories consolidated from original study.

585
Chapter 7 Wind Energy
0
500
1,000
1,500
2,000
2,500
3,000
3,500
4,000
4,500
5,000
1982
1983
1984
1985
1986
1987
1988
1989
1990
1991
1992
1993
1994
1995
1996
1997
1998
1999
2000
2001
2002
2003
2004
2005
2006
2007
2008
2009
Inve
stm
ent
Cost
[USD
2005
/kW
]
Average Project Investment Cost
0
500
1,000
1,500
2,000
2,500
3,000
3,500
4,000
4,500
5,000
1982
1983
1984
1985
1986
1987
1988
1989
1990
1991
1992
1993
1994
1995
1996
1997
1998
1999
2000
2001
2002
2003
2004
2005
2006
2007
2008
2009
Inve
stm
ent
Cost
[USD
2005
/kW
]
Individual Project Investment Cost
Capacity-Weighted Average Project Investment Cost
Polynomial Trend Line
Figure 7.20. Investment cost of onshore wind power plants in (upper panel) Denmark (Data source: Nielson et al., 2010) and (lower panel) the USA (Wiser and Bolinger, 2010).
as turbines age (Blanco, 2009; EWEA, 2009; Wiser and Bolinger, 2010). Offshore wind power plants have historically incurred higher O&M costs than onshore plants (Junginger et al., 2004; EWEA, 2009; Lemming et al., 2009).
7.8.2.3 Energy production
The performance of wind power plants is highly site-specifi c, and is primar-ily governed by the characteristics of the local wind regime, which varies geographically and temporally. Wind power plant performance is also impacted by wind turbine design optimization, performance, and avail-ability, however, and by the effectiveness of O&M procedures. Improved resource assessment and siting methodologies developed in the 1970s
and 1980s played a major role in improved wind power plant productivity. Advances in wind energy technology, including taller towers and larger rotors, have also contributed to increased energy capture (EWEA, 2009).
Though plant-level capacity factors vary widely, data on average fl eet-wide capacity factors45 for a large sample of onshore wind power plants in the USA show a trend towards higher average capacity fac-tors over time, as wind power plants built more recently have higher
45 A wind power plant’s capacity factor is only a partial indicator of performance (EWEA, 2009). Most turbine manufacturers supply variations on a given generator capacity with multiple rotor diameters and hub heights. In general, for a given gen-erator capacity, increasing the hub height, the rotor diameter, or the average wind speed will result in an increased capacity factor. When comparing different wind turbines, however, it is possible to increase annual energy capture by using a larger generator, while at the same time decreasing the capacity factor.

586
Wind Energy Chapter 7In
vest
men
t Co
st [U
SD20
05 /k
W]
1990 1995 2000 2005 2010 20150
1,000
2,000
3,000
4,000
7,000
6,000
5,000
Investment Cost for Operating European Project
Announced Investment Cost for Proposed U.S. Project
Announced Investment Cost for Proposed European Project
Capacity-Weighted Average Project Investment Cost
Figure 7.21 | Investment cost of operating and announced offshore wind power plants (Musial and Ram, 2010).
Capa
city
Fac
tor
[%]
Projects:
MW:
1999
11
701
2005 2006
190 217
2000
17
1.158
2001
77
2.199
2002
124
3.955
2003
137
4.458
2004
163
5.784 6.467 9.289
2007
258
11.253
2008
299
16.068
2009
242
22.346
35
30
25
20
15
10
5
0
Figure 7.22 | Fleet-wide average capacity factors for a large sample of wind power plants in the USA from 1999 to 2009 (Wiser and Bolinger, 2010).
average capacity factors than those built earlier (Figure 7.22). Higher hub heights and larger rotor sizes are primarily responsible for these improvements, as the more recent wind power plants built in this time period and included in Figure 7.22 were, on average, sited in relatively lower-quality wind resource regimes.
Using a different metric for wind power plant performance, annual energy production per square meter of swept rotor area (kWh/m2) for a given wind resource site, improvements of 2 to 3% per year over the last 15 years have been documented (IEA, 2008; EWEA, 2009).
7.8.3 Current conditions
7.8.3.1 Investment costs
The investment costs for onshore wind power plants installed worldwide in 2009 averaged approximately USD2005 1,750/kW, with many plants falling in the range of USD2005 1,400 to 2,100/kW (Milborrow, 2010); data in IEA Wind (2010) are reasonably consistent with this range. Wind power plants installed in the USA in 2009 averaged USD2005 1,900/kW (Wiser and Bolinger, 2010). Costs in some markets were lower: for

587
Chapter 7 Wind Energy
example, average investment costs in China in 2008 and 2009 were around USD2005 1,000 to 1,350/kW, driven in part by the dominance of several Chinese turbine manufacturers serving the market with lower-cost wind turbines (China Renewable Energy Association, 2009; Li and Ma, 2009; Li, 2010).
Wind power plant investment costs rose from 2004 to 2009 (Figure 7.20), an increase primarily caused by the rising price of wind turbines (Wiser and Bolinger, 2010). Those price increases have been attributed to a num-ber of factors. Increased rotor diameters and hub heights have enhanced the energy capture of modern wind turbines, for example, but those performance improvements have come with increased turbine costs, measured on a dollar per kW basis. The costs of raw materials, includ-ing steel, copper, cement, aluminium and carbon fi bre, also rose sharply from 2004 through mid-2008 as a result of strong global economic growth. The strong demand for wind turbines over this period also put upward pressure on labour costs, and enabled turbine manufac-turers and their component suppliers to boost profi t margins. Strong demand, in excess of available supply, also placed particular pres-sure on critical components such as gearboxes and bearings (Blanco, 2009). Moreover, because many of the wind turbine manufacturers have historically been based in Europe, and many of the critical com-ponents have similarly been manufactured in Europe, the relative value of the Euro compared to other currencies also contributed to the wind turbine price increases in certain countries. Turbine manufactur-ers and component suppliers responded to the tight supply over this period by expanding or adding new manufacturing facilities. Coupled with reductions in materials costs that began in late 2008 as a result of the global fi nancial crisis, these trends began to moderate wind turbine prices in 2009 (Wiser and Bolinger, 2010).
Due to the relatively small number of operating offshore wind power plants, investment cost data are sparse. Nonetheless, the average cost of offshore wind power plants is considerably higher than that for onshore plants, and the factors that have increased the cost of onshore plants have similarly affected the offshore sec-tor. The limited availability of turbine manufacturers supplying the offshore market and of vessels to install such plants exacerbated cost increases since 2004, as has the installation of offshore plants in increasingly deeper waters and farther from shore, and the fi erce competition among industry players for early-year (before 2005) dem-onstration plants (BWEA and Garrad Hassan, 2009; UKERC, 2010). As a result, offshore wind power plants over 50 MW in size, either built between 2006 and 2009 or planned for the early 2010s, had investment costs that ranged from approximately USD2005 2,000 to 5,000/kW (BWEA and Garrad Hassan, 2009; IEA, 2009; Snyder and Kaiser, 2009a; Musial and Ram, 2010). The most recently installed or announced plants cluster towards the higher end of this range, from USD2005 3,200 to 5,000/kW (Milborrow, 2010; Musial and Ram, 2010; UKERC, 2010). These investment costs are roughly 100% higher than costs seen from 2000 to 2004 (BWEA and Garrad Hassan, 2009; Musial and Ram, 2010; UKERC, 2010). Notwithstanding the increased water depth of offshore plants, the majority of the operating plants
have been built in relatively shallow water. Offshore plants built in deeper waters, which are becoming increasingly common and are partly refl ected in the costs for announced plants, will have relatively higher costs.
7.8.3.2 Operation and maintenance
Though fi xed O&M costs such as insurance, land payments and rou-tine maintenance are relatively easy to estimate, variable costs such as repairs and spare parts are more diffi cult to predict (Blanco, 2009). O&M costs can vary by wind power plant, turbine type and age, and the avail-ability of a local servicing infrastructure, among other factors. Levelized O&M costs for onshore wind energy are often estimated to range from US cents2005 1.2 to 2.3/kWh (Blanco, 2009); these fi gures are reasonably consistent with costs reported in EWEA (2009), IEA (2010c), Milborrow (2010), and Wiser and Bolinger (2010).
Limited empirical data exist on O&M costs for offshore wind energy, due in large measure to the limited number of operating plants and the limited duration of those plants’ operation. Reported or estimated O&M costs for offshore plants installed since 2002 range from US cents2005 2 to 4/kWh (EWEA, 2009; IEA, 2009, 2010c; Lemming et al., 2009; Milborrow, 2010; UKERC, 2010).
7.8.3.3 Energy production
Onshore wind power plant performance varies substantially, with capac-ity factors ranging from below 20 to more than 50% depending largely on local resource conditions. Among countries, variations in average per-formance also refl ect differing wind resource conditions, as well as any difference in the wind turbine technology that is deployed: the average capacity factor for Germany’s installed plants has been estimated at 20.5% (BTM, 2010); European country-level average capacity factors range from 20 to 30% (Boccard, 2009); average capacity factors in China are reported at roughly 23% (Li, 2010); average capacity factors in India are reported at around 20% (Goyal, 2010); and the average capacity fac-tor for US wind power plants is above 30% (Wiser and Bolinger, 2010). Offshore wind power plants often experience a narrower range in capacity factors, with a typical range of 35 to 45% for the European plants installed to date (Lemming et al., 2009); some offshore plants in the UK, however, have experienced capacity factors of roughly 30%, in part due to relatively high component failures and access limitations (UKERC, 2010).
Because of these variations among countries and individual plants, which are primarily driven by local wind resource conditions but are also affected by turbine design and operations, estimates of the level-ized cost of wind energy must include a range of energy production estimates. Moreover, because the attractiveness of offshore plants is enhanced by the potential for greater energy production than for onshore plants, performance variations among on- and offshore wind energy must also be considered.

588
Wind Energy Chapter 7
7.8.3.4 Levelized cost of energy estimates
Using the methods summarized in Annex II, the levelized generation cost of wind energy is presented in Figure 7.23. For onshore wind energy, estimates are provided for plants built in 2009; for offshore wind energy, estimates are provided for plants built in 2008 and 2009 as well as those plants planned for completion in the early 2010s.46 Estimated levelized costs are presented over a range of energy production estimates to rep-resent the cost variation associated with inherent differences in the wind resource. The x-axis for these charts roughly correlates to annual average
wind speeds from 6 to 10 m/s. Onshore investment costs are assumed to range from USD2005 1,200 to 2,100/kW (with a mid-level cost of USD2005 1,750/kW); investment costs for offshore wind energy are assumed to range from USD2005 3,200 to 5,000/kW (mid-level cost of USD2005 3,900/kW).47 Levelized O&M costs are assumed to average US cents2005 1.6/kWh and US cents2005 3/kWh over the life of the plant for onshore and offshore wind energy, respectively. A power plant design life of 20 years is assumed, and discount rates of 3 to 10% (mid-point estimate of 7%)
46 Because investment costs have risen in recent years, using the cost of recent and planned plants reasonably refl ects the “current” cost of offshore wind energy.
47 Based on data presented earlier in this section, the mid-level investment cost for on- and offshore wind power plants does not represent the arithmetic mean between the low and high end of the range.
are used to produce levelized generation cost estimates.48 Taxes, policy incentives, and the costs of electric system integration are not included in these calculations.49
The levelized cost of on- and offshore wind energy varies substantially, depending on assumed investment costs, energy production and dis-count rates. For onshore wind energy, levelized generation costs in good to excellent wind resource regimes are estimated to average US cents2005 5 to 10/kWh. Levelized generation costs can reach US cents2005 15/kWh in lower- resource areas. The costs of wind energy in China and
the USA tend towards the lower range of these estimates, due to lower average investment costs (China) and higher average capacity factors (USA); costs in much of Europe tend towards the higher end of the range due to relatively lower average capacity factors. Though the offshore cost estimates are more uncertain, offshore wind energy is generally more expensive than onshore, with typical levelized generation costs that are estimated to range from US cents2005 10/kWh to more than US cents2005 20/kWh for recently built or planned plants located in relatively
48 Though the same discount rate range and mid-point are used for on- and offshore wind energy, offshore wind power plants currently experience higher-cost fi nancing than do onshore plants. As such, the levelized cost of energy from offshore plants may, in practice, tend towards the higher end of the range presented in the fi gure, at least in comparison to onshore plants.
49 Decommissioning costs are generally assumed to be low, and are excluded from these calculations.
Leve
lized
Cos
t of
Ene
rgy
[USc
ent 20
05 /k
Wh]
15 20 30 40 5035 45
Capacity Factor [%]
0
5
10
15
20
35
30
25Onshore USD 2,100/kW
Europe Offshore Projects
China
European Low-Medium Wind Areas US Great Plains
Onshore USD 1,750/kW
Onshore USD 1,200/kW
Offshore USD 5,000/kW
Offshore USD 3,900/kW
Offshore USD 3,200/kW
25
Figure 7.23 | Estimated levelized cost of on- and offshore wind energy, 2009: (left) as a function of capacity factor and investment cost* and (right) as a function of capacity factor and discount rate**.
Notes: * Discount rate assumed to equal 7%. ** Onshore investment cost assumed at USD2005 1,750/kW, and offshore at USD2005 3,900/kW.
Leve
lized
Cos
t of
Ene
rgy
[USc
ent 20
05 /k
Wh]
15 20 30 40 5035 45
Capacity Factor [%]
0
5
10
15
20
35
30
25Onshore Discount Rate = 10%
Onshore Discount Rate = 7%
Onshore Discount Rate = 3%
Offshore Discount Rate = 10%
Offshore Discount Rate = 7%
Offshore Discount Rate = 3%
25

589
Chapter 7 Wind Energy
Table 7.5 | Summary of learning curve literature for onshore wind energy.
Authors
Learning By Doing Rate
(%)
Global or National
Data YearsIndependent Variable (cumulative capacity)
Dependent Variable
Neij (1997) 4 Denmark3 Denmark (turbine cost) 1982–1995
Mackay and Probert (1998) 14 USA USA (turbine cost) 1981–1996
Neij (1999) 8 Denmark3 Denmark (turbine cost) 1982–1997
Wene (2000) 32 USA2 USA (generation cost) 1985–1994
Wene (2000) 18 EU2 EU (generation cost) 1980–1995
Miketa and Schrattenholzer (2004)1 10 Global Global (investment cost) 1971–1997
Junginger et al. (2005) 19 Global UK (investment cost) 1992–2001
Junginger et al. (2005) 15 Global Spain (investment cost) 1990–2001
Klaassen et al. (2005)1 5 Germany, Denmark, and UK Germany, Denmark, and UK (investment cost) 1986–2000
Kobos et al. (2006)1 14 Global Global (investment cost) 1981–1997
Jamasb (2007)1 13 Global Global (investment cost) 1980–1998
Söderholm and Sundqvist (2007) 5 Germany, Denmark, and UK Germany, Denmark, and UK (investment cost) 1986–2000
Söderholm and Sundqvist (2007)1 4 Germany, Denmark, and UK Germany, Denmark, and UK (investment cost) 1986–2000
Neij (2008) 17 Denmark Denmark (generation cost) 1981–2000
Kahouli-Brahmi (2009) 17 Global Global (investment cost) 1979–1997
Nemet (2009) 11 Global California (investment cost) 1981–2004
Ek and Söderholm (2010)1 17 GlobalGermany, Denmark, Spain, Sweden, and UK (investment cost)
1986–2002
Wiser and Bolinger (2010) 9 Global USA (investment cost) 1982–2009
Notes: 1. Two-factor learning curve that also includes R&D; others are one-factor learning curves. 2. Independent variable is cumulative production of electricity. 3. Cumulative turbine production used as independent variable; others use cumulative installations.
shallow water. Where the exploitable onshore wind resource is limited, however, offshore plants can sometimes compete with onshore plants.
7.8.4 Potential for further reductions in the cost of wind energy
The wind energy industry has developed over a period of 30 years. Though the dramatic cost reductions seen in past decades will not con-tinue indefi nitely, the potential for further reductions remains given the many potential areas of technological advances described in Section 7.7. This potential spans both on- and offshore wind energy technol-ogies; given the relatively less mature state of offshore wind energy, however, greater cost reductions can be expected in that segment. Two approaches are commonly used to forecast the future cost of wind energy, often in concert with some degree of expert judgement: (1) learning curve estimates that assume that future wind energy costs will follow a trajectory that is similar to an historical learning curve based on past costs; and (2) engineering-based estimates of the specifi c cost reduction possibilities associated with new or improved wind energy technologies or manufacturing capabilities (Mukora et al., 2009).
7.8.4.1 Learning curve estimates
Learning curves have been used extensively to understand past cost trends and to forecast future cost reductions for a variety of energy tech-nologies (e.g., McDonald and Schrattenholzer, 2001; Kahouli-Brahmi, 2009; Junginger et al., 2010). Learning curves start with the premise that increases in the cumulative production of a given technology lead to a reduction in its costs. The principal parameter calculated by learn-ing curve studies is the learning rate: for every doubling of cumulative production or installation, the learning rate specifi es the associated percentage reduction in costs. Section 10.5 provides a more general dis-cussion of learning curves as applied to renewable energy.
A number of published studies have evaluated historical learning rates for onshore wind energy (Table 7.5 provides a selective summary of the available literature).50 The wide variation in results can be explained by differences in learning model specifi cation (e.g., one-factor or multi-factor learning curves), variable selection and assumed system boundaries (e.g., whether investment cost, turbine cost, or levelized energy costs are explained, whether global or country-level cumulative installations are used, or whether country-level turbine production is used rather than
50 It is too early to develop a meaningful learning curve for offshore wind energy based on actual data from offshore plants. Studies have sometimes used learning rates to estimate future offshore costs, but those learning rates have typically been synthe-sized based on judgment and on learning rates for related industries and offshore subsystems (e.g., Junginger et al., 2004; Carbon Trust, 2008b).

590
Wind Energy Chapter 7
installed wind power capacity), data quality, and the time period over which data are available. Because of these and other differences, the learning rates for wind energy presented in Table 7.5 range from 4 to 32%, but need special attention to be accurately interpreted and com-pared. Focusing only on the smaller set of studies completed in 2004 and later that have prepared estimates of learning curves based on total wind power plant investment costs and global cumulative installations, the range of learning rates narrows to 9 to 19%; the lowest fi gure within this range (9%) is the only one that includes data from 2004 to 2009, a period of increasing wind power plant investment costs.
There are also a number of limitations to the use of such models to forecast future costs (e.g., Junginger et al., 2010). First, learning curves typically (and simplistically) model how costs have decreased with increased installations in the past, but do not comprehensively explain the reasons behind the decrease (Mukora et al., 2009). In reality, costs may decline in part due to traditional learning and in part due to other fac-tors, such as R&D expenditure and increases in turbine, power plant, and manufacturing facility size. Learning rate estimates that do not account for such factors may suffer from omitted variable bias, and may therefore be inaccurate. Second, if learning curves are used to forecast future cost trends, not only should the other factors that may infl uence costs be considered, but one must also assume that learning rates derived from historical data can be appropriately used to estimate future trends. As technologies mature, however, diminishing returns in cost reduction can be expected, and learning rates may fall (Arrow, 1962; Ferioli et al., 2009; Nemet, 2009). Third, the most appropriate cost measure for wind energy is arguably the levelized cost of energy, as wind energy generation costs are affected by investment costs, O&M costs and energy produc-tion (EWEA, 2009; Ferioli et al., 2009). Unfortunately, only two of the published studies calculate the learning rate for wind energy using a lev-elized cost of energy metric (Wene, 2000; Neij, 2008); most studies have used the more readily available metrics of investment cost or turbine cost. Fourth, a number of the published studies have sought to explain cost trends based on cumulative wind power capacity installations or production in individual countries or regions of the world; because the wind energy industry is global in scope, however, it is likely that much of the learning is now occurring based on cumulative global installa-tions (e.g., Ek and Söderholm, 2010). Finally, from 2004 through 2009, wind turbine and power plant investment costs increased substantially, countering the effects of learning, in part due to materials and labour price increases and in part due to increased manufacturer profi tability. Because production cost data are not generally publicly available, learn-ing curve estimates typically rely upon price data that can be impacted by changes in materials costs and manufacturer profi tability, resulting in the possibility of poorly estimated learning rates if dynamic price effects are not considered (Yu et al., 2011).
7.8.4.2 Engineering model estimates
Whereas learning curves examine aggregate historical data to forecast future trends, engineering-based models focus on the possible cost
reductions associated with specifi c design changes and/or technical advances. Though limitations to engineering-based approaches also exist (Mukora et al., 2009), these models can lend support to learning curve predictions by defi ning the technology advances that can yield cost reductions and/or energy production increases.
These models have been used to estimate the impact of potential tech-nology improvements on wind power plant investment costs and energy production, as highlighted in Section 7.7. Given the possible technol-ogy advances (in combination with manufacturing learning) discussed earlier, the US DOE (2008) estimates that onshore wind energy invest-ment costs may decline by 10% by 2030, while energy production may increase by roughly 15%, relative to a 2008 starting point (see Table 7.3, and the note under that table).
There is arguably greater potential for technical advances in offshore than in onshore wind energy technology (see Section 7.7), particularly in foun-dation design, electrical system design and O&M costs. Larger offshore wind power plants are also expected to trigger more effi cient installation procedures and dedicated vessels, enabling lower costs. Future levelized cost of energy reductions have sometimes been estimated by associating potential cost reductions with these technical improvements, sometimes relying on subsystem-level learning curve estimates from other indus-tries (e.g., Junginger et al., 2004; Carbon Trust, 2008b).
7.8.4.3 Projected levelized cost of wind energy
A number of studies have developed forecasted cost trajectories for on- and offshore wind energy based on differing combinations of learning curve estimates, engineering models, and/or expert judgement. These estimates are sometimes—but not always—linked to certain levels of assumed wind energy deployment. Representative examples of this lit-erature include Junginger et al. (2004), Carbon Trust (2008b), IEA (2008, 2010b, 2010c), US DOE (2008), EWEA (2009), Lemming et al. (2009), Teske et al. (2010), GWEC and GPI (2010) and UKERC (2010).
Recognizing that the starting year of the forecasts, the methodologi-cal approaches used, and the assumed deployment levels vary, these recent studies nonetheless support a range of levelized cost of energy reductions for onshore wind of 10 to 30% by 2020, and for offshore wind of 10 to 40% by 2020. Some studies focused on offshore wind energy technology even identify scenarios in which market factors lead to continued increases in the cost of offshore wind energy, at least in the near to medium term (BWEA and Garrad Hassan, 2009; UKERC, 2010). Longer-term projections are more reliant on assumed deployment levels and are subject to greater uncertainties, but for 2030, the same studies support reductions in the levelized cost of onshore wind energy of 15 to 35% and of offshore wind energy of 20 to 45%.
Using these estimates for the expected percentage cost reduction in levelized cost of energy, levelized cost trajectories for on- and offshore wind energy can be developed. Because longer-term cost projections

591
Chapter 7 Wind Energy
unlikely to constrain further deployment (Section 7.2). Onshore wind energy technology is already being deployed at a rapid pace (Sections 7.3 and 7.4), therefore offering an immediate option for reducing GHG emissions in the electricity sector. In good to excellent wind resource regimes, the generation cost of onshore wind energy averages US cents2005 5 to 10/kWh (Section 7.8), and no insurmountable technical barriers exist that preclude increased levels of wind energy penetration into electricity supply systems (Section 7.5). Continued technology advances and cost reduc-tions in on- and offshore wind energy are expected (Sections 7.7 and 7.8), further improving the GHG emissions reduction potential of wind energy over the long term.
This section begins by highlighting near-term forecasts for wind energy deploy-ment (Section 7.9.1). It then discusses the prospects for and barriers to wind energy deployment in the longer term and the potential role of that deploy-ment in reaching various GHG concentration stabilization levels (Section 7.9.2). Both subsections are largely based on energy market forecasts and GHG and energy scenarios literature published between 2007 and 2010. The section ends with brief conclusions (Section 7.9.3). Though the focus of this section is on larger on- and offshore wind turbines for electricity production, as discussed in Box 7.1, alternative technologies and applications for wind energy also exist.
7.9.1 Near-term forecasts
The rapid increase in global wind power capacity from 2000 to 2009 is expected by many studies to continue in the near to medium term (Table 7.6). From the roughly 160 GW of wind power capacity installed by the end of 2009, the IEA (2010b) ‘New Policies’ scenario and the EIA (2010) ‘Reference case’ scenario predict growth to 358 GW (fore-casted electricity generation of 2.7 EJ/yr) and 277 GW (forecasted electricity generation of 2.5 EJ/yr) by 2015, respectively. Wind energy industry organizations predict even faster deployment rates, noting that past IEA and EIA forecasts have understated actual growth by a sizable margin (BTM, 2010; GWEC, 2010a). However, even these more aggressive forecasts estimate that wind energy will contribute less than 5% of global electricity supply by 2015. Asia, North America and Europe are projected to lead in wind power capacity additions over this period.
7.9.2 Long-term deployment in the context of carbon mitigation
A number of studies have tried to assess the longer-term potential of wind energy, often in the context of GHG concentration stabiliza-tion scenarios. As a variable, location-dependent resource with limited dispatchability, modelling the economics of wind energy expansion presents unique challenges (e.g., Neuhoff et al., 2008). The resulting dif-ferences among studies of the long-term deployment of wind energy may therefore refl ect not just varying input assumptions and assumed policy and institutional contexts, but also differing modelling or scenario analysis approaches.
are inherently more uncertain and depend, in part, on deployment lev-els and R&D expenditures that are also uncertain, the focus here is on relatively nearer-term cost projections to 2020. Specifi cally, Section 7.8.3.4 reported 2009 levelized cost of energy estimates for onshore wind energy of roughly US cents2005 5 to 15/kWh, whereas estimates for offshore wind energy were in the range of US cents2005 10 to 20/kWh. Conservatively, the percentage cost reductions reported above can be applied to these estimated 2009 levelized generation cost values to develop low and high projections for future levelized generation costs.51
Based on these assumptions, the levelized generation cost of onshore wind energy could range from roughly US cents2005 3.5 to 10.5/kWh by 2020 in a high cost-reduction case (30% by 2020), and from US cents2005 4.5 to 13.5/kWh in a low cost-reduction case (10% by 2020). Offshore wind energy is often anticipated to experience somewhat deeper cost reductions, with levelized generation costs that range from roughly US cents2005 6 to 12/kWh by 2020 in a high cost-reduction case (40% by 2020) to US cents2005 9 to 18/kWh in a low cost-reduction case (10% by 2020).52
Uncertainty exists over future wind energy costs, and the range of costs associated with varied wind resource strength introduces greater uncertainty. As installed wind power capacity increases, higher-quality resource sites will tend to be utilized fi rst, leaving higher-cost sites for later development. As a result, the average levelized cost of wind energy will depend on the amount of deployment, not only due to learning effects, but also because of resource exhaustion. This ‘supply-curve’ effect is not captured in the estimates presented above. The estimates presented here therefore provide an indication of the technology advancement potential for on- and offshore wind energy, but should be used with some caution.
7.9 Potential deployment53
Wind energy offers signifi cant potential for near- and long-term GHG emissions reductions. The wind power capacity installed by the end of 2009 was capable of meeting roughly 1.8% of worldwide electricity demand and, as presented in this section, that contribution could grow to in excess of 20% by 2050. On a global basis, the wind resource is
51 Because of the cost drivers discussed earlier in this section, wind energy costs in 2009 were higher than in some previous years. Applying the percentage cost reduc-tions from the available literature to the 2009 starting point is, therefore, arguably a conservative approach to estimating future cost reduction possibilities; an alternative approach would be to use the absolute values of the cost estimates provided by the available literature. As a result, and also due to the underlying uncertainty associated with projections of this nature, future costs outside of the ranges presented here are possible.
52 As mentioned earlier, the 2009 starting point values for offshore wind energy are
consistent with recently built or planned plants located in relatively shallow water.
53 Complementary perspectives on potential deployment based on a comprehensive assessment of numerous model-based scenarios of the energy system are presented in Sections 10.2 and 10.3 of this report.

592
Wind Energy Chapter 7
The IPCC’s Fourth Assessment Report assumed that on- and offshore wind energy could contribute 7% of global electricity supply by 2030, or 8 EJ/yr (2,200 TWh/yr) (IPCC, 2007). Not surprisingly, this fi gure is higher than some commonly cited business-as-usual, reference-case forecasts (the IPCC estimate is not a business-as-usual case, but was instead developed within the context of efforts to mitigate global climate change). The IEA’s World Energy Outlook ‘Current Policies’ scenario, for example, shows wind energy increasing to 6.0 EJ/yr (1,650 TWh/yr) by 2030, or 4.8% of global electricity supply (IEA, 2010b).54 The US Energy Information Administration (EIA) forecasts 4.6 EJ/yr (1,200 TWh/yr) of wind energy in its 2030 reference case projection, or 3.9% of net elec-tricity production from central producers (EIA, 2010).
A summary of the literature on the possible future contribution of RE supplies in meeting global energy needs under a range of GHG con-centration stabilization scenarios is provided in Chapter 10. Focusing specifi cally on wind energy, Figures 7.24 and 7.25 present modelling results for the global supply of wind energy, in EJ/yr and as a percent of global electricity supply, respectively. About 150 different long-term scenarios underlie Figures 7.24 and 7.25. These scenario results derive from a diversity of modelling teams, and span a wide range of assump-tions for—among other variables—electricity demand growth, the cost and availability of competing low-carbon technologies, and the cost and availability of RE technologies (including wind energy). Chapter 10 dis-cusses how changes in some of these variables impact RE deployment outcomes, with Section 10.2.2 providing a description of the literature from which the scenarios have been taken. In Figures 7.24 and 7.25, the wind energy deployment results under these scenarios for 2020, 2030 and 2050 are presented for three GHG concentration stabilization ranges, based on the IPCC’s Fourth Assessment Report: Baselines (>600 ppm CO2), Categories III and IV (440 to 600 ppm) and Categories I and II (<440 ppm), all by 2100. Results are presented for the median scenario, the 25th to 75th percentile range among the scenarios, and the mini-mum and maximum scenario results.55
54 The IEA (2010b) ‘Current Policies’ scenario only refl ects existing government policies, and is most similar to past IEA ‘Reference case’ forecasts. IEA (2010b) also presents a ‘New Policies’ scenario, in which stated government commitments are also consid-ered, and in that instance wind energy grows to 8.2 EJ/yr (2,280 TWh/yr) by 2030, or 7% of global electricity supply.
55 In scenario ensemble analyses such as the review underlying the fi gures, there is a
constant tension between the fact that the scenarios are not truly a random sample and the sense that the variation in the scenarios does still provide real and often clear insights into collective knowledge or lack of knowledge about the future (see Section 10.2.1.2 for a more detailed discussion).
The baseline, or reference-case projections of wind energy’s role in global energy supply span a broad range, but with a median among the reviewed scenarios of roughly 3 EJ/yr in 2020 (800 TWh/yr), 5 EJ/yr in 2030 (1,500 TWh/yr) and 16 EJ/yr in 2050 (4,400 TWh/yr) (Figure 7.24). Substantial growth of wind energy is therefore projected to occur even in the absence of climate change mitigation policies, with wind energy’s median contribution to global electricity supply rising to nearly 9% by 2050 (Figure 7.25). Moreover, the contribution of wind energy grows as GHG reduction policies are assumed to become more stringent: by 2030, wind energy’s median contribution among the reviewed scenarios equals roughly 11 EJ/yr (~9 to 10% of global electricity supply; 3,000 to 3,100 TWh/yr) in the 440 to 600 and <440 ppm CO2 concentration stabilization ranges, increasing to 23 to 27 EJ/yr by 2050 (~13 to 14% of global electricity supply; 6,500 to 7,600 TWh/yr).56
The diversity of approaches and assumptions used to generate these scenarios is great, however, and results in a wide range of fi ndings. Baseline case results for global wind energy supply in 2050 range from 2 to 58 EJ/yr (median of 16 EJ/yr), or 1 to 27% (median of 9%) of global electricity supply (500 to 16,200 TWh/yr). In the most stringent <440 ppm stabilization scenarios, wind energy supply in 2050 ranges from 7 to 113 EJ/yr (median of 27 EJ/yr), equivalent to 3 to 51% (median of 13%) of global electricity supply (2,000 to 31,500 TWh/yr).
Despite this wide range, the IPCC (2007) estimate for potential wind energy supply of roughly 8 EJ/yr (2,200 TWh/yr) by 2030 (which was largely based on literature available through 2005) appears somewhat conservative compared to the more recent scenarios literature presented here. Other recent forecasts of the possible role of wind energy in meeting global energy demands by RE organizations confi rm this assessment, as the IPCC (2007) estimate is roughly one-third to one-half that shown in GWEC and GPI (2010) and Lemming et al. (2009). The IPCC (2007) esti-mate is more consistent with the IEA World Energy Outlook in its ‘New Policies’ scenario, but is 30% lower than that shown in the IEA’s 450 ppm scenario (IEA, 2010b).
56 In addition to the global scenarios literature, a growing body of work has sought to understand the technical and economic limits of wind energy deployment in regional electricity systems. These studies have sometimes evaluated higher levels of deploy-ment than contemplated by the global scenarios, and have often used more sophisti-cated modelling tools. For a summary of a subset of these scenarios, see Martinot et al. (2007); examples of studies of this type include Deutsche Energie-Agentur (2005) (Germany); EC (2006); Nikolaev et al. (2008, 2010) (Russia); and US DOE (2008) (USA). In general, these studies confi rm the basic fi ndings from the global scenarios literature: wind energy deployment to 10% of global electricity supply and then to 20% or more is plausible, assuming that cost and policy factors are favourable.
Table 7.6 | Near-term global wind energy forecasts.
StudyWind Energy Forecast
Installed Capacity (GW) Generation (EJ/yr) Percent of Global Electricity Supply (%) Year
IEA (2010b)1 358 2.7 3.1 2015
EIA (2010)2 277 2.5 3.1 2015
GWEC (2010a) 409 N/A N/A 2014
BTM (2010) 448 3.4 4.0 2014
Notes: 1. ‘New Policies’ scenario. 2. ‘Reference case’ scenario.

593
Chapter 7 Wind Energy
Though the literature summarized in Figures 7.24 and 7.25 shows an increase in wind energy with increasingly low GHG concentration stabili-zation levels, that impact is not as great as it is for biomass, geothermal and solar energy, where increasingly stringent GHG concentration stabili-zation ranges lead to more dramatic increases in technology deployment (see Chapter 10). One explanation for this result is that on shore wind energy is already comparatively economically competitive; as a result, continued deployment is predicted even in the absence of aggressive efforts to reduce GHG emissions.
The scenarios literature also shows that wind energy could play a sig-nifi cant long-term role in reducing global GHG emissions: by 2050, the
median contribution of wind energy in the two GHG concentration stabili-zation scenarios is 23 to 27 EJ/yr (6,500 to 7,600 TWh/yr), increasing to 45 to 47 EJ/yr at the 75th percentile (12,400 to 12,900 TWh/yr), and to more than 100 EJ/yr in the highest scenario (31,500 TWh/yr). Achieving this con-tribution would require wind energy to deliver around 13 to 14% of global electricity supply by 2050 in the median scenario result, and 21 to 25% at the 75th percentile of the reviewed scenarios. By 2030, the corresponding wind electricity penetration levels are 9 to 10% in the median scenario result, increasing to 23 to 24% at the 75th percentile of the reviewed scenarios. Scenarios generated by wind energy and RE organizations are consistent with this median to 75th percentile range; Lemming et al. (2009), Teske et al. (2010), and GWEC and GPI (2010), for example, estimate the possibility of 31 to 39 EJ/yr (8,500 to 10,800 TWh/yr) of wind energy by 2050.
To achieve these levels of deployment, policies to reduce GHG emissions and/or increase RE supplies would likely be necessary, and those policies would need to be of adequate economic attractiveness and predictability to motivate substantial private investment (see Chapter 11). A variety of other possible challenges to aggressive wind energy growth also deserve discussion.
Resource Potential: Even the highest estimates for long-term wind energy supply in Figure 7.24 are below the global technical potential esti-mates for wind energy presented in Section 7.2, suggesting that—on a global basis, at least—technical potential is unlikely to be a limiting factor to wind energy deployment. Moreover, ample technical potential exists in most regions of the world to enable signifi cant wind energy deployment relative to current levels. In certain countries or regions, however, higher deployment levels will begin to constrain the most economical resource supply, and wind energy will therefore not contribute equally in meeting the needs of every country.
Regional Deployment: Wind energy would need to expand beyond its historical base in Europe and, increasingly, the USA and China. The IEA WEO ‘Current Policies’ scenario projects the majority of wind energy deployment by 2035 to come from OECD Europe (36%), with lesser but still signifi cant quantities from OECD North America (24%) and portions of non-OECD Asia (e.g., 18% in China and 4% in India) (IEA, 2010b). Under higher-penetration scenarios, however, a greater geographic dis-tribution of wind energy deployment is likely to be needed. Scenarios from Teske et al. (2010), GWEC and GPI (2010) and IEA (2010c), for example, show non-OECD Asia (especially China), OECD North America, and OECD Europe to be the areas of greatest wind energy deployment, but also identify a number of other regions that are projected to be signifi cant contributors to wind energy growth in high-penetration sce-narios (Table 7.7).57 Enabling this level of wind energy deployment in regions new to wind energy would be a challenge, and would benefi t from institutional and technical knowledge transfer from those regions
57 Many of these other regions have lower expected electricity demands. As a result, some of the regions that are projected to make a small contribution to global wind electricity supply are still projected to obtain a sizable fraction of their own electricity supply from wind energy.
Figure 7.24 | Global primary energy supply of wind energy in long-term scenarios (median, 25th to 75th percentile range, and full range of scenario results; colour coding is based on categories of atmospheric CO2 concentration level in 2100; the specifi c number of scenarios underlying the fi gure is indicated in the right upper corner) (adapted from Krey and Clarke, 2011; see also Chapter 10).
Glo
bal W
ind
Prim
ary
Ener
gy S
uppl
y [E
J/yr
]
CO2 Concentration Levels
Baselines
N=152
Cat. III + IV (440 - 600 ppm)
Cat. I + II (< 440 ppm)
0
20
60
40
80
100
120
2020 2030 2050
Figure 7.25 | Wind electricity share in total global electricity supply in long-term sce-narios (median, 25th to 75th percentile range, and full range of scenario results; colour coding is based on categories of atmospheric CO2 concentration level in 2100; the specifi c number of scenarios underlying the fi gure is indicated in the right upper corner) (adapted from Krey and Clarke, 2011; see also Chapter 10).
Win
d En
ergy
as
a Pr
opor
tion
of
Glo
bal E
lect
rici
ty S
uppl
y [%
]
CO2 Concentration Levels
Baselines
N=149
Cat. III + IV (440 - 600 ppm)
Cat. I + II (< 440 ppm)
0
10
30
20
40
50
2020 2030 2050

594
Wind Energy Chapter 7
energy technology given its less mature state compared to onshore wind energy (see Section 7.7).
Integration and Transmission: Proactive technical and institutional solutions to transmission constraints and operational integration concerns will need to be implemented. Analysis results and expe-rience suggest that many electric systems can operate with up to roughly 20% wind energy with relatively modest integration costs (see Section 7.5 and Chapter 8). Additional studies have looked at wind electricity penetrations in excess of 20%, often using some-what less-detailed analysis procedures than formal wind energy integration studies, and often involving the use of structural change in generation portfolios, electrical or thermal storage, plug-in hybrid vehicles and the electrifi cation of transportation, demand response, and/or other technologies to manage the variability of wind power out-put (e.g., Grubb, 1991; Watson et al., 1994; Lund and Münster, 2003; Kempton and Tomic, 2005; Black and Strbac, 2006; DeCarolis and Keith, 2006; Denholm, 2006; Lund, 2006; Cavallo, 2007; Greenblatt et al., 2007; Hoogwijk et al., 2007; Benitez et al., 2008; Lamont, 2008; Leighty, 2008; Lund and Kempton, 2008; Kiviluoma and Meibom, 2010). These studies generally confi rm that there are no insurmountable techni-cal barriers to increased wind energy supply; instead, as deployment increases, transmission expansion and operational integration costs also increase, constraining growth on economic terms. These studies also fi nd that new technical solutions that are not otherwise required at lower levels of wind energy deployment, such as expanded use of bulk energy storage and demand response, become increasingly valu-able at higher levels of wind energy. Overall, the concerns about (and the costs of) operational integration and maintaining electric system reliability will grow with wind energy deployment, and efforts to ensure adequate system-wide fl exibility, employ more restrictive grid connec-tion standards, develop and use improved wind forecasting systems, and encourage demand fl exibility and bulk energy storage are warranted.
Table 7.7 | Regional distribution of global wind electricity supply (percentage of total worldwide wind electricity supply).
Region1GWEC and GPI (2010)
2030
‘Advanced’ Scenario
Teske et al. (2010)2050
‘Energy Revolution’ Scenario
(IEA, 2010c)2
2050
‘BLUE Map’ Scenario
Global Supply of Wind Energy 20 EJ/yr (5,400 TWh/yr) 31 EJ/yr (8,500 TWh/yr) 18 EJ/yr (4,900 TWh/yr)
OECD North America 27% 19% 13%
Latin America 4% 9% 8%
OECD Europe 22% 15% 21%
Eastern Europe / Eurasia 4% 8% 4%
OECD Pacifi c 5% 10% 7%
Developing Asia 35% 34% 39%
Africa 3% 2% 2%
Middle East 1% 3% 5%
Notes: 1. Regions are defi ned by each study, except that: GWEC and GPI (2010) estimates for ‘Non-OECD Asia’ are placed under ‘Developing Asia’; IEA (2010c) estimates for ‘U.S.’ and ‘Other OECD North America’ are consolidated under ‘OECD North America’ while estimates for ‘Eastern EU and Former Soviet Union’ are placed under ‘Eastern Europe / Eurasia’; and Teske et al. (2010) estimates for ‘Transition Economies’ are placed under ‘Eastern Europe / Eurasia’. For all three studies, results for China and India are consolidated under ‘Developing Asia’. (See also Annex II for defi nitions of regions and country groupings.) 2. For IEA (2010c), the percentage of worldwide wind power capacity investment through 2050 is presented.
that are already witnessing substantial wind energy activity (e.g., Lewis, 2007; IEA, 2009).
Supply Chain Issues: While short-term constraints will need to be addressed, no insurmountable long-term constraints to materials supply, labour availability, installation infrastructure or manufacturing capac-ity appear likely if policy frameworks for wind energy are suffi ciently economically attractive and predictable (e.g., US DOE, 2008). The wind energy industry has scaled up rapidly over the last decades, resulting in greater globalization and competition throughout the supply chain (see Section 7.4). Supply-chain challenges have included the availabil-ity of skilled personnel and turbine component manufacturing, as well as turbine supply and installation infrastructure especially for offshore wind power plants (see Section 7.8). Nonetheless, annual additions and manufacturing volume reached 38 GW in 2009, and the signifi cant further supply-chain scaling needed to meet the increased demands of higher-penetration scenarios (see also Section 10.3) appears challeng-ing, but feasible in the long term.
Technology and Economics: Due to resource and siting constraints in some countries and regions, greater reliance on offshore wind energy, particularly in Europe, is likely to be required. Lemming et al. (2009) esti-mate that the proportion of total global wind energy supply likely to be delivered from offshore wind energy in 2050 is 18%, whereas the IEA’s Energy Technology Perspectives BLUE Map Scenario forecasts a 32% share in capacity terms (IEA, 2010c). In another set of forecasts pro-vided in the IEA’s World Energy Outlook, offshore wind power capacity represents 15 to 24% of total wind power capacity by 2035, depend-ing on the scenario (IEA, 2010b). Increases in offshore wind energy of this magnitude would require technological advances and cost reduc-tions. Though R&D is expected to lead to incremental cost reductions for onshore wind energy technology, enhanced R&D expenditures by government and industry may be especially important for offshore wind

595
Chapter 7 Wind Energy
Moreover, given the locational dependence of the wind resource, sub-stantial new transmission infrastructure both on- and offshore would be required under even the more modest wind energy deployment scenarios presented earlier. Both cost and institutional barriers would need to be overcome to develop this needed transmission infrastructure (see Section 7.5 and Chapters 8 and 11).
Social and Environmental Concerns: Finally, given concerns about the social and environmental impacts of wind power plants summarized in Section 7.6, efforts to better understand the nature and magnitude of these impacts, together with efforts to minimize and mitigate those impacts, will need to be pursued in concert with increasing wind energy deployment. Prominent environmental concerns about wind energy include bird and bat collision fatalities and habitat and ecosystem modi-fi cations, while prominent social concerns include visibility and landscape impacts as well as various nuisance effects and possible radar interfer-ence. As wind energy deployment increases globally and regionally and as larger wind power plants are considered, existing concerns may become more acute and new concerns may arise. Though community and scien-tifi c concerns need to be addressed, more proactive planning, siting and permitting procedures for both on- and offshore wind energy may be
required to enable the wind energy deployment envisioned under these scenarios (see also Chapter 11).
7.9.3 Conclusions regarding deployment
The literature presented in this section suggests that wind electricity pen-etration levels that approach or exceed 10% of global electricity supply by 2030 are feasible, assuming that cost and policy factors are favourable towards wind energy deployment. The scenarios further suggest that even more ambitious policies and/or technology improvements may allow wind energy to reach or exceed 20% of global electricity supply by 2050, and that these levels of supply may be economically attractive within the context of global climate change mitigation scenarios. However, a variety of challenges would need to be overcome if wind energy was to achieve these aggres-sive levels of penetration. In particular, the degree to which wind energy is utilized in the future will largely depend on: the economics of wind energy compared to alternative power sources; policies to directly or indirectly sup-port wind energy deployment; local siting and permitting challenges; and real or perceived concerns about the ability to integrate wind energy into electric supply systems.

596
Wind Energy Chapter 7
References
3TIER (2009). The First Look Global Wind Dataset: Annual Mean Validation. 3TIER,
Seattle, WA, USA, 10 pp.
Ackermann, T. (ed.) (2005). Wind Power in Power Systems. John Wiley and Sons,
London, UK.
Ackermann, T., and L. Soder (2002). An overview of wind energy-status 2002.
Renewable and Sustainable Energy Reviews, 6, pp. 67-127.
Agnolucci, P. (2007). The effect of fi nancial constraints, technological progress
and long-term contracts on tradable green certifi cates. Energy Policy, 35, pp.
3347-3359.
AIGS (2008). All Island Grid Study (AIGS). Workstream 4: Analysis of Impacts and
Benefi ts. Department of Communications, Energy and Natural Resources, Dublin,
Ireland and UK Department of Enterprise, Trade and Investment, London, UK,
88 pp.
Allen, S.R., G.P. Hammond, and M.C. McManus (2008). Prospects for and barriers
to domestic micro-generation: A United Kingdom perspective. Applied Energy,
85, pp. 528-544.
Alves-Pereira, M., and C. Branco (2007). In-home wind turbine noise is conducive
to vibroacoustic disease. Presented at the Second International Meeting on Wind
Turbine Noise INCE/Europe, Lyon, France, 20-21 September, 2007.
Al-Yahyai, S., Y. Charabi, and A. Gastli (2010). Review of the use of Numerical
Weather Prediction (NWP) Models for wind energy assessment. Renewable and
Sustainable Energy Reviews, 14, pp. 3192-3198.
Amelin, M. (2009). Comparison of capacity credit calculation methods for
conventional power plants and wind power. IEEE Transactions on Power Systems,
24, pp. 685-691.
Andersen, P.B., C.B. Mac Gaunaa, and T. Buhl (2006). Load alleviation on
wind turbine blades using variable airfoil geometry. In: 2006 European Wind
Energy Conference and Exhibition Proceedings, Athens, Greece, 27 February –
2 March 2006.
Apt, J. (2007). The spectrum of power from wind turbines. Journal of Power Sources,
169, pp. 369-374.
Archer, C.L., and M.Z. Jacobson (2005). Evaluation of global wind power. Journal
of Geophysical Research, 110, D12110.
Archer, C., and K. Caldeira (2009). Global assessment of high-altitude wind power.
Energies, 2, pp. 307-319.
Argatov, I., and R. Silvennoinen (2010). Energy conversion effi ciency of the
pumping kite wind generator. Renewable Energy, 35, pp. 1052-1060.
Argatov, I., P. Rautakorpi, and R. Silvennoinen (2009). Estimation of the
mechanical energy output of the kite wind generator. Renewable Energy, 34,
pp. 1525-1532.
Arnett, E.B., W.K. Brown, W.P. Erickson, J.K. Fiedler, B.L. Hamilton, T.H. Henry, A.
Jain, G.D. Johnson, J. Kerns, and R.R. Koford (2008). Patterns of bat fatalities
at wind energy facilities in North America. Journal of Wildlife Management, 72,
pp. 61-78.
Arnett, E.B., M.M.P. Huso, M.R. Schirmacher, and J.P. Hayes (2011). Altering
turbine speed reduces bat mortality at wind-energy facilities. Frontiers in Ecology
and the Environment, 9(4), pp. 209-214.
Arrow, K.J. (1962). The economic implications of learning by doing. The Review of
Economic Studies, 29, pp. 155-173.
Ashwill, T.D. (2009). Materials and innovations for large blade structures: research
opportunities in wind energy technology. In: 50th AIAA/ASME/ASCE/AHS/ASC
Structures, Structural Dynamics, and Materials Conference. Palm Springs, CA,
USA, 4-7 May 2009, American Institute of Aeronautics and Astronautics, 20 pp.
Auer, H., M. Stadler, G. Resch, C. Huber, T. Schuster, H. Taus, L.H. Nielsen, J.
Twidell, and D.J. Swider (2004). Cost and Technical Constraints of RES-E
Grid Integration: Working package 2. European Commission, Brussels, Belgium,
82 pp.
AWEA (2008). Wind Energy Siting Handbook. American Wind Energy Association,
Washington, DC, USA, 183 pp.
AWEA (2009). AWEA Small Wind Turbine Global Market Study: Year Ending 2008.
American Wind Energy Association, Washington, DC, USA, 24 pp.
Baerwald, E.F., J. Edworthy, M. Holder, and R.M.R. Barclay (2009). A large-scale
mitigation experiment to reduce bat fatalities at wind energy facilities. Journal of
Wildlife Management, 73, pp. 1077-1082.
Baidya, R.S., and J.J. Traiteur (2010). Impacts of wind farms on surface air
temperatures. Proceedings of the National Academy of Sciences, 107, pp. 17899-
17904.
Banta, R.M., Y.L. Pichugina, and R.K. Newsom (2003). Relationship between
low-level jet properties and turbulence kinetic energy in the nocturnal stable
boundary layer. Journal of the Atmospheric Sciences, 60, pp. 2549-2555.
Barclay, R.M.R., E.F. Baerwald, and J.C. Gruver (2007). Variation in bat and bird
fatalities at wind energy facilities: assessing the effects of rotor size and tower
height. Canadian Journal of Zoology, 85, pp. 381-387.
Barrios, L., and A. Rodriguez (2004). Behavioral and environmental correlates of
soaring bird mortality at onshore wind turbines. Journal of Applied Ecology, 41,
pp. 72-81.
Barthelmie, R.J., and L.E. Jensen (2010). Evaluation of wind farm effi ciency and
wind turbine wakes at the Nysted offshore wind farm. Wind Energy, 13, pp. 573-
586.
Barthelmie, R.J., G. Larsen, S.C. Pryor, H. Jörgensen, H. Bergström, W. Schlez,
K. Rados, B. Lange, P. Völund, S. Neckelmann, S. Mogensen, G. Schepers,
T. Hegberg, L. Folkerts, and M. Magnusson (2004). ENDOW (effi cient
development of offshore wind farms): Modelling wake and boundary layer
interactions. Wind Energy, 7, pp. 225-245.
Bastasch, M., J. van-Dam, B. Søndergaard, and A. Rogers (2006). Wind turbine
noise – An overview. Canadian Acoustics, 34, pp. 7-15.
Bell, D., T. Gray, and C. Haggett (2005). The ‘social gap’ in wind farm siting
decisions: Explanations and policy responses. Environmental Politics, 14, pp.
460-477.
Bengtsson, L., K.I. Hodges, and N. Keenlyside (2009). Will extratropical storms
intensify in a warmer climate? Journal of Climate, 22, pp. 2276-2301.
Benitez, L.E., P.C. Benitez, and G.C. van Kooten (2008). The economics of wind
power with energy storage. Energy Economics, 30, pp. 1973-1989.
Benjamin, R. (2007). Principles for interregional transmission expansion. The
Electricity Journal, 20, pp. 36-47.
Berg, D.E., D.G. Wilson, M.F. Barone, B.R. Resor, J.C. Berg, J.A. Paquette, J.R. Zayas,
S. Kota, G. Ervin, and D. Maric (2009). The impact of active aerodynamic load
control on fatigue and energy capture at low wind speed sites. In: European Wind
Energy Conference, Marseille, France, 16-19 March 2009, pp. 16-19.
Bergek, A. (2010). Levelling the playing fi eld? The infl uence of national wind power
planning instruments on confl icts of interests in a Swedish county. Energy Policy,
38, pp. 2357-2369.

597
Chapter 7 Wind Energy
Berry, D. (2009). Innovation and the price of wind energy in the US. Energy Policy,
37, pp. 4493-4499.
Bierbooms, W.A.A.M. (1992). A comparison between unsteady aerodynamic
models. Journal of Wind Engineering and Industrial Aerodynamics, 39,
pp. 23-33.
Bird, L., M. Bolinger, T. Gagliano, R. Wiser, M. Brown, and B. Parsons (2005).
Policies and market factors driving wind power development in the United States.
Energy Policy, 33, pp. 1397-1407.
Black and Veatch (2003). Strategic Assessment of the Potential for Renewable
Energy: Stage 1. European Bank for Reconstruction and Development, London,
UK, 163 pp.
Black, M., and G. Strbac (2006). Value of storage in providing balancing services
for electricity generation systems with high wind penetration. Journal of Power
Sources, 162, pp. 949-953.
Blanco, M.I. (2009). The economics of wind energy. Renewable and Sustainable
Energy Reviews, 13, pp. 1372-1382.
Bloom, A., V. Kotroni, and K. Lagouvardos (2008). Climate change impact of
wind energy availability in the Eastern Mediterranean using the regional climate
model PRECIS. Natural Hazards and Earth System Sciences, 8, pp. 1249–1257.
Boccard, N. (2009). Capacity factor of wind power realized values vs. estimates.
Energy Policy, 37, pp. 2679-2688.
Boccard N. (2010). Economic properties of wind power: A European assessment.
Energy Policy, 38, pp. 3232-3244.
Bolinger, M., J. Harper, and M. Karcher (2009). A review of wind project fi nancing
structures in the USA. Wind Energy, 12, pp. 295-309.
Bossanyi, EA. (2003). Individual blade pitch control for load reduction. Wind Energy,
6, pp. 119-128.
Boyle, M.A., and K.A. Kiel (2001). A survey of house price hedonic studies of
the impact of environmental externalities. Journal of Real Estate Literature, 9,
pp. 117-144.
Bradley, J.S. (1994). Annoyance caused by constant-amplitude and amplitude-
modulated sounds containing rumble. Noise Control Engineering Journal, 42, pp.
203-208.
Brenner, M., S. Cazares, M. Cornwall, F. Dyson, D. Eardley, P. Horowitz, D. Long,
J. Sullivan, J. Vesecky, and P. Weinberger (2008). Wind Farms and Radar. US
Department of Homeland Security, McLean, VA, USA, 21 pp.
Breslow, P.B., and D.J. Sailor (2002). Vulnerability of wind power resources to
climate change in the continental United States. Renewable Energy, 27, pp. 585-
598.
Breton, S.P., and G. Moe (2009). Status, plans and technologies for offshore wind
turbines in Europe and North America. Renewable Energy, 34, pp. 646-654.
BTM (2010). International Wind Energy Development. World Market Update 2009.
BTM Consult ApS, Ringkøbing, Denmark, 124 pp.
Budhraja, V.S., F. Mobasheri, J. Ballance, J. Dyer, A. Silverstein, and J. Eto (2009).
Improving electricity resource-planning processes by considering the strategic
benefi ts of transmission. The Electricity Journal, 22, pp. 54-63.
Buhl, T., M. Gaunaa, and C. Bak (2005). Potential load reduction using airfoils with
variable trailing edge geometry. Journal of Solar Energy Engineering, 127, pp.
503-516.
Burke, D.J., and M.J. O’Malley (2010). Maximizing fi rm wind connection to security
constrained transmission networks. IEEE Transactions on Power Systems, 25, pp.
749-759.
Burton, T., D. Sharpe, N. Jenkins, and E. Bossanyi (2001). Wind Energy: Handbook.
J. Wiley, Chichester, UK and New York, NY, USA, 642 pp.
Butler, M.M., and D.A. Johnson (2003). Feasibility of Mitigating the Effects of Wind
Farms on Primary Radar. UK Department of Trade and Industry, London, UK, 210
pp.
BWEA and Garrad Hassan (2009). UK Offshore Wind: Charting the Right Course.
British Wind Energy Association, London, UK, 42 pp.
Byrne, J., A. Zhou, B. Shen, and K. Hughes (2007). Evaluating the potential of
small-scale renewable energy options to meet rural livelihoods needs: A GIS-and
lifecycle cost-based assessment of Western China’s options. Energy Policy, 35,
pp. 4391-4401.
Bywaters, G., V. John, J. Lynch, P. Mattila, G. Norton, J. Stowell, M. Salata,
O. Labath, A. Chertok, and D. Hablanian (2004). Northern Power Systems
WindPACT Drive Train Alternative Design Study Report, Period of Performance:
April 12, 2001 to January 31, 2005. National Renewable Energy Laboratory,
Golden, CO, USA, 404 pp.
Capps, S.B., and C.S. Zender (2010). Estimated global ocean wind power potential
from QuikSCAT observations, accounting for turbine characteristics and siting.
Journal of Geophysical Research, 115, D09101.
Carbon Trust (2008a). Small-scale Wind Energy: Policy Insights and Practical
Guidance. Carbon Trust, London, UK, 108 pp.
Carbon Trust (2008b). Offshore Wind power: Big Challenge, Big Opportunity. The
Carbon Trust, London, UK, 40 pp.
Cavallo, A. (2007). Controllable and affordable utility-scale electricity from
intermittent wind resources and compressed air energy storage (CAES). Energy,
32, pp. 120-127.
Chao, D.D., and C.P. van Dam (2007). Computational aerodynamic analysis of a
blunt trailing edge airfoil modifi cation to the NREL Phase VI rotor. Wind Energy,
10, pp. 529-550.
China Renewable Energy Association (2009). Annual Report of New Energy and
Renewable Energy in China, 2009. China Renewable Energy Association, Beijing,
China.
Christiansen, M.B., and C.B. Hasager (2005). Wake effects of large offshore wind
farms identifi ed from satellite SAR. Remote Sensing of Environment, 98, pp. 251-
268.
Christiansen, M.B., and C.B. Hasager (2006). Using airborne and satellite SAR for
wake mapping offshore. Wind Energy, 9, pp. 437-455.
Claussen, N.E., P. Lundsager, R.J. Barthelmie, H. Holttinen, T. Laakso, and
S.C. Pryor (2007). Wind power. In: Impacts of Climate Change on Renewable
Energy Sources. Their Role in the Nordic Energy System. J. Fenger (ed.), Nordic
Council of Ministers, Copenhagen, Denmark, pp. 105-128.
CMA (2006). The Report of Wind Energy Resource Assessment in China. China
Meteorological Administration, China Meteorological Press, Beijing, China.
CMOH (2010). The Potential Health Impacts of Wind Turbines. Ontario Chief Medical
Offi cer of Health (CMOH), Ontario Ministry of Health and Long-Term Care,
Toronto, Canada, 14 pp.
Costa, A., A. Crespo, J. Navarro, G. Lizcano, H. Madsen, and E. Feitosa (2008). A
review on the young history of the wind power short-term prediction. Renewable
and Sustainable Energy Reviews, 12, pp. 1725-1744.
Coughlan, Y., P. Smith, A. Mullane, and M. O’Malley (2007). Wind turbine
modelling for power system stability analysis—A system operator perspective.
IEEE Transactions on Power Systems, 22, pp. 929-936.

598
Wind Energy Chapter 7
Cryan, P.M., and R.M.R. Barclay RMR (2009). Causes of bat fatalities at
wind turbines: hypotheses and predictions. Journal of Mammalogy, 90, pp.
1330-1340.
Czisch, G., and G. Giebel (2000). A comparison of intra-and extraeuropean options
for an energy supply with wind power. In: Proceedings of Wind Power for the 21st
Century, Kassel, Germany, 25-27 September 2000, pp. 69-73.
De Lucas, M., G.F.E. Janss, and M. Ferrer (2004). The effects of a wind farm on
birds in a migration point: the Strait of Gibraltar. Biodiversity and Conservation,
13, pp. 395-407.
de Lucena, P., A. Frossard, A.S. Szklo, R. Schaeffer, and R.M. Dutra (2009). The
vulnerability of wind power to climate change in Brazil. Renewable Energy, 35,
pp. 904-912.
DeCarolis, J.F., and D.W. Keith (2006). The economics of large-scale wind power in
a carbon constrained world. Energy Policy, 34, pp. 395-410.
Delft University, Garrad Hassan & Partners, Tractebel Energy Engineering, Risø
National Laboratory, Kvaerner Oil & Gas, Energi & Miljoe Undersoegelser
(2001). Concerted Action on Offshore Wind Energy in Europe. Delft University,
Delft, the Netherlands, 289 pp.
Denholm, P. (2006). Improving the technical, environmental and social performance
of wind energy systems using biomass-based energy storage. Renewable Energy,
31, pp. 1355-1370.
Denny, E., and M. O’Malley (2009). The impact of carbon prices on generation-
cycling costs. Energy Policy, 37, pp. 1204-1212.
Denny, E., A. Tuohy, P. Meibom, A. Keane, D. Flynn, A. Mullane, and M. O’Malley
(2010). The impact of increased interconnection on electricity systems with
large penetrations of wind generation: A case study of Ireland and Great Britain.
Energy Policy, 38, pp. 6946-6954.
Des Rosiers, F. (2002). Power lines, visual encumbrance and house values: a
microspatial approach to impact measurement. Journal of Real Estate Research,
23, pp. 275-301.
Desholm, M. (2009). Avian sensitivity to mortality: Prioritising migratory bird species
for assessment at proposed wind farms. Journal of Environmental Management,
90, pp. 2672-2679.
Desholm, M., and J. Kahlert (2005). Avian collision risk at an offshore wind farm.
Biology Letters, 1, pp. 296-298.
Deutsche Energie-Agentur GmbH (2005). Energy Management Planning for the
Integration of Wind Energy into the Grid in Germany, Onshore and Offshore by
2020. Deutsche Energie-Agentur GmbH, Cologne, Germany.
Dinica, V. (2006). Support systems for the diffusion of renewable energy technologies
– investor perspective. Energy Policy, 34, pp. 461-480.
Doherty, R., and M. O’Malley (2005). A new approach to quantify reserve demand
in systems with signifi cant installed wind capacity. IEEE Transactions on Power
Systems, 20, pp. 587-595.
Doherty, R., L. Bryans, P. Gardner, and M. O’Malley (2004). Wind penetration
studies on the island of Ireland. Wind Engineering, 28, pp. 27-41.
Doherty, R., A. Mullane, G. Lalor, and D. Burke (2010). An assessment of the
impact of wind generation on system frequency. IEEE Transactions on Power
Systems, 25, pp. 452-460.
Dong Energy, Vattenfall, Danish Energy Authority, and Danish Forest and
Nature Agency (2006). Danish Offshore Wind: Key Environmental Issues. DONG
Energy, Vattenfall, the Danish Energy Authority and the Danish Forest and Nature
Agency, Copenhagen, Denmark, 142 pp.
Drewitt, A.L., and R.W. Langston (2006). Assessing the impacts of wind farms on
birds. Ibis, 148, pp. 29-42.
Du, Z., and M.S. Selig (1998). A 3-D stall-delay model for horizontal axis wind
turbine performance prediction. In: Proceedings of the 1998 ASME Wind Energy
Symposium. American Institute of Aeronautics and Astronautics (AIAA) and
ASME International, Reno, NV, USA, 12-15 January 1998, pp. 9-19.
Dunlop, J. (2006). Wind power project returns – What should equity investors
expect? Journal of Structured Finance, 12, pp. 81-89.
Dürr, T., and L. Bach (2004). Bat deaths and wind turbines – a review of current
knowledge, and of the information available in the database for Germany.
Bremer Beiträge für Naturkunde und Naturschutz, 7, pp. 253-264.
Durstewitz, M., B. Hahn, B. Lange, K. Rohrig, and A. Wessel (2008). Windenergie
Report Deutschland 2007. Institut für Solare Energieversorgungstechnik (ISET),
Kessel, Germany.
Ea Energianalyse (2007). 50% Wind Power in Denmark in 2025. Ea Energieanalyse,
Copenhagen, Denmark, 121 pp.
EC (2003). External Costs: Research Results on Socio-Environmental Damages Due
to Electricity and Transport. European Commission (EC), Brussels, Belgium,
28 pp.
EC (2006). European Energy and Transport: Scenarios on Energy Effi ciency and
Renewables. European Commission (EC), Brussels, Belgium, 124 pp.
EC (2009). Communication from the Commission on Investing in the Development of
Low Carbon Technologies (SET-Plan). A Technology Roadmap. Commission of the
European Communities, Brussels, Belgium, 1295 pp.
Echavarria, E., B. Hahn, G.J.W. Van Bussel, and T. Tomiyama (2008). Reliability
of wind turbine technology through time. Journal of Solar Energy Engineering,
130, 031005.
EEA (2009). Europe’s Onshore and Offshore Wind Energy Potential: An Assessment
of Environmental and Economic Constraints. European Environmental Agency
(EEA), Copenhagen, Denmark, 90 pp.
Ehler, C.N., and F. Douvere (2009). Marine Spatial Planning: A Step-by-Step
Approach Towards Ecosystem Based Management. Intergovernmental
Oceanographic Commission and Marine and Biosphere Programme, United
Nations Educational, Scientifi c, and Cultural Organization, Paris, France, 99 pp.
EIA (2010). International Energy Outlook, 2010. Energy Information Agency, US
Department of Energy, Washington, DC, USA, 231 pp.
EirGrid and SONI (2010). All Island TSO Facilitation of Renewables Studies. EirGrid
and System Operator for Northern Ireland (SONI), Dublin, Ireland, 77 pp.
Ek, K., and P. Söderholm (2010). Technology learning in the presence of public
R&D: The case of European wind power. Ecological Economics, 69, pp.
2356-2362.
Ela, E., and B. Kirby (2008). ERCOT Event on February 26, 2008: Lessons Learned.
USA: National Renewable Energy Laboratory, Golden, CO, USA, 12 pp.
Elliott, D. (2002). Assessing the world’s wind resources. In: IEEE Power Engineering
Society Winter Meeting, 2002, New York, NY, USA, 27-31 January 2002, pp. 346-
347.
Elliott, D., M. Schwartz, and G. Scott (2004). Wind resource base. In: Encyclopaedia
of Energy. Elsevier, Amsterdam, The Netherlands, 465-479.
Eltham, D.C., G.P. Harrison, and S. J. Allen (2008). Change in public attitudes
towards a Cornish wind farm: Implications for planning. Energy Policy, 36, pp.
23-33.
EnerNex Corp (2010). Eastern Wind Integration and Transmission Study. National
Renewable Energy Laboratory, Golden, CO, USA, 242 pp.

599
Chapter 7 Wind Energy
EPA (1974). Information on Levels of Environmental Noise Requisite to Protect
Public Health and Welfare with an Adequate Margin of Safety. Offi ce of Noise
Abatement and Control, US Environmental Protection Agency, Washington, DC,
USA, 242 pp.
EPA (1978). Protective Noise Levels. Offi ce of Noise Abatement and Control, US
Environmental Protection Agency, Washington, DC, USA, 25 pp.
ERCOT (2008). ERCOT Operations Report on the EECP Event of February 26, 2008.
The Electricity Reliability Council of Texas (ERCOT), Austin, TX, USA, 13 pp.
Erdman, W., and M. Behnke (2005). Low Wind Speed Turbine Project Phase II: The
Application of Medium-Voltage Electrical Apparatus to the Class of Variable
Speed Multi-Megawatt Low Wind Speed Turbines. National Renewable Energy
Laboratory, Golden, CO, USA, 119 pp.
Erickson, W.P., G.D. Johnson, and D.P. Young Jr. (2005). A Summary and
Comparison of Bird Mortality from Anthropogenic Causes with an Emphasis on
Collisions. General Technical Report, United States Forest Service, Washington,
DC, USA, 14 pp.
Eto, J., J. Undrill, P. Mackin, R. Daschmans, B. Williams, B. Haney, R. Hunt, J. Ellis,
H. Illian, C. Martinez, M. O’Malley, K. Coughlin, and K. LaCommare (2010).
Use of Frequency Response Metrics to Assess the Planning and Operating
Requirements for Reliable Integration of Variable Generation. Lawrence Berkeley
National Laboratory, Berkeley, California, USA, 90 pp.
EU (2008). European Wind Energy Technology Platform for Wind Energy. Strategic
Research Agenda - Market Development Strategy from 2008 to 2030. Synopsis.
European Union (EU), TPWind Secretariat, Brussels, Belgium, 15 pp.
Everaert, J., and E.W.M. Stienen (2007). Impact of wind turbines on birds in
Zeebrugge (Belgium). Biodiversity and Conservation, 16, pp. 3345-3359.
EWEA (2005). Large Scale Integration of Wind Energy in the European Power Supply:
Analysis, Issues and Recommendations. European Wind Energy Association
(EWEA), Brussels, Belgium, 172 pp.
EWEA (2009). Wind Energy, the Facts. European Wind Energy Association (EWEA),
Brussels, Belgium, 488 pp.
EWEA (2010a). The European Offshore Wind Industry – Key Trends and Statistics
2009. European Wind Energy Association (EWEA), Brussels, Belgium, 9 pp.
EWEA (2010b). Wind in Power: 2009 European Statistics. European Wind Energy
Association (EWEA), Brussels, Belgium, 14 pp.
FANM (2005). Human Health Repercussions of Windmill Operation. French Académie
Nationale de Médecine (FANM), Paris, France, 17 pp.
Fastl, H., and E. Zwicker (2007). Psychoacoustics: Facts and Models. 3rd ed.
Springer, Berlin and Heidelberg, Germany and New York, NY, USA, 428 pp.
Fellows, A. (2000). The Potential of Wind Energy to Reduce Carbon Dioxide
Emissions. Garrad Hassan and Partners Ltd, Glasgow, Scotland, 146 pp.
Ferioli, F., K. Schoots, and B.C.C. Van der Zwaan (2009). Use and limitations of
learning curves for energy technology policy: A component-learning hypothesis.
Energy Policy, 37, pp. 2525-2535.
Firestone, J., and W. Kempton (2007). Public opinion about large offshore wind
power: Underlying factors. Energy Policy, 35, pp. 1584-1598.
Firestone, J., W. Kempton, and A. Krueger (2009). Public acceptance of offshore
wind power projects in the USA. Wind Energy, 12, pp. 183-202.
Focken, U., M. Lange, K. Mönnich, H. Waldl, H.G. Beyer, and A. Luig (2002).
Short-term prediction of the aggregated power output of wind farms – a
statistical analysis of the reduction of the prediction error by spatial smoothing
effects. Journal of Wind Engineering and Industrial Aerodynamics, 90, pp.
231-246.
Førsund, F.R., B. Singh, T. Jensen, and C. Larsen (2008). Phasing in wind-power
in Norway: Network congestion and crowding-out of hydropower. Energy Policy,
36, pp. 3514-3520.
Fox, B., D. Flynn, L. Bryans, N. Jenkins, D. Milborrow, M. O’Malley, R. Watson,
and O. Anaya-Lara (2007). Wind power integration: connection and system
operational aspects. The Institution of Engineering and Technology, London, UK,
288 pp.
Frandsen, S.T., R.J. Barthelmie, S.C. Pryor, O. Rathmann, S. Larsen, J. Højstrup,
and M. Thøgersen (2006). Analytical modelling of wind speed defi cit in large
offshore wind farms. Wind Energy, 9, pp. 39-53.
Frandsen, S.T., H.E. Jørgensen, R.J. Barthelmie, O. Rathmann, J. Badger,
K. Hansen, S. Ott, P. Rethore, S.E. Larsen, and L.E. Jensen (2009). The
making of a second-generation wind farm effi ciency model complex. Wind
Energy, 12, pp. 445-458.
Frost, S.A., M.J. Balas, and A.D. Wright (2009). Direct adaptive control of a utility-
scale wind turbine for speed regulation. International Journal of Robust and
Nonlinear Control, 19, pp. 59-71.
Garreaud, R.D., and M. Falvey (2009). The coastal winds off western subtropical
South America in future climate scenarios. International Journal of Climatology,
29, pp. 543-554.
Garthe, S., and O. Hüppop (2004). Scaling possible adverse effects of marine wind
farms on seabirds: developing and applying a vulnerability index. Journal of
Applied Ecology, 41, pp. 724-734.
Gautam, D., V. Vittal, and T. Harbour (2009). Impact of increased penetration of
DFIG-based wind turbine generators on transient and small signal stability of
power systems. IEEE Transactions on Power Systems, 24, pp. 1426-1434.
GE Energy (2010). Western Wind and Solar Integration Study. General Electric (GE)
Energy, National Renewable Energy Laboratory, Golden, CO, USA, 536 pp.
GEC (2001). WindPACT Turbine Design Scaling Studies Technical Area 3–Self-Erecting
Tower Structures. Global Energy Concepts (GEC), National Renewable Energy
Laboratory, Golden, CO, USA, 72 pp.
Gibson, E., and P. Howsam (2010). The legal framework for offshore wind farms: A
critical analysis of the consents process. Energy Policy, 38, pp. 4692-4702.
Gipe, P. (1995). Wind Energy Comes of Age. Wiley, New York, USA, 560 pp.
Göransson, L., and F. Johnsson (2009). Dispatch modeling of a regional power
generation system - Integrating wind power. Renewable Energy, 34, pp.
1040-1049.
Goyal, M. (2010). Repowering--Next big thing in India. Renewable and Sustainable
Energy Reviews, 14, pp. 1400-1409.
Goyette, S., O. Brasseur, and M. Beniston (2003). Application of a new wind gust
parameterization: Multiscale case studies performed with the Canadian regional
climate model. Journal of Geophysical Research, 108, pp. 4374.
Graham, J.B., J.R. Stephenson, and I.J. Smith (2009). Public perceptions of wind
energy developments: Case studies from New Zealand. Energy Policy, 37, pp.
3348-3357.
Greenblatt, J.B., S. Succar, D.C. Denkenberger, R.H. Williams, and R.H. Socolow
(2007). Baseload wind energy: modeling the competition between gas turbines
and compressed air energy storage for supplemental generation. Energy Policy,
35, pp. 1474-1492.
Griffi n, D.A. (2001). WindPACT Turbine Design Scaling Studies Technical Area
1 – Composite Blades for 80-to 120-Meter Rotor. National Renewable Energy
Laboratory, Golden, CO, USA, 44 pp.

600
Wind Energy Chapter 7
Gross, C. (2007). Community perspectives of wind energy in Australia: The application
of a justice and community fairness framework to increase social acceptance.
Energy Policy, 35, pp. 2727-2736.
Gross, R., and P. Heptonstall (2008). The costs and impacts of intermittency: An
ongoing debate: “East is East, and West is West, and never the twain shall meet”.
Energy Policy, 36, pp. 4005-4007.
Gross, R., P. Heptonstall, D. Anderson, T. Green, M. Leach, and J. Skea (2006).
The Costs and Impacts of Intermittency: An assessment of the evidence on the
costs and impacts of intermittent generation on the British electricity network.
Imperial College London, London, UK, 112 pp.
Gross, R., P. Heptonstall, M. Leach, D. Anderson, T. Green, and J. Skea (2007).
Renewables and the grid: understanding intermittency. Energy, 160, pp. 31-41.
Grubb, M.J. (1991). Value of variable sources on power systems. IEE Proceedings C
Generation, Transmission and Distribution, 138, pp. 149-165.
Grubb, M.J., and N.I. Meyer (1993). Wind energy: Resources, systems and regional
strategies. In: Renewable Energy: Sources for Fuels and Electricity. T.B. Johansson,
H. Kelly, A.K. Reddy, and R.H. Williams (eds.), Island Press, Washington, DC, USA,
pp. 157-212.
GWEC (2010a). Global Wind 2009 Report. Global Wind Energy Council (GWEC),
Brussels, Belgium, 4 pp.
GWEC (2010b). Global wind power boom continues despite economic woes. Global
Wind Energy Council (GWEC), Brussels, Belgium, 68 pp.
GWEC and GPI (2010). Global Wind Energy Outlook 2010. Global Wind Energy
Council (GWEC) and Greenpeace International (GPI), Brussels, Belgium, 60 pp.
Haggett, C. (2011). Understanding public responses to offshore wind power. Energy
Policy, 39, pp. 503-510.
Hameed, Z., S.H. Ahn, and Y.M. Cho (2010). Practical aspects of a condition
monitoring system for a wind turbine with emphasis on its design, system
architecture, testing and installation. Renewable Energy, 35, pp. 879-894.
Hand, M.M., and M.J. Balas (2007). Blade load mitigation control design for a wind
turbine operating in the path of vortices. Wind Energy, 10, pp. 339-355.
Hand, M.M., D.A. Simms, L.J. Fingersh, D.W. Jager, J.R. Cotrell, S. Schreck,
S.M. Larwood (2001). Unsteady aerodynamics experiment phase vi: Wind
tunnel test confi gurations and available data campaigns. National Renewable
Energy Laboratory, Golden, CO, USA, 310 pp.
Hansen, M.H. (2007). Aeroelastic instability problems for wind turbines. Wind
Energy, 10, pp. 551-577.
Hansen, M.O., J.N. Sørensen, S. Voutsinas, N. Sørensen, and H.A. Madsen
(2006). State of the art in wind turbine aerodynamics and aeroelasticity.
Progress in Aerospace Sciences, 42, pp. 285-330.
Harris, M., M. Hand, and A. Wright (2006). Lidar for Turbine Control. National
Renewable Energy Laboratory, Golden, CO, USA.
Hasche, B., A. Keane, and M. O’Malley (2010). Capacity credit of wind power:
calculation and data requirements; The Irish power system case. IEEE Transactions
on Power Systems, 99, pp. 1-11.
Haugen, J.E., and T. Iversen (2008). Response in extremes of daily precipitation and
wind from a downscaled multi-model ensemble of anthropogenic global climate
change scenarios. Tellus A, 60, pp. 411-426.
Heege, A., J. Betran, and Y. Radovcic (2007). Fatigue load computation of wind
turbine gearboxes by coupled fi nite element, multi-body system and aerodynamic
analysis. Wind Energy, 10, pp. 395-413.
Hoen, B., R. Wiser, P. Cappers, M. Thayer, and G. Sethi (2011). Wind energy
facilities and residential properties: The effect of proximity and view on sales
prices. Journal of Real Estate Research, accepted for publication.
Hohmeyer, O., D. Mora, and F. Wetzig (2005). Wind Energy. The Facts. Volume 4.
European Wind Energy Association, Brussels, Belgium, 60 pp.
Holttinen, H. (2005). Optimal electricity market for wind power. Energy Policy, 33,
pp. 2052-2063.
Holttinen, H., P. Meibom, A. Orths, F. van Hulle, B. Lange, A. Tiedemann,
M. O’Malley, J. Perik, B. Ummels, J.O. Tande, A. Estanqueiro, M. Matos,
E. Gomez, L. Soder, G. Strbac, A. Shakoor, J.C. Smith, and M. Milligan
(2009). Design and Operation of Power Systems with Large Amounts of Wind
Power: Phase One 2006-2008. VTT Technical Research Centre of Finland, Espoo,
Finland, 200 pp.
Hoogwijk, M., and W. Graus (2008). Global Potential of Renewable Energy Sources:
A Literature Assessment. Ecofys, Utrecht, The Netherlands, 45 pp.
Hoogwijk, M., B. de Vries, and W. Turkenburg (2004). Assessment of the global
and regional geographical, technical and economic potential of onshore wind
energy. Energy Economics, 26, pp. 889-919.
Hoogwijk, M., D. van Vuuren, B. de Vries, and W. Turkenburg (2007). Exploring
the impact on cost and electricity production of high penetration levels of
intermittent electricity in OECD Europe and the USA, results for wind energy.
Energy, 32, pp. 1381-1402.
Hoppock, D.C., and D. Patiñ o-Echeverri (2010). Cost of wind energy: comparing
distant wind resources to local resources in the midwestern United States.
Environmental Science & Technology, 44, pp. 8758-8765.
Horn, J.W., E.B. Arnett, and T.H. Kunz (2008). Behavioral responses of bats to
operating wind turbines. Journal of Wildlife Management, 72, pp. 123-133.
Hubbert, M.K. (1971). The energy resources of the Earth. Scientifi c American, 225,
pp. 60-70.
Hydro-Quebec TransEnergie (2006). Technical Requirements for the Connection of
Generation Facilities to the Hydro-Quebec Transmission System. Hydro-Quebec
TransEnergie, Montreal, Canada, 17 pp.
IEA (2008). Energy Technology Perspectives 2008. Scenarios and Strategies to 2050.
International Energy Agency, Paris, France, 646 pp.
IEA (2009). Technology Roadmap – Wind energy. International Energy Agency, Paris,
France, 52 pp.
IEA (2010a). Energy Balances of Non-OECD Countries. International Energy Agency,
Paris, France, 554 pp.
IEA (2010b). World Energy Outlook 2010. International Energy Agency, Paris, France,
736 pp.
IEA (2010c). Energy Technology Perspectives 2010. Scenarios and Strategies to 2050.
International Energy Agency, Paris, France, 708 pp.
IEA and OECD (2010). Projected Costs of Generating Electricity, 2010 Edition.
International Energy Agency and Organisation for Economic Co-operation and
Development, Paris, France, 218 pp.
IEA Wind (2010). IEA Wind Energy Annual Report 2009. International Energy Agency
Wind, Paris, France, 172 pp.
IEC (2008). Wind Turbines – Part 21: Measurement and Assessment of Power Quality
Characteristics of Grid Connected Wind Turbines; IEC 61400-21. International
Electrotechnical Commission, Delft, The Netherlands.
IEC (2010). Wind Turbines - Part 22: Conformity Testing and Certifi cation, IEC 61400-
22. International Electrotechnical Commission, Delft, The Netherlands.

601
Chapter 7 Wind Energy
IPCC (2007). Climate Change 2007: Mitigation of Climate Change. Contribution of
Working Group III to the Fourth Assessment Report of the Intergovernmental
Panel on Climate Change. B. Metz, O.R. Davidson, P.R. Bosch, R. Dave, and L.A.
Meyer (eds.), Cambridge University Press, 851 pp.
ISO (2006). Environmental Management - Life-Cycle Assessment - Requirements and
Guidelines. Geneva, Switzerland: International Organization for Standardization.
Jackson, K.J., M.D. Zuteck, C.P. van Dam, K.J. Standish, and D. Berry (2005).
Innovative design approaches for large wind turbine blades. Wind Energy, 8,
pp. 141-171.
Jackson, T.O. (2001). The effects of environmental contamination on real estate: A
literature review. Journal of Real Estate Literature, 9, pp. 91-116.
Jacobson, M.Z. (2009). Review of solutions to global warming, air pollution, and
energy security. Energy & Environmental Science, 2, pp. 148-173.
Jakobsen, J. (2005). Infrasound emission from wind turbines. Low Frequency Noise,
Vibration and Active Control, 24, pp. 145-155.
Jamasb, T. (2007). Technical change theory and learning curves: patterns of
progress in electricity generation technologies. The Energy Journal, 28,
pp. 51–71.
JCSP (2009). Joint Coordinated System Plan 2008, Volume 1 - Economic Assessment.
Joint Coordinated System Plan (JCSP), Report of the Midwest Independent
System Operator, PJM Interconnection, Southwest Power Pool Electric Energy
Network, Tennessee Valley Authority and Mid-continent Area Power Pool, 113 pp.
Jiang, Q., J.D. Doyle, T. Haack, M.J. Dvorak, C.L. Archer, and M.Z. Jacobson
(2008). Exploring wind energy potential off the California coast. Geophysical
Research Letters, 35, L20819.
Johansson, T.B., K. McCormick, L. Neij, and W. Turkenburg (2004). The Potentials
of Renewable Energy. Thematic Background Paper for the International
Conference for Renewable Energies, Bonn, Germany, 36 pp.
Johnson, K.E., and L.J. Fingersh (2008). Adaptive pitch control of variable-speed
wind turbines. Journal of Solar Energy Engineering, 130, pp. 031012-7.
Johnson, K.E., L.J. Fingersh, M.J. Balas, and L.Y. Pao (2004). Methods for
increasing region 2 power capture on a variable-speed wind turbine. Journal of
Solar Energy Engineering, 126, pp. 1092-1100.
Jones, C.R., and J.R. Eiser (2009). Identifying predictors of attitudes towards local
onshore wind development with reference to an English case study. Energy
Policy, 37, pp. 4604-4614.
Jonkman, J.M. (2009). Dynamics of offshore fl oating wind turbines-model
development and verifi cation. Wind Energy, 12, pp. 459-492.
Jónsson. T., P. Pinson, and H. Madsen (2010). On the market impact of wind energy
forecasts. Energy Economics, 32, pp. 313-320.
Jungbluth, N., C. Bauer, R. Dones, and R. Frischknecht (2005). Life cycle
assessment for emerging technologies: Case studies for photovoltaic and wind
power. The International Journal of Life Cycle Assessment, 10, pp. 24-34.
Junginger, M., A. Faaij, and W.C. Turkenburg (2004). Cost reduction prospects for
offshore wind farms. Wind Engineering, 28, pp. 97-118.
Junginger, M., A. Faaij, and W.C. Turkenburg (2005). Global experience curves for
wind farms. Energy Policy, 33, pp. 133-150.
Junginger, M., W.V. Sark, and A. Faaij (eds.) (2010). Technological Learning in
the Energy Sector: Lessons for Policy, Industry and Science. Edward Elgar,
Northampton, MA, USA.
Justus, C.G., K. Mani, and A.S. Mikhail (1979). Interannual and month-to-month
variations of wind speed. Journal of Applied Meteorology, 18, pp. 913-920.
Kahn, E. (1979). The compatibility of wind and solar technology with conventional
energy systems. Annual Review of Energy, 4, pp. 313-352.
Kahouli-Brahmi, S. (2009). Testing for the presence of some features of increasing
returns to adoption factors in energy system dynamics: An analysis via the
learning curve approach. Ecological Economics, 68, pp. 1195-1212.
Kannen, A., and B. Burkhard (2009). Integrated assessment of coastal and
marine changes using the example of offshore wind farms: The coastal futures
approach. GAIA - Ecological Perspectives for Science and Society, 18, pp.
229-238.
Katzenstein, W., and J. Apt (2009). Air emissions due to wind and solar power.
Environmental Science & Technology, 43, pp. 253-258.
Katzenstein, W., E. Fertig, and J. Apt (2010). The variability of interconnected wind
plants. Energy, 38, pp. 4400-4410.
Keith, D.W., J.F. DeCarolis, D.C. Denkenberger, D.H. Lenschow, S.L. Malyshev,
S. Pacala, and P. J. Rasch (2004). The infl uence of large-scale wind power
on global climate. Proceedings of the National Academy of Sciences, 101, pp.
16115-16120.
Kelley, N., M. Shirazi, D. Jager, S. Wilde, J. Adams, M. Buhl, P. Sullivan, and
E. Patton (2004). Lamar Low-Level Jet Program Interim Report. National
Renewable Energy Laboratory, Golden, CO, USA, 216 pp.
Kempton, W., and J. Tomic (2005). Vehicle-to-grid power implementation: From
stabilizing the grid to supporting large-scale renewable energy. Journal of Power
Sources, 144, pp. 280-294.
Kempton, W., C.L. Archer, A. Dhanju, R.W. Garvine, and M.Z. Jacobson (2007).
Large CO2 reductions via offshore wind power matched to inherent storage in
energy end-uses. Geophysical Research Letters, 34, L02817.
Kikuchi, R. (2010). Risk formulation for the sonic effects of offshore wind farms on
fi sh in the EU region. Marine Pollution Bulletin, 60, pp. 172-177.
Kim, J., and C. Park (2010). Wind power generation with a parawing on ships, a
proposal. Energy, 35, pp. 1425-1432.
Kirby, B., and M. Milligan (2008). An examination of capacity and ramping impacts
of wind energy on power systems. The Electricity Journal, 21, pp. 30-42.
Kirk-Davidoff, D.B., and D.W. Keith (2008). On the climate impact of surface
roughness anomalies. Journal of the Atmospheric Sciences, 65, pp. 2215-2234.
Kiviluoma, J., and P. Meibom (2010). Infl uence of wind power, plug-in electric
vehicles, and heat storages on power system investments. Energy, 35, pp.
1244-1255.
Klaassen, G., A. Miketa, K. Larsen, and T. Sundqvist (2005). The impact of R&D
on innovation for wind energy in Denmark, Germany and the United Kingdom.
Ecological Economics, 54, pp. 227-240.
Klick, H., and E.R.A.N. Smith (2010). Public understanding of and support for wind
power in the United States. Renewable Energy, 35, pp. 1585-1591.
Kobos, P.H., J.D. Erickson, and T.E. Drennen (2006). Technological learning and
renewable energy costs: implications for US renewable energy policy. Energy
Policy, 34, pp. 1645-1658.
Köller, J., J. Köppel, and W. Peters (eds.) (2006). Offshore Wind Energy: Research
on Environmental Impacts. Springer, Berlin, Germany, 371 pp.
Krewitt, W., and B. Schlomann (2006). Externe Kosten der Stromerzeugung
aus erneuerbaren Energien im Vergleich zur Stromerzeugung aus fossilen
Energieträgern. Fraunhofer Institute for Systems and Innovation Research and
DLR (German Center for Aeronautics and Astronautics), Karlsruhe and Stuttgart,
Germany, 59 pp.

602
Wind Energy Chapter 7
Krewitt, W., K. Nienhaus, C. Kleßmann, C. Capone, E. Stricker, W. Graus, M.
Hoogwijk, N. Supersberger, U. von Winterfeld, and S. Samadi (2009). Role
and Potential of Renewable Energy and Energy Effi ciency for Global Energy
Supply. Climate Change 18/2009, ISSN 1862-4359, Federal Environment Agency,
Dessau-Roßlau, Germany, 336 pp.
Krey, V., and L. Clarke (2011). Role of renewable energy in climate change
mitigation: a synthesis of recent scenarios. Climate Policy, 11, pp. 1-28.
Krohn, S., and S. Damborg (1999). On public attitudes towards wind power.
Renewable Energy, 16, pp. 954-960.
Krug, F., and B. Lewke (2009). Electromagnetic interference on large wind turbines.
Energies, 2, pp. 1118-1129.
Kunz, T.H., E.B. Arnett, B.M. Cooper, W.P. Erickson, R.P. Larkin, T. Mabee,
M.L. Morrison, M.D. Strickland, and J. M. Szewczak (2007a). Assessing
impacts of wind-energy development on nocturnally active birds and bats: a
guidance document. Journal of Wildlife Management, 71, pp. 2449-2486.
Kunz, T.H., E.B. Arnett, W.P. Erickson, A.R. Hoar, G.D. Johnson, R.P. Larkin,
M.D. Strickland, R.W. Thresher, and M.D. Tuttle (2007b). Ecological
impacts of wind energy development on bats: questions, research needs, and
hypotheses. Frontiers in Ecology and the Environment, 5, pp. 315-324.
Kuvlesky, W.P., L.A. Brennan, M.L. Morrison, K.K. Boydston, B.M. Ballard,
and F.C. Bryant (2007). Wind energy development and wildlife conservation:
challenges and opportunities. Journal of Wildlife Management, 71, pp.
2487-2498.
Laakso, T., H. Holttinen, G. Ronsten, L. Tallhaug, R. Horbaty, I. Baring-Gould, A.
Lacroix, E. Peltola, and B. Tammelin (2003). State-of-the-art of Wind Energy
in Cold Climates. VTT Technical Research Centre of Finland, Espoo, Finland, 50 pp.
Lackner, M., and G. van Kuik (2010). A comparison of smart rotor control
approaches using trailing edge fl aps and individual pitch control. Wind Energy,
13, pp. 117-134.
Ladenburg, J. (2009). Stated public preferences for on land and offshore wind power
generation—a review. Wind Energy, 12, pp. 171-181.
Lalor, G., A. Mullane, and M. O’Malley (2005). Frequency control and wind turbine
technologies. IEEE Transactions on Power Systems, 20, pp. 1905-1913.
Lamont, A.D. (2008). Assessing the long-term system value of intermittent electric
generation technologies. Energy Economics, 30, pp. 1208-1231.
Lanier, M. (2005). Low Wind Speed Technology Phase I Concept Study: Evaluation
of Design and Construction Approaches for Economical Hybrid Steel/Concrete
Wind Turbine Towers. National Renewable Energy Laboratory, Golden, CO, USA,
698 pp.
Larsen, G.C., H.A. Madsen, K. Thomsen, and T.J. Larsen (2008). Wake meandering:
a pragmatic approach. Wind Energy, 11, pp. 377-395.
Larsen, T.J., H.A. Madsen, and K. Thomsen (2004). Active load reduction using
individual pitch, based on local blade fl ow measurements. Wind Energy, 8,
pp. 67-80.
Leckebusch, G.C., A. Weimer, J.G. Pinto, M. Reyers, and P. Speth (2008). Extreme
wind storms over Europe in present and future climate: a cluster analysis
approach. Meteorologische Zeitschrift, 17, pp. 67-82.
Leighty, W. (2008). Running the world on renewables: Hydrogen transmission
pipelines and fi rming geologic storage. International Journal of Energy Research,
32, pp. 408-426.
Leishman, J.G. (2006). Principles of Helicopter Aerodynamics. Cambridge University
Press, 536 pp.
Lemming, J.K., P.E. Morthorst, N.E. Clausen, and P. Hjuler Jensen (2009).
Contribution to the Chapter on Wind Power in Energy Technology Perspectives
2008, IEA. Risø National Laboratory, Roskilde, Denmark, 64 pp.
Leutz, R., T. Ackermann, A. Suzuki, A. Akisawa, and T. Kashiwagi (2001).
Technical offshore wind energy potentials around the globe. In: European
Wind Energy Conference and Exhibition. Copenhagen, Denmark, 2-6 July 2001,
pp. 2-6.
Leventhall, G. (2006). Infrasound from wind turbines-fact, fi ction or deception.
Canadian Acoustics, 34, pp. 29.
Lew, D.J., R.H. Williams, X. Shaoxiong, and Z. Shihui (1998). Large-scale baseload
wind power in China. Natural Resources Forum, 22(3), 165-184.
Lewis, J.I. (2007). Technology acquisition and innovation in the developing
world: Wind turbine development in China and India. Studies in Comparative
International Development (SCID), 42, pp. 208-232.
Lewis, J.I., and R.H. Wiser (2007). Fostering a renewable energy technology industry:
An international comparison of wind industry policy support mechanisms. Energy
Policy, 35, pp. 1844-1857.
Li, J. (2010). Decarbonising power generation in China – Is the answer blowing in the
wind? Renewable and Sustainable Energy Reviews, 14, pp. 1154-1171.
Li, J., and L. Ma (2009). Background Paper: Chinese Renewables Status Report.
Renewable Energy Policy Network for the 21st Century, Paris, France, 95 pp.
Li, J., H. Gao, J. Shi, L. Ma, H. Qin, and Y. Song (2007). China Wind Power Report,
2007. China Environmental Science Press, Beijing, China, 55 pp.
Lilley, M.B., and J. Firestone (2008). Wind power, wildlife, and the Migratory Bird
Treaty Act: a way forward. Environmental Law, 38, pp. 1167-1214.
Liu, Y., and A. Kokko (2010). Wind power in China: Policy and development
challenges. Energy Policy, 38, pp. 5520-5529.
Loring, J.M. (2007). Wind energy planning in England, Wales and Denmark: Factors
infl uencing project success. Energy Policy, 35, pp. 2648-2660.
Lu, X., M.B. McElroy, and J. Kiviluoma (2009). Global potential for wind-generated
electricity. Proceedings of the National Academy of Sciences, 106, pp. 10933-
10939.
Lund, H. (2006). Large-scale integration of optimal combinations of PV, wind and
wave power into the electricity supply. Renewable Energy, 31, pp. 503-515.
Lund, H., and W. Kempton (2008). Integration of renewable energy into the
transport and electricity sectors through V2G. Energy Policy, 36, pp. 3578-3587.
Lund, H., and E. Münster (2003). Modelling of energy systems with a high
percentage of CHP and wind power. Renewable Energy, 28, pp. 2179-2193.
Lutz, T., A. Herrig, W. Wörz, M. Kamruzzaman, and E. Krämer (2007). Design and
wind-tunnel verifi cation of low-noise airfoils for wind turbines. AIAA Journal, 45,
pp. 779-785.
MacCormack, J., A. Hollis, H. Zareipour, and W. Rosehart (2010). The large-scale
integration of wind generation: Impacts on price, reliability and dispatchable
conventional suppliers. Energy Policy, 38, pp. 3837-3846.
Mackay, R.M., and S.D. Probert (1998). Likely market-penetrations of renewable-
energy technologies. Applied Energy, 59, pp. 1-38.
Madsen, H., P. Pinson, G. Kariniotakis, H.A. Nielsen, and T. Nielsen (2005).
Standardizing the performance evaluation of short term wind power prediction
models. Wind Engineering, 29, pp. 475-489.
Madsen, H.A., C. Bak, U.S. Paulsen, M. Gaunaa, N.N. Sørensen, P. Fuglsang,
J. Romblad, N.A. Olsen, P. Enevoldsen, J. Laursen, and L. Jensen (2010).
The DAN-AERO MW experiments. In: 48th AIAA Aerospace Sciences Meeting.
Orlando, FL, USA, 4-7 January 2010, pp. 2010-0645.

603
Chapter 7 Wind Energy
Madsen, P.T., M. Wahlberg, J. Tougaard, K. Lucke, and P. Tyack (2006). Wind
turbine underwater noise and marine mammals: implications of current
knowledge and data needs. Marine Ecology-Progress Series, 309, pp. 279-295.
Malcolm, D.J. (2004). WindPACT Rotor Design. Period of performance: June 29, 2000
- February 28, 2004. National Renewable Energy Laboratory, Golden, CO, USA,
44 pp.
Malcolm, D.J., and A.C. Hansen (2006). WindPACT turbine rotor design study: June
2000 - June 2002. National Renewable Energy Laboratory, Golden, CO, USA, 84
pp.
Markard, J., and R. Petersen (2009). The offshore trend: Structural changes in the
wind power sector. Energy Policy, 37, pp. 3545-3556.
Martinot, E., C. Dienst, L. Weiliang, and C. Qimin (2007). Renewable energy
futures: Targets, scenarios, and pathways. Annual Review of Environment and
Resources, 32, pp. 205-239.
Matthies, H.G., A.D. Garrad, M. Scherweit, C. Nath, M.A. Wastling, T. Siebers,
T. Schellin, and D.C. Quarton (1995). Study of Offshore Wind Energy in the
European Community. Germanischer Lloyd, Hamburg, Germany.
McCunney, R.J., and J. Meyer (2007). Occupational exposure to noise. In:
Environmental and Occupational Medicine. 4th ed. W.N. Rom (ed.) Lippincott
Williams and Wilkins, Baltimore, MD, pp. 1295-1238.
McDonald, A., and L. Schrattenholzer (2001). Learning rates for energy
technologies. Energy Policy, 29, pp. 255-261.
McElroy, M.B., X. Lu, C.P. Nielsen, and Y. Wang (2009). Potential for wind-
generated electricity in China. Science, 325, pp. 1378.
MDOH (2009). Public Health Impacts of Wind Turbines. Minnesota Department of
Health (MDOH), Environmental Health Division, Minneapolis, MN, USA, 32 pp.
Meibom, P., C. Weber, R. Barth, and H. Brand (2009). Operational costs induced by
fl uctuating wind power production in Germany and Scandinavia. IET Renewable
Power Generation, 3, pp. 75-83.
Meyer, N. (2007). Learning from wind energy policy in the EU: lessons from Denmark,
Sweden and Spain. European Environment, 17, pp. 347-362.
Miao, Z., L. Fan, D. Osborn, and S. Yuvarajan (2009). Control of DFIG-based
wind generation to improve interarea oscillation damping. IEEE Transactions on
Energy Conversion, 24, pp. 415-422.
Michel, J., H. Dunagan, C. Boring, E. Healy, W. Evans, J.M. Dean, A. McGillis,
and J. Hain (2007). Worldwide Synthesis and Analysis of Existing Information
Regarding Environmental Effects of Alternative Energy Uses on the Outer
Continental Shelf. US Department of the Interior, Minerals Management Service,
Herndon, VA, USA.
Migliore, P., and S. Oerlemans (2004). Wind tunnel aeroacoustic tests of six airfoils
for use on small wind turbines. Journal of Solar Energy Engineering, 126, pp.
974-985.
Miketa, A., and L. Schrattenholzer (2004). Experiments with a methodology to
model the role of R&D expenditures in energy technology learning processes;
fi rst results. Energy Policy, 32, pp. 1679-1692.
Milborrow, D. (2009). Quantifying the impacts of wind variability. Proceedings of
the Institution of Civil Engineers. Energy, 162, pp. 105-111.
Milborrow, D. (2010). Annual power costs comparison: What a difference a year can
make. Windpower Monthly, 26, pp. 41-47.
Milligan, M., and B. Kirby (2008). The impact of balancing area size and ramping
requirements on wind integration. Wind Engineering, 32, pp. 379-398.
Milligan, M., D.J. Lew, D. Corbus, P. Piwko, N. Miller, K. Clark, G. Jordan,
L. Freeman, B. Zavadil, and M. Schuerger (2009). Large-Scale Wind
Integration Studies in the United States: Preliminary Results. In: 8th International
Workshop on Large Scale Integration of Wind Power and on Transmission
Networks for Offshore Wind Farms, Bremen, Germany, 14-15 October 2009, pp.
1-8.
Mills, A., R. Wiser, and K. Porter (2009a). The Cost of Transmission for Wind
Energy: A Review of Transmission Planning Studies. Lawrence Berkeley National
Laboratory, Berkeley, CA, USA, 66 pp.
Mills, A., R. Wiser, M. Milligan, and M. O’Malley (2009b). Comment on “Air
Emissions Due to Wind and Solar Power”. Environmental Science & Technology,
43, pp. 6106-6107.
Miranda, M.S., and D. Infi eld (2002). A wind-powered seawater reverse-osmosis
system without batteries. Desalination, 153, pp. 9-16.
MOE (2009). Development of Noise Setbacks for Wind Farms. Proposed Content
for the Renewable Energy Approval Regulation - Section 47.3(1) - under the
Environmental Protection Act. Ontario Ministry of the Environment (MOE),
Toronto, Ontario, Canada, 8 pp.
Morales, J.M., A.J. Conejo, and J. Perez-Ruiz (2011). Simulating the impact of wind
production on locational marginal prices. IEEE Transactions on Power Systems,
26(2), pp. 820-828.
Moriarty, P., and P. Migliore (2003). Semi-Empirical Aeroacoustic Noise Prediction
Code for Wind Turbines. National Renewable Energy Laboratory, Golden, CO,
USA, 39 pp.
Morren, J., S.W.H. de Haan, W.L. Kling, and J. Ferreira (2006). Wind turbines
emulating inertia and supporting primary frequency control. IEEE Transactions on
Power Systems, 21, pp. 433-434.
Morthorst, P.E. (2003). Wind power and the conditions at a liberalized power
market. Wind Energy, 6, pp. 297-308.
Mostafaeipour, A. (2010). Feasibility study of offshore wind turbine installation in
Iran compared with the world. Renewable and Sustainable Energy Reviews, 14,
pp. 1722-1743.
Mukora, A., M. Winskel, H.F. Jeffrey, and M. Mueller (2009). Learning curves for
emerging energy technologies. Proceedings of the Institution of Civil Engineers
– Energy, 162, pp. 151-159.
Mullane, A., and M. O’Malley (2005). The inertial response of induction-machine-
based wind turbines. IEEE Transactions on Power Systems, 20, pp. 1496-1503.
Murawski, S.A. (2007). Ten myths concerning ecosystem approaches to marine
resource management. Marine Policy, 31, pp. 681-690.
Musgrove, P. (2010). Wind Power. Cambridge University Press, Cambridge, UK,
338 pp.
Musial, W. (2007). Offshore wind electricity: a viable energy option for the coastal
United States. Marine Technology Society Journal, 41, pp. 32-43.
Musial, W., and B. Ram (2010). Large-Scale Offshore Wind Power in the United
States: Assessment of Opportunities and Barriers. National Renewable Energy
Laboratory, Golden, CO, USA, 240 pp.
Naaijen, P., and V. Koster (2007). Performance of auxiliary wind propulsion for
merchant ships using a kite. In: 2nd International Conference on Marine Research
and Transportation, Naples, Italy, 28-30 June 2007, pp. 45-53.
NABCI (2010). The State of the Birds: 2010 Report on Climate Change. North
American Bird Conservation Initiative (NABCI), US Committee, US Department of
the Interior, Washington, DC, USA.

604
Wind Energy Chapter 7
Nadaï, A., and O. Labussière (2009). Wind power planning in France (Aveyron),
from state regulation to local planning. Land Use Policy, 26, pp. 744-754.
Neij, L. (1997). Use of experience curves to analyse the prospects for diffusion and
adoption of renewable energy technology. Energy Policy, 25, pp. 1099-1107.
Neij, L. (1999). Cost dynamics of wind power. Energy, 24, pp. 375-389.
Neij, L. (2008). Cost development of future technologies for power generation – A
study based on experience curves and complementary bottom-up assessments.
Energy Policy, 36, pp. 2200-2211.
Nemet, G.F. (2009). Interim monitoring of cost dynamics for publicly supported
energy technologies. Energy Policy, 37, pp. 825-835.
NERC (2009). Accommodating High Levels of Variable Generation. North American
Electric Reliability Corporation (NERC), Princeton, NJ, USA, 104 pp.
Neuhoff, K., A. Ehrenmann, L. Butler, J. Cust, H. Hoexter, K. Keats, A. Kreczko,
and G. Sinden (2008). Space and time: Wind in an investment planning model.
Energy Economics, 30, pp. 1990-2008.
NHMRC (2010). Wind Turbines and Health: A Rapid Review of the Evidence. National
Health and Medical Research Council (NHMRC) of the Australian Government,
Canberra, Australia, 11 pp.
Nielsen, F.G., K. Argyriadis, N. Fonseca, M. Le Boulluec, P. Liu, H. Suzuki,
J. Sirkar, N.J. Tarp-Johansen, S.R. Turnock, J. Waegter, and Z. Zong
(2009). Specialist Committee V.4: Ocean, wind and wave energy utilization. In:
17th International Ship and Offshore Structures Congress, Seoul, Korea, 16-21
August 2009, pp. 201-257.
Nielsen, S.R. (1996). Wind energy planning in Denmark. Renewable Energy, 9, pp.
776-771.
Nielson, P., J.K. Lemming, P.E. Morthorst, H. Lawetz, E.A. James-Smith,
N.E. Clausen, S. Strøm, J. Larsen, N.C. Bang, and H.H. Lindboe (2010).
The Economics of Wind Turbines. EMD International, Aalborg, Denmark, 86 pp.
Nikolaev, V.G., S.V. Ganaga, and K.I. Kudriashov (2008). National Kadastr of
Wind Resources of Russia and Methodological Grounds for their Determination.
Atmograph, Moscow, Russia, 590 pp.
Nikolaev, V.G., S.V. Ganaga, K.I. Kudriashov, R. Walter, P. Willems, and A.
Sankovsky (2010). Prospects of Development of Renewable Power Sources
in Russian Federation.The results of TACIS project. Europe Aid/116951/C/SV/RU.
Atmograph, Moscow, Russia.
NRC (2007). Environmental Impacts of Wind-Energy Projects. National Research
Council, The National Academy Press, Washington, DC, USA, 394 pp.
NRC (2010a). Hidden Costs of Energy: Unpriced Consequences of Energy Production
and Use. National Research Council, The National Academy Press, Washington,
DC, USA, 506 pp.
NRC (2010b). Electricity from Renewable Resources: Status, Prospects, and
Impediments. National Research Council, The National Academy Press,
Washington, DC, USA, 388 pp.
O’Rourke, R. (2006). Navy Ship Propulsion Technologies: Options for Reducing Oil
Use –Background for Congress. Congressional Research Service, Washington, DC,
USA, 41 pp.
Owen, A.D. (2004). Environmental externalities, market distortions and the
economics of renewable energy technologies. The Energy Journal, 25, pp.
127-156.
Palutikof, J.P., X. Guo, and J.A. Halliday (1992). Climate variability and the UK
wind resource. Journal of Wind Engineering and Industrial Aerodynamics, 39, pp.
243-249.
Palutikof, J.P., P.M. Kelly, T.D. Davies, and J.A. Halliday (1987). Impacts of spatial
and temporal windspeed variability on wind energy output. Journal of Climate
and Applied Meteorology, 26, pp. 1124-1133.
Pasqualetti, M.J., P. Gipe, R.W. Righter (2002). Wind Power in View: Energy
Landscapes in a Crowded World. Academic Press, San Diego, CA, USA, 248 pp.
Pasqualetti, M.J., R. Richter, and P. Gipe (2004). History of wind energy.
In: Encyclopaedia of Energy. C.J. Cleveland (ed.), Elsevier, Amsterdam, the
Netherlands, pp. 419-433.
Passon, P.,and M. Kühn (2005). State-of-the-art and development needs of
simulation codes for offshore wind turbines. In: Copenhagen Offshore Wind
Conference, Copenhagen, Denmark, 26-28 October, 2005, pp. 1-12.
Pedersen, E., and K. Waye (2004). Perception and annoyance due to wind turbine
noise – a dose-response relationship. The Journal of the Acoustical Society of
America, 116, pp. 3460.
Pedersen, E., and K.P. Waye (2007). Wind turbine noise, annoyance and self-
reported health and well-being in different living environments. Occupational
and Environmental Medicine, 64, pp. 480-486.
Pedersen, E., and K.P. Waye (2008). Wind turbines – low level noise sources
interfering with restoration? Environmental Research Letters, 3, pp. 1-5.
Pedersen, E., F. van den Berg, R. Bakker, and J. Bouma (2010). Can road traffi c
mask sound from wind turbines? Response to wind turbine sound at different
levels of road traffi c sound. Energy Policy 38, pp. 2520-2527.
Peeters, J.L.M., D. Vandepitte, and P. Sas (2006). Analysis of internal drive train
dynamics in a wind turbine. Wind Energy, 9, pp. 141-161.
Pehnt, M., M. Oeser, and D.J. Swider (2008). Consequential environmental system
analysis of expected offshore wind electricity production in Germany. Energy,
33, pp. 747-759.
Petersen, E.L., N.G. Mortensen, L. Landberg, J. Højstrup, and H.P. Frank (1998).
Wind power meteorology. Part I: Climate and turbulence. Wind Energy, 1, pp.
2-22.
M. Pettersson, K. Ek, K. Söderholm, and P. Söderholm (2010). Wind power
planning and permitting: Comparative perspectives from the Nordic countries.
Renewable and Sustainable Energy Reviews, 14, pp. 3116-3123.
Poore, R., and T. Lettenmaier (2003). Alternative Design Study Report: WindPACT
Advanced Wind Turbine Drive Train Designs Study. National Renewable Energy
Laboratory, Golden, CO, USA, 556 pp.
Prospathopoulos, J.M., and S.G. Voutsinas (2005). Noise propagation issues
in wind energy applications. Journal of Solar Energy Engineering, 127, pp.
234-241.
Pryor, S.C., and R.J. Barthelmie (2010). Climate change impacts on wind energy: A
review. Renewable and Sustainable Energy Reviews, 14, pp. 430-437.
Pryor, S.C., and J. Ledolter (2010). Addendum to: Wind speed trends over the
contiguous USA. Journal of Geophysical Research, 115, D10103.
Pryor, S.C., and J.T. Schoof (2010). Importance of the SRES in projections of climate
change impacts on near-surface wind regimes. Meteorologische Zeitschrift, 19,
pp. 267-274.
Pryor, S.C., R.J. Barthelmie, and E. Kjellström (2005). Potential climate change
impact on wind energy resources in northern Europe: analyses using a regional
climate model. Climate Dynamics, 25, pp. 815-835.
Pryor, S.C., J.T. Schoof, and R.J. Barthelmie (2006). Winds of change? Projections
of near-surface winds under climate change scenarios. Geophysical Research
Letters, 33, L11702.

605
Chapter 7 Wind Energy
Pryor, S.C., R.J. Barthelmie, D.T. Young, E.S. Takle, R.W. Arritt, D. Flory, W.
Gutowski Jr., A. Nunes, and J. Roads (2009). Wind speed trends over the
contiguous United States. Journal of Geophysical Research – Atmospheres, 114,
D14105.
Punt, M.J., R.A. Groeneveld, E.C. van Ierland, and J.H. Stel (2009). Spatial
planning of offshore wind farms: A windfall to marine environmental protection?
Ecological Economics, 69, pp. 93-103.
Purohit, P. (2007). Financial evaluation of renewable energy technologies for
irrigation water pumping in India. Energy Policy, 35, pp. 3134-3144.
Quarton, D.C. (1998). The evolution of wind turbine design analysis – a twenty year
progress review. Wind Energy, 1, pp. 5-24.
Rahimzadeh, F., A. Noorian, M. Pedram, and M. Kruk (2011). Wind speed
variability over Iran and its impact on wind power potential: A case study of
Esfehan Province. Meteorological Applications, doi:10.1002/met.229.
Rasmussen, F., M.H. Hansen, K. Thomsen, T.J. Larsen, F. Bertagnolio, J. Johansen,
H.A. Madsen, C. Bak, and A.M. Hansen (2003). Present status of aeroelasticity
of wind turbines. Wind Energy, 6, pp. 213-228.
REN21 (2010). Renewables 2010: Global Status Report. Renewable Energy Policy
Network for the 21st Century Secretariat, Paris, France, 80 pp.
Rivier Abbad, J. (2010). Electricity market participation of wind farms: the success
story of the Spanish pragmatism. Energy Policy, 38, pp. 3174-3179.
Riziotis, V.A., S.G. Voutsinas, E.S. Politis, and P.K. Chaviaropoulos (2004).
Aeroelastic stability of wind turbines: the problem, the methods and the issues.
Wind Energy, 7, pp. 373-392.
Roberts, B.W., D.H. Shepard, K. Caldeira, M.E. Cannon, D.G. Eccles, A.J. Grenier,
and J.F. Freidin (2007). Harnessing high-altitude wind power. IEEE Transactions
on Energy Conversion, 22, pp. 136-144.
B. Rockel, and K. Woth (2007). Extremes of near-surface wind speed over Europe
and their future changes as estimated from an ensemble of RCM simulations.
Climatic Change, 81, pp. 267-280.
Rogner, H.-H., F. Barthel, M. Cabrera, A. Faaij, M. Giroux, D. Hall, V. Kagramanian,
S. Kononov, T. Lefevre, R. Moreira, R. Nötstaller, P. Odell, M. Taylor (2000).
Energy resources. In: World Energy Assessment. Energy and the Challenge
of Sustainability. United Nations Development Programme, United Nations
Department of Economic and Social Affairs, and World Energy Council, New York,
NY, USA, pp. 135-171.
Sáenz de Miera, G., P. del Río González, and I. Vizcaíno (2008). Analysing the
impact of renewable electricity support schemes on power prices: The case of
wind electricity in Spain. Energy Policy, 36, pp. 3345-3359.
Sailor, D.J., M. Smith, and M. Hart (2008). Climate change implications for wind
power resources in the Northwest United States. Renewable Energy, 33, pp.
2393-2406.
Schreck, S.J., and M.C. Robinson (2003). Boundary layer state and fl ow fi eld
structure underlying rotational augmentation of blade aerodynamic response.
Journal of Solar Energy Engineering, 125, pp. 448-457.
Schreck, S.J., M.C. Robinson, M.M. Hand, and D.A. Simms (2000). HAWT dynamic
stall response asymmetries under yawed fl ow conditions. Wind Energy, 3, pp.
215-232.
Schreck, S.J., M.C. Robinson, M.M. Hand, and D.A. Simms (2001). Blade dynamic
stall vortex kinematics for a horizontal axis wind turbine in yawed conditions.
Journal of Solar Energy Engineering, 123, pp. 272.
Schreck, S.J., J. Lundquist, and W. Shaw (2008). U.S. Department of Energy
Workshop Report: Research Needs for Wind Resource Characterization. National
Renewable Energy Laboratory, Golden, CO, USA, 116 pp.
Schumacher, A., S. Fink, and K. Porter (2009). Moving beyond paralysis: How
states and regions are creating innovative transmission policies for renewable
energy projects. The Electricity Journal, 22, pp. 27-36.
Schwartz, M., D. Heimiller, S. Haymes, and W. Musial (2010). Assessment of
Offshore Wind Energy Resource for the United States. National Renewable
Energy Laboratory, Golden, CO, USA, 104 pp.
Sensfuß, F., M. Ragwitz, and M. Genoese (2008). The merit-order effect: A detailed
analysis of the price effect of renewable electricity generation on spot market
prices in Germany. Energy Policy, 36, pp. 3086-3094.
Shafer, D.A., K.R. Strawmyer, R.M. Conley, J.H. Guidinger, D.C. Wilkie, T.F. Zellman,
and D.W. Bernadett (2001). WindPACT Turbine Design Scaling Studies: Technical
Area 4 – Balance-of-Station Cost; 21 March 2000-15 March 2001. National
Renewable Energy Laboratory, Golden, CO, USA, 219 pp.
Shen, W.Z., and J.N. Sörensen (2007). Aero-acoustic modelling using large eddy
simulation. Journal of Physics: Conference Series, 75, pp. 012085.
Siegfriedsen, S., M. Lehnhoff, and A. Prehn (2003). Primary markets for offshore
wind energy outside the European Union. Wind Engineering, 27, pp. 419-429.
Sieros, G., P. Chaviaropoulos, J. Sørensen, B. Bulder, and P. Jamieson (2011).
Upscaling wind turbines: theoretical and practical aspects and the impact on the
cost of energy. Wind Energy, accepted for publication.
Simms, D.A., S. Schreck, M. Hand, and L.J. Fingersh (2001). NREL Unsteady
Aerodynamics Experiment in the NASA-Ames Wind Tunnel: A Comparison of
Predictions to Measurements. National Renewable Energy Laboratory, Golden,
CO, USA, 51 pp.
Simons, R. (2006). Peer reviewed evidence on property value impacts by source of
contamination. In: When Bad Things Happen To Good Property. Environmental
Law Institute Press, Washington, DC, USA, pp. 63-112.
Simons, R.A., and J.D. Saginor (2006). A meta-analysis of the effect of environmental
contamination and positive amenities on residential real estate values. Journal of
Real Estate Research, 28, pp. 71-104.
Sims, S., and P. Dent P (2007). Property stigma: wind farms are just the latest
fashion. Journal of Property Investment & Finance, 25, pp. 626-651.
Sims, S., P. Dent, and G.R. Oskrochi (2008). Modelling the impact of wind farms on
house prices in the UK. International Journal of Strategic Property Management,
12, pp. 251-269.
Sinden, G. (2007). Characteristics of the UK wind resource: long-term patterns and
relationship to electricity demand. Energy Policy, 35, pp. 112-127.
Singh, B., and S.N. Singh (2009). Wind power interconnection in power system: A
review of grid code requirements. The Electricity Journal, 22, pp. 54-63.
Smallwood, K.S., and C. Thelander (2008). Bird mortality in the Altamont Pass
Wind Resource Area, California. Journal of Wildlife Management, 72, pp.
215-223.
Smith, D.A. (2001). WindPACT Turbine Design Scaling Studies Technical Area 2:
Turbine, Rotor, and Blade Logistics; March 27, 2000 to December 31, 2000.
National Renewable Energy Laboratory, Golden, CO, USA, 224 pp.
Smith, J.C., M.R. Milligan, E.A. DeMeo, and B. Parsons (2007). Utility wind
integration and operating impact state of the art. IEEE Transactions on Power
Systems, 22, pp. 900-908.

606
Wind Energy Chapter 7
Snel, H. (2003). Review of aerodynamics for wind turbines. Wind Energy, 6, pp. 203-
211.
Snel, H., J.G. Schepers, and N. Siccama (2009). Mexico Project: the database and
results of data processing and interpretation. In: 47th AIAA Aerospace Sciences
Meeting Including the New Horizons Forum and Aerospace Exposition. American
Institute of Aeronautics and Astronautics (AIAA), Orlando, Florida, 5-8 January
2009, pp. 2009-1217.
Snyder, B., and M.J. Kaiser (2009a). A comparison of offshore wind power
development in Europe and the US: Patterns and drivers of development. Applied
Energy, 86, pp. 1845-1856.
Snyder, B., and M.J. Kaiser (2009b). Ecological and economic cost-benefi t analysis
of offshore wind energy. Renewable Energy, 34, pp. 1567-1578.
Söder, L., and H. Holttinen (2008). On methodology for modelling wind power
impact on power systems. International Journal of Global Energy Issues, 29, pp.
181-198.
Söder, L., L. Hofmann, A. Orths, H. Holttinen, Y. Wan, and A. Tuohy (2007).
Experience from wind integration in some high penetration areas. IEEE
Transactions on Energy Conversion, 22, pp. 4-12.
Söderholm, P., and T. Sundqvist (2007). Empirical challenges in the use of learning
curves for assessing the economic prospects of renewable energy technologies.
Renewable Energy, 32, pp. 2559-2578.
South, P., R. Mitchell, and E. Jacobs (1983). Strategies for the Evaluation of
Advanced Wind Energy Concepts. Solar Energy Research Institute, Golden, CO,
USA, 153 pp.
Sovacool, B.K. (2009). Contextualizing avian mortality: A preliminary appraisal of
bird and bat fatalities from wind, fossil-fuel, and nuclear electricity. Energy Policy,
37, pp. 2241-2248.
Spera, D. (ed.) (2009). Wind Turbine Technology: Fundamental Concepts of Wind
Turbine Engineering. American Society of Mechanical Engineers Press, New York,
NY, USA, 638 pp.
Sta. Maria, M.R.V., and M.Z. Jacobson (2009). Investigating the effect of large
wind farms on energy in the atmosphere. Energies, 2, pp. 816-838.
Stewart, G.B., A.S. Pullin, and C.F. Coles (2007). Poor evidence-base for
assessment of windfarm impacts on birds. Environmental Conservation, 34,
pp. 1-11.
Stol, K.A., and M.J. Balas (2003). Periodic disturbance accommodating control for
blade load mitigation in wind turbines. Journal of Solar Energy Engineering, 125,
pp. 379.
Stoner, A.M.K., K. Hayhoe, and D.J. Wuebbles (2009). Assessing general circulation
model simulations of atmospheric teleconnection patterns. Journal of Climate,
22, pp. 4348.
Summers, E. (2000). Operational effects of windfarm developments on air traffi c
control (ATC) radar procedures for Glasgow Prestwick International Airport. Wind
Engineering, 24, pp. 431-435.
Sundqvist, T. (2004). What causes the disparity of electricity externality estimates?
Energy Policy, 32, pp. 1753-1766.
Swider, D.J., L. Beurskens, S. Davidson, J. Twidell, J. Pyrko, W. Prüggler, H. Auer,
K. Vertin, and R. Skema (2008). Conditions and costs for renewables electricity
grid connection: Examples in Europe. Renewable Energy, 33, pp. 1832-1842.
Swofford, J., and M. Slattery (2010). Public attitudes of wind energy in Texas:
Local communities in close proximity to wind farms and their effect on decision-
making. Energy Policy, 38, pp. 2508-2519.
Tan, X. (2010). Clean technology R&D and innovation in emerging countries –
Experience from China. Energy Policy, 38, pp. 2916-2926.
Teske, S., T. Pregger, S. Simon, T. Naegler, W. Graus, and C. Lins (2010). Energy
[R]evolution 2010—a sustainable world energy outlook. Energy Effi ciency, 4, pp.
409-433..
Thayer, R.L., and C.M. Freeman (1987). Altamont: Public perceptions of a wind
energy landscape. Landscape and Urban Planning, 14, pp. 379-398.
Thayer, R.L., and H. Hansen (1988). Wind on the land: Renewable energy and
pastoral scenery vie for dominance in the siting of wind energy developments.
Landscape Architecture, 78, pp. 69-73.
Thomsen, K., and P. Sørensen (1999). Fatigue loads for wind turbines operating in
wakes. Journal of Wind Engineering and Industrial Aerodynamics, 80, pp. 121-
136.
Toke, D. (2006). Explaining wind power planning outcomes: Some fi ndings from a
study in England and Wales. Energy Policy, 33, pp. 1527-1539.
Toke, D., S. Breukers, and M. Wolsink (2008). Wind power deployment outcomes:
How can we account for the differences? Renewable and Sustainable Energy
Reviews, 12, pp. 1129-1147.
Tougaard, J., J. Carstensen, J. Teilmann, H. Skov, and P. Rasmussen (2009).
Pile driving zone of responsiveness extends beyond 20 km for harbor porpoises
(Phocoena phocoena (L.)). The Journal of the Acoustical Society of America, 126,
pp. 11-14.
Tradewind (2009). Integrating Wind. Developing Europe’s Power Market for the
Large Scale Integration of Wind. Tradewind, Brussels, Belgium, 104 pp.
Troy, N., E. Denny, and M.J. O’Malley (2010). Base load cycling on a system
with signifi cant wind penetration. IEEE Transactions on Power Systems, 25, pp.
1088-1097.
Tuohy, A., P. Meibom, E. Denny, and M. O’Malley (2009). Unit commitment for
systems with signifi cant wind penetration. IEEE Transactions on Power Systems,
24, pp. 592-601.
Twidell, J., and G. Gaudiosi (eds.) (2009). Offshore Wind Power. Multi-Science
Publishing, Brentwood, UK, 425 pp.
UKERC (2010). Great Expectations: The Cost of Offshore Wind in UK Waters –
Understanding the Past and Projecting the Future. UK Energy Research Centre,
London, UK, 112 pp.
US DOE (2008). 20% Wind Energy by 2030: Increasing Wind Energy’s Contribution
to U.S. Electricity Supply. US Department of Energy, Washington, DC, USA,
248 pp.
Usaola, J. (2009). Probabilistic load fl ow in systems with wind generation. IET
Generation, Transmission & Distribution, 3, pp. 1031-1041.
Vajjhala, S.P., and P.S. Fischbeck (2007). Quantifying siting diffi culty: A case study
of US transmission line siting. Energy Policy, 35, pp. 650-671.
Valentine, S.V. (2010). A STEP toward understanding wind power development
policy barriers in advanced economies. Renewable and Sustainable Energy
Reviews, 14, pp. 2796-2807.
Van Bussel, G.J.W., and W. Bierbooms (2003). The DOWEC Offshore Reference
Windfarm: analysis of transportation for operation and maintenance. Wind
Engineering, 27, pp. 381-391.
van den Berg, GP. (2004). Effects of the wind profi le at night on wind turbine sound.
Journal of Sound and Vibration, 277, pp. 955-970.
van den Berg, G.P. (2005). The beat is getting stronger: the effect of atmospheric
stability on low frequency modulated sound of wind turbines. Noise Notes, 4,
pp. 15-40.

607
Chapter 7 Wind Energy
van den Berg, G.P. (2008). Wind turbine power and sound in relation to atmospheric
stability. Wind Energy, 11, pp. 151-169.
van der Horst, D. (2007). NIMBY or not? Exploring the relevance of location and
the politics of voiced opinions in renewable energy siting controversies. Energy
Policy, 35, pp. 2705-2714.
Van der Hoven, I. (1957). Power spectrum of horizontal wind speed in the frequency
range from 0.0007 to 900 cycles per hour. Journal of Atmospheric Sciences, 14,
pp. 160-164.
Vittal, E., M.J. O’Malley, and A. Keane (2010). A steady-state voltage stability
analysis of power systems with high penetrations of wind. IEEE Transactions on
Power Systems, 25, pp. 433-442.
Wagner, S., R. Bareiss, and G. Guidati (1996). Wind Turbine Noise. Springer-Verlag
Telos, Emeryville, CA, USA, 204 pp.
Wahlberg, M., and H. Westerberg (2005). Hearing in fi sh and their reactions to
sounds from offshore wind farms. Marine Ecology Progress Series, 288, pp.
295-309.
Walter, A., K. Keuler, D. Jacob, R. Knoche, A. Block, S. Kotlarski, G. Muller-
Westermeier, D. Rechid, and W. Ahrens (2006). A high resolution reference
dataset of German wind velocity 1951-2001 and comparison with regional
climate model results. Meteorologische Zeitschrift, 15, pp. 585-596.
Wan, Y., and D. Bucaneg Jr. (2002). Short-term power fl uctuations of large wind
power plants. Journal of Solar Energy Engineering, 124, pp. 427.
Wan, Y., M. Milligan, and B. Parsons (2003). Output power correlation between
adjacent wind power plants. Journal of Solar Energy Engineering, 125, pp.
551-554.
Wang, C., and R.G. Prinn (2010). Potential climatic impacts and reliability of very
large-scale wind farms. Atmospheric Chemistry and Physics, 10, pp. 2053-2061.
Wang, X.L., F.W. Zwiers, V.R. Swail, and Y. Feng (2009). Trends and variability of
storminess in the Northeast Atlantic region, 1874–2007. Climate Dynamics, 33,
pp. 1179-1195.
Warren, C., C. Lumsden, S. O’Dowd, and R. Birnie (2005). ‘Green on Green’: Public
perceptions of wind power in Scotland and Ireland. Journal of Environmental
Planning and Management, 48, pp. 853-875.
Watson, S.J., L. Landberg, and J.A. Halliday (1994). Application of wind speed
forecasting to the integration of wind energy into a large scale power system.
IEE Proceedings - Generation, Transmission and Distribution, 141, pp. 357-362.
WBGU, H. Graßl, J. Kokott, M. Kulessa, J. Luther, F. Nuscheler, R. Sauerborn,
H.J. Schellnhuber, R. Schubert, E.D. Schulze (2004). World in Transition:
Towards Sustainable Energy Systems. German Advisory Council on Global
Change (WBGU), Earthscan, London, UK and Sterling, VA, USA, 352 pp.
Weber, C. (2010). Adequate intraday market design to enable the integration of wind
energy into the European power systems. Energy Policy, 38, pp. 3155-3163.
WEC (1994). New Renewable Energy Resources: A Guide to the Future. World Energy
Council, Kogan Page, London, UK, 391 pp.
Wene, C.O. (2000). Experience curves for energy technology policy. International
Energy Agency and Organisation for Economic Co-operation and Development,
Paris, France, 127 pp.
WHO (1999). Guidelines for Community Noise. World Health Organization, Geneva,
Switzerland, 141 pp.
WHO (2009). Night Noise Guidelines for Europe. World Health Organization, Geneva,
Switzerland, 162 pp.
Wiesenthal, T., G. Leduc, H. Schwarz, and K. Haegeman (2009). R&D Investment
in the Priority Technologies of the European Strategic Energy Technology Plan.
European Commission, Joint Research Centre, Luxembourg, 84 pp.
Wiggelinkhuizen, E., T. Verbruggen, H. Braam, L. Rademakers, J. Xiang, and
S. Watson (2008). Assessment of condition monitoring techniques for offshore
wind farms. Journal of Solar Energy Engineering, 130, 031004.
Wilhelmsson, D., and T. Malm (2008). Fouling assemblages on offshore wind power
plants and adjacent substrata. Estuarine, Coastal and Shelf Science, 79, pp. 459-
466.
Wilhelmsson, D., T. Malm, and M.C. Ohman (2006). The infl uence of offshore
windpower on demersal fi sh. ICES Journal of Marine Science, 63, pp. 775.
Wilson, J.C., and M. Elliott (2009). The habitat-creation potential of offshore wind
farms. Wind Energy, 12, pp. 203-212.
Wiser, R., and M. Bolinger (2010). 2009 Wind Technologies Market Report. US
Department of Energy, Washington, DC, USA, 88 pp.
Wiser, R.H., and S.J. Pickle (1998). Financing investments in renewable energy:
the impacts of policy design. Renewable and Sustainable Energy Reviews, 2, pp.
361-386.
Wolsink, M. (1989). Attitudes and expectancies about wind turbines and wind farms.
Wind Engineering, 13, pp. 196-206.
Wolsink, M. (2000). Wind power and the NIMBY-myth: institutional capacity and the
limited signifi cance of public support. Renewable Energy, 21, pp. 49-64.
Wolsink, M. (2007). Planning of renewables schemes: Deliberative and fair
decision-making on landscape issues instead of reproachful accusations of non-
cooperation. Energy Policy, 35, pp. 2692-2704.
Wright, A.D. (2004). Modern Control Design for Flexible Wind Turbines. National
Renewable Energy Laboratory, Golden, CO, USA, 233 pp.
Wustenhagen, R., M. Wolsink, and M. Burer (2007). Social acceptance of
renewable energy innovation: An introduction to the concept. Energy Policy, 35,
pp. 2683-2691.
Wyngaard, J.C. (2004). Toward numerical modeling in the “Terra Incognita”. Journal
of the Atmospheric Sciences, 61, pp. 1816-1826.
Xiao, Z., Z. Rong, and L. Song (2010). China Wind Energy Resource Assessment
2009. China Meteorological Press, Beijing, China, 150 pp.
Xue, H., R.Z. Zhu, Z.B. Yang, and C.H. Yuan (2001). Assessment of wind energy
reserves in China. Acta Energiae Solaris Sinica, 22, pp. 168-170.
Yu, C., W. van Sark, and E. Alsema (2011). Unraveling the photovoltaic technology
learning curve by incorporation of input price changes and scale effects.
Renewable and Sustainable Energy Reviews, 15, pp. 324-337.
Zhu, W.J., W.Z. Shen, and J.N. Sorensen (2007). Computational aero-acoustic using
high-order fi nite-difference schemes. Journal of Physics: Conference Series, 75,
pp. 012084.
Zhu, W.J., N. Heilskov, W.Z. Shen,and J.N. Sørensen (2005). Modeling of
aerodynamically generated noise from wind turbines. Journal of Solar Energy
Engineering, 127, pp. 517.

608