chapter 7: healthcare expenditures for persons … 7: healthcare expenditures for persons with ckd...
TRANSCRIPT

2018 USRDS ANNUAL DATA REPORT | VOLUME 1: CKD IN THE UNITED STATES 133
Chapter 7: Healthcare Expenditures for Persons with CKD
In this 2018 Annual Data Report (ADR), we introduce information from the Optum Clinformatics™ DataMart for persons with Medicare Advantage and commercial managed care coverage. This will provide a more comprehensive examination of the financial costs necessary to provide care to beneficiaries with chronic kidney disease (CKD).
Medicare spending for all beneficiaries who had CKD (12.5% of total) exceeded $79 billion in 2016, an increase of 23% from 2015 (Tables 7.1 and 7.3). When adding an extra $35 billion for end-stage renal disease (ESRD) costs (see Volume 2, Chapter 9: Healthcare Expenditures for Persons with ESRD, Figure 9.2), total Medicare spending on both CKD and ESRD was over $114 billion, representing 23% of total Medicare fee-for-service (FFS) spending.
In 2016, Medicare spending for beneficiaries with CKD aged 65 and older exceeded $67 billion, representing 25% of all Medicare spending in this age group (Figure 7.1). Medicare expenditures for CKD were 20% higher in 2016 than in 2015 ($55 billion).This was mostly due to an 18% increase in the ascertainment of CKD.
Medicare spending for beneficiaries with CKD who were younger than age 65 (8% of total) exceeded $12 billion in 2016, representing 18% of total spending in this age group (Table 7.3).
Growth in total CKD spending has primarily been driven by an increase in the number of identified cases, particularly those in the earlier stages (CKD Stages 1-3).
Over half of the 2016 Medicare spending for beneficiaries aged 65 and older was for those who had diagnoses of CKD, diabetes mellitus (DM), or heart failure (HF; Figure 7.1).
Over 78% of total Medicare spending for beneficiaries with CKD who were aged 65 and older was incurred by the 71% of these patients who also had DM, HF, or both (Table 7.1).
Spending per patient-year for those with all three chronic conditions of CKD, DM, and HF was more than twice as high ($39,506) than for beneficiaries with only CKD ($16,176; Table 7.1).
Per-person per-year spending for Medicare Advantage enrollees over age 65 and those enrolled in Optum Clinformatics™ managed care over age 65 was slightly higher, at 79% and 123% of the expenditures for FFS Medicare (Table 7.2).
For beneficiaries under age 65, spending was somewhat higher in the Medicare Advantage program than in FFS Medicare, both when averaged across all beneficiaries (12% higher) and among all those with CKD (6% higher; Table 7.3).
In the FFS Medicare CKD population, Black/African American beneficiaries continued to exhibit higher spending in all disease categories as compared to Whites and those of other races (Table 7.5). However, Blacks with Medicare Advantage had lower spending than patients of other races (Table 7.6).
The analysis of expenses for beneficiaries with CKD indicates the effect of cost-containment efforts in this population, and avenues for potential savings. Reduction in expenditures could be achieved through the prevention of disease progression to later stages of CKD, and prevention of the development of concurrent chronic conditions such as DM and HF.

2018 USRDS ANNUAL DATA REPORT | VOLUME 1: CKD IN THE UNITED STATES
134
Introduction
Persons with chronic kidney disease (CKD) but not
end-stage renal disease (ESRD) often have extensive
healthcare needs and frequently face co-existing
illnesses. This chapter assesses the overarching
financial cost of caring for persons with CKD through
comparison of expenditures in three payment systems.
As in previous Annual Data Reports (ADR), the
Medicare 5% sample was used to determine spending
for Medicare fee-for-service (FFS) beneficiaries. In this
chapter, we present recent patterns and longer-term
trends in both total claims-based spending and
spending by CKD status, patient characteristics such
as age, sex, and race, and diabetes mellitus (DM) and
heart failure (HF) status.
In this 2018 ADR, we add comparable information
from the Optum Clinformatics™ DataMart for persons
enrolled in Medicare Advantage and through a large
commercial managed care organization. The percent
of Medicare beneficiaries enrolled in managed care
grew from 13% in 2004 to 33% in 2017 (Kaiser, 2017);
19.0 million individuals were enrolled in an Medicare
Advantage plan in March 2017. Addition of this dataset
makes our assessment of CKD spending significantly
more comprehensive, particularly for the CKD
population aged 65 and older. Similarly, the addition
of commercial insurance data allows more complete
assessment of CKD spending, particularly for those
younger than age 65, as commercial insurance was the
largest source of payment for this group.
While our analyses provide a sound and valid
estimate of the costs of CKD to healthcare systems,
when interpreting spending levels and trends in these
claims data, the impact of potential under-
identification should be kept in mind. Unlike ESRD,
where determination is straightforward due to the
need for renal replacement services, CKD can be
under-identified. There may be valid under-
recognition that occurs when patients who have
impaired renal function have not yet been tested.
Claims-based under-identification can also occur
when patients who have been tested and identified
clinically do not have a CKD diagnosis listed on an
insurance claim. Such under-identification makes the
determination of the full economic impact of CKD on
a healthcare system challenging.
Under-recognition of CKD can affect estimates of
CKD-related expenditures in several ways.
Identification of persons with CKD using ICD-9-CM
and ICD-10-CM (International Classification of
Diseases, Ninth and Tenth Revision, Clinical
Modification) diagnosis codes will result in an
underestimate of total CKD expenditures, as early in
the disease process formal diagnoses of CKD are not
commonly documented or may not even have been
identified clinically (Grams, 2011). Assuming that
under-identification occurs most often in the earliest
and least costly patient cases, spending estimates per
patient per year (PPPY) calculated solely from the
claims-based diagnoses of CKD are likely to be biased
upwards. To the extent that under-identification is not
constant over time, interpretation of trend data for
both total and PPY expenditures should be made in
this context.
In addition, it is not possible to attribute healthcare
expenditures solely to kidney disease with any
accuracy; the costs of CKD are influenced by its
interactive nature and associations with other chronic
conditions such as DM and hypertension (HTN), and
with cardiovascular diseases (CVD) such as coronary
artery disease, cerebrovascular disease, peripheral
arterial disease, and HF. In order to understand better
the complexity of how these conditions contribute to
costs, we often present and compare results for
patients with varying combinations of CKD, DM, and
HF.
Similar issues of CKD under-identification are also
discussed in this 2018 ADR in the following chapters in
Volume 1: Chapter 1: CKD in the General Population;
Chapter 2: Identification and Care of Patients with
CKD; and Chapter 3: Morbidity and Mortality in
Patients with CKD.

CHAPTER 7: HEALTHCARE EXPENDITURES FOR PERSONS WITH CKD
135
Methods
This chapter uses data from three primary sources
including beneficiaries of general Medicare, those
enrolled in Medicare Advantage plans, and a cohort of
individuals enrolled in a commercial managed care
plan.
The Medicare 5% sample provides information on
FFS beneficiaries aged 66 and older. Roughly 98% of
Americans aged 65 and older qualify for Medicare, and
as a result, analysis of Medicare data is representative
of beneficiaries age 65 and older.
Medicare prescription drug coverage through Part
D plans is also included in this chapter. Note that
beneficiaries have many options to purchase
prescription drugs, so the claims filled through the
Part D plan may not represent all medications
prescribed to Medicare beneficiaries.
In addition to reporting on the population aged 65
and older, beginning in 2014, we have added
information on beneficiaries younger than 65 who
generally were Medicare-eligible due to disability.
Data from the Optum Clinformatics™ DataMart is
presented for those both younger than 65, and 65 and
older.
The Optum Clinformatics™ DataMart includes a
cohort of individuals with commercial managed care
plans. Optum Clinformatics™ data provides paid
medical and prescription claims and enrollment
information for national participants in the
commercial managed care plans of a large U.S. health
insurance company. The data was purchased from
OptumInsight, and participants are enrolled in both a
medical and a prescription plan. There was a complete
refresh of data for all years for Optum this year in
comparison with last year. Optum also added new
claims sources, which contributed to the increase in
claim counts and the difference in this year’s counts
compared to the 2017 ADR.
The methodology we employed to calculate costs
related to CKD (excluding ESRD) utilizes ICD-9-CM
and ICD-10-CM diagnosis codes to define the point
prevalent CKD cohort. We included only those
beneficiaries classified as having CKD on January 1 of
each given year, to avoid possible association with
acute kidney injury (AKI). How to best integrate the
costs of AKI patients into CKD calculations is a
continuing area for research, due to the potential for
transition from AKI to CKD.
In this chapter, we defined costs as insurance
expenditures rather than true economic costs, using
claims from Medicare Parts A, B, and D as based on
the 5% Medicare sample for calendar years 1996-2016
and from 100% of the Optum Clinformatics™ dataset
for calendar years 2006-2016. To account for
differences in pricing across health plans and provider
contracts, Optum Clinformatics™ applies standard
pricing algorithms to claims data. These algorithms
were designed to create standard prices that reflect
allowed payments across all provider services.
Details of this data are described in the Data
Sources section of the CKD Analytical Methods
chapter. For an explanation of the analytical methods
used to generate the study cohorts, figures, and tables
in this chapter, see the section on Chapter 7 within the
CKD Analytical Methods chapter. Downloadable
Microsoft Excel and PowerPoint files containing the
data and graphics for these figures and tables are
available on the USRDS website.

2018 USRDS ANNUAL DATA REPORT | VOLUME 1: CKD IN THE UNITED STATES
136
Spending for CKD and Related Chronic Comorbidities
BENEFICIARIES AGED 65 AND OLDER
FEE-FOR-SERVICE MEDICARE
Examining FFS Medicare spending reinforces
CKD’s reputation as a cost multiplier. Beneficiaries
with recognized CKD represent 13% of the point
prevalent aged Medicare population, yet accounted for
25% of total expenditures (Table 7.1).
We examined 2016 costs in relation to beneficiaries’
CKD stage, age, sex, race, and concurrent disease,
focusing on DM and HF. These conditions, in addition
to CKD, represent some of the costliest chronic
disease populations for Medicare. For example, HF
affects 9% of beneficiaries in the FFS Medicare
population, but accounts for 20% of expenditures.
Thirty-five percent of overall expenditures were
directed toward the 24% of beneficiaries with DM.
In those aged 65 and older, per-person per-year
(PPPY) costs were 93% higher for patients with CKD
only, versus those with no CKD, DM, or HF ($16,176 vs
$8,400). Costs for those with CKD and DM were 54%
higher than for those with DM only. Similarly,
expenditures for those with CKD and HF were 46%
higher than for those with HF alone. For beneficiaries
with CKD, HF, and DM, costs were 49% higher than
for those with only HF and DM. Overall, people with
diagnoses of any condition of CKD, DM, and/or HF
accounted for one-third of the Medicare aged 65 and
older population, but over half of total programmatic
costs.
vol 1 Table 7.1 Prevalent Medicare fee-for-service patient counts and spending for beneficiaries aged 65 and older, by diabetes, heart failure, and/or CKD, ESRD excluded, 2016
U.S. Medicare
Population Total Spending
(millions, U.S. $) PPPY
(U.S. $) Population
(%) Spending
(%)
All 24,247,520 $271,334 $11,534 100 100
With HF or CKD or DM 8,246,040 $139,538 $17,809 34.01 51.43
CKD only (- DM & HF) 1,176,200 $18,139 $16,176 4.85 6.69
DM only (- HF & CKD) 3,730,480 $44,533 $12,229 15.39 16.41
HF only (- DM & CKD) 860,780 $17,372 $21,808 3.55 6.40
CKD and DM only (- HF) 1,183,580 $21,738 $19,243 4.88 8.01
CKD and HF only (- DM) 367,500 $10,124 $31,887 1.52 3.73
DM and HF only (- CKD) 424,260 $10,445 $26,544 1.75 3.85
CKD and HF and DM 503,240 $17,187 $39,506 2.08 6.33
No CKD or DM or HF 16,001,480 $131,796 $8,400 65.99 48.57
All CKD (+/- DM & HF) 3,230,520 $67,188 $22,369 13.32 24.76
All DM (+/- CKD & HF) 5,841,560 $93,904 $16,769 24.09 34.61
All HF (+/- DM & CKD) 2,155,780 $55,128 $28,378 8.89 20.32
CKD and DM (+/- HF) 1,686,820 $38,925 $24,877 6.96 14.35
CKD and HF (+/- DM) 870,740 $27,311 $36,291 3.59 10.07
DM and HF (+/- CKD) 927,500 $27,633 $33,350 3.83 10.18
Data Source: Medicare 5% sample. Abbreviations: CKD, chronic kidney disease; ESRD, end-stage renal disease; HF, heart failure; DM, diabetes mellitus; PPPY, per-person per-year.

CHAPTER 7: HEALTHCARE EXPENDITURES FOR PERSONS WITH CKD
137
MEDICARE ADVANTAGE AND COMMERCIAL MANAGED
CARE COVERAGE
CKD was also a cost multiplier for individuals 65 and
older who were beneficiaries of Medicare Advantage or
commercial managed care plans. The Medicare
Advantage population was similar to FFS Medicare, with
15% having CKD and those with CKD accounting for
24% of spending. The managed care population had a
lower prevalence of CKD (8%), but those with CKD also
accounted for an outsized (17%) proportion of spending.
Per-person per-year spending in these populations
was somewhat higher than that for FFS Medicare
(Zuckerman, 2017). In this dataset, Optum
Clinformatics™ Medicare Advantage spending was 79%
of those receiving FFS Medicare, with managed care
beneficiaries at 123%. Such differences can arise from
plan effects (e.g., care management activities of
Medicare Advantage plans) or patient selection (e.g.,
those over 65 with commercial coverage are often still
employed). Spending for those with CKD only was 72%
($13,418 vs $7,813) and 132% ($22,124 vs $9,527) higher
than for those with no CKD, DM, or HF in the Medicare
Advantage and managed care populations.
vol 1 Table 7.2 Prevalent Medicare Advantage and managed care spending for beneficiaries aged 65 and older, by diabetes, heart failure, and/or CKD, ESRD excluded, 2016 Medicare Advantage Managed care
PPPY (U.S. $)
Population (%)
Spending (%)
PPPY
(U.S. $) Population
(%) Spending
(%)
All $10,356 100 100 $12,176 100 100
With HF or CKD or DM $15,362 34.15 49.97 $20,562 24.15 40.53
CKD only (- DM & HF) $13,418 5.96 7.63 $22,124 3.33 6.04
DM only (- HF & CKD) $11,942 15.48 17.92 $15,627 13.74 17.63
HF only (- DM & CKD) $18,291 2.74 4.67 $24,352 1.98 3.93
CKD and DM only (- HF) $16,051 5.31 8.15 $25,132 2.68 5.51
CKD and HF only (- DM) $24,601 1.53 3.36 $37,903 0.77 2.25
DM and HF only (- CKD) $23,949 1.38 3.08 $32,561 0.87 2.28
CKD and HF and DM $33,143 1.75 5.17 $48,110 0.78 2.90
No CKD or DM or HF $7,813 65.85 50.03 $9,527 75.85 59.47
All CKD (+/- DM & HF) $17,757 14.54 24.30 $27,289 7.56 16.70
All DM (+/- CKD & HF) $14,968 23.92 34.32 $19,164 18.07 28.31
All HF (+/- DM & CKD) $24,063 7.40 16.28 $32,359 4.40 11.35
CKD and DM (+/- HF) $20,066 7.06 13.32 $30,085 3.46 8.41
CKD and HF (+/- DM) $29,158 3.28 8.52 $43,047 1.55 5.15
DM and HF (+/- CKD) $28,988 3.13 8.25 $39,754 1.65 5.18
Data Source: Optum Clinformatics™. Abbreviations: CKD, chronic kidney disease; ESRD, end-stage renal disease; HF, heart failure; DM, diabetes mellitus; PPPY, per-person per-year. Numbers of ‘All’ patients included in this table are 2,536,831 and 236,268 for Medicare Advantage and Commercial managed care respectively.

2018 USRDS ANNUAL DATA REPORT | VOLUME 1: CKD IN THE UNITED STATES
138
BENEFICIARIES YOUNGER THAN AGE 65
FEE-FOR-SERVICE MEDICARE
For the FFS Medicare population under age 65 only
8% had CKD, but those individuals accounted for 18%
of spending. One-fourth had one or more of CKD,
DM, and/or HF, accounting for almost 44% of
spending for this group (Table 7.3). Much of these
expenditures, however, were for those who had DM, at
22% of the population and 34% of spending.
vol 1 Table 7.3 Prevalent Medicare fee-for-service patient counts and spending for beneficiaries younger than age 65, by diabetes, heart failure, and/or CKD, ESRD excluded, 2016
U.S. Medicare Population
Total Costs (millions, U.S. $)
PPPY spending (U.S. $)
Population (%)
Spending (%)
All 4,709,780 $66,276 $14,558 100 100
With HF or CKD or DM 1,269,900 $28,917 $23,851 26.96 43.63
CKD only (- DM & HF) 111,820 $2,691 $25,394 2.37 4.06
DM only (- HF & CKD) 714,800 $12,248 $17,705 15.18 18.48
HF only (- DM & CKD) 96,120 $2,401 $26,462 2.04 3.62
CKD and DM only (- HF) 190,680 $5,429 $30,002 4.05 8.19
CKD and HF only (- DM) 23,400 $992 $46,599 0.50 1.50
DM and HF only (- CKD) 67,100 $2,078 $33,051 1.43 3.14
CKD and HF and DM 65,980 $3,079 $52,335 1.40 4.65
No CKD or DM or HF 3,439,880 $37,359 $11,185 73.04 56.37
All CKD (+/- DM & HF) 391,880 $12,190 $33,214 8.32 18.39
All DM (+/- CKD & HF) 1,038,560 $22,834 $22,961 22.05 34.45
All HF (+/- DM & CKD) 252,600 $8,549 $36,580 5.36 12.90
CKD and DM (+/- HF) 256,660 $8,508 $35,482 5.45 12.84
CKD and HF (+/- DM) 89,380 $4,071 $50,812 1.90 6.14
DM and HF (+/- CKD) 133,080 $5,157 $42,374 2.83 7.78
Data Source: Medicare 5% sample. Abbreviations: CKD, chronic kidney disease; DM, diabetes mellitus; ESRD, end-stage renal disease; HF, heart failure; PPPY, per-person per-year.

CHAPTER 7: HEALTHCARE EXPENDITURES FOR PERSONS WITH CKD
139
MEDICARE ADVANTAGE AND COMMERCIAL MANAGED
CARE COVERAGE
The Medicare Advantage population under age 65
was similar to the FFS Medicare population. Thirty-
three percent of the Medicare Advantage beneficiaries
had one or more of CKD, DM, and/or HF, accounting
for 49% of spending for this group (Table 7.4). The
managed care population under age 65 was much less
likely to have CKD, DM, or HF (6%) than the
Medicare Advantage population (33%).
For those under age 65, spending was somewhat
higher for beneficiaries in the Medicare Advantage
program, both when averaged across all beneficiaries
(12% higher: $16,358 vs $14,558) and among all with
CKD (1.9% lower: $32,571 vs $33,214; Tables 7.3 and
7.4). Consistent with our other findings, average
spending for those with CKD was considerably lower
(27% lower for those with CKD: $24,214 vs $33,214) in
the managed care population than in the Medicare
FFS and Medicare Advantage populations.
vol 1 Table 7.4 Prevalent Medicare Advantage and managed care fee-for-service spending for beneficiaries younger than age 65, by diabetes, heart failure, and/or CKD, ESRD excluded,2016
Medicare Advantage Managed care
PPPY (U.S. $)
Population (%) Spending
(%)
PPPY (U.S. $)
Population (%) Spending
(%)
All $16,358 100 100 $5,317 100 100
With HF or CKD or DM $24,317 33.34 49.24 $15,313 6.43 18.54
CKD only (- DM & HF) $25,398 3.24 5.00 $18,996 0.77 2.74
DM only (- HF & CKD) $18,863 19.32 22.30 $12,161 4.77 10.96
HF only (- DM & CKD) $27,505 2.06 3.41 $23,139 0.29 1.25
CKD and DM only (- HF) $28,616 4.62 8.03 $25,423 0.40 1.91
CKD and HF only (- DM) $45,866 0.67 1.78 $52,704 0.05 0.42
DM and HF only (- CKD) $33,680 1.83 3.70 $32,309 0.10 0.59
CKD and HF and DM $54,296 1.60 5.01 $71,480 0.05 0.66
No CKD or DM or HF $12,416 66.66 50.76 $4,629 93.57 81.46
All CKD (+/- DM & HF) $32,571 10.13 19.83 $24,214 1.27 5.73
All DM (+/- CKD & HF) $23,449 27.37 39.04 $14,066 5.32 14.13
All HF (+/- DM & CKD) $38,093 6.15 13.91 $32,647 0.49 2.92
CKD and DM (+/- HF) $34,971 6.22 13.05 $30,457 0.45 2.57
CKD and HF (+/- DM) $51,798 2.26 6.80 $62,768 0.10 1.08
DM and HF (+/- CKD) $43,101 3.42 8.71 $45,383 0.15 1.25
Data Source: Optum Clinformatics™. Abbreviations: CKD, chronic kidney disease; HF, heart failure; DM, diabetes mellitus; ESRD, end-stage renal disease; PPPY, per-person per-year. Number of ‘All’ patients included in this table are 279,972 and 5,011,031 for Medicare Advantage and Managed care respectively.

2018 USRDS ANNUAL DATA REPORT | VOLUME 1: CKD IN THE UNITED STATES
140
Spending for CKD by Stage and Patient Characteristics
Among the FFS Medicare population aged 65 and
older, between 2015 and 2016 total spending for Parts
A, B, and D rose by $8 billion, to $271 billion. Total
spending for CKD patients rose by $11.2 billion, to
$67.2 billion (Figure 7.1).
Further, total Medicare expenditures were higher
for beneficiaries with CKD than for beneficiaries with
ESRD ($67.2 billion vs. $35.4 billion; see Volume 2,
Chapter 9: Healthcare Expenditures for Persons with
ESRD). Expenditures for beneficiaries with CKD now
represent 24.8% of all Medicare Parts A, B, and D non-
ESRD spending.
Expenditures increased for all covered groups, but
the highest growth rates occurred in those with CKD
and DM, followed by all CKD, and then CKD and HF
and DM. The spending increase appears to be driven
by a rise in the proportion of beneficiaries with
recognized CKD (see Table 7.7 and Volume 1, Chapter
2: Identification and Care of Patients with CKD, Figure
2.2).
vol 1 Figure 7.1 Overall Medicare Parts A, B, and D fee-for-service spending for beneficiaries aged 65 and older, by CKD, diabetes, and heart failure, ESRD excluded, 2015 & 2016
Data source: Medicare 5% sample. Abbreviations: CKD, chronic kidney disease; DM, diabetes mellitus; ESRD, end-stage renal disease; HF, heart failure.

CHAPTER 7: HEALTHCARE EXPENDITURES FOR PERSONS WITH CKD
141
All CKD patients 65 and older required increased
care as they progressed to later stages of disease
(Figures 7.2.a-c; see Table A for CKD definitions). In
the FFS Medicare population, PPPY expenditures in
2016 ranged from $19,074 for those in Stages 1-2, to
$29,151 for those in Stages 4-5. In the Medicare
Advantage population, expenditures increased from
$17,756 in Stages 1-2 to $26,314 in Stages 4-5. The
managed care population was similar, with
expenditures of $27,289 in Stages 1-2 to $35,886 in
Stages 4-5.
Group trends in PPPY spending from 2013-2016
were mixed (Figures 7.2.a-c). FFS Medicare saw PPPY
expenditures increase 1.7% overall for individuals with
any CKD, but the increase was most dramatic for
those in Stages 4-5, rising by 6.3%. However, PPPY
spending dropped 15% over this period for Medicare
Advantage beneficiaries with CKD. Spending for
managed care beneficiaries moved without clear
patterns, but it should be noted that in 2016 the
Optum Clinformatics™ population of managed care
enrollees with CKD was relatively small (N=17,864).
Overall PPPY spending was slightly higher in 2016
than in 2013, but spending on beneficiaries in Stages 1-
2 decreased by 2%, while expenditures on beneficiaries
in Stages 4-5 decreased by 15%.
vol 1 Figure 7.2 Overall per-person per-year spending for beneficiaries aged 65 and older, by CKD stage, and year, ESRD excluded, 2013-2016
(a) Medicare fee-for service
Figure 7.2 continued on next page.

2018 USRDS ANNUAL DATA REPORT | VOLUME 1: CKD IN THE UNITED STATES
142
vol 1 Figure 7.2 Overall per-person per-year spending for beneficiaries aged 65 and older, by CKD stage, and year, ESRD excluded, 2013-2016 (continued)
(b) Medicare Advantage
(c) Managed care
Data Source: Medicare 5% sample and Optum Clinformatics™. Abbreviations: CKD, chronic kidney disease; ESRD, end-stage renal disease; PPPY, per-person per-year; Unk/Unspc, CKD stage unknown or unspecified.

CHAPTER 7: HEALTHCARE EXPENDITURES FOR PERSONS WITH CKD
143
Table A. ICD-9-CM and ICD-10-CM codes for Chronic Kidney Disease (CKD) stages
ICD-9-CM codea ICD-10-CM codea Stage
585.1 N18.1 CKD, Stage 1
585.2 N18.2 CKD, Stage 2 (mild)
585.3 N18.3 CKD, Stage 3 (moderate)
585.4 N18.4 CKD, Stage 4 (severe)
585.5 N18.5 CKD, Stage 5 (excludes 585.6: Stage 5, requiring chronic dialysisb)
CKD Stage-unspecified CKD Stage-unspecified For these analyses, identified by multiple codes including 585.9, 250.4x,
403.9x & others for ICD-9-CM and A18.xx, E08.xx, E11.xx and others for
ICD-10-CM.
a For analyses in this chapter, CKD stage estimates require at least one occurrence of a stage-specific code, and the last available CKD stage in a given year is used. b In USRDS analyses, patients with ICD-9-CM code 585.6 or ICD-10-CM code N18.6 & with no ESRD 2728 form or other indication of end-stage renal disease (ESRD) are considered to have code 585.5 or N18.5.
Table 7.5 presents PPPY Medicare FFS spending for
Parts A, B, and D services, for beneficiaries with CKD
(but not ESRD), by stage of CKD. In 2016, PPPY costs
reached $22,369 for FFS Medicare CKD patients aged
65 and older, a slight increase from 2015 ($22,314). The
spending was increased slightly across all the CKD
stages. During this period, the distribution of
identified patient years also shifted towards the less
severe and less costly stages. In 2016, costs for
beneficiaries with Stages 4-5 CKD ($29,285) were 48%
greater than for beneficiaries with Stages 1-2 CKD
($19,737). Although the number of beneficiaries with
unknown/unspecified CKD stage increased, this still
accounted for one-third of all cases of CKD. The PPPY
costs for those unknown/unspecified were similar to
the overall CKD population.
Spending for Black beneficiaries with CKD
exceeded that for Whites by 9.6%, a slightly increase
over the 9.1% disparity observed in 2015. Per capita
spending for Whites increased slightly while per
capita spending for Blacks stayed the same.

2018 USRDS ANNUAL DATA REPORT | VOLUME 1: CKD IN THE UNITED STATES
144
vol 1 Table 7.5 Per-person-per year Medicare Parts A, B, and D fee-for-service spending for all CKD beneficiaries aged 65 and older, by CKD stage, age, sex, and race, ESRD excluded, 2015 & 2016
2015 2016
Any CKD
Stages 1-2
Stage 3
Stages 4-5
Unk/ Unspc
Any CKD Stages
1-2 Stage
3 Stages
4-5 Unk/
Unspc
Patient years at risk 2,509,508 266,835 1,231,417 228,519 782,737 3,003,561 307,714 1,411,160 244,364 1,040,323
All patients $22,314 $19,137 $21,734 $29,256 $22,282 $22,369 $19,737 $21,932 $29,285 $22,117
Age
65-69 $21,234 $17,945 $20,897 $31,636 $20,597 $21,266 $18,456 $21,820 $31,291 $20,150
70-74 $20,461 $16,844 $20,053 $28,638 $20,518 $21,237 $17,800 $21,018 $28,904 $21,184
75-79 $21,587 $18,772 $20,921 $28,608 $21,818 $22,082 $19,493 $21,517 $29,940 $21,951
80-84 $22,818 $19,844 $22,266 $28,770 $22,862 $22,683 $20,711 $21,724 $29,032 $23,051
85+ $24,674 $22,812 $23,725 $29,305 $24,972 $24,178 $22,713 $23,180 $28,460 $24,776
Sex
Male $22,031 $18,577 $21,685 $29,345 $21,770 $22,134 $19,636 $21,974 $29,488 $21,485
Female $22,573 $19,681 $21,780 $29,184 $22,754 $22,585 $19,835 $21,894 $29,118 $22,699
Race
White $22,074 $18,880 $21,643 $28,387 $22,051 $22,189 $19,695 $21,809 $28,440 $22,013
Black/African American $24,086 $19,907 $22,549 $34,080 $24,264 $24,086 $20,229 $23,104 $34,126 $23,600
Other $22,577 $20,928 $21,654 $30,097 $22,261 $21,970 $19,373 $21,727 $29,794 $21,312
Data source: Medicare 5% sample. Abbreviations: CKD, chronic kidney disease; ESRD, end-stage renal disease; Unk/Unspc, CKD stage unknown or unspecified.

CHAPTER 7: HEALTHCARE EXPENDITURES FOR PERSONS WITH CKD
145
Table 7.6 presents overall PPPY spending for Medicare Advantage and
managed care beneficiaries with CKD (but not ESRD) by stage of CKD
(see Table A for definitions). In contrast to the FFS Medicare population,
for these patients spending generally decreased with age and was
substantially lower for Blacks than Whites, by 24% for those covered by
Medicare Advantage and 28% in the managed care population.This is an
area for further research.
vol 1 Table 7.6 Per-person per-year Medicare Advantage and managed care spending for all CKD beneficiaries aged 65 and older, by CKD stage, age, sex, and race, ESRD excluded, 2016
Medicare Advantage Managed care
Any CKD Stages
1-2 Stage
3 Stages
4-5 Unk/
Unspc Any CKD
Stages 1-2
Stage 3
Stages 4-5
Unk/ Unspc
Patient years at risk 350,359 70,836 169,180 37,853 72,490 16,032 2,945 6,534 1,752 4,802
All patients $17,757 $16,051 $15,708 $26,314 $19,737 $27,289 $26,869 $25,394 $35,886 $26,989
Age
65-69 $20,238 $16,993 $18,456 $33,200 $21,153 $27,172 $27,963 $45,841 $29,063 $27,172
70-74 $18,399 $14,977 $16,476 $31,252 $20,080 $28,435 $27,221 $41,549 $28,127 $28,435
75-79 $18,411 $16,221 $16,645 $27,323 $20,342 $23,993 $24,890 $33,114 $26,535 $23,993
80-84 $17,602 $16,536 $15,505 $26,061 $19,339 $29,480 $23,935 $29,858 $24,574 $29,480
85+ $15,161 $15,931 $13,307 $19,254 $17,391 $24,092 $20,803 $23,593 $19,529 $24,092
Sex
Male $18,745 $17,096 $16,836 $27,768 $19,949 $27,717 $26,428 $38,560 $27,726 $27,717
Female $16,936 $15,071 $14,841 $25,094 $19,550 $25,316 $23,820 $31,944 $25,683 $25,316
Race
White $18,655 $18,145 $16,437 $25,779 $20,591 $27,390 $27,099 $25,287 $35,284 $27,487
Black/African American $13,489 $10,069 $12,821 $21,514 $14,478 $19,682 $13,956 $17,829 $24,685 $26,569
Other $16,545 $13,617 $14,579 $27,751 $18,631 $27,686 $27,816 $26,475 $38,685 $25,260
Data Source: Optum Clinformatics™. Abbreviations: CKD, chronic kidney disease; ESRD, end-stage renal disease; Unk/Unspc, CKD stage unknown or unspecified.

2018 USRDS ANNUAL DATA REPORT | VOLUME 1: CKD IN THE UNITED STATES
146
Tables 7.7 and 7.8 present PPPY spending for beneficiaries with both
CKD and DM. These tables show similar results as in the overall CKD
population. Among the 2016 FFS Medicare beneficiaries with these two
conditions, PPPY spending for Blacks was $26,168—5.6% greater than the
$24,788 incurred for Whites. Yet, spending by Medicare Advantage was
27% lower for Blacks than Whites and 33% lower for the managed care
population.
vol 1 Table 7.7 Per-person per-year Medicare Parts A, B, and D fee-for-service spending for CKD patients with diabetes, aged 65 and older, by CKD stage, age, sex, and race, ESRD excluded, 2015 & 2016
2015 2016
Any CKD
Stages 1-2
Stage 3
Stages 4-5
Unk/ Unspc Any CKD Stages
1-2 Stage
3 Stages
4-5 Unk/ Unspc
Patient years at risk 1,202,549 128,812 594,206 120,943 358,589 1,564,729 153,255 682,630 129,606 599,238
All patients $25,386 $21,872 $24,986 $33,107 $24,708 $24,877 $22,575 $25,140 $32,671 $23,480
Age
65-69 $24,704 $20,387 $24,908 $35,736 $23,152 $23,643 $21,975 $25,439 $34,027 $21,248
70-74 $23,604 $19,389 $23,191 $32,814 $23,305 $23,728 $20,446 $24,415 $31,653 $22,549
75-79 $24,944 $22,135 $24,224 $32,342 $24,790 $24,873 $21,861 $24,822 $33,501 $23,834
80-84 $26,131 $22,499 $25,907 $32,660 $25,275 $25,641 $24,027 $25,134 $31,797 $25,020
85+ $27,935 $27,447 $27,135 $32,671 $27,413 $27,029 $26,592 $26,089 $32,614 $26,632
Sex
Male $24,598 $21,033 $24,355 $33,343 $23,660 $24,178 $22,149 $24,529 $32,248 $22,652
Female $26,174 $22,778 $25,627 $32,910 $25,766 $25,556 $23,036 $25,761 $33,031 $24,244
Race
White $25,145 $21,348 $25,039 $32,129 $24,396 $24,788 $22,586 $25,118 $31,979 $23,478
Black/African American $27,126 $23,396 $25,293 $37,237 $27,145 $26,168 $22,530 $25,623 $36,148 $24,927
Other $24,968 $24,044 $23,808 $34,054 $24,066 $23,769 $22,539 $24,583 $32,358 $21,599
Data source: Medicare 5% sample. Abbreviations: CKD, chronic kidney disease; ESRD, end-stage renal disease; Unk/Unspc, CKD stage unknown or unspecified.

CHAPTER 7: HEALTHCARE EXPENDITURES FOR PERSONS WITH CKD
147
vol 1 Table 7.8 Per-person per-year Medicare Advantage and managed care spending for CKD patients with diabetes, aged 65 and older, by CKD stage, age, sex, and race, ESRD excluded, 2016
Medicare Advantage Managed care
Any CKD
Stages 1-2
Stage 3
Stages 4-5
Unk/ Unspc
Any CKD Stages
1-2 Stage
3 Stages
4-5 Unk/ Unspc
Patient years at risk 169,933 36,448 78,671 19,927 34,887 7,323 1,436 3,026 899 1,963
All patients $20,066 $18,014 $18,305 $30,438 $20,256 $30,085 $29,580 $28,857 $40,934 $27,382
Age
65-69 $22,819 $18,630 $21,982 $37,769 $22,060 $32,165 $29,730 $32,715 $51,024 $27,152
70-74 $20,443 $17,046 $18,762 $34,665 $20,469 $30,947 $28,247 $29,552 $42,224 $30,225
75-79 $20,287 $18,195 $18,954 $30,031 $20,082 $30,153 $29,062 $28,802 $37,813 $28,707
80-84 $19,474 $18,477 $17,322 $29,088 $19,658 $27,405 $35,741 $23,699 $32,824 $25,213
85+ $17,150 $18,149 $15,238 $22,104 $17,973 $23,650 $26,235 $22,955 $25,248 $22,205
Sex
Male $20,438 $18,826 $18,805 $30,954 $19,950 $30,792 $31,236 $29,317 $45,524 $25,997
Female $19,725 $17,185 $17,867 $29,985 $20,544 $28,729 $26,324 $28,036 $33,388 $29,361
Race
White $21,777 $21,466 $19,700 $30,212 $21,888 $30,043 $30,565 $28,207 $39,625 $27,941
Black/African American $14,619 $10,894 $14,592 $24,679 $13,445 $20,035 $17,429 $18,962 $24,341 $22,318
Other $18,148 $14,814 $16,533 $31,354 $18,496 $31,290 $28,702 $31,656 $46,461 $26,432
Data Source: Optum Clinformatics™. Abbreviations: CKD, chronic kidney disease; ESRD, end-stage renal disease; Unk/Unspc, CKD stage unknown or unspecified.
2018 USRDS ANNUAL DATA REPORT | VOLUME 1: CKD IN THE UNITED STATES
148
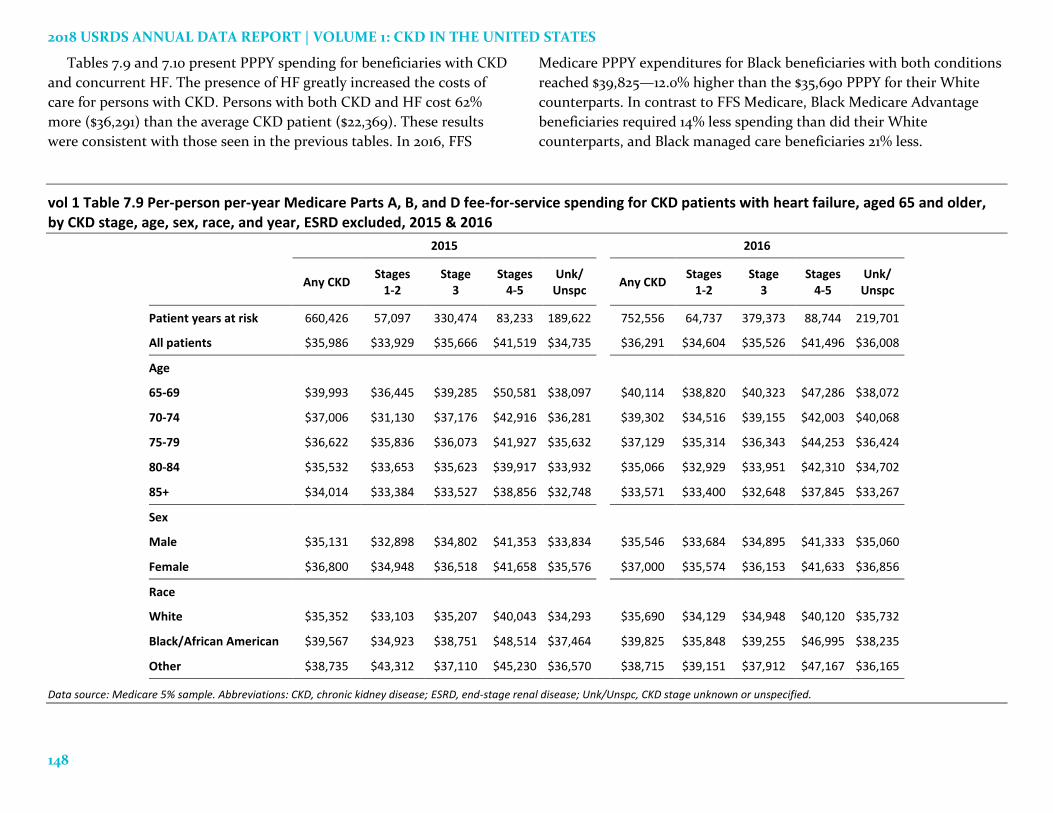
Tables 7.9 and 7.10 present PPPY spending for beneficiaries with CKD
and concurrent HF. The presence of HF greatly increased the costs of
care for persons with CKD. Persons with both CKD and HF cost 62%
more ($36,291) than the average CKD patient ($22,369). These results
were consistent with those seen in the previous tables. In 2016, FFS
Medicare PPPY expenditures for Black beneficiaries with both conditions
reached $39,825—12.0% higher than the $35,690 PPPY for their White
counterparts. In contrast to FFS Medicare, Black Medicare Advantage
beneficiaries required 14% less spending than did their White
counterparts, and Black managed care beneficiaries 21% less.
vol 1 Table 7.9 Per-person per-year Medicare Parts A, B, and D fee-for-service spending for CKD patients with heart failure, aged 65 and older, by CKD stage, age, sex, race, and year, ESRD excluded, 2015 & 2016
2015 2016
Any CKD
Stages 1-2
Stage 3
Stages 4-5
Unk/ Unspc
Any CKD Stages
1-2 Stage
3 Stages
4-5 Unk/ Unspc
Patient years at risk 660,426 57,097 330,474 83,233 189,622 752,556 64,737 379,373 88,744 219,701
All patients $35,986 $33,929 $35,666 $41,519 $34,735 $36,291 $34,604 $35,526 $41,496 $36,008
Age
65-69 $39,993 $36,445 $39,285 $50,581 $38,097 $40,114 $38,820 $40,323 $47,286 $38,072
70-74 $37,006 $31,130 $37,176 $42,916 $36,281 $39,302 $34,516 $39,155 $42,003 $40,068
75-79 $36,622 $35,836 $36,073 $41,927 $35,632 $37,129 $35,314 $36,343 $44,253 $36,424
80-84 $35,532 $33,653 $35,623 $39,917 $33,932 $35,066 $32,929 $33,951 $42,310 $34,702
85+ $34,014 $33,384 $33,527 $38,856 $32,748 $33,571 $33,400 $32,648 $37,845 $33,267
Sex
Male $35,131 $32,898 $34,802 $41,353 $33,834 $35,546 $33,684 $34,895 $41,333 $35,060
Female $36,800 $34,948 $36,518 $41,658 $35,576 $37,000 $35,574 $36,153 $41,633 $36,856
Race
White $35,352 $33,103 $35,207 $40,043 $34,293 $35,690 $34,129 $34,948 $40,120 $35,732
Black/African American $39,567 $34,923 $38,751 $48,514 $37,464 $39,825 $35,848 $39,255 $46,995 $38,235
Other $38,735 $43,312 $37,110 $45,230 $36,570 $38,715 $39,151 $37,912 $47,167 $36,165
Data source: Medicare 5% sample. Abbreviations: CKD, chronic kidney disease; ESRD, end-stage renal disease; Unk/Unspc, CKD stage unknown or unspecified.

CHAPTER 7: HEALTHCARE EXPENDITURES FOR PERSONS WITH CKD
149
vol 1 Table 7.10 Per-person per-year Medicare Advantage and managed care spending for CKD patients with heart failure, aged 65 and older, by CKD stage, age, sex, and race, ESRD excluded, 2016
Medicare Advantage Managed care
Any CKD Stages
1-2 Stage
3 Stages
4-5 Unk/
Unspc
Any CKD
Stages 1-2
Stage 3
Stages 4-5
Unk/ Unspc
Patient years at risk 74,824 14,160 35,035 10,933 14,697 3,132 616 1,307 426 783
All patients $29,158 $30,079 $26,155 $37,063 $29,550 $43,047 $45,986 $43,565 $47,448 $37,476
Age
65-69 $39,570 $39,471 $37,984 $48,091 $37,586 $60,018 $64,900 $68,670 $63,410 $46,224
70-74 $34,879 $33,139 $31,908 $48,930 $33,058 $51,973 $49,037 $52,791 $61,756 $47,758
75-79 $32,857 $33,107 $30,207 $42,309 $32,079 $37,381 $32,973 $40,399 $42,768 $32,597
80-84 $27,510 $28,022 $24,745 $36,553 $27,075 $38,351 $45,237 $39,906 $35,767 $31,106
85+ $21,381 $23,538 $19,169 $25,115 $22,496 $26,505 $29,758 $25,309 $33,010 $22,180
Sex
Male $29,982 $30,449 $27,358 $37,716 $29,941 $43,976 $43,990 $45,970 $51,554 $36,552
Female $28,406 $29,670 $25,105 $36,485 $29,212 $41,479 $49,337 $39,623 $41,231 $38,960
Race
White $29,348 $31,528 $26,268 $35,957 $29,994 $41,251 $42,145 $41,520 $48,100 $36,261
Black/African American $24,994 $20,677 $25,183 $32,092 $22,611 $33,798 $38,872 $15,882 $13,468 $55,978
Other $29,041 $28,039 $25,968 $39,652 $29,064 $50,436 $59,821 $53,558 $45,521 $40,594
Data Source: Optum Clinformatics™. Abbreviations: CKD, chronic kidney disease; ESRD, end-stage renal disease; Unk/Unspc, CKD stage unknown or unspecified.

2018 USRDS ANNUAL DATA REPORT | VOLUME 1: CKD IN THE UNITED STATES
150
Over time FFS Medicare beneficiaries aged 65 and
older with recognized CKD have accounted for an
increasing share of Medicare expenditures, expanding
from 5.8% in 2000 to 14.1% in 2008, and 24.8% in 2016.
Much of this growth was due to the increased
ascertainment of CKD as shown in Volume 1, Chapter
2: Identification and Care of Patients with CKD, Figure
2.2. Persons aged 65 and older with CKD accounted
for 2.1%, 8.8%, and 11.2% of the FFS Medicare
population in 2000, 2008, and 2016.
Figure 7.3 presents total expenditures on Parts A, B,
and D services for Medicare FFS beneficiaries with
CKD, DM, and HF. In 2016, expenditures for CKD
patients reached $67.2 billion, accounting for 24.8% of
the total spending for all FFS Medicare beneficiaries.
Care of beneficiaries with CKD and concurrent DM
required $38.9 billion in 2016, or 41.5% of the total FFS
Medicare spending on DM. Spending on HF in the FFS
Medicare population was $55.1 billion in 2016. Of this,
$27.3 billion (49.5%) was spent on the CKD patient
population with HF. Medicare expenditures for CKD
were 20% higher in 2016 ($67 billion) than in 2015 ($55
billion).This was mostly due to an 18% increase in the
ascertainment of CKD.Although 2016 represented a
change in coding (ICD-9 to ICD-10), the reason for
this increase is not known.
vol 1 Figure 7.3 Overall Medicare Parts A, B, and D fee-for-service spending for general Medicare population aged 65 and older and for those with CKD, ESRD excluded, 1996-2016
(a) All patients
Figure 7.3 continued on next page.

CHAPTER 7: HEALTHCARE EXPENDITURES FOR PERSONS WITH CKD
151
vol 1 Figure 7.3 Overall Medicare Parts A, B, and D fee-for-service spending for general Medicare population aged 65 and older and for those with CKD, ESRD excluded, 1996-2016 (continued)
(b) Patients with diabetes
(c) Patients with heart failure
Data Source: Medicare 5% sample. Abbreviations: CKD, chronic kidney disease; DM, diabetes mellitus; ESRD, end-stage renal disease; HF, heart failure.

2018 USRDS ANNUAL DATA REPORT | VOLUME 1: CKD IN THE UNITED STATES
152
Most spending for CKD patients was incurred for
inpatient and outpatient care, physician/supplier
services, and care in skilled nursing facilities.
Spending for Part D increased a great deal in recent
years. The proportion of total FFS Medicare
expenditures required to provide inpatient care was
33% in 2016, while outpatient costs were predictably
lower at 12%. Physician/supplier service costs
amounted to 23%, spending for skilled nursing
facilities was 10%, while spending for Part D reached
13% (Figure 7.4). In the Medicare non-CKD
population, these expenditure percentages were 29%
to provide inpatient care, 15% for outpatient, 28% for
physician/supplier services, and 7% for skilled nursing
facility care (not shown).
vol 1 Figure 7.4 Trends in total Medicare Parts A, B, and D fee-for-service spending for CKD patients aged 65 and older, by claim type, ESRD excluded, 2004-2016
Data source: Medicare 5% sample. Part D data occurring since 2006. Abbreviations: CKD, chronic kidney disease; ESRD, end-stage renal disease.

CHAPTER 7: HEALTHCARE EXPENDITURES FOR PERSONS WITH CKD
153
Hospitalization expenditures accounted for a large
proportion of spending for CKD. Of the 2016 inpatient
hospitalization spending for those with CKD, 23%
resulted from admissions to treat infections, and 27%
from cardiovascular conditions, with the remaining
50% resulting from all other causes (Figure 7.5).
vol 1 Figure 7.5 Total Medicare fee-for-service inpatient spending for CKD patients aged 65 and older, by cause of hospitalization, ESRD excluded, 2004-2016
Data source: Medicare 5% sample. Part D data occurring since 2006. Abbreviations: CKD, chronic kidney disease; ESRD, end-stage renal disease.

2018 USRDS ANNUAL DATA REPORT | VOLUME 1: CKD IN THE UNITED STATES
154
Figure 7.6 illustrates PPPY costs for CKD patients
aged 65 and older by the presence of DM and HF. In
2016, PPPY costs for CKD patients varied greatly by
the presence of these comorbidities. CKD patients
without DM and HF required $18,525 PPPY from FFS
Medicare. Those with DM in addition to CKD
averaged $22,751 PPPY, and beneficiaries with both
CKD and HF cost $29,664. Expenditures for those with
all three conditions reached $40,075 PPPY in 2016 for
FFS Medicare. Spending was also higher as
comorbidities increased in the managed care
populations.
vol 1 Figure 7.6 Per-person per-year Medicare, Medicare advantage, and managed care spending for CKD patients aged 65 and older, by diabetes and heart failure, ESRD excluded, 2006-2016
(a) Medicare fee-for-service
(b) Medicare Advantage
Figure 7.6 continued on next page.

CHAPTER 7: HEALTHCARE EXPENDITURES FOR PERSONS WITH CKD
155
vol 1 Figure 7.6 Per-person per-year Medicare, Medicare advantage and managed care spending for CKD patients aged 65 and older, by diabetes and heart failure, ESRD excluded, 2006-2016 (continued)
(c) Managed care
Data Source: Medicare 5% sample and Optum Clinformatics™. Abbreviations: CKD, chronic kidney disease; DM, diabetes mellitus; ESRD, end-stage renal disease; HF, heart failure; PPPY, per person per year.

2018 USRDS ANNUAL DATA REPORT | VOLUME 1: CKD IN THE UNITED STATES
156
Table 7.11 shows the distribution of CKD stages by
payer. For all payer types, reporting has become more
specific since stage specific reported began in 2007,
with the percentage of CKD cases of unknown stage
declining over time. Nonetheless, over 20% of cases
for each payer type were still of unknown stage in
2016. The distribution of cases with reported stage
became somewhat less severe over time. The
percentage of cases in the Stages 1 & 2 and Stage 3
categories grew between 2007 and 2016. Conversely,
despite the increase in stage-specific reporting overall,
the percentage of cases in Stages 4 & 5 actually
declined.
vol 1 Table 7.11 Overall CKD percentage for Medicare, Medicare advantage, and managed care beneficiaries aged 65 and older, by CKD stage, and year, ESRD excluded, 2006-2016
Year Insurance Plan CKD Stages
1 & 2 (%)
CKD Stage 3 (%)
CKD Stages
4 & 5 (%)
CKD Stage Unknown
(%)
2006 Medicare FFS 0.0 0.0 0.0 100.0 Managed care 0.0 0.0 0.0 100.0 Medicare Advantage 0.0 0.0 0.0 100.0
2007 Medicare FFS 8.6 22.2 12.5 56.7 Managed care 17.4 23.7 13.3 45.5 Medicare Advantage 19.1 23.8 12.6 44.5
2008 Medicare FFS 8.5 27.7 12.6 51.2 Managed care 18.0 28.3 15.5 38.2
Medicare Advantage 19.8 28.1 14.8 37.2
2009 Medicare FFS 8.3 31.5 12.3 47.9
Managed care 17.4 31.1 14.0 37.5
Medicare Advantage 18.7 34.9 13.3 33.1
2010 Medicare FFS 8.5 35.4 11.9 44.2
Managed care 16.9 34.6 13.2 35.4
Medicare Advantage 18.9 41.0 11.9 28.1
2011 Medicare FFS 8.7 38.6 11.4 41.3
Managed care 17.1 36.6 12.7 33.6
Medicare Advantage 18.2 44.8 11.4 25.6
2012 Medicare FFS 9.3 41.8 11.0 37.9
Managed care 17.0 38.0 12.5 32.4
Medicare Advantage 18.4 46.4 11.2 23.9
2013 Medicare FFS 9.7 44.0 10.8 35.6 Managed care 17.1 38.9 12.1 31.9
Medicare Advantage 19.4 45.9 11.0 23.7
2014 Medicare FFS 10.0 46.1 10.2 33.7
Managed care 17.0 40.3 11.4 31.2
Medicare Advantage 19.7 47.2 10.9 22.2
2015 Medicare FFS 10.4 48.5 9.9 31.2
Managed care 17.0 42.1 11.3 29.6
Medicare Advantage 18.7 48.7 10.7 21.9
2016 Medicare FFS 10.0 46.7 8.8 34.4
Managed care 18.5 40.1 11.2 30.2
Medicare Advantage 20.1 48.0 11.0 20.8
Data Source: Optum Clinformatics™. Abbreviations: CKD, chronic kidney disease; FFS, fee-for-service; ESRD, end-stage renal disease.

CHAPTER 7: HEALTHCARE EXPENDITURES FOR PERSONS WITH CKD
157
References
Centers for Medicare & Medicaid Services (CMS).
Medicare & Medicaid Statistical Supplement: 2013
Edition. https://www.cms.gov/Research-Statistics-
Data- and-Systems/Statistics-Trends-and-
Reports/MedicareMedicaidStatSupp/2013.html.
Accessed July 12, 2017.
The Henry J. Kaiser Family Foundation. Medicare
Advantage. http://kff.org/medicare/fact-
sheet/medicare- advantage. Accessed July 12, 2017.
Morgan G., Laura P., Elizabeth H., Rajiv S., Gary M.,
Desmond W., and Neil P. Validation of CKD and
related conditions in existing datasets: a systematic
review. Am J Kidney Dis 2011 January; 57(1): 44-54.
https://www.ncbi.nlm.nih.gov/pmc/articles/
PMC2978782/pdf/nihms219374.pdf
S. Zuckerman, L. Skopec, and S. Guterman. “Do
Medicare Advantage Plans Minimize Costs?
Investigating the Relationship Between Benchmarks,
Costs, and Rebates.” The Commonwealth Fund,
December 2017.
https://www.commonwealthfund.org/publications/
issue-briefs/2017/dec/do-medicare-advantage-
plans-minimize-costs-investigating

2018 USRDS ANNUAL DATA REPORT | VOLUME 1: CKD IN THE UNITED STATES
158
Notes