chapter 7 fund flow statement
TRANSCRIPT

CHAPTER 7
Fund Flow Statement
Changes in Financial Position :
(a) Fund Flow Statement
(b) Cash Flow Statement
Introduction
FUND FLOW STATEMENT
The purpose of measuring trading performance, operational efficiency, profitability and financial position of a concern revealed by Trading, Profit and Loss Account and Balance Sheet. These financial statements are prepared to find out the Gross Profit or Gross Loss, Net Profit or Net Loss and financial soundness of a firm ~ a whole for a particular period of time. From the management point of view, the usefulness of information provided by these income statements functions effectively and efficiently. In the true sense they do not disclose the nature of all transactions. Management, Creditors and Investors etc. want to determine or evaluate the sources and application of funds employed by the firm for the future course of action. Based on these backgrounds, it is essential to analyse the movement of assets, liabilities, funds from operations and capital between the components of two year financial statements. The analysis of financial statements helps to the management by providing additional information in a meaningful manner.
Meaning of Fund
The term "Fund" refers to Cash, to Cash Equivalents or to Working Capital and all financial resources which are used in business. These total resources of a concern are in the form of men, materials, money, plant and equipments and others.
In a broader meaning the word "Fund" refers to Working Capital. The Working Capital indicates the difference between current assets and current liabilities. The term working capital may be :
(a) Gross Working Capital and
(b) Net Working Capital.
174 A Textbook of Financial Cost and Management Accounting
"Gross Working Capital" represents total of all Current Assets.
"Net Working Capital" refers to excess of Current Assets over Current Liabilities.
In a narrow sense the word "Fund" denotes cash or cash equivalents.
Meaning of Flow of Funds
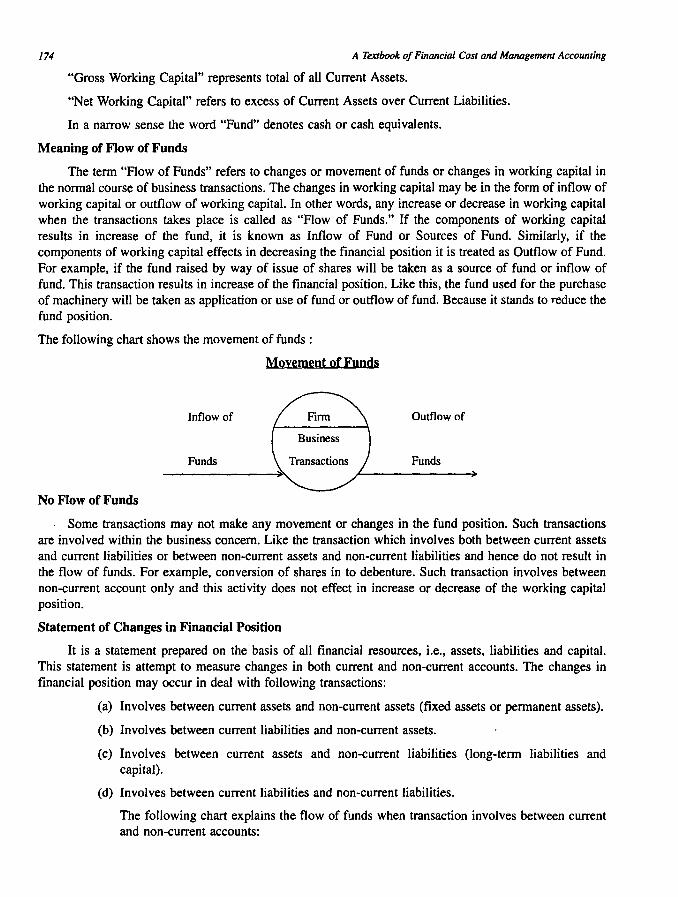
The term "Flow of Funds" refers to changes or movement of funds or changes in working capital in the normal course of business transactions. The changes in working capital may be in the form of inflow of working capital or outflow of working capital. In other words, any increase or decrease in working capital when the transactions takes place is called as "Flow of Funds." If the components of working capital results in increase of the fund, it is known as Inflow of Fund or Sources of Fund. Similarly, if the components of working capital effects in decreasing the financial position it is treated as Outflow of Fund. For example, if the fund raised by way of issue of shares will be taken as a source of fund or inflow of fund. This transaction results in increase of the financial position. Like this, the fund used for the purchase of machinery will be taken as application or use of fund or outflow of fund. Because it stands to reduce the fund position.
The following chart shows the movement of funds :
Movement of Funds
Inflow of Outflow of
Funds Funds
No Flow of Funds
. Some transactions may not make any movement or changes in the fund position. Such transactions are involved within the business concern. Like the transaction which involves both between current assets and current liabilities or between non-current assets and non-current liabilities and hence do not result in the flow of funds. For example, conversion of shares in to debenture. Such transaction involves between non-current account only and this activity does not effect in increase or decrease of the working capital position.
Statement of Changes in Financial Position
It is a statement prepared on the basis of all financial resources, i.e., assets, liabilities and capital. This statement is attempt to measure changes in both current and non-current accounts. The changes in financial position may occur in deal with following transactions:
(a) Involves between current assets and non-current assets (fixed assets or permanent assets).
(b) Involves between current liabilities and non-current assets.
(c) Involves between current assets and non-current liabilities (long-term liabilities and capital).
(d) Involves between current liabilities and non-current liabilities.
The following chart explains the flow of funds when transaction involves between current and non-current accounts:
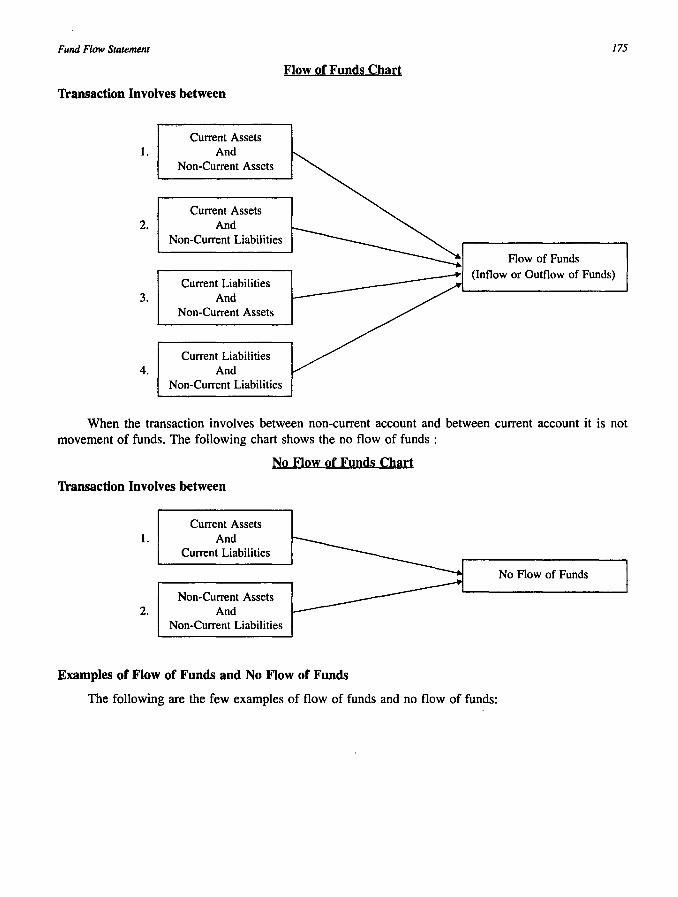
Fund Flow Statement
Transaction Involves between
Current Assets 1. And
Non-Current Assets
Current Assets 2. And
3.
Non-Current Liabilities
Current Liabilities And
Non-Current Assets
Current Liabilities 4. And
Non-Current Liabilities
Flow of Funds Chart
175
Flow of Funds (Inflow or Outflow of Funds)
When the transaction involves between non-current account and between current account it is not movement of funds. The following chart shows the no flow of funds :
No Flow of Funds Chart
Transaction Involves between
Current Assets 1. And
Current Liabilities
No Flow of Funds
Non-Current Assets 2. And
Non-Current Liabilities
Examples of Flow of Funds and No Flow of Funds
The following are the few examples of flow of funds and no flow of funds:
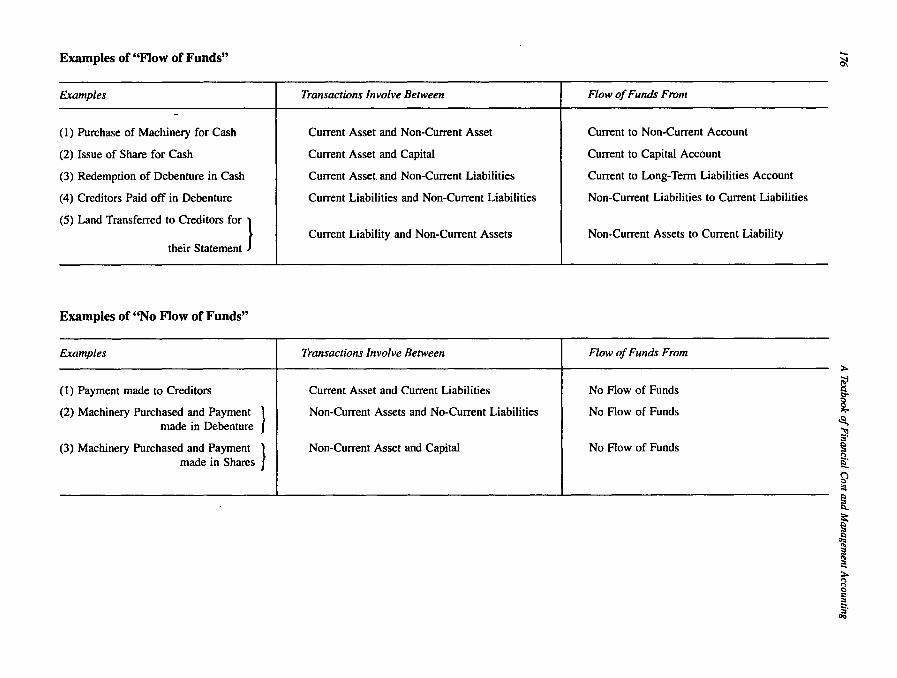
Examples of "Flow of Funds"
Examples
(1) Purchase of Machinery for Cash
(2) Issue of Share for Cash
(3) Redemption of Debenture in Cash
(4) Creditors Paid off in Debenture
(5) Land Transferred to Creditors for }
their Statement
Examples of ''No Flow of Funds"
Examples
(1) Payment made to Creditors
(2) Machinery Purchased and Payment } made in Debenture
(3) Machinery Purchased and Payment } made in Shares
Transactions Involve Between
Current Asset and Non-Current Asset
Current Asset and Capital
Current Asset. and Non-Current Liabilities
Current Liabilities and Non-Current Liabilities
Current Liability and Non-Current Assets
Transactions Involve Between
Current Asset and Current Liabilities
Non-Current Assets and No-Current Liabilities
Non-Current Asset and Capital
Flow of Funds From
Current to Non-Current Account
Current to Capital Account
Current to Long-Term Liabilities Account
Non-Current Liabilities to Current Liabilities
Non-Current Assets to Current Liability
Flow of Funds From
No Flow of Funds
No Flow of Funds
No Flow of Funds
Fund Flow Statement 177
Components of Flow of Funds
In order to analyse the sources and application of funds, it is essential to know the meaning and components of flow of funds given below :
(l) Current Assets
(2) Non-Current Assets (Fixed or Permanent Assets)
(3) Current Liabilities
(4) Non-Current Liabilities (Capital & Long-Term Liabilities)
(5) Provision for Tax
(6) Proposed Dividend
(1) Current Assets: The term "Current Assets" refer to the assets of a business of a transitory nature which are intended for resale or conversion into different form during the course of business operations. For example, raw materials are purchased and the amount unused at the end of the trading period forms part of the current as stock on hand. Materials· in process at the end of the trading period and the labour incurred in processing them also form part of current assets.
(2) Non-Current Assets (Permanent Assets): Non-Current Assets also refer to as Permanent Assets or Fixed Assets. This class of asset include those of tangible and intangiable nature having a specific value and which are not consumed during the course of business and trade but provide the means for producing saleable goods or providing services. Land and Building, Plant and Machinery, Goodwill and Patents etc. are the few examples of Non-Current ~ssets.
(3) Current Liabilities: The term Current Liabilities refer to amount owing by the business which are currently due for payment. They consist of amount owing to creditors, bank loans due for repayment, proposed dividend and proposed tax for payment and expenses accrued due.
(4) Non-Current Liabilities: The term Non-Current Liabilities refer to Capital and Long-Term Debts. It is also called as Permanent Liabilities. Any amount owing by the business which are payable over a longer period time, i.e., after a year are referred as Non-Current Liabilities. Debenture, long-term loans and loans on mortgage etc., are the few examples of non-current liabilities.
(5) Provision for Taxation: Provision for taxation may be treated as a current liability or an appropriation of profit. When it is made during the year it is not used for adjusting the net profit, it is advisable to treat the same as current liability. Any amount of tax paid during the year is to be treated as application of funds or non-current liability. Because it is used for adjusting the net profit made during the year.
(6) Proposed Dividend: Like provision for taxation, it is also treated as a current liability and noncurrent liability, when dividend may be considered as being declared. And thus, it will not be used for adjusting the net profit made during the year. If it is treated as an appropriation, i.e., an non-current liability when the dividend paid during the year.
(7) Provisions Against Current Assets and Current Liabilities: Provision for bad and doubtful debts, provision for loss on inventories, provision for discount on creditors and provision made against investment etc. are made during the year, they may be treated separately as current assets or current liabilities or reduce the same from the respective gross value of the assets or liabilities.

•
178 A Textbook of Financial Cost and Management Accounting
The list of Current Accounts and Non-Current Accounts are given below:
Current Liabilities
(1) Bills Payable -
(2) Sundry Creditors
(3) Outstanding Expenses
(4) Dividends Payable
(5) Bank Overdraft
(6) Short-Term Loans
(7) Provisions against Current Assets
(8) Provision for Taxation
(9) Proposed Dividend
Current Accounts
(May be Current or Non-Current Liabilities)
(1)
(2)
(3)
(4)
(5)
(6)
(7)
(8)
(9)
Non-Current Accounts
Non-Current or Permanent Liabilities
(1) Equity Share Capital (1)
(2) Preference Share Capital (2)
(3) Debentures (3)
(4) Long-Term Loans (4)
(5) Share Premium (5)
(6) Share forfeited (6)
(7) Profit and Loss Account (7)
(8) Capital Reserve (8)
(9) Capital Redemption Reserve (9)
(10)
(11)
Current Assets
Cash in Hand
Cash at Bank
Bills Receivable
Sundry Debtors
Short-Term Investments
Marketable Securities
Stock of Raw Materials, Work in Progress & Finished Goods
Prepaid Expenses
Accrued Incomes
Non-Current or Permanent Assets
Good will
Land
Building
Plant and Machinery
Furniture and Fittings
Trade Marks
Patent Right~
Long-Term Investments
Discount on Issue of Shares and Debentures
Preliminary Expenses
Other Deferred Expenses
Fund Flow Statement
It is a statement summarizing the significant financial changes in items of financial position which have occurred between the two different balance sheet dates. This statement is prepared on the basis of "Working Capital" concept of funds. Fund flow Statement helps to measure the different sources of funds and application of funds from transactions involved during the course of business.
The fund flow statement also termed as Statement of Sources and Application of Fund, Where Got and Where Gone Out Statement, Inflow of Fund or Outflow of Fund Statement.

Fund Flow Statement 179
Importance or Uses of Fund Flow Statement
Fund Flow Statements are prepared for financial analysis in order to meet the needs of people serving the following purposes:
(1) It highlights the different sources and applications or uses of funds between the two accounting period.
(2) It brings into light about financial strength and weakness of a concern.
(3) It acts as a effective tool to measure the causes of changes in working capital.
(4) It helps the management to take corrective actions while deviations between two balance sheet figure.
(5) It is an instrument used by the investors for effective decisions at the time of their investment proposals.
(6) It also presents detailed information about profitability, operational efficiency and financial affairs of a concern.
(7) It serves as a guide to the management to formulate its dividend policy, retention policy and investment policy etc.
(8) It helps to evaluate the financial consequences of business transactions involved in operational finance and investment.
(9) It gives the detailed explanation about movement of funds from different sources or uses of funds during a particular accounting period.
Difference between Fund Flow Statement and Income Statement
Fund Flow Statement Income Statement
(1) It explains the different sources and uses of (1) It reveals the net profit or net loss in a funds during the particular period. particular period of time.
(2) No standard format is required for preparation (2) As per the double entry book keeping, of fund flow statement. prescribed format is used for preparation of
income statement.
(3) Fund Flow Statement considers both capital and (3) It considers only revenue nature of revenue nature of income and expenditure. income and expenditure.
(4) It disclosed the exact flow of funds from operations. (4) It is prepared not for fund flow statement. Thus, it is complementary to income statement.
Difference between Fund Flow Statement and Balance Sheet
Fund Flow Statement
(1) It presents significant financial Changes between two balance sheets.
, (2) It is prepared on the basis of Trading, Profit & Loss account and Balance sheet.
Balance Sheet
(1) It is a statement that incorporates assets and liabilities prepared at the end of accounting period.
(2) It is prepared on the basis of Trial Balance.

180
Fund Flow Statement
(3) It provides additional information to the management to discharge its functions effectively.
(4) Fund from operation, schedule of changes in working capital has to be required for preparation of fund flow statement.
A Textbook of Financial Cost and Management Accounting
Balance Sheet
(3) It explains the financial position of a concern as a whole in a particular period.
(4) It is prepared after the Trading, Profit and Loss Account is completed.
Limitations of Fund Flow Statement
Fund Flow Statement has suffered with the following limitations :
(I) It is prepared on the basis of information related to historical in nature. It ignores to project future operations.
(2) This statement does not focus on transactions involved in non-fund items.
(3) It also ignores when transactions involved between current accounts or non-current accounts.
(4) It does not provide any additional information to the management because financial statements are simply rearranged and presented.
Preparation of Fund Flow Statement
Fund flow analysis involves the following important three statements such as :
I. Fund From Operations
II. Statement of Changes in Working Capital
III. Fund Flow Statement.
I. FUND FROM OPERATIONS
Fund From Operation is to be determined on the basis of Profit and Loss Account. The operating profit revealed by Profit and Loss Account represents the excess of sales revenue over cost of goods sold. In the true sense, it does not reflect the exact flow of funds caused by business operations. Because the revenue earned and expenses incurred are not in conformity with the flow of funds. For example, depreciation charges on fixed assets, write up of fixed assets or fictious assets, any appropriations etc. do
• not cause actual flow of funds. Because they have already been charged to such profits. Hence, fund from operation is prepared to find out exact inflow or outflow of funds from the regular operations on the basis of items which have readjusted to the current profit or loss. The balancing amount of adjusted profit and loss account is described as fund from operations.
Fund Flow Statement 181
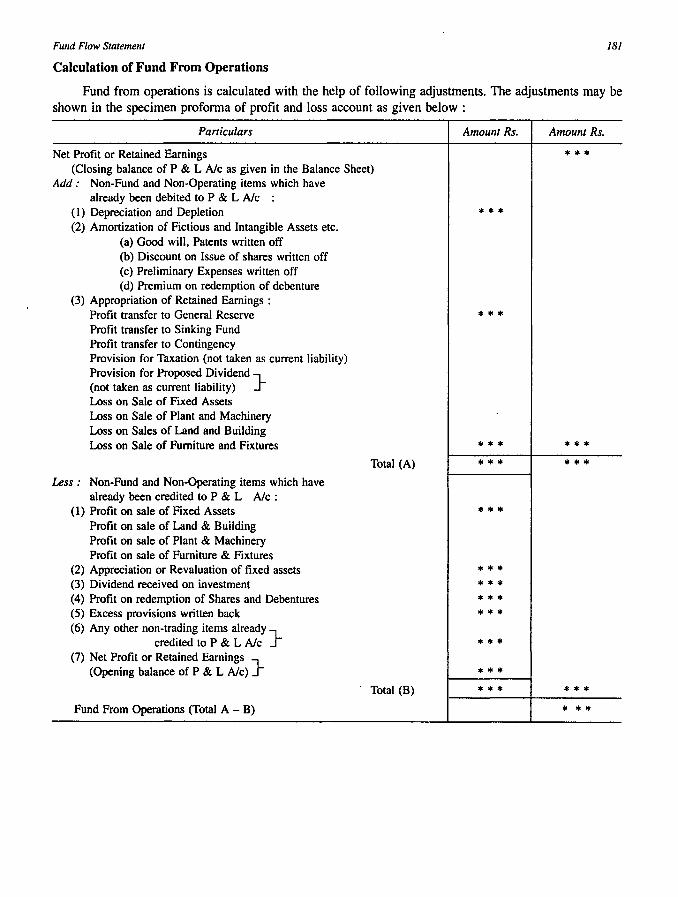
Calculation of Fund From Operations
Fund from operations is calculated with the help of following adjustments. The adjustments may be shown in the specimen proforma of profit and loss account as given below :
Particulars Amount Rs. Amount Rs.
Net Profit or Retained Earnings * •• (Closing balance of P & L Alc as given in the Balance Sheet)
Add: Non-Fund and Non-Operating items which have already been debited to P & L Alc :
( I) Depreciation and Depletion • •• (2) Amortization of Fictious and Intangible Assets etc.
(a) Good will, Patents written off (b) Discount on Issue of shares wrillen off (c) Preliminary Expenses written off (d) Premium on redemption of debenture
(3) Appropriation of Retained Earnings : Profit transfer to General Reserve ••• Profit transfer to Sinking Fund Profit transfer to Contingency Provision for Taxation (not taken as current liability) Provision for Proposed Dividend} (not taken as current liability) Loss on Sale of Fixed Assets Loss on Sale of Plant and Machinery Loss on Sales of Land and Building Loss on Sale of Furniture and Fixtures ••• •••
Total (A) • •• • •• Less: Non-Fund and Non-Operating items which have
already been credited to P & L Alc: (1) Profit on sale of Fixed Assets •••
Profit on sale of Land & Building Profit on sale of Plant & Machinery Profit on sale of Furniture & Fixtures
(2) Appreciation or Revaluation of fixed assets • •• (3) Dividend received on investment ••• (4) Profit on redemption of Shares and Debentures ••• (5) Excess provisions written back ••• (6) Any other non-trading items alreadY}
credited to P & L Alc ••• (7) Net Profit or Retained Earnings }
(Opening balance of P & LAIc) * * • Total (B) ••• * ••
Fund From Operations (Total A - B) •• *

182 A Textbook of Financial Cost and Management Accounting
Alternative Specimen Format
The following is the specimen of adjusted profit and loss account to calci.date fund from operations :
Adjusted Profit and Loss Account
Particulars Amount Rs. Particulars
To Depreciation on Fixed ASSets By Opening Balance of P & L Alc To Loss on Sale of Fixed Assets By Profit on Sale of Fixed Assets To Loss on Sale Investments By Excess provision written back To Goodwill written off By Dividend received on investment To Discount on shares written off By Revaluation of fixed assets To Transfer to reserve By Fund From Operations To Preliminary expenses written off (Balancing Figure) To Provision for Tax To Proposed Dividend To Closing Balance of P & L Alc
* * *
Illustration: 1
From the following Profit and Loss Account, Calculation fund from operation :
Profit and Loss Account
Rs.
To Rent 6,000 By Gross Profit bId To Salaries 14,000 By Transfers to General Reserve To Advertisement 3,000 By Preliminary Expenses To Office Expenses 2,000 By Profit on Sale of Investment To Depreciation on Plant 5,000 To Good will written off 3,000 To Loss on Sales of Plant 2,000 To Provision for Tax 4,000 To Interim Dividend 3,000 To Net Profit 18,000
60,000
Solution:
Calculation of Fund From Operations
Particulars
Net Profit or Retained Earnings (Closing Balance of P & L Ale)
Add: Non-Fund or Non-Trading items already debited to P & L Alc : Depreciation on Plant Goodwill written off Loss on Sale of Plant Provision for Tax Interim Dividend
Amount Rs.
5,000 3,000 2,000 4,000 3,000
Amount Rs.
* * *
Rs.
50,000 7,000 1,000 2,000
60,000
Amount Rs.
18,000
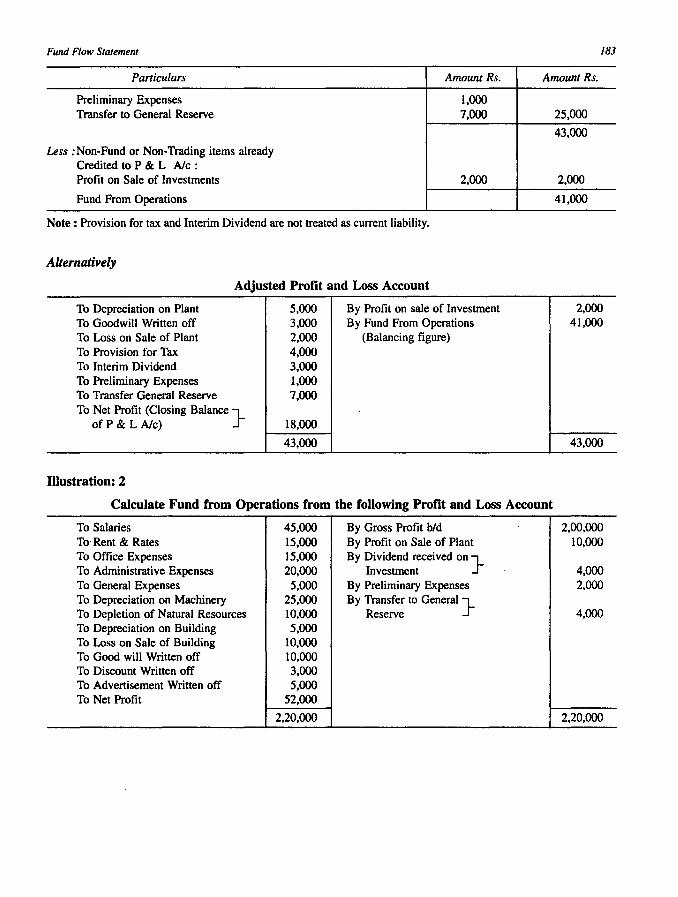
Fund Flow Statement /83
Particulars Amount Rs. Amount Rs.
Preliminary Expenses 1,000 Transfer to General Reserve 7,000 25,000
43,000
Less :Non-Fund or Non-Trading items already Credited to P & L Nc: Profit on Sale of Investments 2,000 2,000
Fund From Operations 41,000
Note: Provision for tax and Interim Dividend are not treated as current liability.
Alternatively
Adjusted Profit and Loss Account
To Depreciation on Plant 5,000 By Profit on sale of Investment 2,000 To Goodwill Written off 3,000 By Fund From Operations 41,000 To Loss on Sale of Plant 2,000 (Balancing figure) To Provision for Tax 4,000 To Interim Dividend 3,000 To Preliminary Expenses 1,000 To Transfer General Reserve 7,000 To Net Profit (Closing Balance}
ofP & L Nc) 18,000
43,000 43,000
Illustration: 2
Calculate Fund from Operations from the following Profit and Loss Account
To Salaries 45,000 By Gross Profit bId 2,00,000 To' Rent & Rates 15,000 By Profit on Sale of Plant 10,000 To Office Expenses 15,000 By Dividend received on} To Administrative Expenses 20,000 Investment 4,000 To General Expenses 5,000 By Preliminary Expenses 2,000 To Depreciation on Machinery 25,000 By Transfer to General } To Depletion of Natural Resources 10,000 Reserve 4,000 To Depreciation on Building 5,000 To Loss on Sale of Building 10,000 To Good will Written off 10,000 To Discount Written off 3,000 To Advertisement Written off 5,000 To Net Profit 52,000
2,20,000 2,20,000

184
Solution:
A Textbook of Financial Cost and /rIanagement Accounting
Calculation of Fund from Operations
Particulars
Net Profit or Retained Earnings } (Closing Balance of Profit & Loss Alc)
Add: Non-fund or Non-Trading items already debited to P & L Ale : Depreciation on Plant & Machinery Depreciation on Building Depletion of Natural Resources Loss on Sale of Building Good will Written off Discount Written off Advertisement Written off Preliminary Expenses
Less: Non-Fund or Non-Operating items already credited to P & L Alc : Profit on Sale of Plant Dividend received on Investment Transfer to General Reserve
Fund From Operations
Alternatively
Solution:
Amount Rs
25,000 5,000
10,000 10,000 10,000 3,000 5,000 2,000
10,000 4,000 4,000
Adjusted Profit & Loss Account
Particulars Amount Rs. Particulars
To Depreciation on } Plant and Machinery 25,000
By Profit on Sale} of Plant
To Depreciation on Building 5,000 By Dividend received} To Depletion of Natural Resources 10,000 on Investment To Loss on Sale of Building 10,000 By Transfer to General} To Good will Written off 10,000 Reserve To Discount Written off 3,000 By Fund from operations} To Advertisement Written off 5,000 (Balancing figure) To Preliminary Expenses 2,000 To Net Profit } 52,000
(Closing Balance)
1,22,000
II. STATEMENT OF CHANGES IN WORKING CAPITAL
Amount Rs.
52,000
70,000
1,22,000
18,000
1,04,000
Amount Rs.
10,000
4,000
4,000 1,04,000
1,22,000
It is also termed as Statement of Changes in Working Capital. Before preparation of fund flow statement, it is essential to prepare first the schedule of changes in working capital and fund from operations. Statement of changes in working capital is prepared on the basis of items in current assets and current liabilities of between two balance sheets. This statement helps to measure the movement or changes of working capital during a particular period. The term working capital refers to excess of current assets over

Fund Flow Statement /85
current liabilities. The working capital may be "Increase in working capital" or "Decrease in working capital." An increase in the amount of an item of current assets in the current year as compared to the previous year represents to an increase in working capital. Similarly, a decrease in the amount of an item of current assets in the current year as compared to the previous year would represent decrease in working capital. In the same way over all changes in working capital is calculated and presented in the schedule of changes in working capital. The final result of Net Decrease in Working Capital refers to Source of Funds or Inflow of Funds. Like this, Net Increase in Working Capital represent Application of Fund or Uses of Funds.
Principle or Rules for Preparation of Working Capital Statement
The following rules may be kept in mind while preparing working capital statement:
(1) Increase in Current Asset
(2) Decrease in Current Asset
(3) Increase in Current Liability
Increases Wor~ing Capital
Decreases Working Capital
Decreases Working Capital
(4) Decrease in Current Liability ---+ Increases Working Capital
Specimen Form of Schedule of Changes in Working Capital :
The following is a specimen form may be used for preparation of schedule of changes in working capital.
Schedule of Changes in Working Capital (or)
Statement of Changes in Working Capital
Particulars Previous Year Current Year
Rs. Rs.
Current Assets : Cash in Hand Cash at Bank Sundry Debtors Bills Receivable Short-Term Investments Stock Prepaid Expenses Outstanding Incomes
Total Current Assets (A) ... ... ... ... ......
Current Liabilities : Sundry Creditors Bills Payable Bank Overdraft Outstanding Expenses Short-Term Loans
Total Current Liabifities (B) ...... ... ..... Working Capital ....... ... .. (A -B) Net Increase I Decrease } In Working Capital ......... -Total ..... •••
Effect on Working Capital
Increase Decrease
- ... .... • •• . ....

186
Illustration: 3
A Textbook of Financial Cost and Management Accounting
From the following Balance Sheet of Gupta Ltd., prepare Schedule of Changes in Working Capital:
Balance Sheet
Liabilities 2002 2003 Assets 2002 2003 Rs. Rs. Rs. Rs.
Creditors 55,000 83,000 Cash in Hand 15,000 10,000 Bills Payable 20,000 16,000 Cash at Bank 10,000 8,000 Share Capital 1,00,000 1,50,000 Debtors 1,60,000 2,00.000 General Reserve 7,000 8,000 Stock 77,000 1,09,000 Debenture 1,00,000 1,00,000 Bills Receivable 20,000 30,000
2,82,000 3,57,000 2,82,000 3,57,000
Solution:
Schedule of Changes in Working Capital
Particulars 2002 2003 Changes in Working Capital
Rs. Rs. Increase Decrease
Current Assets : Cash in Hand 15,000 10,000 - 5,000 Cash at Bank 10,000 8,000 - 2,000 Debtors 1,60,000 2,00,000 40,000 -Stock 77,000 1,09,000 32,000 -Bills Receivable 20,000 30,000 10,000 -Total (A) 2,82,000 3,57,000
Current Liabilities : Creditors 55,000 83,000 - 28,000 Bills Payable 20,000 16,000 4,000 -Total (B) 75,000 99,000
Working Capital (A - B) 2,07,000 2,58,000 Net Increase in Working Capital 51,000 - - 51,000
2,58,000 2,58,000 86,000 86,000
Illustration: 4
You are required to prepare a Schedule of changes in working capital from the following Balance sheet of Nancy Ltd., at the end of 2002 and 2003.
Balance Sheet
Liabilities 2002 2003 Assets 2002 2003 Rs. Rs. Rs. Rs.
Share Capital 50,000 75,000 Cash at Bank 15,000 25,000 General Reserve 25,000 30,000 Plant 50,000 70,000 Bill Payable 10,000 15,000 Building 50.000 60,000 Debenture 30,000 50,000 Stock 30,000 35,000 Trade Creditors 40,000 50,000 Bills Receivable 25,000 40,000 Short-Term Loans 30,000 40,000 Trade Debtors 15,000 30,000
1,85,000 2,60,000 1,85,000 2,60,000
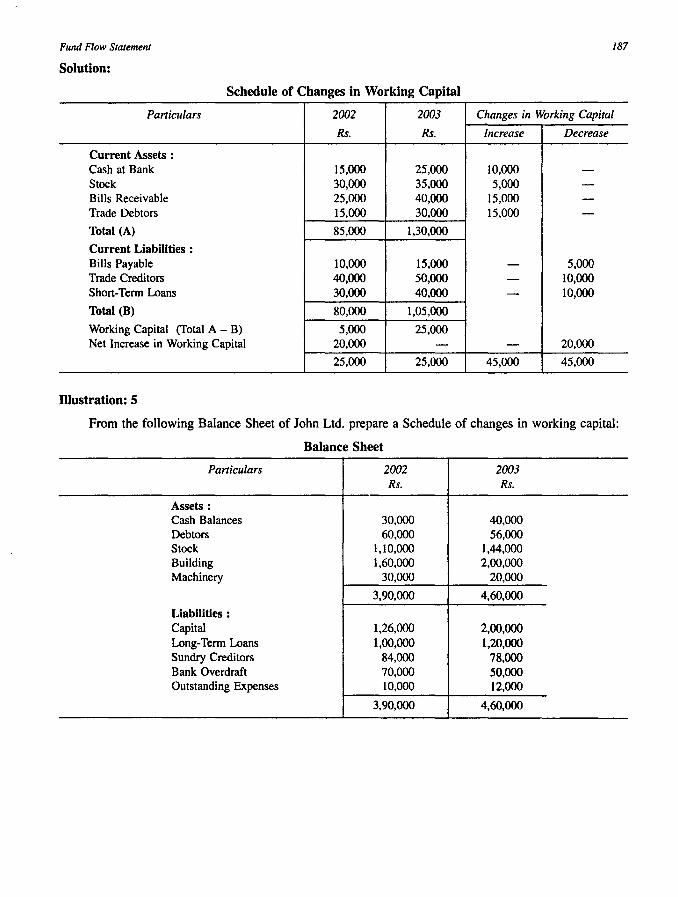
Fund Flow Statement 187
Solution:
Schedule of Changes in Working Capital
Paniculars 2002 2003 Changes in Working Capital
Rs. Rs. Increase Decrease
Current Assets : Cash at Bank 15,000 25,000 10,000 -Stock 30,000 35,000 5,000 -Bills Receivable 25,000 40,000 15,000 -Trade Debtors 15,000 30,000 15,000 -Total (A) 85,000 1,30,000
Current Liabilities : Bills Payable 10,000 15,000 - 5,000 Trade Creditors 40,000 50,000 - 10,000 Short-Term Loans 30,000 40,000 - 10,000
Total (B) 80,000 1,05,000
Working Capital (Total A - B) 5,000 25,000 Net Increase in Working Capital 20,000 - - 20,000
25,000 25,000 45,000 45,000
Illustration: 5
From the following Balance Sheet of John Ltd. prepare a Schedule of changes in working capital:
Balance Sheet
Paniculars 2002 2003 Rs. Rs.
Assets : Cash Balances 30,000 40,000 Debtors 60,000 56,000 Stock 1,10,000 1,44,000 Building 1,60,000 2,00,000 Machinery 30,000 20,000
3,90,000 4,60,000
Liabilities : Capital 1,26,000 2,00,000 Long-Term Loans 1,00,000 1,20,000 Sundry Creditors 84,000 78,000 Bank Overdraft 70,000 50,000 Outstanding Expenses 10,000 12,000
3,90,000 4,60,000
188
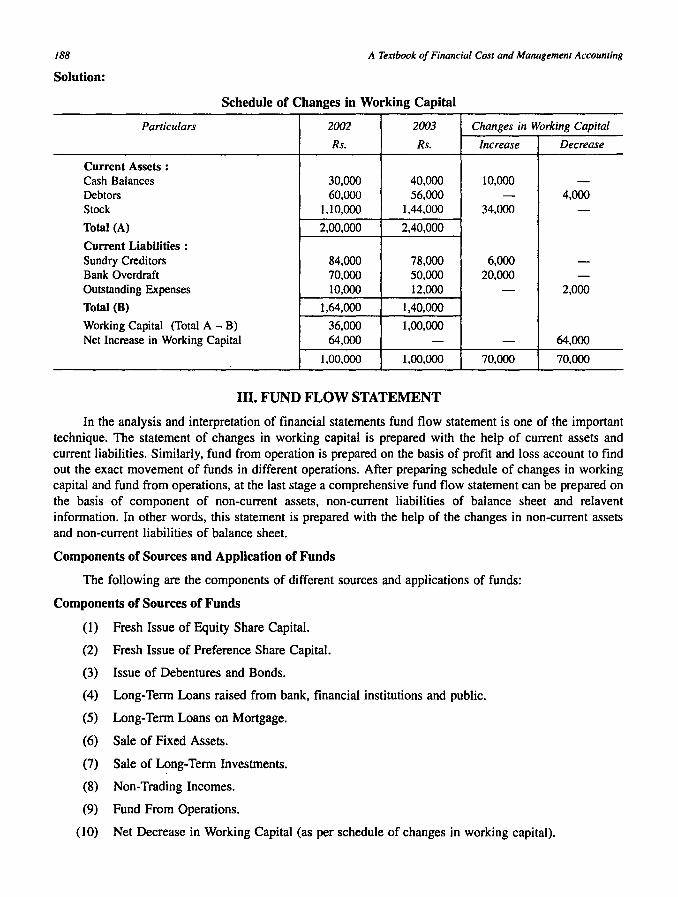
Solution:
A Textbook of Financial Cost and Management Accounting
Schedule of Changes in Working Capital
Particulars 2002 2003 Changes in Working Capital
Rs. Rs. Increase Decrease
Current Assets : Cash Balances 30,000 40,000 10,000 -Debtors 60,000 56,000 - 4,000 Stock 1,10,000 1,44,000 34,000 -Total (A) 2,00,000 2,40,000
Current Liabilities: Sundry Creditors 84,000 78,000 6,000 -Bank Overdraft 70,000 50,000 20,000 -Outstanding Expenses 10,000 12,000 - 2,000
Total (B) 1,64,000 1,40,000
Working Capital (Total A - B) 36,000 1,00,000 Net Increase in Working Capital 64,000 - - 64,000
1,00,000 1,00,000 70,000 70,000
III. FUND FLOW STATEMENT
In the analysis and interpretation of financial statements fund flow statement is one of the important technique. The statement of changes in working capital is prepared with the help of current assets and current liabilities. Similarly, fund from operation is prepared on the basis of profit and loss account to find out the exact movement of funds in different operations. After preparing schedule of changes in working capital and fund from operations, at the last stage a comprehensive fund flow statement can be prepared on the basis of component of non-current assets, non-current liabilities of balance sheet and relavent information. In other words, this statement is prepared with the help of the changes in non-current assets and non-current liabilities of balance sheet.
Components of Sources and Application of Funds
The following are the components of different sources and applications of funds:
Components of Sources of Funds
(1) Fresh Issue of Equity Share Capital.
(2) Fresh Issue of Preference Share Capital.
(3) Issue of Debentures and Bonds.
(4) Long-Term Loans raised from bank, financial institutions and public.
(5) Long-Term Loans on Mortgage.
(6) Sale of Fixed Assets.
(7) Sale of Long-Term Investments.
(8) Non-Trading Incomes.
(9) Fund From Operations.
(10) Net Decrease in Working Capital (as per schedule of changes in working capital).
Fund Flow Statement /89
Components of Applications of Funds
Generated funds from various sources may be utilized in the following ways for meeting the future productive programmes of the business:
( 1 ) Redemption of shares and debentures.
(2) Repayment of loans raised from bank, financial institutions and public.
(3) Purchase of Fixed Assets.
(4) Purchase of Long-Term Investments.
(5) Non-Trading Expenditure. Payment of Tax; Payment of Dividend.
(6) Fund Lost in Operations.
(7) Net Increase in Working Capital (as per schedule of changing in working capital).
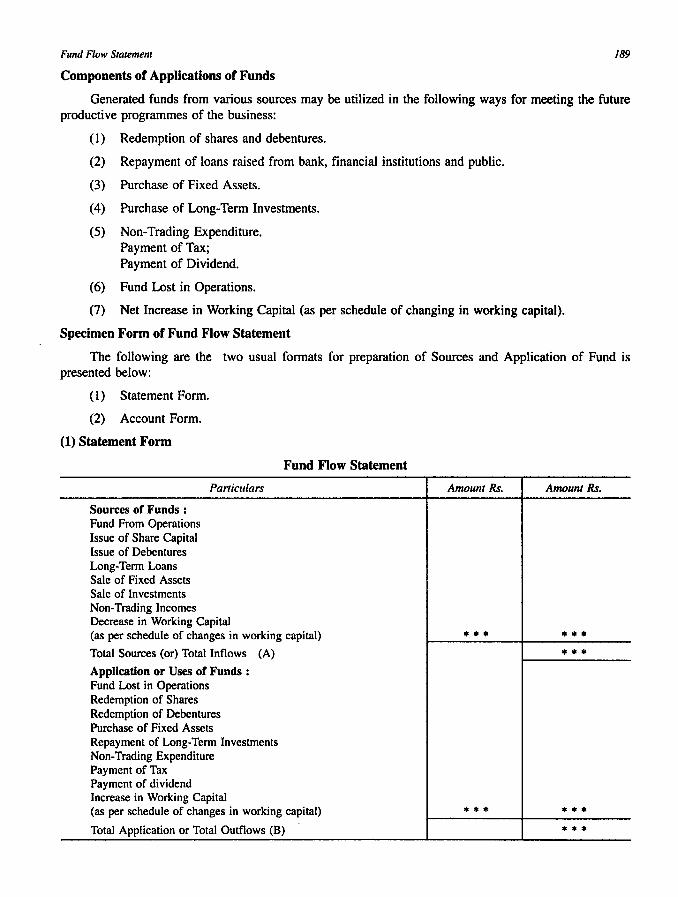
Specimen Form of Fund Flow Statement
The following are the two usual formats for preparation of Sources and Application of Fund is presented below:
(1) Statement Form.
(2) Account Form.
(1) Statement Form
Sources of Funds : Fund From Operations Issue of Share Capital Issue of Debentures Long-Term Loans Sale of Fixed Assets Sale of Investments Non-Trading Incomes
Panicuiars
Decrease in Working Capital
Fund Flow Statement
(as per schedule of changes in working capital)
Total Sources (or) Total Inflows (A)
Application or Uses of Funds: Fund Lost in Operations Redemption of Shares Redemption of Debentures Purchase of Fixed Assets Repayment of Long-Term Investments Non-Trading Expenditure Payment of Tax Payment of dividend Increase in Working Capital (as per schedule of changes in working capital)
Total Application or Total Outflows (B)
Amount Rs. Amount Rs.
•• • ••• •••
••• • •• • • •

190 A Textbook oj Financial Cost and Management Accounting
(2) Account Form
Fund Flow Statement
Sources of Funds Amount Rs. Application of Funds Amount Rs.
Fund From Operations Fund Lost in Operations Issue of Share Capital Redemption of Shares Issue of Debentures Redemption of Debenture Long-Term Loans Purchase of Fixed Assets Sale of Fixed Assets Repayment of Long-Term Loans Sale of Investments Non-Trading Expenditure Non-Trading Incomes Payment of Tax Decrease in Working Capital Payment of Dividend (As per schedule of changes Increase in Working Capital
in working capital) (as per schedule of changes in working capital)
Total Inflow * * * Total Outflow ***
Illustration: 6
From the following Balance sheet of William & Co. Ltd., you are required to prepare a Schedule of Changes in Working Capital and Statement of Sources and Application of Funds.
Balance sheet
Liabilities 2002 2003 Assets 2002 2003 Rs. Rs. Rs. Rs.
Capital 80,000 85,000 Cash in Hand 4,000 9,000 P&LNc 14,500 24,500 Sundry Debtors 16,500 19,500 Sundry Creditors 9,000 5,000 Stock 9,000 7,000 Long-Term Loans - 5,000 Machinery 24,000 34,000
Building 50,000 50,000
1,03,500 1,19,500 1,03,500 1,19,500
Solution:
Schedule of Changes in Working Capital
Particulars 2002 2003 Changes in Working Capital
Rs. Rs. Increase Decrease
Current Assets : Cash at Bank 4,000 9,000 5,000 -Sundry Debtors 16,500 19,500 3,000 -Stock 9,000 7,000 - 2,000 Total (A) 29,500 35,500
Current Liabilities : Sundry Creditors 9,000 5,000 4,000 -
Total (B) 9,000 5,000
Working Capital (Total A - B) 20,500 30,500 Net Increase in Working Capital 10,000 - - 10,000
30,500 30,500 12,000 12,000

Fund Flow Statement 191
Fund Flow Statement
Sources of Fund Rs. Application of Fund Rs.
Issue of Capital 5,000 Purchase of Machinery 10,000 (80000 - 85000) (24,000 - 34,(00) Long-Term Loans 5,000 Net Increase in Fund From Operations 10,000 Working Capital 10,000 (14,500 - 24,500)
20,000 20,000
Illustration: 7
From the following Balance sheet of RR & Co. Ltd., you are required to prepare (a) Schedule of Changes in Working Capital (b) Fund Flow Statement and (c) Fund From Operations.
Balance Sheet
liabilities 2002 2003 Assets Rs. Rs.
Equity Capital 1,00,000 1,00,000 Good Will General Reserve 14,000 18,000 Patents Profit & Loss Nc 16,000 l3,OOO Building Bank Overdraft 3,000 2,000 Machinery Sundry Creditors 5,000 3,400 Investments Bills Payable 1,200 800 Stock Provision for Taxation 10,000 11,000 Bills Receivable Proposed Dividend 6,000 7,000 Debtors Provision for DoubtfUl} Cash at Bank
Debts 400 600
1,55,600 1,55,800
Additional Information
(1) Depreciation Charged on Machinery Rs. 4,000 and on Building Rs. 4,000.
(2) Provision for Taxation of Rs. 19,000 was made during the year 2003.
(3) Interim Dividend of Rs. 8,000 was Paid during the year 2003.
Solution:
Calculation of Fund from Operations
Particulars
Profit and Loss Nc (Closing Balance of 2(03) Add: Non-Fund or Non-Trading items already
Debited to P&L Nc : Depreciation on Machinery Depreciation on Building Interim Dividend Paid Transfer to General Reserve
2002 Rs.
6,000 6,000
50.000 27,000 10,000 20,000 12,000 18,000 6,600
1,55,600
Amount Rs.
4,000 4,000 8,000 4,000
2003 Rs.
6,000 6,000
46.000 26,000 11,000 l3,400 l3,200 19,000 15,200
1,55,800
Amount Rs.
l3,000

/92 A Textbook of Financial Cost and Management Accounting
Paniculars Amount Amount
Provision for Tax (See Note 1) 19,000 Proposed Dividend 1,000 40,000
53,000
Less :Non-Fund or Non-Trading items already Credited to P&L Alc :
Profit and Loss Alc (Opening balance as per 2002) 16,000
Fund From Operations 37,000
Schedule of Changes in Working Capital
Paniculars 2002 2003 Changes in Working Capital
Rs. Rs. Increase Decrease
Current Assets : Cash at Bank 6,600 15,200 8,600 -Debtors 18,000 19,000 1,000 -Stock 20,000 13,400 - 6,600 Bills Receivable 12,000 13,200 1,200 -Total (A) 56,600 60,800
Current Liabilities : Bank Overdraft 3,000 2,000 1,000 -Sundry Creditors 5,000 3,400 1,600 -Provision for Doubtful Debits 400 600 - 200 Bills Payable 1,200 800 400 -Total (B) 9,600 6,800
Working Capital (Total A - B) 47,000 54,000 Net Increase in Working Capital 7,000 - - 7,000
54.000 54.000 13.800 13.800
Fund Flow Statement
Sources of Fund Rs. Application of Funds Rs.
Fund From Operations 37,000 Purchase of Machinery 3.000 Tax Paid (see Note 3) 18.000 Investment purChaSed} 1,000 (10.000 - 11,000) Interim Dividend Paid 8.000 Net Increase in working} Capital 7.000
37,000 37,000
Machinery Account •
To Balance bid 27,000 By Depreciation 4.000 To Bank 3,000 By Balance cld 26,000 (Purchase of Machinery balancing figure)
30.000 30,000

Fund Flow StaJement 193
Building Account
To Balance bid 50,000 By Depreciation 4,000 By Balance cJd 46,000
50,000 50,000
Provision for Taxation
To Bank 18,000 By Balance bid 10,000 (Balancing figure) By Provision for Taxation 19,000
To Balance c/d 11,000
29,000 29,000
Illustration: 8
From the following are the comparative Balance Sheet of Gupta & Co., you are required to prepare (a) Schedule of Changes in Working Capital (b) Fund Flow Statement and (c) Fund From Operations.
Balance Sheet
Liabilities 2002 2003 Assets 2002 Rs. Rs. Rs.
Share Capital 90,000 1,00,000 Goodwill 12,000 General Reserve 14,000 18,000 Buildings 40,000 Profit & Loss Alc 19,500 12,000 Machinery 37,000 Provision for Taxation 16,000 17,000 Stock 30,000 Sundry Creditors 8,000 5,400 Sundry Debtors 20,000 Bills Payable 6,200 1,300 Cash at Bank 6,600 Provision for Doubtful} Investments 10,000 Debts 1,900 2,100
1,55,600 1,55,800 1,55,600
Additional Information
(1) Depreciation charged on Machinery was Rs. 4000 and on building Rs. 4000.
(2) Interim Dividend paid during 2003 was Rs. 7500.
(3) Provision of Rs. 5000 was made for taxation during the 2003.
Solution:
Calculation of Fund From Operations
Particulars
Net Profit (Closing Balance) Add: Non-fund or Non-operating items
Which already Debited to P & L Alc : Good Will Written off Depreciation on Machinery Depreciation on Building Interim Dividend Paid
Rs.
2,000 4,000 4,000 7,500
2003 Rs.
10,000 36,000 36,000 25,400 22,200 15,200 11,000
1,55,800
Rs.
12,000

/94 < A Textbook of Financial Cost and Management Accounting
Particulars Rs. Rs.
Transfer to General Reserve 4,000 21,500
>3,500
Less: Non-Fund or Non Operating items already Credited to P & L Nc : Net Profit (Opening Balance) 19,500
Fund From Operations 14,000
Schedule of Changes in Working Capital
Particulars 2002 2003 Changes in Working Capital
Rs. Rs. Increase Decrease
Current Assets : Stock 30,000 25,400 - 4,600 Sundry Debtors (Less: Provision For Doubtful Debts) 18,100 20,100 2,000 Cash Balances 6,600 15,200 8,600 -Total (A) 54,700 60,700
Current Liabilities : Sundry Creditors 8,000 5,400 2,600 -Bills Payable 6,200 1,300 4,900 -Prevention for Tax 16,000 17,000 - 1,000
Total (B) 30,200 23,700
Working Capital (Total A - B) 24,500 37,000 Net Increase in Working Capital 12,500 - - 12,500
37,000 37,000 18,100 18,100
Fund Flow Statement
Sources of Funds Rs. Application of Funds Rs.
Issue of Share Capital } Purchase of Machinery 3,000 (90,000 - 1,00,000) 10,000 Purchase of Investments 1,000 Funds From Operations 14,000 Interim Dividend Paid 7,500
Net Increase in working}
, Capital 12,500
24,000 24,000
Machinery Account
To Balance bid 37,000 By Depreciation 4,000 To Bank 3,000 By Balance cld 36,000 (Purchase of Machinery Balancing figure) 40,000 40,000

Fund Flow Statement 195
Building Account
To Balance bid 40,000 By Depreciation 4,000 By Balance cld 36,000
40,000 40,000
Illustration: 9
From the following Balance sheet of X Y Z Ltd., on 31 sl Dec. 2002 and 2003, you are required to prepare (a) Fund From Operations (b) Schedule of Changes in Working Capital and (c) Fund Flow Statement.
Balance Sheet
Liabilities 2002 2003 Assets 2002 2003 Rs. Rs. Rs. Rs.
Bills Payable 20,000 22,000 Cash Balances 10,000 7,000 Creditors 20,000 22,000 Debtors 20,000 20,000 Ramesh's Loan 25,000 - Bills Payable 10,000 30,000 Loan from Kannan 40,000 50,000 Stock 35,000 25,000 Equity Share Capital 1,00,000 1,00,000 Machinery 80,000 55,000 Preference Share Capital 25,000 53,000 Land 40,000 50,000
Building 35,000 60,000
2,30,000 2,47,000 2,30,000 2,47,000
Additional Information
(1) During the year machine costing Rs. 10,000 (accumulated depreciation Rs. 3,000) was sold for Rs. 5,000.
(2) The provision for depreciation against machinery on I" Jan. 2003 was Rs. 25,000 and on 31" December was Rs. 40,000.
(3) Net profit for the year 2003 amounted to Rs. 45,000.
Solution:
Calculation of Fund From Operations
Particulars Rs. Rs.
Net Profit (Closing Balance P & L Nc) 45,000 Add: Non-Fund or Non-Operating items
already debited to P & L Nc Loss on Sale of Machinery (see note 1) 2,000 Depreciation on Machinery 18,000 20,000
65,000
Less: Non-Fund or Non-Operating items already credited to P & L Nc -Fund From Operations 65,000

/96 A Textbook of Financial Cost and Management Accounting
Schedule of Changes in Working Capital
Particulars 2002 2003 Changes in Working Capital
Rs. Rs. Increase Decrease
Current Assets : Cash Balances 10,000 7,000 - 3,000 Bills Payable 10,000 30,000 20,000 -Stock 35,000 25,000 - 10,000
Total (A) 55,000 62,000
Current Liabilities : Bills Payable 20,000 22,000 - 2,000 Creditors 20,000 22,000 - 2,000
Total (B) 40,000 44,000
Working Capital (Total A - B) 15,000 18,000 Net Increase in Working Capital 3,000 - 3,000
18,000 18,000 20,000 20,000
Fund Flow Statement
Sources of Funds Rs. Application of Funds Rs.
Fund from Operations 65,000 Ramesh Loan Repaid 25,000 Loan From Kannan 10,000 Drawings 17,000 Sale of Machinery 5,000 Purchase of Land 10,000 (See Note) Purchase of Building 25,000
Net Increase in wOrking} Capital 3,000
80,000 80,000
Machinery Account
To Balance bid 1,05,000 By Provision for depreciation} on machinery sold 3,000
By Bank 5,000 By Loss on sale of machinery 2,000 By Balance cld 95,000
1,05,000 1,05,000
Provision for Depreciation on Machinery
To Machinery Ale 3,000 By Balance bid 25,000 To Balance cld 40,000 By P & L (depreciation }
Provided during the year - balancing figure) 18,000
43,000 43,000

Fund Flow Statement
Capital Account :
Opening balance of Equity Share Capital Opening balance of preference Share Capital Net Profit during the year 2003
Less: Closing balance of Equity and Preference Share Capital } (Rs. 1,00,000 to Rs. 53,(00)
Drawing
Illustration: 10
Rs.
1,00,000 25,000 45,000
1,70,000 1,53,000
17,000
197
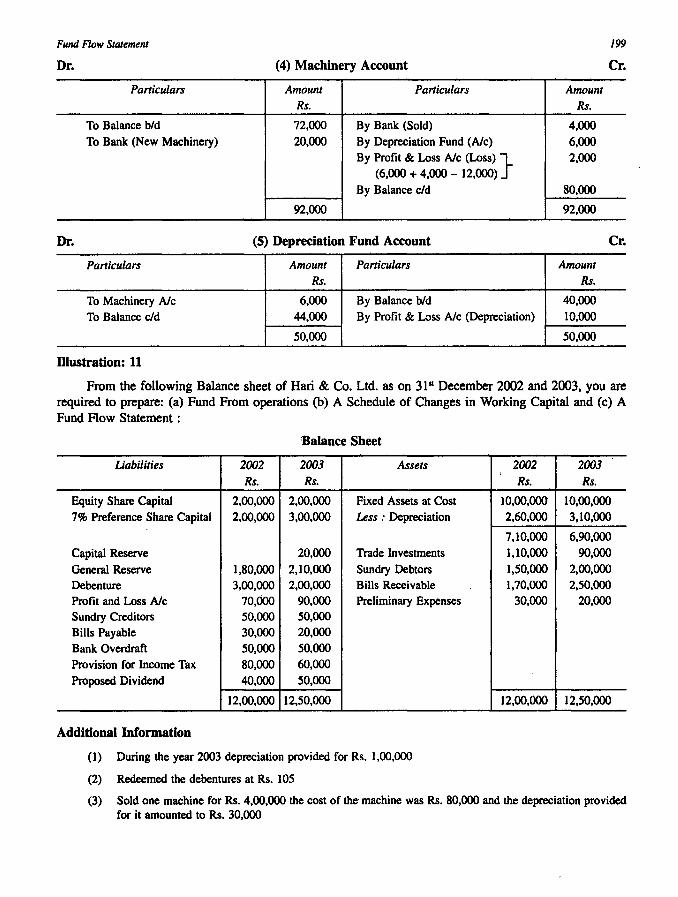
From the following Balance sheet of Mohan & Co. Ltd. as on 31st December 2002 and 2003, you are required to prepare: (a) Fund From Operations (b) A Schedule of Changes in Working Capital and (c) A Fund Flow Statement:
Balance Sheet
Liabilities 2002 2003 Assets 2002 2003 Rs. Rs. Rs. Rs.
Sundry Creditors 50,000 48,000 Cash in hand 25,000 22,000
Bills Payable 40,000 39,000 Cash at Bank 25,000 18,000 Bank Overdraft 13,000 90,000 Sundry Debtors 30,000 28,000
Outstanding Expenses 13,000 22,000 Bills Receivable 47,000 45,000 15% Debentures 90,000 70,000 Short-Term Investments 1,10,000 84,000
Depreciation Fund 40,000 44,000 Prepaid Expenses 1,000 2,000
General Reserve 60,000 50,000 Inventories 92,000 1,06,000
Profit and Loss Nc 16,000 23,000 Land & Buildings 50,000 50,000 Equity Share Capital 1,00,000 1,00,000 Furniture 50,000 50,000 Preference Share Capital 80,000 80,000 Plant & Machinery 72,000 8,000
5,02,000 4,85,000 5,02,000 4,85,000
Additional Information
(1) Dividend was paid in cash was Rs. 18,000
(2) New machinery for Rs. 20,000 was purchased but old machinery costing Rs. 12,000 was sold for Rs. 4,000, accumulated depreciation was Rs. 6,000
(3) Rs. 20,000, 15% debentures were redeemed by purchase from open market @ Rs. 96
(4) Rs. 10,000 was debited to General reserve for settlement of previous tax liability
(5) Rs. 26,000 investments were sold at book value.

198
Solution:
A Textbook of Financial Cost and Management Accounting
(1) Statement of Changes in Working Capital
Particulars 2002 2003 Change in Working Capital
Rs. Rs. Increase Decrease
Current Assets : Cash in hand 25,000 22,000 - 3,000 Cash at Bank 25,000 18,000 - 7,000 Sundry Debtors 30,000 28,000 - 2,000 Bills Receivable 47,000 45,000 - 2,000 Short-Tenn Investment 1,10,000 84,000 - 26,000 Prepaid Expenses 1,000 2,000 1,000 -Inventories 92,000 1,06,000 14,000 -Total Current Assets (A) 3,30,000 3,05,000
Current Liabilities : Sundry Creditors 50,000 48,000 2,000 -Bills Payable 40,000 39,000 1,000 -Bank Overdraft 13,000 9,000 4,000 -Outstanding Expenses 13,000 22,000 - 9,000
Total Current Liabilities (B) 1,16,000 1,18,000
Working Capital (A - B) 2,14,000 1,87,000 -Net Decrease in Working Capital 27,000 27,000 -
2,14,000 2,14,000 49,000 49,000
(2) Calculation of Fund From Operations
Particulars Amount Amount
Rs. Rs.
Profit & Loss Alc (Closing Balance)
Add " Non-Fund or Non-Operating items 23,000 already been debited to P & L Alc
Depreciation on Machinery 10,000 Loss on Sale of Machinery 2,000 Dividend Paid 18,000 30,000
53,000 Less,' Non-Fund and Non-Operating items
already been credited to P & L Alc
Profit on redemption of debentures 800 Profit and Loss Alc (Opening balance) 16,000 16,800
Fund From Operations 36,200
Dr. (3) Fund Flow Statement Cr.
Sources of Fund Amount Application of Funds Amount
Rs. Rs.
Sale of Machinery 4,000 Dividends Paid 18,000 Fund From Operations 36,200 Purchase of Machinery 20,000 Net Decrease in Working Capital 27,000 Tax Paid 10,000
Debenture Redeemed 19,200
67,200 67,200
Fund Flow Statement
Dr. (4) Machinery Account
Particulars Amount Particulars Rs.
To Balance bid 72,000 By Bank (Sold) To Bank (New Machinery) 20,000 By Depreciation Fund (Alc)
By Profit & Loss Alc (Loss) } (6,000 + 4,000 - 12,000)
By Balance cld
92,000
Dr. (5) Depreciation Fund Account
Particulars Amount Particulars Rs.
To Machinery Alc 6,000 By Balance bid
To Balance c/d 44,000 By Profit & Loss Alc (Depreciation)
50,000
Dlustration: 11
Amount Rs.
4,000
6,000 2,000
80,000
92,000
Amount Rs.
40,000 10,000
50,000
199
Cr.
Cr.
From the following Balance sheet of Hari & Co. Ltd. as on 31 SI December 2002 and 2003, you are required to prepare: (a) Fund From operations (b) A Schedule of Changes in Working Capital and (c) A Fund Flow Statement :
'Balance Sheet
liabilities 2002 2003 Assets Rs. Rs.
Equity Share Capital 2,00,000 2,00,000 Fixed Assets at Cost 7% Preference Share Capital 2,00,000 3,00,000 Less : Depreciation
Capital Reserve 20,000 Trade Investments
General Reserve 1,80,000 2,10,000 Sundry Debtors Debenture 3,00,000 2,00,000 Bills Receivable Profit and Loss Alc 70,000 90,000 Preliminary Expenses Sundry Creditors 50,000 50,000 Bills Payable 30,000 20,000 Bank Overdraft 50,000 50,000 Provision for Income Tax 80,000 60,000
Proposed Dividend 40,000 50,000
12,00,000 12,50,000
Additional Information
(1) During the year 2003 depreciation provided for Rs. 1,00,000
(2) Redeemed the debentures at Rs. 105
2002 2003 Rs. Rs.
10,00,000 10,00,000 2,60,000 3,10,000
7,10,000 6,90,000 1,10,000 90,000 1,50,000 2,00,000 1,70,000 2,50,000
30,000 20,000
12,00,000 12,50,000
(3) Sold one machine for Rs. 4,00,000 the cost of the' machine was Rs. 80,000 and the depreciation provided for it amounted to Rs. 30,000

200 A Textbook of Financial Cost and Management Accounting
(4) Sold some trade investments at profit which was credited to capital reserve
(5) Decided to value the stock at cost whereas previously the practice was value stock at cost less 10%. The opening stock according to books 'was Rs. 63,000. The stock on 31" December 2003 was correctly valued at cost.
Solution: (1) Schedule of Changes in Working Capital
Paniculars 2002 2003 Changes in Working Capital
Rs. Rs. Increase Decrease
Current Assets : Sundry Debtors 1,50,000 2,00,000 50,000 -Bills Receivable 1,70,000 2,50,000 80,000 -Inventory 7,000 - - 7,000
Total Current Assets (A) 3,27,000 4,50,000
Current Liabilities : Sundry Creditors 50,000 50,000 - -Bills Payable 30,000 20,000 10,000 -Bank Overdraft 50,000 50,000 - -Total Current Liabilities (B) 1,30,000 1,20,000
Working Capital (A - B) 1,97,000 3,30,000 Net Increase in Working Capital 1,33,000 - - 1,33,000
Total 3,30,000 3,30,000 1,40,000 1,40,000
(2) Calculation of Fund From Operations
Particulars Rs. Rs.
Net Profit (Closing Balance) 90,000 Add : Non-Fund and Non-operating
items which already been debited to profit and loss Alc : Loss on sale of machinery 10,000 Loss on redemption of debenture 5,000 Depreciation provided 1,00,000 Preliminary expenses } (Rs. 30,000 - Rs. 20.000) 10,000 Proposed dividend 50,000 Transfer to General Reserve } (Rs. 2.10,000 - Rs. 1,80,000) 30,000 Provision for income tax 60,000 2,65,000
3,55,000 Less : Non-Fund and Non-Operating
items which already credited to -Profit and Loss Alc : Opening Stock Written off 70,000 Net Profit (Opening balance) 70,000 77,000
Fund From Operations 2,78,000

Fund Flow Statement 201
Fund Flow Statement
Sources of Funds Rs. Application of Funs Rs.
Equity Share Capital - Purchase of Fixed Assets 1,00,000
7% Preference Share Capital 1,00,000 Redemption of Debenture 1,05,000
(2,00,000 - 3,00,(00) Proposed Dividend for 2002 } (Assumed to be paid) 4Q,OOO
Sale of Trade Investments } Provision for Taxation for } (Rs.l,IO,OOO + 20,000 - 90,(00) 40,000 (2002 assumed to be paid) 80,000
Sale of Machine 40,000 Net Increase in Working Capital 1,33,000
Fund From Operations 2,78,000
4,58,000 4,58,000
Dr. Fixed Assets Account Cr.
Particulars Amount Particulars Amount Rs. Rs.
To Balance bid 10,00,000 By Cash (Sale) 40,000
To Cash (Purchase) } Balancing figure 1,00,000 By Accumulated depreciation 30,000
By Adjusted P & L (Loss on Sale) 10,000
By Accumulated depreciation } (Fixed Asset Written off) 20,000 By Balance c/d IO,QO,OOO
11,00,000 11 ,00,000
Dr. Debenture Account Cr.
Particulars Amount Particulars Amount Rs. Rs.
To Bank 1,05,000 By Balance bid 3,00,000 To Balance cld 2,00,000 By Adjusted P & L Alc
(Loss on redeemed) 5,000
3,05,000 3,05,000
Dr. Accumulated Depreciation Account Cr.
Particulars Amount Particulars Amount Rs. Rs.
To Fixed Assets By Balance bid 2,60,000 (Depreciation on Machinery Sold) 30,000 By Adjusted P & L Alc
(Depreciation during the year) 1 ,00,000
To Fixed Assets Written off } (Rs. 7,10,000 - Rs. 6,90,(00) 20,000 To Balance c/d 3, 10,000
3,60,000 3,60,000
202 A Textbook of Financial Cost and Management Accounting
Illustration: 12
The following summarized balance sheets are given to you by Pilh & Co. Ltd. :
Balance Sheet
Liabilities 2002 2003 Assets 2002 2003 Rs. Rs. Rs. Rs.
Share Capital 10,00,000 11,00,000 Fixed Assets Reserves 3,50,000 3,00,000 Less : Depreciation 11,70,000 16,90,000
Profit & Loss Nc 80,000 70,000 Investments 2,00,000 1,50,000 Loans @ 10% 6,00,000 8,00,000 Sundry Debtors 5,00,000 4,50,000
Provision for tax 2,10,000 2,40,000 Stock in Trade 4,50,000 3,90,000
Provision for Doubtful debts 30,000 20,000 Cash at Bank 90,000 60,000
Sundry Creditors 3,10,000 2,90,000 Goodwill 2,70,000 2,00,000
Proposed Dividend 1,00,000 1,20,000
12,00,000 29,40,000 26,80,000 29,40,000
Additional Information
(1) Investments were sold during 2003 at a loss of 20% on the cost
(2) An item of fixed assets, cost Rs.70,ooo, depreciation provided for Rs.66,ooo had to be discarded in 2003 without any scrap value
(3) Depreciation provided during 2003 came to Rs.l,80,OOO
(4) The increase in share capital was because of issue of bonus shared out of reserves. Prepare the fund flow statement for the year ended 31" December 2003.
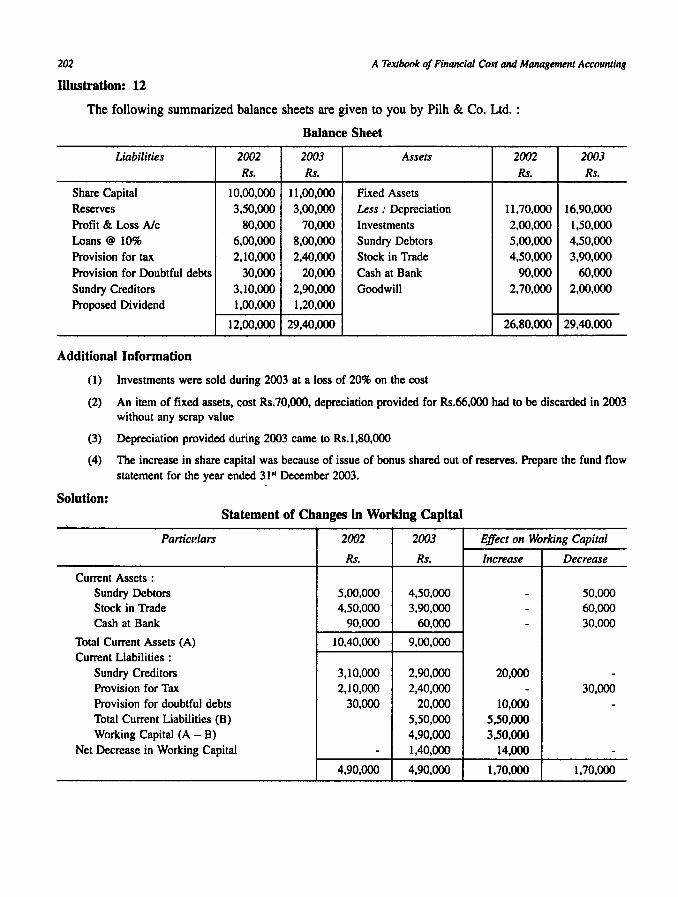
Solution: Statement of Changes in Working Capital
Particl!lars 2002 2003 Effect on Working Capital
Rs. Rs. Increase Decrease
Current Assets : Sundry Debtors 5,00,000 4,50,000 - 50,000 Stock in Trade 4,50,000 3,90,000 - 60,000 Cash at Bank 90,000 60,000 - 30,000
Total Current Assets (A) 10,40,000 9,00,000 Current Liabilities :
Sundry Creditors 3,10,000 2,90,000 20,000 -Provision for Tax 2,10,000 2,40,000 - 30,000 Provision for doubtful debts 30,000 20,000 10,000 -Total Current Liabilities (B) 5,50,000 5,50,000 Working Capital (A - B) 4,90,000 3,50,000
Net Decrease in Working Capital - 1,40,000 14,000 -4,90,000 4,90,000 1,70,000 1,70,000

Fund Flow Statement
Fund Flow Statements
Sources of Fund Amount Particulars Rs.
New Loans raised Fixed Assets acquired (8,00,000 - 6,00,000) 2,00,000 Dividend Paid
Sale of Investments 40,000
Net Decrease in Working Capital 1,40,000
Fund From Operations 4,24,000
8,04,000
Calculation of Funds From Operations
Particulars Amount Rs.
Profit & Loss Alc (Closing Balance) Add: Non-fund and Non-operating
items which have already been debited to P & L Alc: Proposed dividend for 2003 1,20,000 Loss on investment 20% of Rs.50,000 10,000 Loss on fixed assets scraped 4,000 Depreciation provided 1,80,000 Goodwill Written off 70,000 Transfer to reserves 50,000
Less: Non-fund and Non-operating items which have already been credited to P & L Alc: Profit & Loss Alc (opening balance) 80,000
Fund From Operations
Fixed Assets Account
Particulars Amount Particulars Rs.
To Balance bId 11,70,000 By Book Value of item Scraped To Bank Alc 7,04,000
(Purchase of new assets) By Depreci~tion
By Balance cld
18,74,000 "
Movement of Reserves :
Opening Balance of Reserves Less: Utilised for bonus shares
Closing Balance of Reserves
Addition during the year
Rs.
3,50,000 1,00,000
2,50,000
3,00,000
50,000
203
Amount Rs.
7,04,000 1,00,000
8,04,000
Amount Rs.
70,000
4,34,000
5,04,000
80,000
4,24,000
Amount Rs.
4,000
1,80,000
16,90,000
18,74,000

204
QUESTIONS
A Textbook of Financial Cost and Management Accounting
1. What is mean by Fund Flow Statement? 2. Explain the Changes of Financial Position. 3. Briefly explain the Flow of Funds and No Flow of Funds. Illustrate with numerical examples. 4. What are the components of Flow of Fund? 5. What do you understand by Fund Flow Statement? How is it Prepared? 6. Explain the importance of Fund Flow Statement. 7. Distinguish between
(a) Fund Flow Statement and Income Statement (b) Fund Flow Statement and Balance Sheet
8. Explain the limitations of Fund Flow Statement. 9. Explain the procedure for preparation of Fund Flow Statement.
10. What do you understand by Fund From Operations?
11. What is meant by Schedule of Changes in Working Capital How is it prepared?
PRACTICAL PROBLEMS
(1) From the following Balance sheet of X Y & Co. as on 31" Dec. 2002 and 2003, you are required to prepare Statement of Changes in Working Capital.
Balance Sheet
Liabilities 2002 2003 Assets 2002 2003 Rs. Rs. Rs. Rs.
Equity Share Capital 1,00,000 1,25,000 Cash Balances 30,000 47,000 Preference Share Capital 1,00,000 1,25,000 Debtors 60,000 60,000 Creditors 40,000 20,000 Bills Payable 60,000 55,000 Bills Payable 30,000 25,000 Stock 40,000 45,000 Retained Earnings 10,000 23,000 Short-Term Loan 40,000 45,000
Building 50,000 66,000
2,80,000 3,18,000 2,80,000 3,18,000
[Ans: Net Increase in working capital Rs. 47,000].
(2) From the following information, you are required to prepare: (a) Fund From Operations (b) Statement of Changes in Working Capital and (c) Fund Flow Statement:
Comparative Balance Sheet
Particulars 2002 Rs.
Liabilities and Capital : Share Capital50,OOO 40,000 Reserve and Surplus 15,000 Secured Loans 35,000 Current Liabilities 50,000
Total Liabilities and Capital 1,50,000
Assets: Fixed Assets 31,000 Investments 1,500 Cash Balances 2,500
"'.
Stock 75,000 Sundry Debtors 40,000
Total Assets 1,50,000
Additional Information (a) The net profit for the year after adjustments Rs. 1,00,000. (b) Additional fixed assets during the year Rs. 4,000 and depreciation for the year Rs. 3,000.
[Ans: (a) Fund From Operations Rs.l,30,OOO; (b) Statement of changes in working capital Rs. 12,500 (Net Increase in Working Capital); (c) Fund Flow Statement Rs. 23,000].
2003 Rs.
5,000 40,000 60,000
1,45,000
30,000
-1,250
78,750 35,000
1,45,000
Fund Flow Statement
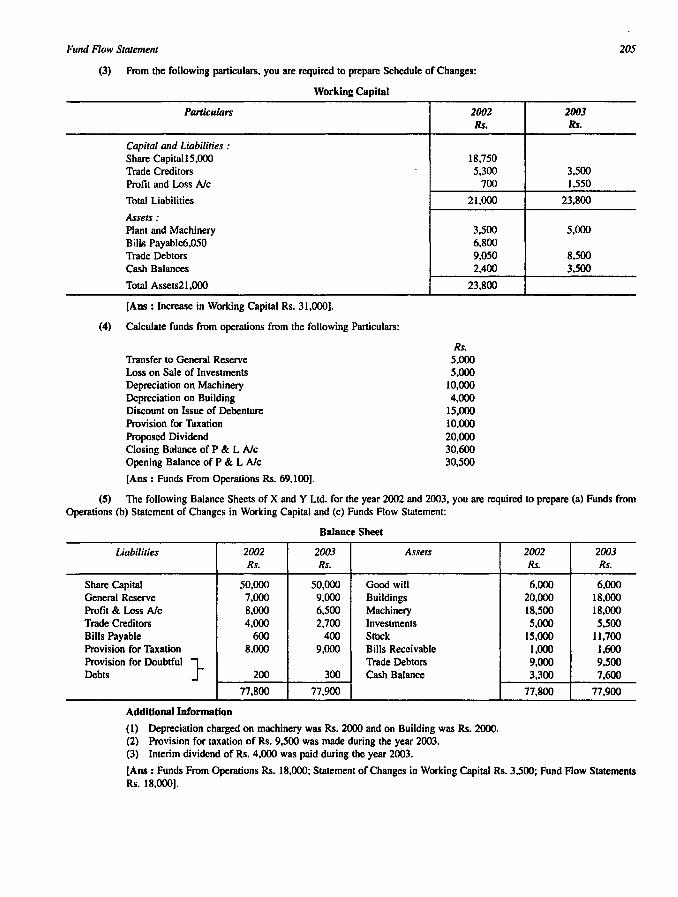
(3) From the following particulars, you are required to prepare Schedule of Changes:
Working Capital
Particulars
Capital and Liabilities: Share Capital15,OOO Trade Creditors Profit and Loss Alc
Total Liabilities
Assets: Plant and Machinery Bills Payable6,050 Trade Debtors Cash Balances
Total Assets21,OOO
[Ans: Increase in Working Capital Rs. 31,000).
(4) Calculate funds from operations from the following Particulars:
Transfer to General Reserve Loss on Sale of Investments Depreciation on Machinery Depreciation on Building Discount on Issue of Debenture Provision for Taxation Proposed Dividend Closing Balance of P & L Alc Opening Balance of P & L Alc
[Ans: Funds From Operations Rs. 69,100).
2002 Rs.
18,750 5,300
700
21,000
3,500 6,800 9,050 2,400
23,800
Rs. 5,000 5,000
10,000 4,000
15,000 10,000 20,000 30,600 30,500
205
2003 Rs.
3,500 1,550
23,800
5,000
8,500 3,500
(5) The following Balance Sheets of X and Y Ltd. for the year 2002 and 2003, you are required to prepare (a) Funds from Operations (b) Statement of Changes in Working Capital and (c) Funds Flow Statement:
Balance Sheet
Liabilities 2002 2003 Assets Rs. Rs.
Share Capital 50,000 50,000 Good will General Reserve 7,000 9,000 Buildings Profit & Loss Alc 8,000 6,500 Machinery Trade Creditors 4,000 2,700 Investments Bills Payable 600 400 Srock Provision for Taxation 8,000 9,000 Bills Receivable Provision for Doubtful } Trade Debtors Debts 200 300 Cash Balance
77,800 77,900
Additional Information
(1) Depreciation charged on machinery was Rs. 2000 and on Building was Rs. 2000. (2) Provision for taxation of Rs. 9,500 was made during the year 2003. (3) Interim dividend of Rs. 4,000 was paid during the year 2003.
2002 2003 Rs. Rs.
6,000 6,000 20,000 18,000 18,500 18,000 5,000 5,500
15,000 11,700 1,000 1,600 9,000 9,500 3,300 7,600
77,800 77,900
[Ans: Funds From Operations Rs. 18,000; Statement of Changes in Working Capital Rs. 3,500; Fund Flow Statements Rs. 18,000).
206 A Textbook of Financial Cost and Management Accounting
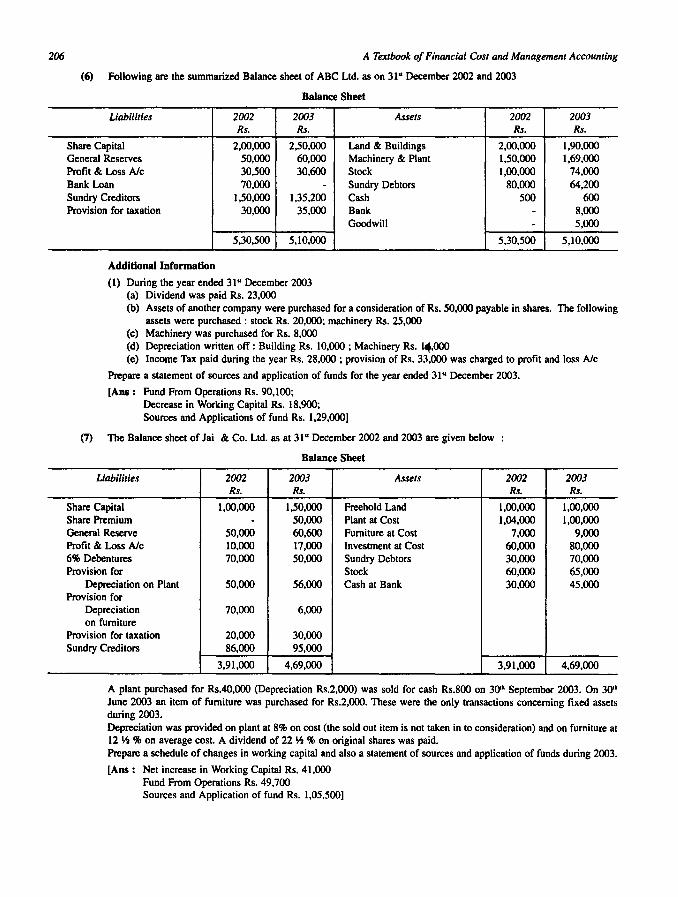
(6) Following are the summarized Balance sheet of ABC Ltd. as on 31" December 2002 and 2003
Balance Sheet
Liabilities 2002 2003 Rs. Rs.
Share Capital 2,00,000 2,50,000 General Reserves 50,000 60,000 Profit & Loss Alc 30,500 30,600 Bank Loan 70,000 -Sundry Creditors 1,50,000 1,35,200 Provision for taxation 30,000 35,000
5,30,500 5,10,000
Additional Information
(1) During the year ended 31" December 2003 (a) Dividend was paid Rs. 23,000
Assets
Land & Buildings Machinery & Plant Stock Sundry Debtors Cash Bank Goodwill
2002 Rs.
2,00,000 1,50,000 1,00,000
80,000 500
--
5,30,500
2003 Rs.
1,90,000 1,69,000
74,000 64,200
600 8,000 5,000
5,10,000
(b) Assets of another company were purchased for a consideration of Rs. 50,000 payable in shares. The following assets were purchased: stock Rs. 20,000; machinery Rs. 25,000
(c) Machinery was purchased for Rs. 8,000 (d) Depreciation written off: Building Rs. 10,000 ; Machinery Rs. ~,OOO (e) Income Tax paid during the year Rs. 28,000 ; provision of Rs. 33,000 was charged to profit and loss Alc
Prepare a statement of sources and application of funds for the year ended 31" December 2003.
[Aos: Fund From Operations Rs. 90,100; Decrease in Working Capital Rs. 18,900; Sources and Applications of fund Rs. 1,29,(00)
(7) The Balance sheet of Jai & Co. Ltd. as at 31" December 2002 and 2003 are given below
Balance Sheet
Liabilities 2002 2003 Assets Rs. Rs.
Share Capital 1,00,000 1,50,000 Freehold Land Share Premium - 50,000 Plant at Cost General Reserve 50,000 60,600 Furniture at Cost Profit & Loss Alc 10,000 17,000 Investment at Cost 6% Debentures 70,000 50,000 Sundry Debtors Provision for Stock
Depreciation on Plant 50,000 56,000 Cash at Bank Provision for
Depreciation 70,000 6,000 on furniture
Provision for taxation 20,000 30,000 Sundry Creditors 86,000 95,000
3,91,000 4,69,000
2002 Rs.
1,00,000 1,04,000
7,000 60,000 30,000 60,000 30,000
3,91,000
2003 Rs.
1,00,000 1,00,000
9,000 80,000 70,000 65,000 45,000
4,69,000
A plant purchased for Rs.40,OOO (Depreciation Rs.2,OOO) was sold for cash Rs.800 on 30'· Septembor 2003. On 30'· June 2003 an item of furniture was purchased for Rs.2,OOO. These were the only transactions concerning fixed assets during 2003. Depreciation was provided on plant at 8% on cost (the sold out item is not taken in to consideration) and on furniture at 12 ~ % on average cost. A dividend of 22 ~ % on original shares was paid. Prepare a schedule of changes in working capital and also a statement of sources and application of funds during 2003.
[Ans: Net increase in Working Capital Rs. 41.000 Fund From Operations Rs. 49,700 Sources and Application of fund Rs. 1,05,5(0)

Fund Flow Statement 207
(8) From the following Balance sheet of XY & Co. Ltd. as on 31 a December 2002 and 2003, you are required to prepare a funds flow statement showing change in working capital.
Balance Sheet
Liabilities 2002 2003 Assets Rs. Rs.
Equity Share Capital 3,00,000 4,00,000 Builqings Preference Share Capital 2,00,000 - Machinery Capital Redemption } Furniture
Reserve - 1,00,000 Investments General Reserve 2,00,000 1,20,000 Stock Share Premium 30,000 30,000 Debtors Profit and Loss Alc 1,20,000 1,80,000 Cash at Bank 10% Debenture 2,00,000 3,00,000 Creditors 80,000 1,40,000
11,30,000 12,70,000
Additional Information
(1) Preference share were redeemed at 10% premium (2) Rs.20,OOO was transferred to reserve fund from profit and loss account (3) Investment (book value Rs. 40,(00) were sold for Rs. 70,000
2002 2003 Rs. Rs.
2,50,000 3,00,000 3,00,000 3,20,000
20,000 18,000 1,00,000 1,50,000 3,00,000 2,50,000 1,40,000 2,00,000
20,000 32,000
11,30,000 12,70,000
(4) Depreciation provided on building, machinery and furniture Rs. 20,000, Rs. 30,000 and Rs. 2,000 respectively. (5) Depreciation paid Rs. 50,000 and income tax paid Rs. 45,000
[Ans: Net Decrease in Working Capital Rs. 38,000 Fund From Operations Rs. 2,17,000 Sources and Application Funds Rs. 5,25,000]
(9) From the following Balance Sheet of Saxena & Co. Ltd. as on 31" December 2002 and 2003, you are required to prepare the Fund Flow Statement.
Balance Sheet
Liabilities 2002 2003 Assets 2002 2003 Rs. Rs. Rs. Rs.
Share Capital 10,00,000 10,00,000 Land & Building at Cost 6,00,000 6,00,000 • Capital Reserve 50,000 50,000 Plant & Machinery at Cost 3,30,000 4,50,000
Long-Term Loans 5,00,000 6,50,000 Furniture at Cost 3,00,000 3,00,000 Sundry Creditors 6,00,000 7,85,000 Stock in Trade 4,10,000 5,60,000
Sundry Debtors 3,40,000 2,10,000 Cash at Bank 20,000 5,000 Profit & Loss Alc 1,50,000 3,60,000
21,50,000 24,85,000 21,50,000 24,85,000
Additionallnrormation . During the year 2003 Depreciation provided on Land and Building was Rs. 50,000; Plant and Machinery was Rs. 50,000 and Furniture was Rs. 15,000.
(10) The following are the summarized Balance sheet of Gupta & Co. Ltd. as at 31" December 2002 and 2003, you are required to prepare a statement showing the sources and application of funds for the year 2003 and a schedule setting out changes in working capital
Balance Sbeet
Liabilities 2002 2003 Assets 2002 2003 Rs. Rs. Rs. Rs.
Share Capital 2,00,000 2,60,000 Goodwill - 20,000 Profit & Loss Alc 39,690 41,220 Plant & Machinery 1,12,950 1,16,200 General Reserve 50,000 50,000 Buildings 1,48,500 1,44,250 Tax Provision 40,000 50,000 Stock 1,11,040 97,370 Bank Overdraft 59,510 - Sundry Debtors 87,490 73,360
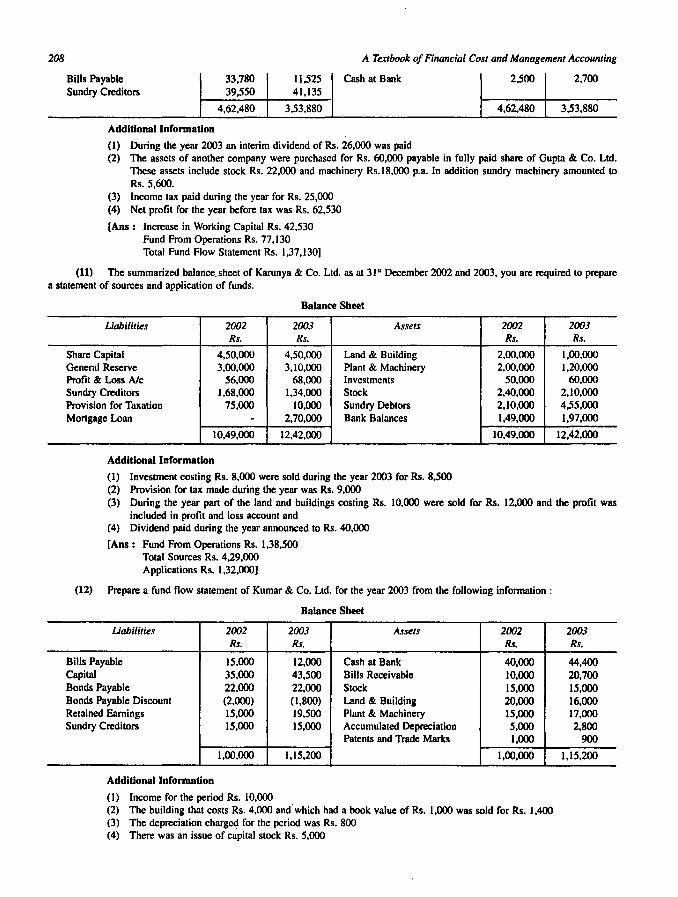
208 A Textbook of Financial Cost and Management Accounting
Bills Payable 33,780 11,525 Cash at Bank 2,500 2,700 Sundry Creditors 39,550 41,135
4,62,480 3,53,880 4,62,480 3,53,880
Additional Information
(1) During the year 2003 an interim dividend of Rs. 26,000 was paid (2) The assets of another company were purchased for Rs. 60,000 payable in fully paid share of Gupta & Co. Ltd.
These assets include stock Rs. 22,000 and machinery Rs.18,OOO p.a. In addition sundry machinery amounted to Rs.5,600.
(3) Income tax paid during the year for Rs. 25,000 (4) Net profit for the year before tax was Rs. 62,530
[Ans: Increase in Working Capital Rs. 42,530 Fund From Operations Rs. 77,130 Total Fund Flow Statement Rs. 1,37,130)
(11) The summarized baiance.sheet of Karunya & Co. Ltd. as at 31" December 2002 and 2003, you are required to prepare a statement of sources and application of funds.
Balance Sheet
Liabilities 2002 2003 AS.fets Rs. Rs.
Share Capital 4,50,000 4,50,000 Land & Building General Reserve 3,00,000 3,10,000 Plant & Machinery Profit & Loss Ale 56,000 68,000 Investments Sundry Creditors 1.68.000 1.34,000 Stock Provision for Taxation 75.000 10.000 Sundry Debtors Mortgage Loan - 2,70,000 Bank Balances
10,49,000 12,42,000
Additional Information
(1) Investment costing Rs. 8,000 were sold during the year 2003 for Rs. 8,500 (2) Provision for tax made during the year was Rs. 9,000
2002 2003 Rs. R.f.
2,00,000 1,00,000 2,00,000 1,20.000
50.000 60.000 2.40,000 2,10.000 2.10,000 4,55.000 1,49,000 1,97,000
10,49,000 12,42,000
(3) During the year part of the land and buildings costing Rs. 10,000 were sold for Rs. 12,000 and the profit was included in profit and loss account and
(4) Dividend paid during the year announced to Rs. 40,000 ..
[Ans: Fund From Operations Rs. 1,38.500 Total Sources Rs. 4,29,000 Applications Rs. 1,32,000)
(12) Prepare a fund flow statement of Kumar & Co. Ltd. for the year 2003 from the following information:
Balance Sheet
liabilities 2002 2003 Assets 2002 Rs. Rs. Rs.
Bills Payable 15,000 12,000 Cash at Bank 40,000 Capital 35,000 43,500 Bills Receivable 10,000 Bonds Payable 22,000 22,000 Stock 15,000 Bonds Payable Discount (2,000) (1,800) Land & Building 20,000 Retained Earnings 15,000 19,500 Plant & Machinery 15,000 Sundry Creditors 15,000 15,000 Accumulated Depreciation 5,000
Patents and Trade Marks 1,000
1,00,000 1,15,200 1,00,000
Additional Information
(1) Income for the period Rs. 10,000 (2) The building that costs Rs. 4,000 and' which had a book value of Rs. 1,000 was sold for Rs. 1.400 (3) The depreciation chargec,l for the period was Rs. 800 (4) There was an issue of capital stock Rs. 5.000
2003 Rs.
44,400 20,700 15,000 16,000 17,000 2,800
900
1,15,200
Fund Flow Sialemenl 209
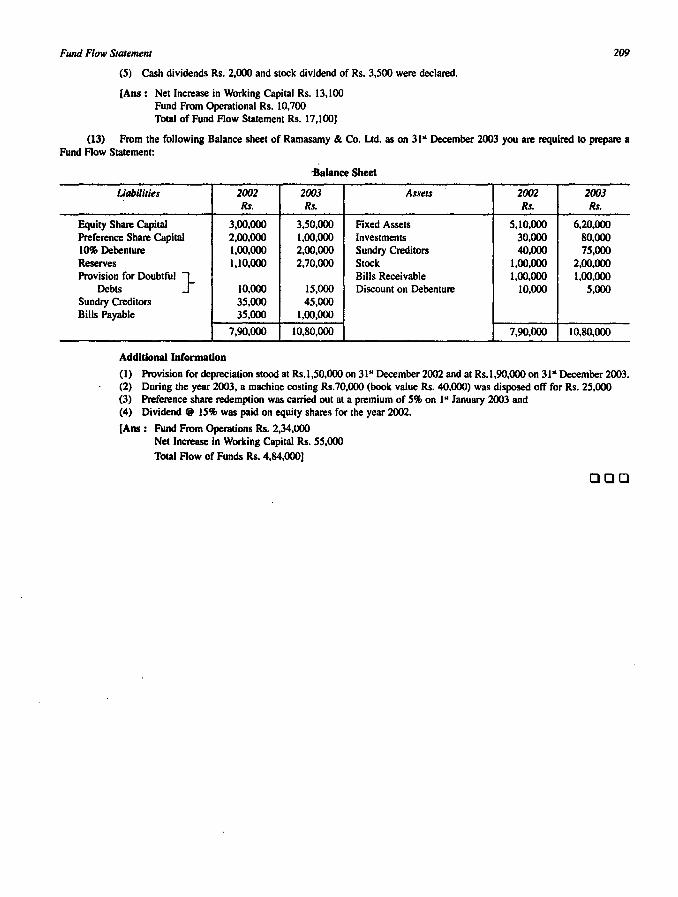
(5) Cash dividends Rs. 2,000 and stock dividend of Rs. 3,500 were declared.
[AIlS: Net Increase in Working Capital Rs. 13,100 Fund From Operational Rs. 10,700 Total of Fund Row Statement Rs. 17,100)
(13) From the following Balance sheet of Ramasamy & Co. Ltd. as on 31" December 2003 you are required to prepare a Fund Row Statement:
-Balance Sheet
liabilities 2002 2003 Assets 2002 2003 Rs. Rs. Rs. Rs.
Equity Share Capital 3,00,000 3,50,000 Fixed Assets 5,10,000 6,20,000 Preference Share Capital 2,00,000 1,00,000 Investments 30,000 80,000 10% Debenture 1,00,000 2,00,000 Sundry Creditors 40,000 75,000 Reserves 1,10,000 2,70,000 Stock 1,00,000 2,00,000 Provision for Doubtful } Bills Receivable 1,00,000 1,00,000
Debts 10,000 15,000 Discount on Debenture 10,000 5,000 Sundry Creditors 35,000 45,000 Bills Payable 35,000 1,00,000
7,90,000 10,80,000 7,90,000 10,80,000
Additional Inronnation
(1) Provision for depreciation stood at Rs.l,50,OOO on 31" December 2002 and at Rs.I,9O,OOO on 31" December 2003. (2) During the year 2003, a machine costing Rs.70,OOO (book value Rs. 40,000) was disposed off for Rs. 25,000 (3) Preference share redemption was carried out at a premium of 5% on I" January 2003 and (4) Dividend @ 15% was paid on equity shares for the year 2002.
[AIlS: Fund From Operations Rs. 2,34,000 Net Increase in Working Capital Rs. 55,000
Toeal Row of Funds Rs. 4,84,000)
QQQ