chapter 6: threats and their sources - u-m seasseas.umich.edu/ecomgt/pubs/manistee/chapter6.pdf ·...
TRANSCRIPT

Chapter 6: Threats and Their Sources___________________________________________________________________________

Chapter 6: Threats and Their Sources 122
OVERVIEW
Threats are processes and events that may cause harmful ecological or physiological impactson an ecosystem. Sources of threats are actions that cause the threat itself (adapted from TheNature Conservancy, The Five-S Framework, 2000). For example, ecological fragmentationis a threat because it often alters natural hydrological flows and harms certain populations ofspecies. Frequent sources of ecological disruption include incompatible logging andresidential development. This chapter combines aspects of the team’s social, political andecological analysis with additional research to inventory, analyze, and map the area’s threatsand sources of threats. The team feels that this is an essential component of any conservationplan that aims to protect an area’s ecological integrity.
IDENTIFICATION OF THREATS AND SOURCES
Table 6.1 shows the study area’s key threats, the sources of threats, and the relationshipsbetween the two. Note that any one threat may have multiple sources and vice versa. Forexample, one threat – landscape fragmentation – may have various sources includingresidential development, oil and gas drilling, and incompatible logging. Alternatively, onesource – ORV use – can influence multiple threats such as altered composition/structure andlandscape fragmentation.
DESCRIPTION OF THREATS
The six most severe threats in the study area are outlined below, listed in order of severityaccording to the analysis presented in Table 6.1.
Altered biotic composition/structure of ecosystems
Alteration of ecosystem structure can occur whenever an action changes the speciescomposition of an area. A wetland that changes from eight percent to 20 percent cattailsserves as an example of a change in ecosystem composition and structure. Because of theinterwoven relationships between structure and function, the ecological functions will also beaffected by changes in composition and structure. In the wetland example, an increasednumber of cattails may change hydrologic patterns. Such alterations of structure may varywidely in how they impact a given ecosystem, from relatively low impact associated withcattail growth to high impact if the wetland is drained and filled for development. Evaluatingboth the direct effects of altered structure, such as loss of wetland ecosystems, and theindirect effects, such as increased erosion due to faster surface water flows, is also critical tounderstand the complete ecological impacts of this threat.
Chapter 6: Threats and Their Sources 123
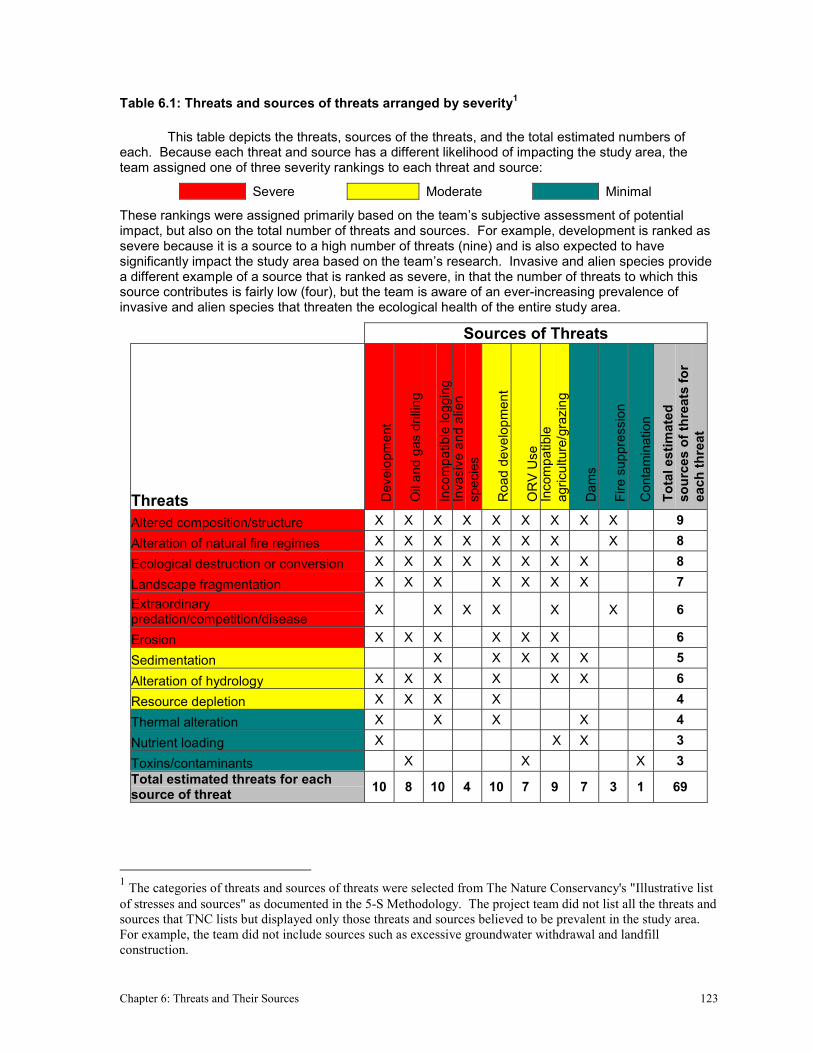
Table 6.1: Threats and sources of threats arranged by severity1
This table depicts the threats, sources of the threats, and the total estimated numbers ofeach. Because each threat and source has a different likelihood of impacting the study area, theteam assigned one of three severity rankings to each threat and source:
Severe Moderate Minimal
These rankings were assigned primarily based on the team’s subjective assessment of potentialimpact, but also on the total number of threats and sources. For example, development is ranked assevere because it is a source to a high number of threats (nine) and is also expected to havesignificantly impact the study area based on the team’s research. Invasive and alien species providea different example of a source that is ranked as severe, in that the number of threats to which thissource contributes is fairly low (four), but the team is aware of an ever-increasing prevalence ofinvasive and alien species that threaten the ecological health of the entire study area.
Sources of Threats
Threats Dev
elop
men
t
Oil
and
gas
drilli
ng
Inco
mpa
tible
logg
ing
Inva
sive
and
alie
nsp
ecie
s
Roa
d de
velo
pmen
t
OR
V U
seIn
com
patib
leag
ricul
ture
/gra
zing
Dam
s
Fire
sup
pres
sion
Con
tam
inat
ion
Tota
l est
imat
edso
urce
s of
thre
ats
for
each
thre
at
Altered composition/structure X X X X X X X X X 9Alteration of natural fire regimes X X X X X X X X 8Ecological destruction or conversion X X X X X X X X 8Landscape fragmentation X X X X X X X 7Extraordinarypredation/competition/disease
X X X X X X 6
Erosion X X X X X X 6Sedimentation X X X X X 5Alteration of hydrology X X X X X X 6Resource depletion X X X X 4Thermal alteration X X X X 4Nutrient loading X X X 3Toxins/contaminants X X X 3Total estimated threats for eachsource of threat 10 8 10 4 10 7 9 7 3 1 69
1 The categories of threats and sources of threats were selected from The Nature Conservancy's "Illustrative listof stresses and sources" as documented in the 5-S Methodology. The project team did not list all the threats andsources that TNC lists but displayed only those threats and sources believed to be prevalent in the study area.For example, the team did not include sources such as excessive groundwater withdrawal and landfillconstruction.

Chapter 6: Threats and Their Sources 124
Alteration of natural fire regimes
Changes in the frequency, intensity, and timing of fire in natural ecosystems can alterecological structure and function. Under the common practice of fire suppression,ecosystems that depend on fire for survival and reproduction change dramatically.Understanding that some effects of fire can harm certain ecosystems, it is necessary todetermine how the alteration of the natural fire regime by such sources as road andresidential development, oil and gas drilling, and silviculture may affect the composition,structure, and function of the ecosystems across the landscape.
Ecological destruction or conversion
Ecological destruction occurs when natural areas are degraded to the point that ecologicalstructures and functions are severely disturbed or eliminated. An example of ecologicaldestruction is forest clearcutting. Ecological conversion is a type of ecological destruction inthat the original covertype is converted to a non-natural covertype, thus altering normalecosystem processes. Replacing a mixed hardwood forest with a pine plantation is anexample of ecological conversion. The primary effect of ecological conversion anddestruction is the loss of ecosystems. Species dependent on the ecosystem may fail toreproduce, die, or move elsewhere because they are no longer able to find the resources theyneed for survival. Ecological processes are also degraded and fragmented causing negativeeffects even to ecosystems outside of the immediate area.
Landscape fragmentation
Landscape fragmentation is the dissection of expansive ecosystems into small, isolatedpatches that are too limited in size to maintain their original structure and function into theindefinite future (Meffe, 1997). Landscape fragmentation is generally considered to havetwo components. The first is the reduction of the total amount of an ecosystem type in thenatural landscape and the second is the apportionment of the remaining ecosystem intosmaller, more isolated patches. The result is a patchwork of small, isolated natural areas in asea of developed land (Noss, 1987).
Fragmentation can disrupt several ecological processes that affect biodiversity and ecosystemintegrity. Fragmentation can increase nutrient loss through erosion, due in part to increasedwater transport resulting from vegetation lose. Fragmentation also alters the impacts of allnatural disturbances, including fires, windstorms, landslides, and floods (Noss andCooperrider, 1994). In addition to its effects on ecosystem processes, fragmentationdegrades ecosystem structure by removing biota, reducing patch size, and increasing edgehabitat. Many conservation biologists agree that conservation strategies can be evaluated onthe basis of how well they counter the effects of fragmentation in real landscapes (Meffe,1997).

Chapter 6: Threats and Their Sources 125
Extraordinary predation/competition/disease
Extraordinary predation and disease typically changes an ecosystem’s functions. Sourcesinclude invasive species that establish and proliferate beyond their natural ranges, typicallyreplacing native flora and fauna through competition or predation (Meffe, 1997). Theseinvasive species are primary signs of ecological stress from other threats in the ecosystem.For example, pine bark beetles are invasive insects that attack weakened pine trees.
Erosion potential
Erosion is a natural process that is not a concern in and of itself. Erosion becomes an issuewhen human activities either directly erode the landscape or leave terrain more susceptible tonaturally-occurring erosion. For example, the use of off-road vehicles on slopes or alongridges can dislodge soil, thus directly contributing to erosion. Other activities such asincompatible logging do not directly remove soil from an area, but remove vegetation so thatthe soil is more exposed to the eroding effects of wind and water. General effects of erosioninclude sedimentation of surface water, soil nutrient loss (Gimeno-Garcia et al., 2000), anddecreased likelihood of reestablishing vegetation.
Several characteristics of the landscape influence its erosion potential, including slope,vegetation, soil texture, and soil moisture. With regard to soil texture, sand is more erodiblethan silt, which, in turn, is more erodible than clay. Steep slopes and sparse vegetation bothlead to greater susceptibility to erosion.
Figure 6.1: Erosion potential in the study area
KALKASKAANTRIM OTSEGO
CRAWFORD
MISSAUKEE
N
0 10 20 Kilometers
Erosion potential
Lower (slope = 0 - 19%)Higher (slope >20%)
Rivers & streamsLakes
County boundaries
Chapter 6: Threats and Their Sources 126
Compounding the problem, many individuals are interested in living in areas that are highlysusceptible to erosion. Hilltops and shorelines provide favorable viewsheds to homeowners.These areas are particularly attractive to home construction and are thus vulnerable toerosion. Figure 6.1 displays the erosion potential for the study area, assuming that areas ofhigh slope (>20 percent) will have the greatest erosion potential.
DESCRIPTION OF SOURCES
This section describes in detail the sources of ecological threats that are found in the studyarea. The sources are described roughly in order of their ecological impact. For each source,the team provides a description of the general ecological effects and study-area specificconsiderations.
Development
Ecological effects
For the purposes of this report, development refers to the conversion of land to residential,industrial or commercial uses. The effects of development on ecological integrity arenumerous and can be quite severe. Of all the threats, development is the most damaging toecosystems because it almost always permanently converts natural areas to non-natural uses.In theory, it is possible to move a home or tear up a parking lot and restore the areas.However, the ecosystem can be so altered that full-scale restoration is rarely successful, evenwhen the costs are not so prohibitive as to discourage restoration efforts altogether.
Aside from overall conversion of the landscape, development also effectively fragmentsnatural areas. Road construction and development go hand in hand because developmentoften both prompts and follows infrastructure development.
Pollution is often a direct result of development. Though certain types of development aremore likely to contaminate air, soil, groundwater, and surface water than others, even thesmallest home with the most environmentally-conscious landowners can contribute somelevel of contamination to the surrounding area. For example, a woodstove releases pollutantsinto the air and a faulty septic system can contaminate groundwater.
Developments can be designed and constructed to minimize ecological impacts. Identifyingthe most ecologically valuable areas can help guide future development toward less sensitivelocales. For example, clustering homes to leave a larger intact natural area is a moreecologically friendly site design than scattering homes across the entire tract. Similarly,incorporating green building techniques can reduce energy use and contamination potential(US Green Building Council, 2000). Regardless of the site or building design, however,there is little question that virtually all development affects an area’s ecology to a certaindegree.

Chapter 6: Threats and Their Sources 127
Study area specifics
The team asserts that residential development poses one of the greatest sources of threats tothe ecological health of the study area. Residential construction is far more prevalent in thestudy area than industrial or commercial development, although some additional businessesmay enter the area as the population expands. As explained in the demographics section (seeChapter 4), the nominal increases in housing units and population are not particularlyalarming, but the percentage increases are quite significant. Population in the study area’scounties grew 23 percent from 1990 to 2000, while the state’s increased only seven percent.Similarly, housing units in the study area’s counties increased 19 percent from 1990 to 2000,while the state’s increased just 10 percent. Tables 6.2 and 6.3 provide details on theseincreases in housing units and population from 1990 to 2000.
Table 6.2: Housing units authorized by building permits (1990-2000) for counties within the study area and Michigan
1990 2000Increase,1990-2000
Percentchange,
1990-2000
Antrim Co. 13,145 15,090 1,945 15%
Crawford Co. 8,727 10,042 1,315 15%
Kalkaska Co. 9,151 10,822 1,671 18%
Missaukee Co. 7,112 8,621 1,509 21%
Otsego Co. 10,669 13,375 2,706 25%
Average for all counties 48,804 57,950 9,146 19%
State of Michigan 3,847,926 4,234,279 386,353 10%
Table 6.3: Population change (1990-2000) for counties within the study area and Michigan
1990 2000Increase,1990-2000
Percentchange,
1990-2000
Antrim Co. 18,185 23,110 4,925 27%
Crawford Co. 12,260 14,273 2,013 16%
Kalkaska Co. 13,497 16,571 3,074 23%
Missaukee Co. 12,147 14,478 2,331 19%
Otsego Co. 17,957 23,301 5,344 30%
Average for all counties 74,046 91,733 17,687 23%
State of Michigan 9,295,297 9,938,444 643,147 7%

Chapter 6: Threats and Their Sources 128
Numbers aside, the pattern of most housing construction contributes greatly to the severity ofdevelopment’s impact on ecological health. The greatest concentrations of developmentinclude the Wilderness Valley subdivision in southwestern Otsego County and the Lakes ofthe North subdivision in southeastern Antrim County. While the size and density of thesedevelopments attracts attention, even more significant are the numerous smaller subdivisionsand individual homes scattered throughout the study area. According to the SpringfieldTownship Clerk (Kalkaska Co.), “Houses are sprouting up all over like mushrooms”(Ingersol, 2002).
The scattered development pattern is expected to continue indefinitely. Land splits havebeen particularly common over the last five to ten years (Riley, 2002 and Ingersol, 2002), asfarmers or other elderly landowners retire and sell off all or part of their land (Pratt, 2002), oras new landowners purchase large tracts and sell off smaller portions to other buyers(Bucklin, 2002). Zoning ordinances permit home construction virtually anywhere in thestudy area except on public land and in areas zoned as commercial or industrial (see Chapter4). In addition, people continue to move to the study area for its rural character, selectingisolated properties for added seclusion (Bidle, 2002; Leach, 2002). Residents appreciatehaving “as much land as they want,” asserted the Zoning Administrator for Kalkaska County(Leach, 2002).
Certain landscape characteristics attract more development than others. Not surprisingly,waterfront property entices many homebuyers. Rolling hills and forested lands are alsodesirable. In some areas where saturated soils prevent easy home construction, growth islikely to occur “anyplace where there’s high ground” (Ingersol, 2002).
Planning and zoning officials expect slight to moderate growth in the future. When askedabout the ten-year outlook for land use, the Zoning Administrator for Garfield Township(Kalkaska Co.) replied that the township would look “pretty much the way it does now,” andstressed the rural location of the area (Bidle, 2002). A different perspective was offered byBill Riley, the Zoning Administrator for Blue Lake Township (Kalkaksa Co.). Riley expectsthat many more houses will be built (primarily new and large single family homes) and thatparcels will be further subdivided over the next 10 years. At the same time, however, hementioned that building permits in Blue Lake have been decreasing over time, fromapproximately 75 permits per year in 1994, to 55 per year from 1995-1999, to 35 per year in2000 and 2001 (Riley, 2002). Similarly, the Springfield Township Clerk acknowledged thatKalkaska County has experienced a huge growth spurt in recent years, but that 2001 did notfollow recent growth trends, with a significant reduction in construction compared with thethree previous years (Ingersol, 2002). When considering the comments from allinterviewees, it appears that residents definitely expect future growth, though at a slowerpace than in the past.
Oil and Gas Drilling
Background
Chapter 6: Threats and Their Sources 129
Oil and gas development in Michigan began in the late 1960s with the discovery of theNiagaran Reef, a deep-layer shale that runs throughout the northern portion of the LowerPeninsula from Manistee to Rogers City. In response to the discovery, oil companies scouredthe region for leases from public as well as private landowners. In the summer of 1968, theMichigan Department of Natural Resources (MDNR) leased nearly 550,000 acres of publicland in northern Michigan for oil and gas development. This sale generated more than $1million in revenue and prompted the most intensive oil and gas exploration in the continentalUnited States in the 1970s, exceeded nationwide only by exploration in Alaska's North Slope(Michigan Land Use Institute, 2002).
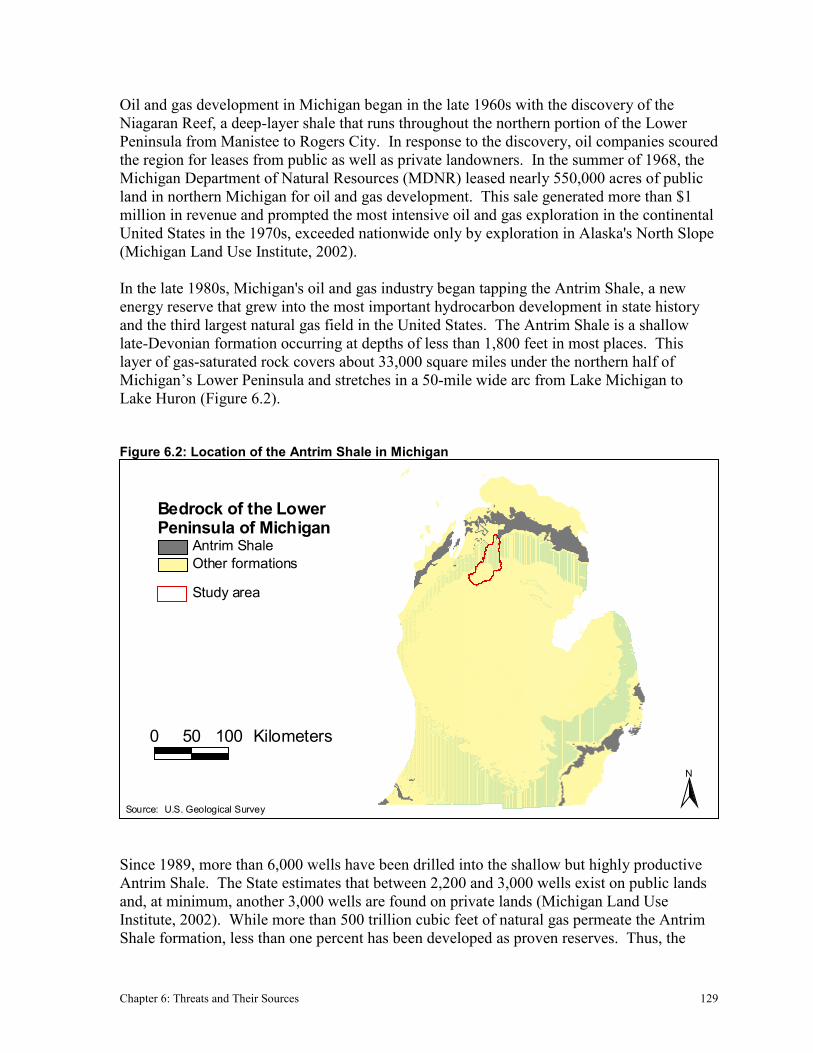
In the late 1980s, Michigan's oil and gas industry began tapping the Antrim Shale, a newenergy reserve that grew into the most important hydrocarbon development in state historyand the third largest natural gas field in the United States. The Antrim Shale is a shallowlate-Devonian formation occurring at depths of less than 1,800 feet in most places. Thislayer of gas-saturated rock covers about 33,000 square miles under the northern half ofMichigan’s Lower Peninsula and stretches in a 50-mile wide arc from Lake Michigan toLake Huron (Figure 6.2).
Figure 6.2: Location of the Antrim Shale in Michigan
N
0 50 100 Kilometers
Source: U.S. Geological Survey
Bedrock of the Lower Peninsula of Michigan
Antrim ShaleOther formations
Study area
Since 1989, more than 6,000 wells have been drilled into the shallow but highly productiveAntrim Shale. The State estimates that between 2,200 and 3,000 wells exist on public landsand, at minimum, another 3,000 wells are found on private lands (Michigan Land UseInstitute, 2002). While more than 500 trillion cubic feet of natural gas permeate the AntrimShale formation, less than one percent has been developed as proven reserves. Thus, the

Chapter 6: Threats and Their Sources 130
Antrim Shale remains one of the most actively drilled gas fields in the United States(Corbley, 1995). The shale’s productivity, boosted by a generous federal tax credit and asignificant state subsidy, has enabled Michigan to produce more than 25 percent of thenatural gas it uses, an increase from roughly five percent a decade ago. At current marketprices and production levels, energy companies are earning gross revenues of more than $500million annually from Antrim Shale gas. Furthermore, production is increasing around fiveto eight percent annually (Michigan Land Use Institute, 2002).
Study Area Specifics
The potential for continued Antrim Shale gas development exists throughout the study area,centered mainly in the southeast corner of Antrim County and central Otsego County.Extraction from the deep-layer Niagaran Reef also continues below the Coldwater Shaleformation in Kalkaska, Antrim, Otsego and Crawford counties (Figure 6.3).
Figure 6.3: Location of Antrim and Coldwaters Shale for the study area
KALKASKAANTRIM OTSEGO
CRAWFORD
MISSAUKEE
KALKASKAANTRIM OTSEGO
CRAWFORD
MISSAUKEE
N
0 10 20 Kilometers
Source: U.S. Geological Survey
Bedrock types under which oil & gas typically lies
Antrim ShaleColdwater ShaleOther bedrock types
Study areaCounty boundaries
Any party can submit applications to lease state lands for five-year periods for oil and gasexploration, and this lease can be extended indefinitely for as long as oil and gas areproduced. Therefore, many areas of public lands in the study area are likely to be auctionedfor leasing, at prices ranging from $13 per acre to $1,000 per acre (MDNR - Forest, Mineral,and Fire Management Division, 2002). While the Department of Natural Resources restrictssome lands from development, large areas of state land are open for potential oil and gasactivity.

Chapter 6: Threats and Their Sources 131
The Michigan Department of Natural Resources continues to lease thousands of acres withinPere Marquette State Forest, Mackinaw State Forest, and Au Sable State Forest, locatedmainly in Otsego, Crawford, and Kalkaska counties. With more than 2,000 more AntrimShale gas wells expected in the next five years and an unknown number expected in the long-term, the potential for oil and gas development to harm ecosystems in the study area isimmense (Michigan Land Use Institute, 2002). Since the inception of Antrim Shale gasexploration in the late 1980s, the most intensive drilling in the area has centered on OtsegoCounty. Now, energy companies are expanding from Otsego County into Crawford andAntrim Counties. Currently, more oil and gas wells exist in Frederic Township in CrawfordCounty than any other township in the state (Pratt, 2002). The study area contains two of thefive most actively drilled counties in Michigan – Otsego County and Antrim County(Michigan Land Use Institute, 2002).
Groups in the watershed and throughout Michigan have formed to combat the threat of oiland gas development. In 1995, six grassroots conservation groups and a Manistee Countytownship formed the Michigan Energy Reform Coalition, a statewide alliance to gain greaterpublic oversight of Antrim Shale natural gas development. The coalition, managed by theMichigan Land Use Institute, has grown to 24 organizations and township governmentsrepresenting more than 200,000 state residents. Involved organizations include TroutUnlimited, Michigan Environmental Council, Friends of the Jordan River Watershed, Centerfor Wildland Conservation, Tip of the Mitt Watershed Counsel, Michigan Communities LandUse Coalition, Citizens for Alternatives to Chemical Contamination, and the Pigeon RiverCountry Association (Michigan Land Use Institute, 2002).
Incompatible agriculture/grazing
Ecological effects
Agricultural activities can degrade the environment in a variety of ways. Farming canincrease soil erosion and create disturbed ground areas, which promote the establishment ofinvasive species on the edges of fields. Use of fertilizer and pesticides harms some nativeinsect and plant species and the runoff of such chemicals increases water pollution. Themonocultural characteristic of crop farms changes the natural composition of the ecosystem,destroying habitat for wildlife and degrading sites for native plants. However, farmstypically have much less severe impacts than other development, including residential,commercial and industrial uses. The team also recognizes that farms and agricultural cropscan provide a number of positive ecological services including the creation of migrationcorridors and habitats for some species.
Grazing affects the environment by compacting soil and decreasing native plant species.Most grazing sites are pastures planted with non-native grasses, thereby reducing theabundance and diversity of native plants and associated wildlife populations. Soilcompaction can hinder water infiltration and make it difficult for plants to take root.Excessive grazing increases erosion as the soil is left exposed to wind and water. In addition,

Chapter 6: Threats and Their Sources 132
grazers can disperse seeds of non-native species across large ranges, through both theirhooves and manure.
Study Area Specifics
Agriculture is not as extensive in the study as in other areas of Michigan. In KalkaskaCounty, farms are not abundant due to the sandy, infertile soils of the area. Most of thefarms in Kalkaska County are potato farms located in Orange and Oliver townships and tendto use abundant amounts of chemicals and irrigation (Bromelmeier, 2002). Corn, hay, andoats make up other common crops farmed in Kalkaska, Otsego, Antrim, and Missaukeecounties. However, the actual number of acres farmed in the study area is unknown. Somefarmers in Kalkaska County are actually starting to take their land out of production as theynear retirement. This trend indicates that incompatible agriculture will be less of a threat tothe area in the future but may open more areas to the far greater threat of development(Bromelmeier, 2002).
Cattle are the main grazing animals in the study area. While Missaukee County boasts thelargest number of cattle (22,000 head) of the five counties, Antrim (5,000 head), Otsego(2,300 head), and Kalkaska (1,000 head) counties also support cattle (U.S. Department ofAgriculture, National Agricultural Statistics Service, 2002). The geographic extent ofgrazing lands in the study area is not known.
Incompatible logging
Ecological effects
Logging can impact ecological health in many ways. Perhaps most significantly, it canfragment natural areas by removing trees and constructing roads to transport logs andequipment. This fragmentation creates more edge area and leaves the remaining core areasmore susceptible to disturbances such as wind and invasion of exotic or nuisance species.Logging can reduce ecosystem diversity, which in turn reduces biological diversity, byreducing the available area in which species can survive. Logging can also affect hydrology,as the removal of vegetation from slopes reduces infiltration and increases runoff and erosionto nearby surface waters. Logging in riparian ecosystems can dramatically increase surfacewater temperatures, especially in headwaters areas. Microclimate can change as well –temperatures increase when removing trees from the overstory increases the amount ofsunlight that reaches the groundcover and understory layers.
The relative impacts of timber harvesting in a given area are largely determined by (1) theintensity of logging, (2) the scale of operations, (3) the logging techniques used, and (4) thesensitivity of different ecosystems to disturbance. In terms of intensity, logging 10 treeswithin a 10 acre site is less intense (and thus less damaging) than clearcutting on that same10 acres. In terms of scale of operations, the larger the extent of the logging, the greater theimpacts to ecosystem health. For example, logging 10 acres at a given intensity is lessdamaging than logging 100 acres at the same intensity. With regard to logging techniques,

Chapter 6: Threats and Their Sources 133
clearcut logging can severely affect ecosystems, whereas careful, selective logging ofuneven-aged stands can be quite sustainable if done appropriately. And finally, in terms ofecosystem sensitivity, logging may differentially impact different ecosystems. For example,logging aspen trees may have less of an ecological impact than logging late successionalhardwoods, because it is easier to reestablish aspens than hardwoods.
While logging can reduce ecological vitality, it is generally less damaging to the landscapethan residential development at a comparable scale. Unlike most development, even clearcutsites can be restored to a more natural state, given adequate time and effort. Although mostlogging reduces ecosystem diversity, the county forester for Antrim and Kalkaska Countiesasserts that plantations are also not the “biological desert” that many claim. He believes thatplantation stands that are at least three years old and receive some active management offer adiversity of structure that provides wildlife values (Merriweather, 2002). For example,planting uneven-aged stands or more than one type of tree species in a plot provides a morediverse habitat for wildlife than even-aged monocultures.
Study area specifics
During the 18th and 19th centuries, European settlers clearcut and slash burned almost theentire state of Michigan, including the study area. These activities contributed to widespreadand dramatic erosion, and the slash burning left fire scars that are still present today.2 Sincethat time, trees have regenerated naturally or have been planted. Today, silviculture is highlyprevalent throughout the study area. Plantations (typically even-aged stands planted andharvested on a regular basis) comprise roughly 90 percent of red pine in the study area, andapproximately 100,000 pines are replanted every year in Kalkaska County alone(Merriweather, 2002). Other commonly logged trees include aspens and northern hardwoods(including beech, sugar maple, and hemlock). Much of the once prime hardwood forest iscurrently managed as plantations, but ample opportunity still exists to harvest hardwoodsfrom naturally regenerating forests (Merriweather, 2002). In general, hardwoods areconcentrated on moraines and ice contact terrain (Merriweather, 2002).
As outlined in Chapter 4, three types of woodlots occur in the study area. Christmas treefarms are generally planted in the even-aged and straight rows associated with plantations,and are intensely managed (Bromelmeier, 2002). The abundance of Christmas tree farms hasdecreased because many smaller farmers are losing the market. Despite this decline, roughly4,000 acres of these plantations still exist in Kalkaska County. Industrial tree farms varygreatly in structure and size, ranging from 40 acres to over 2,000 acres. Corporations placemore of an emphasis on timber harvest for profit than do owners of private woodlots.Private woodlots generally take the form of naturally-regenerating forests (and are thereforegenerally not plantations) on which the landowner may permit occasional timber harvesting,perhaps every 10 years. Private woodlots are generally 40 to 80 acres in size (MI Tree FarmSystem, 2000). These farms are more common throughout the study area than Christmas treefarms (Stone, 2002). Erickson et al. (2001) estimate that roughly 35 percent of all Michiganforests are owned by private and nonindustrial landowners.
2 Fire scars are areas where the fire intensity was so great as to consume all organic soils and soil organisms.

Chapter 6: Threats and Their Sources 134
Regardless of woodlot type, the intensity of logging operations is still an issue in the studyarea. While land managers increasingly recognize the importance of sustainable loggingpractices, clearcut logging remains a major threat to some areas. For example, forest productcompanies recently contacted MDNR to clearcut a large amount of state land in CrawfordCounty’s Graying Township. Public opposition successfully halted these plans (Wright,2002). A Frederic Township (Crawford County) representative expressed greaterdissatisfaction with many of the successful clearcutting ventures on state lands, explainingthat MDNR has permitted clearcutting without always adequately informing the public orseeking its input (Pratt, 2002).
Another challenge regarding logging intensity is that multiple logging companies operate inthe study area. At least two major companies – Weyerhauser and Georgia Pacific – harvesttimber in the area. To their credit, logging companies are less interested in loggingindividual properties than they are in managing the tracts as a total system (Bucklin, 2002).However, unless the companies coordinate logging plans with each other and consciouslyattempt to limit impacts to any one region, the patchwork operations of multiple companiescan result in intense logging throughout the region. Logging on private lands complicatescohesive management efforts, as companies must work with more landowners than if theyprimarily logged on state lands.
Though the intensity and scale of logging is a concern in the study area, several factors limitthe potential extent of future logging operations. One forester mentioned that parcels of lessthan 10 acres are too small for timber management (Merriweather, 2002). Therefore, aslandowners increasingly split lots in the study area, the opportunities for logging willdecrease. Landowner interests also influence logging potential. According to one forester,more than 90 percent of the landowners with whom he works are interested in maintaining orenhancing property for wildlife habitat, aesthetic purposes, or hunting. These goals are notcompatible with intense logging practices. The interviewee also mentioned that fewlandowners are motivated by profit, and for properties on which harvesting occurs, profits areoften reinvested in other land improvements (Bucklin, 2002). Erickson’s study (2001) offerssupport for landowners’ non-economic management motivations for Michigan woodlots.
Invasive Species
Ecological Effects
Also known as “exotic” or “alien species,” invasive species are flora or fauna that areintroduced beyond their native ranges and proliferate, spread, and persist to the detriment ofthe environment (Mack et al., 2000). The introduction of invasive species ranks as one of theleading causes of loss of biological diversity (Meffe, 1997).
Invasive species serve a primary source of threat to the environment by replacing nativespecies through competition, predation, or disease. Such changes in species composition canalter the dynamics of ecosystem functions (Meffe, 1997). Vacant or underutilized nicheswithin ecosystems promote the establishment and growth of invasive species. Niche

Chapter 6: Threats and Their Sources 135
vacancies may result from ecological disturbances such as road construction in which nativespecies were destroyed and unable to re-establish in a short time frame due to changes in theecosystem. Once established, invasive species often grow and spread quickly because thenew environment lacks natural competitors, predators, grazers, and parasites (Mack et al.,2000). Invasive species fall into three main groups – flora, fauna, and fungi.
Study Area Specifics
I. Invasive flora
� Spotted knapweed
Carried by wind or vehicles, spotted knapweed (Centaurea maculosa) invades open anddisturbed areas. These areas include housing development sites and grazing fields as well asalong highways, waterways, railroad tracks, pipelines, and recently installed utility lines. Itproduces 1,000 or more seeds per plant, and the seeds remain viable in the soil over fiveyears, allowing infestations to occur a number of years after vegetative plants have beeneliminated (Lym et al., 1992). In addition to prolific reproduction, spotted knapweed oftenreleases a chemical compound that reduces the growth of competitor species (Center forEnvironmental and Regulatory Information Systems, 2002). By rapidly spreading in thedisturbed area and inhibiting growth of other plants, spotted knapweed reduces the nativefloral diversity.
� Purple loosestrife
A plant of European origin, purple loosestrife (Lythrum salicaria), has degraded temperateNorth American wetlands since the early nineteenth century (Blossey, 2002). Purpleloosestrife succeeds as an invasive plant mainly because it can survive in a wide range ofphysical and chemical conditions characteristic of disturbed areas. Conditions such as waterdrawdown or exposed soil accelerate purple loosestrife invasions by providing idealconditions for seed germination. Its ability to reproduce prolifically by both seed dispersaland vegetative propagation also contributes to its success. A single stalk can produce from100,000 to 300,000 seeds per year, with a 60 to 70 percent survival rate (WisconsinDepartment of Natural Resources, 2002). These seeds are dispersed by water and in mudthat adheres to aquatic wildlife, livestock, and people. Because seeds can remain viable inthe soil for many years, eliminating purple loosestrife is extremely difficult.
Any sunny or partly shaded wetland is susceptible to purple loosestrife invasion includingmarshes, stream margins, alluvial floodplains, sedge meadows, and wet prairies. The plantstend to create monotypic stands that displace native wetland vegetation and degrade wildlifehabitat. These impenetrable stands are unsuitable as cover, food, or nesting sites for nativewetland animals including geese, ducks, rails, muskrats, frogs, toads, and turtles (Great LakesInformation Network, 2002).

Chapter 6: Threats and Their Sources 136
Since 1996, purple loosestrife has been found in all contiguous states except Florida(Blossey, 2002). All counties of Michigan are infested with this invasive plant, including thestudy area.
� Kentucky bluegrass
Kentucky bluegrass (Poa pratensis) is a common exotic plant in oak-pine barrens in thestudy area. Since its growth and reproduction rates increase in nitrogen-rich and moistenvironments, Kentucky bluegrass proliferates in the absence of fire to form impenetrableareas that impede growth of native plants through competition for space, water, and nitrogen(Michigan Natural Features Inventory, 2002).
� Sheep sorrel
Sheep sorrel (Rumex acetosella) is another non-native species common to oak-pine barrens inthe study area, as well as in fields, pastures, meadows, riparian areas, and along roadsides.Generally found in open, unshaded areas on disturbed sites, it thrives on acidic soils with lowfertility but can adapt to a variety of soil types (U.S. Department of Agriculture, Fire EffectsInformation System, 2002). Reproducing from creeping roots and rhizomes, as well asthrough seed dispersal, sheep sorrel spreads rapidly through natural areas in the absence offire and with the prevalence of off-road vehicles (Michigan Natural Features Inventory,2002). The seeds generally remain viable in the soil long enough to provide a source of newinfestations when the soil is disturbed.
II. Invasive fauna
A. Defoliating insects
Defoliating insects comprise the most threatening invasive animal species in the study area,because of its extensive forest cover. In addition, according to Michigan Department ofNatural Resources, the introduction of exotic defoliators is perhaps the most serious threat tothe state’s native forest ecosystems (National Forest Health Monitoring System, 2002).Table 6.4 displays the occurrences of defoliators by type within the study area.
� Gypsy moth
Tree mortality increased in Michigan during the 1990s, due in part to gypsy moth (Lymantriadispar) defoliation. In 1992, the gypsy moth caused the largest known extent of defoliationin Michigan history. Currently, the gypsy moth exists in every county of the LowerPeninsula. While gypsy moths prefer oak tree leaves, they feed on more than 600 species oftrees, shrubs, and vines (Michigan’s Gypsy Moth Education Program, 2002). Since the studyarea abounds with oak, aspen, birch, willow, crabapple, maple, and other susceptible treespecies, the gypsy moth is an increasing threat to the area’s forest health (National ForestHealth Monitoring System, 2002).

Chapter 6: Threats and Their Sources 137
� Jackpine budworm
The jackpine budworm (Choristoneura pinus pinus) is a major threat to the area’s pineforests. While it prefers jack pines located in mixed stands, damage to white and red pinesalso occurs. This damage results from larvae defoliation that leads to the deformation of theupper crown. Affected trees most commonly experience growth reduction, though treemortality often occurs after repeated attacks. Within the study area, the jackpine budwormoccurred in 12,471 areas in 2000 and 37,700 areas in 2001 (Table 6.4).
Table 6.4: Defoliation occurrences in the study area in 2000 and 2001Gypsy Moth Jack Pine
BudwormLarge Aspen
TortrixUnknownDefoliant
TOTAL
Year 2000Antrim 0 0 0 0 461Crawford 0 11,759 0 0 12,043Kalkaska 15 409 0 392 895Missaukee 27 0 0 2,827 2,854Otsego 2,620 303 0 67 2,990
2000 TOTAL 2,662 12,471 0 3,286 19,242
Year 2001Antrim 0 0 0 63 63Crawford 0 35,048 915 0 35,964Kalkaska 0 1,426 5,578 0 7,396Missaukee 0 1,296 13,640 0 14,935Otsego 0 0 0 637 637
2001 TOTAL 0 37,770 20,133 700 58,603Adapted from Michigan Forest Pest Infestation Statistics (Michigan Department of Natural Resources, 2002)
� Large aspen tortrix
Large aspen tortrix (Choristoneura conflictana) prefers aspen trees but also invadessecondary hosts such as white birch, balsam poplar, and various willow species. Larvae feedon the tree buds and, in most cases, completely devour them so that no foliage is produced.Massive defoliation reduces annual incremental growth and inhibits twig growth but rarelyresults in tree mortality (National Resources Canada, 2002). Large aspen tortrix defoliatednumerous acres of aspen and mixed aspen stands in the Lower Peninsula in 2001.
B. Other insects
� Pine bark beetle
Pine bark beetles (Coleoptera: Scolytidae) tunnel into pine trees and feed on the soft innerbark. Adult bark beetles are first attracted to weakened or stressed trees and lay eggs.During serious outbreaks, however, seemingly healthy trees are also susceptible to beetle

Chapter 6: Threats and Their Sources 138
infestation. Upon hatching, the larvae bore through the tree’s nutrient transport system andfeed on live tissue below the bark, eventually killing the tree. Since 1997, pine bark beetlepopulations have been increasing in the Lower Peninsula, including the study area (NationalForest Health Monitoring System, 2002).
� Pine shoot beetle
Pine shoot beetles (Tomicus piniperda) attack new shoots of pine trees and may attackstressed pine trees by breeding under the bark at the base of the tree. Such activities stunttree growth and may cause tree death when high populations exist. Known to be establishedin most counties of the Lower Peninsula, including the five counties in the study area(National Forest Health Monitoring System, 2002), pine shoot beetles inhabit mature pinestands as well as Christmas tree farms and pine nurseries (U.S. Department of Agriculture,2002).
C. Non-native animals
� Zebra mussels
Zebra mussels (Dreissena polymorpha) are one of the most well-known invasive species inthe Great Lakes region. Brought to the United States from Europe through ship ballastwaters, zebra mussels were first found in Lake Erie in 1988. In the past 15 years, they haveexpanded rapidly into all of the Great Lakes as well as inland rivers and tributaries (NationalAtlas, 2002).
These small mollusks spread rapidly due to their high reproductive rate and early maturation.A fully mature female mussel can produce several hundred thousand eggs per season. Thelarvae travel large distances as plankton following the water currents until attaching to hardsurfaces to develop into an adult. Within a year, a zebra mussel becomes sexually mature.Zebra mussels also flourish because they can tolerate a wide range of depths, light intensity,and temperatures extremes (Minnesota Sea Grant, Zebra Mussels, 2002). In addition, theirknown predators – some diving ducks, freshwater drum, carp, and sturgeon – are notnumerous enough to have a major effect on the zebra mussel populations in the Great Lakes(National Atlas, 2002).
With each zebra mussel filtering about one liter of water per day, this invasive species causessignificant impact on native animals. Filtering out large amounts of plankton from the watercolumn, zebra mussels decrease the food supply available for small fish. Zebra mussels alsoharm native mussel species through encrustation (Minnesota Sea Grant, Zebra mussels,2002).
Zebra mussels are expanding their range into many Michigan rivers, including the ManisteeRiver and its tributaries in the study area.

Chapter 6: Threats and Their Sources 139
III. Invasive fungi
� Oak wilt
Oak wilt is a lethal vascular disease caused by a fungus (Ceratocystis fagacearum) that livesand grows in the water conducting tissues (xylem) of oak trees. The trees attempt to stop thespread of the fungus by producing gummy substances called tyloses. The combination of thefungus and tyloses disrupts the water flow to the canopy and results in leaf wilting anddefoliation. Root grafts between trees of the same species in close proximity are the mostcommon method for spreading oak wilt since the interconnection of vascular tissue allowsthe fungus to travel from an infected tree to a healthy tree. Bark beetles also spread thedisease. Although various oak species are hosts to the fungus, red oaks (Quercus rubra) aremost susceptible and usually die within four to six weeks, while white oaks (Quercus alba)are more resistant to the disease (Rexrode and Brown, 2002).
� Dutch elm disease
The fungi (Ophiostoma novo-ulmi and Ophiostoma ulmi) that cause Dutch elm disease infecta tree the same way that oak wilt fungus infects oak trees – through the bodies of elm barkbeetles and through grafted roots. Elm bark beetles breed in dead or dying elms and theirlarvae feed exclusively on elm tissue. If the tree dies because of Dutch elm disease, everybeetle that hatches from that tree carries the fungus. Adult beetles, which prefer to feed onhealthy elm trees, pass the fungus to healthy elms. Once infected, the fungi live in the xylemof the trees, which die in several months to several years (Stack et al., 2002). Dutch elmdisease occurs within most counties in the Lower Peninsula, including the five counties in thestudy area.
Road Development
Ecological Effects
For the purposes of this report, roads include all primary roads such as federal and statehighways and secondary roads, such as county and private roads. Some consider off-roadvehicle trails as a type of road in that they cause ecological effects similar to pavedroadways, but the team addresses these trails independently of roads.
The primary ecological damage caused by roads is the fragmentation of the landscape anddisruption of ecological processes. By fragmenting natural areas, roads restrict themovement of species that are unwilling to cross open areas and create disturbed areas thatencourages invasion by non-native and colonial species. Furthermore, automobiles travellingthe roads serve as direct sources of mortality to many animals (Noss, 1987).
Roads also provide access that tends to increase activities such as logging, mining, housingdevelopment, and recreation. These activities often lead to additional fragmentation ofnatural areas as land is cleared for housing, mining development, recreational trails, or

Chapter 6: Threats and Their Sources 140
logging. They can also lead to increased pollution in the form of air and noise pollution fromvehicle traffic, as well as water pollution from road salts and automobile fluids.
Study Area Specifics
Two major state highways, M-72 and M-66, are found in the study area. Primary countyroads include C-42, C-38, C-597, C-612, and C-571. At present no new major roads areslated for construction. However, a passing relief lane program will take effect in the area by2003, effectively widening roads. This program will add symmetrical passing relief lanes onstretches of M-72 where one passing lane already exists. This extension will occur on thesegment of M-72 that runs from M-66 on the western side of Kalkaska County to the easternKalkaska County line (Michigan Department of Transportation, 2002). This roaddevelopment will likely increase tourism traffic and vacation home development in areasserved by M-72.
Overall, development and extension of major highways is not a major source of threat in thestudy area. Instead, with an increase in residential development in the area, secondary roadconstruction is the dominant type of road development. For example, in Blue LakeTownship in Kalkaska County, a trend of splitting large parcels into smaller lots creates theneed for more roads to access additional lots (Riley, 2002). Depending on townshipregulations, road construction may occur after houses are built or may be a requiredprecursor to home construction.
Off-Road Vehicle Use
Ecological Effects
The Michigan Department of Natural Resources defines off-road vehicles (ORVs) as “anymotor vehicle that can be operated cross-country without benefit of a road or trail over land,snow and other natural terrain” (MDNR, Michigan’s off-road vehicle guide, 2000).Examples of ORVs include four-wheelers, dirt bikes, and other all-terrain vehicles.
In 1979, the White House Council on Environmental Quality released a powerful statementon the impacts of ORV use: “Off-road vehicles have damaged every kind of ecosystemfound in the United States. In some cases the wounds will heal naturally; in others they willnot, at least not for millennia” (National Off-Road Vehicle Coalition, 2000). Impacts ofORV use include soil erosion; disruption of wildlife mating and foraging patterns; spread ofinvasive species; and noise, water and air pollution. Many ORVs have two-stroke engines,which produce far more emissions than standard automobiles (Watzman, 2001).Fragmentation is also a concern -- ORVs create and use narrower trails than roads designedfor automobile use, but these trails can still effectively perforate natural areas. Whilesnowmobiles impact natural areas, they impact them less severely than ORVs that operate onbare ground.

Chapter 6: Threats and Their Sources 141
To limit the negative impacts of ORVs, federal and state agencies attempt to regulate ORVuse on public lands. For example, the agencies promulgate various regulations and requirelicensing and registration of ORVs. However, efforts to control ORV use have achievedlimited success for two reasons. First, the very design of ORVs permits and encourages theiruse both on and off established trails. Second, monitoring and enforcement is a daunting taskfor officials that patrol thousands of acres of land with multiple access points. Regulationsmay help curb negative ecological effects, but it is extremely difficult to control ORV useentirely.
Study Area Specifics
ORV use is popular enough in the study area to warrant its classification as a significantthreat. The Michigan DNR provides thousands of kilometers of trails for ORV use in thestudy area, and residents use ORVs on public and private lands year-round (Hopkin, 2002).
It is expected that ORVs impact private and public lands equally. On private lands, ORVusers are not subject to regulations. On state lands, various rules limit the ecological impactof ORVs in theory, but fail to control it in practice. The Michigan DNR requires ORVs tostay on designated trails, forbids their operation in such a way that may create erosion, andprohibits users to drive them in streams, rivers, marshes, or other water features (MichiganDepartment of Natural Resources, 2000). To help enforce the use guidelines, the DNRpatrols the public lands and can fine violators up to $500. Despite these regulations and thepotential of fines, rules are frequently ignored and enforcement is limited.
Fire Suppression
Ecological Effects
Most forest ecosystems around the world have been burned at varying frequencies for manythousands of years. In Michigan, fire has been an important component in determining thecomposition and structure of natural vegetation for nearly 10,000 years (Barnes, 1998). Bothnatural and human-made fires greatly influence ecosystem health. Fires inhibit the growth ofdense shrubs, while leaving relatively fire-resistant canopy trees intact. Limiting thedevelopment of woody vegetation helps maintain a high diversity of grasses and forbs andthe associated habitats for many kinds of animals (Michigan Natural Features Inventory,2002). Fire adapted species rely on fire to reduce competition from less fire-tolerant speciesthat otherwise may dominate the site. For some animal species, less dense underbrush allowsthem to increase hunting, migration, and nesting activity.
In fire-dependent communities, fires promote regeneration and reproduction. Fire initiatessprouting in asexually reproducing species such as fire-dependent angiosperms. For sexuallyreproducing species, fire promotes fertility in pines by opening cones for seed dispersal andencourages wind-blown seed dispersal in other trees. Fire also enhances seedlingestablishment by exposing mineral soil, increasing sun penetration to the forest floor, and

Chapter 6: Threats and Their Sources 142
reducing competition by burning away understory vegetation. In addition, fire limitsoutbreaks of defoliators such as bark beetles and budworms.
Fire increases soil fertility in a number of ways. It improves site fertility temporarily byburning the organic matter on the forest floor, which increases nitrogen levels in the soil.Burning organic matter also increase the soil’s pH, which stimulates an increase in microbialactivity in the soils. The increased microbial activity releases additional nitrogen and otherscarce nutrients into the ecosystem. Nitrogen-fixing legume species and free-living nitrogen-fixing bacteria have a good chance of surviving the fire beneath the surface and, in turn,increase the nitrogen-fixing potential of the area for a longer amount of time (Barnes, 1998).
Given the many ecological benefits that fire provides, fire suppression can threaten thenatural structure and functions of ecosystems. Fire suppression leads to a build-up of fueland a general increase in insect and disease attack as the proportion of mature forestincreases. As late-successional species replace the mosaic of forest species characteristic ofmid-successional stages, wildlife habitat declines and both plant and animal diversitydecreases (Barnes, 1998). For example, animals that depend on fire-adapted trees may losehabitats and food sources as those tree species are replaced by more shade-tolerant specieswhose saplings can survive in the undergrowth.
The growing use of prescribed burns as a tool in silviculture, fire hazard reduction, andecosystem management has caused a reevaluation of the effect of fire on natural areas. Manymangers now realize that fire’s effects on forests are complex and often beneficial (Barnes,1998). Prescribed burning entails setting fires according to a predetermined plan thatdescribes the acceptable weather and fuel conditions in which a fire can be safely set toaccomplish land management objectives. Prairies are one ecosystem commonly maintainedby prescribed burns. Prescribed fire also helps maintain large openings characteristic of oaksavannas. In addition, prescribed burns often aid wetland restoration. Because cattails canout compete other plants over time and fill in open water needed by waterfowl, burningcattails during the winters can help restore these open areas (MDNR, Wildland fire inMichigan, 2002).
Study Area Specifics
Fire suppression in the study area is a particularly great threat to many acres of jack pine,which support the federally endangered Kirkland’s Warbler (Dendroica kirtlandii). Jackpines depend on fire for reproduction because their seed-bearing cones only open underintense heat. Without fire, the Kirkland’s Warbler would lose its critical habitat.
The few remaining lands that continue to support pine barren plant associations in the studyarea are dependent on fire as an essential ecosystem process. Many former pine barren siteswere logged or succeeded to closed-canopy forests as a result of fire suppression. Firesuppression also allowed Kentucky bluegrass, a common exotic grass that thrives in theabsence of fire, to flourish in the pine barrens. Fewer than five high quality pine barren sitesexist in Michigan, totaling only a few hundred acres (Michigan Natural Features Inventory,2002).

Chapter 6: Threats and Their Sources 143
Dams
Ecological Effects
Dams inflict several detrimental effects on riverine ecosystems. First, dams stop thetransport of sediment and woody debris. When water is discharged from or overflows thedam without its normal sediment load, the river scours the downstream channel and picks upmore sediment. This process can increase erosion on both riverbanks as well as the riverbed,which in turn can change the width and the depth of the river. In addition, a decreasedamount of instream woody debris reduces the amount of habitat and food available for fishand other aquatic organisms (Rozich, 1998).
Second, dams can block the passage of fish and other aquatic organisms. Dams blockupstream tributaries that would normally serve as spawning grounds for anadromous fishsuch as salmon and brown trout (Rozich, 1998). Other drifting aquatic organisms such asplankton, micro-invertebrates, or juvenile fish species often require the natural river flow tocarry them to adult feeding and spawning areas downstream. While these problems areusually associated with larger dams, small dams can hinder such migrations as well. It isworth noting that while these blockages harm native fish populations, dams can also benefitthe river system by blocking the passage of non-native aquatic species such as the sealamprey (Petromyzon marinus) from Lake Michigan to upstream tributaries.
Third, dams can change river temperatures by slowing the natural flow regime. Theseundesirable warming or cooling effects create water temperatures unfavorable for native fishspecies. Finally, species associated with floodplain ecosystems depend on periodic floodingthat is often restricted by both large and small dams.
Study Area Specifics
There are currently 63 dams in the Manistee River watershed. The majority of these damsare relatively small. Over half have a head of five feet or less and only five have a headgreater than 20 feet.3 The storage capacity of most of the dams in the Manistee Riverwatershed is also very small. Forty-two dams, or roughly two thirds of the total number ofdams, have impoundments less than 10 acre feet (Rozich, 1998). The two largest dams onthe Manistee River do not occur in the study area. Built in the lower reaches of the river,Hodenpyl Dam stands 68 feet with a 60,700 acre-feet impoundment and Tippy Dam rises 56feet in front of a 3,950 acre feet impoundment (Rozich, 1998).
Nineteen dams are found in the project study area (Table 6.5). These dams have headsranging in height from two to 20 feet. Only four dams have more than five feet of head.Five of the 19 dams support measurable impoundment areas, which range from one to 135acre-feet. While the majority of the dams in the study area are relatively small, they stillthreaten the river’s ecology. Since most of the dams on the Manistee River are shallow, theirmain degrading effects on water quality and the aquatic ecosystems are warming of the water 3 The head of a dam is the difference between the upstream and downstream water level at the dam site

Chapter 6: Threats and Their Sources 144
column and conversion of nutrients from particulate to dissolved form (Rozich, 1998). Theseeffects can harm aquatic species and hinder nutrient cycling in the Manistee River ecosystem.
Table 6.5: Dams within the study areaCounty Dam River Head (ft)
Crawford Lake Margrethe Portage Creek 3
Kalkaska Lutz Dam Trib. Maple CreekGray Dam Waterhole Creek 2Goulait Dam Little Silver Creek 20Simmons Dam Trib. Manistee River 8Gould Dam Springfed trib. to Gould Creek 2Vantol Dam Bourne Creek 3Williams Dam Trib. Manistee River 3Condon Dam Trib. Manistee RiverAsh Dam Fife Lake Outlet 2Skinner Dam Inlet CreekGoose Creek Imp. Dam Goose CreekCotton Dam Collar Creek 2
Missaukee Cannon Creek Dam #1 Big Cannon CreekCannon Creek Dam #2 Big Cannon Creek 4Horseshoe Lake Dam Big Cannon Creek 11Missaukee Walleye RearingPond Dam
Trib. Morrisy Creek 5
Hamm Creek Dam Trib. Hamm Creek 3Jenkins Dam Trib. Morrisy Creek 11
Source: Adapted from Manistee River Assessment (Rozich, 1998) * Blank boxes denote that information was not available.