chapter 6 probability. introduction we usually start a study asking questions about the population....
TRANSCRIPT

Chapter 6Chapter 6
ProbabilityProbability

IntroductionIntroduction
We usually start a study asking questions We usually start a study asking questions about the population.about the population.
But we conduct the research using a But we conduct the research using a sample.sample.
The role of inferential statistics is to use The role of inferential statistics is to use the sample data as the basis for the sample data as the basis for answering questions about the population.answering questions about the population.

Introduction (cont.)Introduction (cont.)
To accomplish this goal, inferential To accomplish this goal, inferential procedures are typically built around the procedures are typically built around the concept of probability.concept of probability.
Specifically, the relationships between Specifically, the relationships between samples and populations are usually samples and populations are usually defined in terms of probability.defined in terms of probability.

By knowing the makeup of a population, By knowing the makeup of a population, we can determine the probability of we can determine the probability of obtaining specific samples.obtaining specific samples.
This way, probability gives us a connection This way, probability gives us a connection between populations and samples.between populations and samples.

This way, probability gives us a connection This way, probability gives us a connection between populations and samples which between populations and samples which will be the foundation for inferential will be the foundation for inferential statistics (later chapters)statistics (later chapters)
The marble samples began with a The marble samples began with a population and ended with a sample population and ended with a sample obtained. obtained.

The goal of inferential statistics begins The goal of inferential statistics begins with a sample that answers general with a sample that answers general questions about the population.questions about the population.
Two steps to reach the goal:Two steps to reach the goal:– Develop probability as a bridge from Develop probability as a bridge from
population to samplespopulation to samples– Then, reverse the probability rules to allo the Then, reverse the probability rules to allo the
samples to move to populations.samples to move to populations.

Figure 6.1Figure 6.1
The role of probability in inferential statisticsThe role of probability in inferential statistics
Cop
yrig
ht ©
200
2 W
adsw
orth
Gro
up. W
adsw
orth
is a
n im
prin
t of t
he
Wad
swor
th G
roup
, a d
ivis
ion
of T
hom
son
Lear
ning
The role of probability in inferential statistics. Probability is used to predict what kind of samples are likely to be obtained from a population. Thus, probability establishes a connection between samples and populations. Inferential statistics rely on this connection when they use sample data as the basis for making conclusions about populations.

Probability DefinitionProbability Definition
In a situation where several different In a situation where several different outcomes are possible, we define the outcomes are possible, we define the probability for any particular outcome as a probability for any particular outcome as a fraction or proportionfraction or proportion. If the possible . If the possible outcomes are identified as A, B, C, D, and outcomes are identified as A, B, C, D, and so on, thenso on, thenProbability of A = number of outcomes classified as AProbability of A = number of outcomes classified as A
Total number of possible outcomesTotal number of possible outcomes

ExampleExample
A deck of cards – there are 52 cards. A deck of cards – there are 52 cards.
The probability of choosing the king of The probability of choosing the king of hearts is p = 1/52hearts is p = 1/52
The probability of choosing an ace is p = The probability of choosing an ace is p = 4/52 = 1/13 = .07694/52 = 1/13 = .0769
Use a notation systemUse a notation system– p(hearts)p(hearts)– p(aces)p(aces)

Note:Note:
Probability is defined as a proportion.Probability is defined as a proportion.
Can restate any probability problem as a Can restate any probability problem as a proportion problem.proportion problem.– What is the probability of obtaining a king What is the probability of obtaining a king
from a deck of cards? 4/52from a deck of cards? 4/52– Out of the whole deck, what proportion are Out of the whole deck, what proportion are
kings? 4/52kings? 4/52
There is a reason to understand this now.There is a reason to understand this now.

Example:Example:
p(tails) = ½ = .50 = 50%p(tails) = ½ = .50 = 50%
Any of the three forms are acceptable.Any of the three forms are acceptable.
Question:Question:– If you had a jar of all white marbles, what is If you had a jar of all white marbles, what is
the possibility of choosing a black marble?the possibility of choosing a black marble?– What is the probability of choosing a white What is the probability of choosing a white
marble?marble?

Random SamplingRandom Sampling
For the definition of probability to be For the definition of probability to be accurate, the outcomes must be obtained accurate, the outcomes must be obtained through random sampling:through random sampling:
Random sampling must satisfy two Random sampling must satisfy two requirements:requirements:– Each individual in the population must have Each individual in the population must have
an equal chance of being selectedan equal chance of being selectedAssures no bias in the selection processAssures no bias in the selection process

Requirements for Random Sample (cont.)Requirements for Random Sample (cont.)
– If more than one individual is to be selected If more than one individual is to be selected for the sample, there must be constant for the sample, there must be constant probability for each and every selectionprobability for each and every selection
p(jack of diamonds) = 1/52 for the first drawp(jack of diamonds) = 1/52 for the first draw
p(jack of diamonds) = 1/51 for the second drawp(jack of diamonds) = 1/51 for the second draw
p(jack of diamonds) = 0 if the jack of diamonds p(jack of diamonds) = 0 if the jack of diamonds was the first drawwas the first draw
This contradicts the first requirement that This contradicts the first requirement that states the probability must stay constant.states the probability must stay constant.

Sampling with replacementSampling with replacement
To keep the probabilities from changing To keep the probabilities from changing from one selection to the next, it is from one selection to the next, it is necessary to replace each sample before necessary to replace each sample before you make the next selectionyou make the next selection– Sampling with replacementSampling with replacement

Types of random samplingTypes of random sampling
Simple random sampleSimple random sample
Independent random sampleIndependent random sample
Sampling with replacementSampling with replacement
Sampling without replacementSampling without replacement
There are different sampling techniques There are different sampling techniques used by researchersused by researchers

Probability and Frequency DistributionProbability and Frequency Distribution
In education, we are usually concerned In education, we are usually concerned with probability that will involve a with probability that will involve a population of scores that can be displayed population of scores that can be displayed in a frequency distribution graph.in a frequency distribution graph.
If the graph represents the entire If the graph represents the entire population, then a portion of the graph population, then a portion of the graph represents a different portion of the represents a different portion of the population.population.

Probability and Frequency Distribution (cont.)Probability and Frequency Distribution (cont.)
Because probability and proportion are Because probability and proportion are equivalent, a particular proportion of the equivalent, a particular proportion of the graph corresponds to a particular graph corresponds to a particular probability in the population.probability in the population.
Thus, whenever a population is presented Thus, whenever a population is presented in a frequency distribution graph, it will be in a frequency distribution graph, it will be possible to represent probabilities as possible to represent probabilities as proportions of the graph.proportions of the graph.

Example:Example:
N = 10 scores N = 10 scores
1, 1, 2, 3, 3, 4, 4, 4, 5, 61, 1, 2, 3, 3, 4, 4, 4, 5, 6
If you take a random sample of n=1 score If you take a random sample of n=1 score from this population, what is the probability from this population, what is the probability of obtaining a score greater than 4?of obtaining a score greater than 4?
p(X > 4) = ?p(X > 4) = ?

p(X > 4) = ?p(X > 4) = ?Using this criteria, there are 2 scores that meet this Using this criteria, there are 2 scores that meet this criterion out of the total group of N=10 scores, so criterion out of the total group of N=10 scores, so p = 2/10p = 2/10We are now defining probability as the proportion of area We are now defining probability as the proportion of area in the frequency distribution graphs.in the frequency distribution graphs.– very graphic and concrete way of representing probabilityvery graphic and concrete way of representing probability

What is the probability of selecting a score What is the probability of selecting a score less than 5?less than 5?
p(X < 5) = ?p(X < 5) = ?
What part of the graph is unshaded?What part of the graph is unshaded?
p = 8/10p = 8/10

Figure 6.3Figure 6.3
The normal distributionThe normal distribution
Cop
yrig
ht ©
200
2 W
adsw
orth
Gro
up. W
adsw
orth
is a
n im
prin
t of t
he
Wad
swor
th G
roup
, a d
ivis
ion
of T
hom
son
Lear
ning

Probability and the Normal DistributionProbability and the Normal Distribution
Note that the normal distribution is Note that the normal distribution is symmetricalsymmetrical
Highest frequency in the middleHighest frequency in the middle
Frequencies tapering off as you move Frequencies tapering off as you move towards the extremestowards the extremes
Normal shape can also be described by Normal shape can also be described by the proportions of area contained in each the proportions of area contained in each section of the distributionsection of the distribution

Probability and the Normal Distribution (cont.)Probability and the Normal Distribution (cont.)
Statisticians often identify sections of a Statisticians often identify sections of a normal distribution by using z-scoresnormal distribution by using z-scores
Remember that z-scores measure Remember that z-scores measure positions in a distribution in terms of positions in a distribution in terms of standard deviations from the meanstandard deviations from the mean
The graph shows the percentage of scores The graph shows the percentage of scores that fall in each of these sectionsthat fall in each of these sections
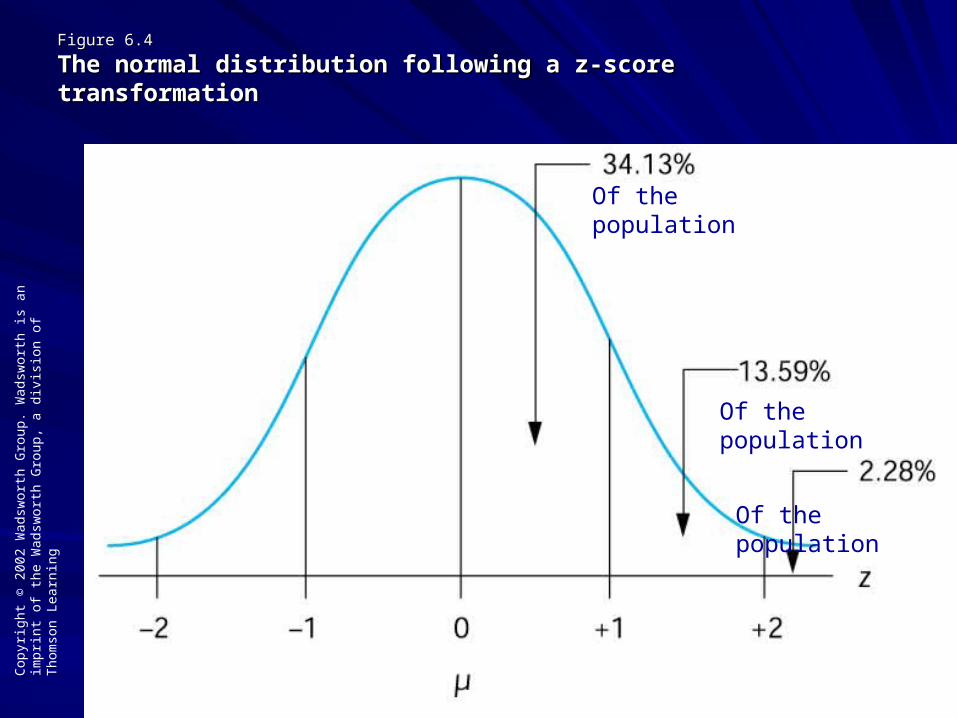
Figure 6.4Figure 6.4
The normal distribution following a z-score transformationThe normal distribution following a z-score transformation
Cop
yrig
ht ©
200
2 W
adsw
orth
Gro
up. W
adsw
orth
is a
n im
prin
t of t
he
Wad
swor
th G
roup
, a d
ivis
ion
of T
hom
son
Lear
ning
Of the population
Of the population
Of the population

In this way it is possible to define a normal In this way it is possible to define a normal distribution in terms of its proportionsdistribution in terms of its proportions
That is, a distribution is normal if and only That is, a distribution is normal if and only if it has all the right proportionsif it has all the right proportions

Note: Because the normal distribution is Note: Because the normal distribution is symmetrical the sections on the left side of symmetrical the sections on the left side of the distribution have exactly the same the distribution have exactly the same proportions as the corresponding sections proportions as the corresponding sections on the right sideon the right side

Note: Because the locations in the Note: Because the locations in the distribution are identified by z-scores, the distribution are identified by z-scores, the proportions shown in the figure apply to proportions shown in the figure apply to any normal distribution regardless of the any normal distribution regardless of the values for the mean and the standard values for the mean and the standard deviationdeviationWhen any distribution is transformed into When any distribution is transformed into z-scores, the mean becomes zero and the z-scores, the mean becomes zero and the standard deviation becomes onestandard deviation becomes one

The process of answering probability The process of answering probability questions about a normal distributionquestions about a normal distribution
Example 6.2Example 6.2– Adult heights form a normal distribution with a Adult heights form a normal distribution with a
mean of 68 inches and a standard deviation mean of 68 inches and a standard deviation of 6 inches.of 6 inches.
– Given this information about the population Given this information about the population and the known proportions for a normal and the known proportions for a normal distributiondistribution
– We can determine the probability associated We can determine the probability associated with specific exampleswith specific examples

Figure 6.4Figure 6.4
The normal distribution following a z-score transformationThe normal distribution following a z-score transformation
Cop
yrig
ht ©
200
2 W
adsw
orth
Gro
up. W
adsw
orth
is a
n im
prin
t of t
he
Wad
swor
th G
roup
, a d
ivis
ion
of T
hom
son
Lear
ning
Of the population
Of the population
Of the population

For example…For example…
What is the probability of randomly What is the probability of randomly selecting an individual from this selecting an individual from this population who is taller than 6 feet 8 population who is taller than 6 feet 8 inches (X=80 inches)inches (X=80 inches)
P(X > 80)P(X > 80)

1.1. The probability question is translated into The probability question is translated into a proportion question: Out of all possible a proportion question: Out of all possible adult heights, what proportion is greater adult heights, what proportion is greater than 80?than 80?
2.2. We know that “all possible adult heights” We know that “all possible adult heights” is simply the population distribution.is simply the population distribution.

The = 68, so the score X = 80 it to the right of the mean.
Because we are interested in all heights greater than 80, we shade in the area to the right of the 80.
This area represents the proportion we are trying to determine.

Identify the exact position of X=80 by computing a z-score. For this example,
z = X -–
6 6
A height of 80 is 2 s.d. above the mean and corresponds to a z-score of +2.00.

The proportion we are trying to determine The proportion we are trying to determine may now be expressed in terms of a z-may now be expressed in terms of a z-scorescore
p(X > 80) = ?p(X > 80) = ?
p(z > 2.00) = ?p(z > 2.00) = ?
p(X > 80) = p(z > 2.00) = 2.28%p(X > 80) = p(z > 2.00) = 2.28%

Figure 6.4Figure 6.4
The normal distribution following a z-score transformationThe normal distribution following a z-score transformation
Cop
yrig
ht ©
200
2 W
adsw
orth
Gro
up. W
adsw
orth
is a
n im
prin
t of t
he
Wad
swor
th G
roup
, a d
ivis
ion
of T
hom
son
Lear
ning
Of the population
All normal distributions will have 2.28% of the scores in the tail beyond z = +2.00

Unit Normal TableUnit Normal Table
The graph of the normal distribution shows The graph of the normal distribution shows proportions for only a few selected z-score proportions for only a few selected z-score values.values.A more complete listing of z-scores and A more complete listing of z-scores and proportions is provided in the unit normal proportions is provided in the unit normal table.table.This table lists proportions of the normal This table lists proportions of the normal distribution for a full range of possible z-distribution for a full range of possible z-score values.score values.

Figure 6.6Figure 6.6
A portion of the unit normal tableA portion of the unit normal table
Cop
yrig
ht ©
200
2 W
adsw
orth
Gro
up. W
adsw
orth
is a
n im
prin
t of t
he
Wad
swor
th G
roup
, a d
ivis
ion
of T
hom
son
Lear
ning
z= 0.25
59.87%
40.13%

Column A lists z-score values Column A lists z-score values corresponding to different locations in a corresponding to different locations in a normal distributionnormal distributionColumn B and C: identify the proportion of Column B and C: identify the proportion of the distribution in each of the two sectionsthe distribution in each of the two sectionsColumn B: presents the proportion in the Column B: presents the proportion in the body (the larger portion)body (the larger portion)Column C: presents the proportion in the Column C: presents the proportion in the tailtail

When you use the unit table…When you use the unit table…
Keep in mind…Keep in mind…– The The bodybody corresponds to the corresponds to the largerlarger part part
(either right-hand or left-hand)(either right-hand or left-hand)– The The tailtail corresponds to the corresponds to the smallersmaller part of part of
the distributionthe distribution– The proportions on the right-hand side are The proportions on the right-hand side are
exactly the same as the corresponding exactly the same as the corresponding proportions on the left-hand sideproportions on the left-hand side

When you use the unit table…When you use the unit table…
Proportions will always be positive (even if Proportions will always be positive (even if z-score is negativez-score is negative
For any specific z-score value, the two For any specific z-score value, the two proportions will always add up to 1.00 (the proportions will always add up to 1.00 (the whole distribution)whole distribution)

Let’s review…Let’s review…The unit normal table lists relationships between The unit normal table lists relationships between z-scores locations and proportions in a normal z-scores locations and proportions in a normal distributiondistributionFor any z-score location, you can use the table For any z-score location, you can use the table to look up the corresponding proportionsto look up the corresponding proportionsIf you know the proportions, you can use the If you know the proportions, you can use the table to look up the specific z-score locationtable to look up the specific z-score locationBecause we have defined probability as Because we have defined probability as equivalent to proportion, you can also use the equivalent to proportion, you can also use the unit normal table to look up probabilities for unit normal table to look up probabilities for normal distributionsnormal distributions

Example 6.3AExample 6.3A
What proportion of the normal distribution corresponds to z-score values greater than z = 1.00?
Shade the area you are trying to determine.
Look up z=1.00 in Column A
Read Column C for the proportion which is 0.1587 or 15.87%
15.87%

Example 6.3BExample 6.3B
For a normal distribution, what is the probability of selecting a z-score less than z = 1.50?
93.32%

Example 6.3CExample 6.3C
What is the proportion of the normal distribution that corresponds to the tail beyond z = - 0.50?
30.85%

If you have the proportion, can you find the If you have the proportion, can you find the z-score?z-score?
For a normal distribution, what z=score separates the top 10% from the remainder of the distribution?
10% = .1000 Locate .1000 on the table – Column C or90% = .9000 Locate .9000 on the table – Column B
Choose the closest number that you can. For this case, it would be 0.1003 in Column C.
Z= +1.28 (Make sure to designate + or -).

Example 6.4BExample 6.4B
For a normal distribution, what z-score value forms the boundary between the top 60% and the bottom 40% of the scores?
Column B - 0.6000 z = - 0.25Column C - 0.4000
Body
Tail

Probabilities, Proportions, and Probabilities, Proportions, and Scores (X values)Scores (X values)
In most situations, it will be necessary to In most situations, it will be necessary to find probabilities for specific X valuesfind probabilities for specific X values
– Transform the X value into z-scoresTransform the X value into z-scores
– Use the unit normal table to look up the Use the unit normal table to look up the proportions corresponding to the z-score proportions corresponding to the z-score valuesvalues

ExampleExample
It is known that IQ scores form a normal It is known that IQ scores form a normal distribution with distribution with 100 and 100 and 15.15.
What is the probability of randomly What is the probability of randomly selecting an individual with an IQ score selecting an individual with an IQ score greater than 130?greater than 130?

Example 6.5Example 6.5
P (X > 130) = ?
We want to find the proportion of the IQ distribution that corresponds to scores greater than 130.
Change the X values into z-scores
p (X > 130) = ?

X = 130X = 130
z = X – z = X – –– 15 1515 15
Look up the z-score value in the unit Look up the z-score value in the unit normal tablenormal table
p (X>130) = 0.0228 = 2.28%p (X>130) = 0.0228 = 2.28%

Finding proportions/probabilities Finding proportions/probabilities located between two scoreslocated between two scores
This example demonstrates the process of This example demonstrates the process of finding the probability of selecting a score finding the probability of selecting a score that is located between two specific that is located between two specific values.values.
We are now looking for a proportion We are now looking for a proportion defined by a slice from the middle of the defined by a slice from the middle of the normal distribution.normal distribution.

Finding proportions/probabilities Finding proportions/probabilities located between two scoreslocated between two scores
The final answer does not correspond to The final answer does not correspond to either the body or the tail of the either the body or the tail of the distribution, which means that you cannot distribution, which means that you cannot read the answer directly from the table.read the answer directly from the table.
Instead, you must use the information in Instead, you must use the information in the table to calculate the final answer.the table to calculate the final answer.

Example 6.6Example 6.6
The distribution of SAT scores in normal The distribution of SAT scores in normal with with 500 and 500 and 100.100.
What is the probability of randomly What is the probability of randomly selecting an individual with a score selecting an individual with a score between X = 600 and X = 700?between X = 600 and X = 700?
In other words…In other words…
Find p (600 < X < 700) = ?Find p (600 < X < 700) = ?

Figure 6.10Figure 6.10
The distribution for Example 6.6The distribution for Example 6.6
Cop
yrig
ht ©
200
2 W
adsw
orth
Gro
up. W
adsw
orth
is a
n im
prin
t of t
he
Wad
swor
th G
roup
, a d
ivis
ion
of T
hom
son
Lear
ning

Transform each X value into a z-scoreTransform each X value into a z-score
For X = 600For X = 600 z = X – z = X – = 600 – 500 = 100 = 1.00 = 600 – 500 = 100 = 1.00
100 100100 100
For X = 700For X = 700z = X – z = X – = 700 – 500 = 200 = 2.00 = 700 – 500 = 200 = 2.00
100 100100 100

Now find the proportion of the normal Now find the proportion of the normal distribution that is located between z = distribution that is located between z = +1.00 and z = +2.00+1.00 and z = +2.00
We can approach the problem one of two We can approach the problem one of two ways…ways…

Approach 1Approach 1
This method focuses on the proportions in This method focuses on the proportions in the tail of the distribution.the tail of the distribution.
Use Column C to find the proportion in the Use Column C to find the proportion in the tail beyond z = +1.00tail beyond z = +1.00 0.15870.1587
This includes the shaded portion that we This includes the shaded portion that we are trying to find, but it also includes an are trying to find, but it also includes an extra portion in the tail beyond z = +2.00extra portion in the tail beyond z = +2.00

Use the table again to find the extra Use the table again to find the extra portion beyond z=+2.00portion beyond z=+2.00 z = +2.00 = 0.0228z = +2.00 = 0.0228
Now subtract the twoNow subtract the twop(600 < X < 700) =p(600 < X < 700) = 0.1587 – 0.0228 =0.1587 – 0.0228 = 0.1359 =0.1359 = 13.59%13.59%

Approach 2Approach 2
Find how much of the distribution is Find how much of the distribution is located located outsideoutside the section we want to the section we want to measure.measure.
We want the unshaded areas of the We want the unshaded areas of the distributiondistribution
z = 2.00 = 0.0228z = 2.00 = 0.0228
z = 1.00 = 0.8413z = 1.00 = 0.8413

The total area (that we do not want) isThe total area (that we do not want) is 0.0228 + 0.8413 = 0.0228 + 0.8413 = .8641.8641
Subtract from 1.000 (because the whole Subtract from 1.000 (because the whole distribution is 1.000)distribution is 1.000)
1.0000 - .8641 = 1.0000 - .8641 = .1359 =.1359 = 13.59%13.59%

Finding scores corresponding to specific Finding scores corresponding to specific proportions or probabilitiesproportions or probabilities
In the previous examples, the problem In the previous examples, the problem was to find the proportion or probability was to find the proportion or probability corresponding to specific X values.corresponding to specific X values.
The two-step process is illustrated in the The two-step process is illustrated in the following example:following example:

Figure 6.11Figure 6.11
A map for probability problemsA map for probability problems
Cop
yrig
ht ©
200
2 W
adsw
orth
Gro
up. W
adsw
orth
is a
n im
prin
t of t
he
Wad
swor
th G
roup
, a d
ivis
ion
of T
hom
son
Lear
ning
We have only described how to go clockwise in this process.
Start here
We can go backwards to find a corresponding score for a certain proportion.

Example 6.7Example 6.7
Scores on the SAT form a normal Scores on the SAT form a normal distribution with distribution with 500 and 500 and 100.100.
What is the minimum score necessary to What is the minimum score necessary to be in the top 15% of the SAT distribution?be in the top 15% of the SAT distribution?

Begin with 15% = .1500 We are looking for a score.

Figure 6.11Figure 6.11
A map for probability problemsA map for probability problems
Cop
yrig
ht ©
200
2 W
adsw
orth
Gro
up. W
adsw
orth
is a
n im
prin
t of t
he
Wad
swor
th G
roup
, a d
ivis
ion
of T
hom
son
Lear
ning
We have only described how to go clockwise in this process.
Start here
We can go backwards to find a corresponding score for a certain proportion.

We can go from proportion to X by going We can go from proportion to X by going via z=scores.via z=scores.
1.1. Use the unit normal table to find the z-Use the unit normal table to find the z-score that corresponds to a proportion of score that corresponds to a proportion of 0.150.15
2.2. Look at the graphicLook at the graphic

We will need to use Column C because the shaded area is the tail.
The closest value in the table is 0.1492, and the z-score that corresponds to this proportion is z = 1.04.

Next: Determine whether the z-score is Next: Determine whether the z-score is positive or negative.positive or negative.
In this case z = + 1.04In this case z = + 1.04
Now to change the z-score into an X valueNow to change the z-score into an X value– Use the z-score equation:Use the z-score equation: X = X = zz