chapter 5a engendering inclusive and resilient asean · 5a engendering inclusive and resilient...
TRANSCRIPT
Chapter 5A
Engendering Inclusive and Resilient ASEAN
January 2014
This chapter should be cited as
Intal, Jr. P., Y. Fukunaga, F. Kimura, P. Han, P. Dee, D. Narjoko (2014), ‘Engendering
Inclusive and Resilient ASEAN’, in ASEAN Rising: ASEAN and AEC Beyond 2015,
Jakarta: ERIA, pp.213-259.
213
Chapter 5A
Engendering Inclusive and Resilient ASEAN
Introduction Equitable economic development and narrowing development gaps have been
part and parcel of ASEAN lexicon in moving the region towards an integrated
economic community. ASEAN Leaders have always been cognisant of the
need for equitable development or inclusive growth in order for the benefits of
regional integration to be fully realised and shared by virtually all the people
in the region. Indeed, Pillar 3 of the AEC Blueprint, Towards a Region of
Equitable Economic Development, clearly shows the high importance ASEAN
Leaders put on equitable development or inclusive growth. ASEAN Leaders
have also increasingly emphasised the importance of resiliency of ASEAN to
both economic and non-economic shocks.
Chapter 1 of this Integrative Report shows that the case for inclusive growth in
ASEAN remains compelling for the region post 2015. There is still a huge
number of poor and marginally non-poor in most of ASEAN: in the late 2000s,
about two-quarters of ASEAN population lived below $ 2 PPP per day per
capita, and of which about 100 million lived below the poverty line of $1.25
PPP per day per capita. The poor and the marginally non-poor tend to be more
vulnerable to significant price hikes and supply shocks of food products, to
natural disasters, and even to energy shortages. In addition, AMSs have mixed
records on income inequality, even if the record of ASEAN is decidedly better
than China and major Latin American countries with respect to income
inequality. Thus, engendering an inclusive and resilient ASEAN remains a
major challenge for ASEAN moving forward beyond 2015.
Pillar 3 of the AEC Blueprint 2009-2015 focuses on two major measures,
namely, SME development and the Initiative for ASEAN Integration (IAI).
This chapter on engendering inclusive and resilient ASEAN expands the focus.
In addition to SME development, the chapter discusses geographic
inclusiveness and the importance of connectivity to geographic inclusiveness,
214
a special emphasis on Myanmar as a major means to narrow development gap
in the region, the importance of agriculture to inclusive and robust growth as
well as to food security, and disaster management and safety net issues as part
of enhancing social inclusiveness and resiliency in the region. The next
chapter, Chapter 5B, focuses on energy for a resilient and green ASEAN.
SME Development in ASEAN1
Significance of, and importance of supportive policy environment for, SMEs
in ASEAN.
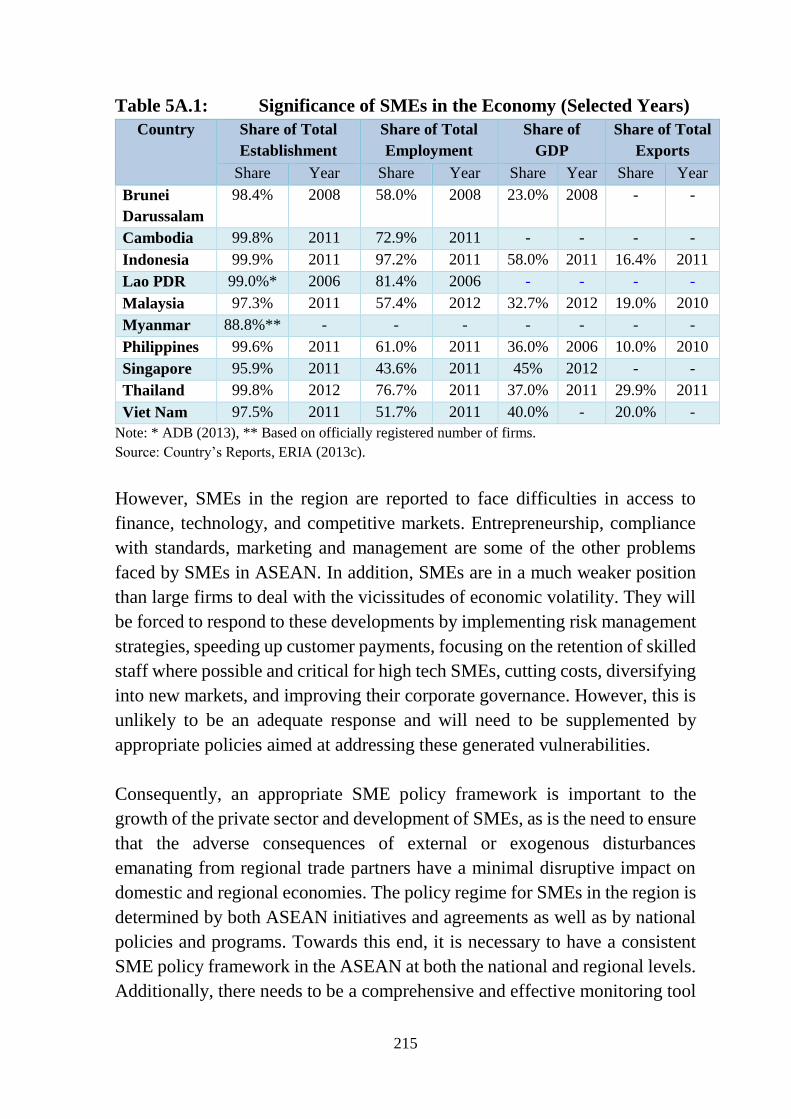
Small and medium enterprises (SMEs) play an important role in ASEAN
economic integration since between 95-99 percent of firms in the ASEAN
Member States (AMSs) are SMEs. Together, they create between 43-97
percent of employment, contribute between 23-58 percent to the GDP, and 10-
30 percent in total exports of AMSs (see Table 5A.1).
Table 5A.1 provides an indication of why development of SMEs would
directly contribute towards achieving the implementation of the third pillar of
the AEC Blueprint: they account for much of employment in AMSs, and
employment creation is a key means of eradicating poverty. At the same time,
because most firms are in fact SMEs, the dynamism of the economy is also
dependent on the growth and dynamism of SMEs. That is, because the region’s
business players are preponderantly SMEs (including micro enterprises), the
pursuit of SME development is in fact not just for equitable development in
the region under the Third Pillar of the AEC Blueprint. The competitiveness
and robustness of the region’s economies depend to a large extent on the
competitiveness and robustness of the region’s small and medium enterprises.
1 This section is largely contributed by Oum, ERIA.
215
Table 5A.1: Significance of SMEs in the Economy (Selected Years)
Country Share of Total
Establishment
Share of Total
Employment
Share of
GDP
Share of Total
Exports
Share Year Share Year Share Year Share Year
Brunei
Darussalam
98.4% 2008 58.0% 2008 23.0% 2008 - -
Cambodia 99.8% 2011 72.9% 2011 - - - -
Indonesia 99.9% 2011 97.2% 2011 58.0% 2011 16.4% 2011
Lao PDR 99.0%* 2006 81.4% 2006 - - - -
Malaysia 97.3% 2011 57.4% 2012 32.7% 2012 19.0% 2010
Myanmar 88.8%** - - - - - - -
Philippines 99.6% 2011 61.0% 2011 36.0% 2006 10.0% 2010
Singapore 95.9% 2011 43.6% 2011 45% 2012 - -
Thailand 99.8% 2012 76.7% 2011 37.0% 2011 29.9% 2011
Viet Nam 97.5% 2011 51.7% 2011 40.0% - 20.0% -
Note: * ADB (2013), ** Based on officially registered number of firms.
Source: Country’s Reports, ERIA (2013c).
However, SMEs in the region are reported to face difficulties in access to
finance, technology, and competitive markets. Entrepreneurship, compliance
with standards, marketing and management are some of the other problems
faced by SMEs in ASEAN. In addition, SMEs are in a much weaker position
than large firms to deal with the vicissitudes of economic volatility. They will
be forced to respond to these developments by implementing risk management
strategies, speeding up customer payments, focusing on the retention of skilled
staff where possible and critical for high tech SMEs, cutting costs, diversifying
into new markets, and improving their corporate governance. However, this is
unlikely to be an adequate response and will need to be supplemented by
appropriate policies aimed at addressing these generated vulnerabilities.
Consequently, an appropriate SME policy framework is important to the
growth of the private sector and development of SMEs, as is the need to ensure
that the adverse consequences of external or exogenous disturbances
emanating from regional trade partners have a minimal disruptive impact on
domestic and regional economies. The policy regime for SMEs in the region is
determined by both ASEAN initiatives and agreements as well as by national
policies and programs. Towards this end, it is necessary to have a consistent
SME policy framework in the ASEAN at both the national and regional levels.
Additionally, there needs to be a comprehensive and effective monitoring tool
216
on whether the policies, programs and institutions are supportive of the
development of SMEs in the region.
Strengthening of ASEAN SMEs requires improvement of human resources,
provision of access to finance, technology and innovation, market
internationalisation through policy support, measures, supplementary activities
and appropriate communication. Providing access to finance for start-up SMEs
is important in strengthening SME development in ASEAN.
ASEAN SME Initiatives and the ASEAN SME Policy Index. The AEC has
focused on SME development through the ASEAN Policy Blueprint for SME
Development (APBSD) 2004-2014 and the Strategic Action Plan for ASEAN
SME Development (SAPASD) 2010-2015. The APBSD laid out strategic
programs and policy measures that focus on five main priorities: (i) Human
resource development and capacity building; (ii) Enhancing SME marketing
capabilities; (iii) Access to financing; (iv) Access to technology; and (v)
Creation of a conducive policy environment. Concrete and detailed policy
measures, implementation time frame, and indicative outputs have been
identified.
The APBSD was later replaced by the ASEAN Strategic Action Plan for SME
Development (2010 – 2015) which outlines the framework for SME
development as a key measure for equitable economic development in the
ASEAN region. The Strategic Plan laid out policy measures to address: (i)
Access to finance; (ii) Facilitation; (iii) Technology development; (iv)
Promotion; and (v) Human resource development.
The APBSD and the Strategic Plan focus primarily on regional initiatives, with
less emphasis given to consistent national SME policies. The development,
however, of SMEs in the region is affected by both national and regional policy
regimes and program initiatives. In addition, there seems to be no systematic
mechanism to track the progress and effective implementation of the APBSD
and the Strategic Plan. The results of the review of the APBSD implementation
for the Mid-Term Review of the AEC Blueprint Implementation shows modest
success at best based on the perception of key stakeholders on SME
development in each AMS.
217
In order to contribute to the strengthening of policy and institutional
environment for SMEs in ASEAN, the ASEAN SME Working Group and the
Economic Research Institute for ASEAN and East Asia (ERIA) have been
developing an SME Policy Index, inspired by the OECD SME Policy Index.
The OECD SME Policy Index has been successfully used in the Western
Balkans and Turkey as a monitoring tool as well as a tool for facilitating policy
dialogue, program coordination and the promotion of good practices in the
region.2
The ASEAN SME Policy Index would improve on the APBSD and the
Strategic Plan by incorporating dimensions and initiatives at both regional and
national levels. Drawing from the OECD SME Policy Index and insights from
the studies done at APEC, the ASEAN SME Policy Index will have more
policy dimensions than what are indicated in the APBSD and the Strategic Plan
to attain the goals of ASEAN SME Development.
The ASEAN SME Policy Index can be expected to have useful functions to
the ASEAN SME Working Group and the ASEAN member states, similar to
the functions of the OECD SME Policy Index (OECD, 2009), which include:
1. an analytical and dynamic tool to review SME policy developments on
a number of policy dimension and across countries;
2. a process by which a group of countries sharing common policy goals
agree on developing a joint framework for monitoring and comparing
SME policy developments; and
3. a framework to exchange experiences, good practices and foster policy
dialogue.
In order for SMEs to become more competitive, innovative, and dynamic, the
ASEAN SME Policy Index is designed to improve the business environment
that must be relevant to SMEs in any of the five stages of their life cycles (pre-
start up, start-up, growth, maturity, and revival). The Policy Index is a
comprehensive and effective monitoring tool. It also facilitates policy
2 The OECD SME Policy Index has also been adapted and replicated in North Africa and the Middle East
region, the Eastern Partnership countries of the EU (Armenia, Azerbaijan, Belarus, Georgia, Moldova
and Ukraine) and country-specific assessments in Egypt, Morocco and Moldova.
218
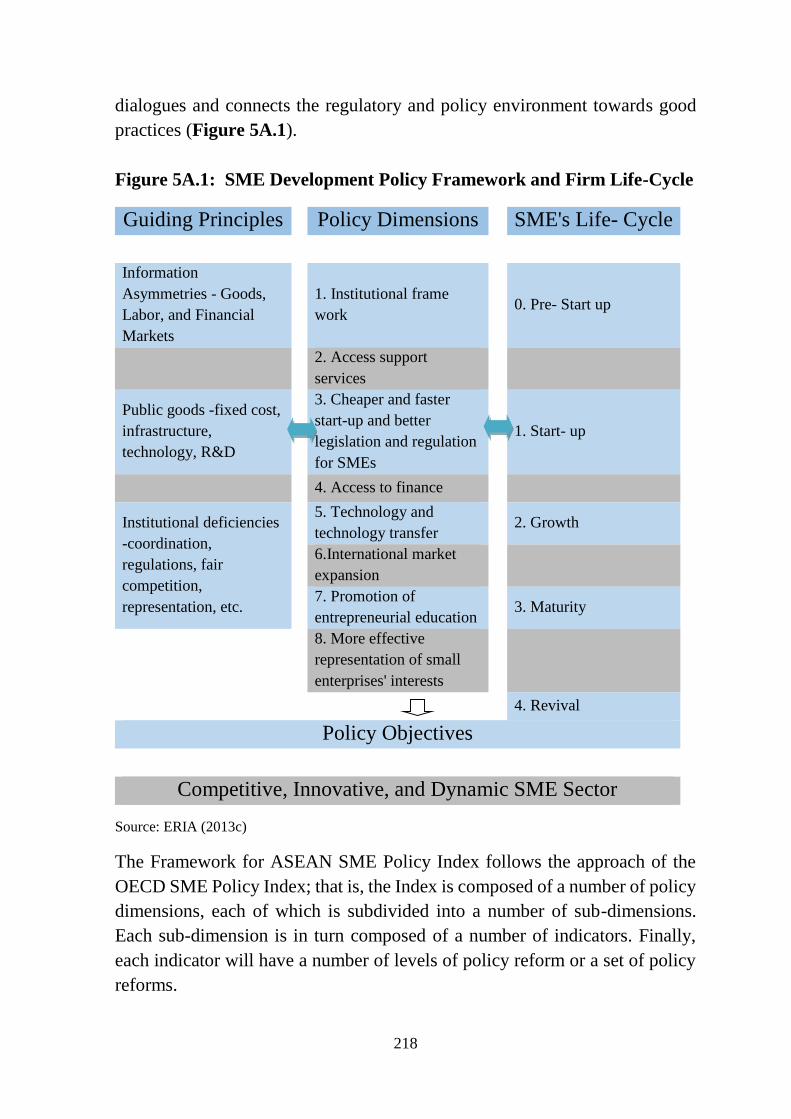
dialogues and connects the regulatory and policy environment towards good
practices (Figure 5A.1).
Figure 5A.1: SME Development Policy Framework and Firm Life-Cycle
Guiding Principles Policy Dimensions SME's Life- Cycle
Information
Asymmetries - Goods,
Labor, and Financial
Markets
1. Institutional frame
work 0. Pre- Start up
2. Access support
services
Public goods -fixed cost,
infrastructure,
technology, R&D
3. Cheaper and faster
start-up and better
legislation and regulation
for SMEs
1. Start- up
4. Access to finance
Institutional deficiencies
-coordination,
regulations, fair
competition,
representation, etc.
5. Technology and
technology transfer 2. Growth
6.International market
expansion
7. Promotion of
entrepreneurial education 3. Maturity
8. More effective
representation of small
enterprises' interests
4. Revival
Policy Objectives
Competitive, Innovative, and Dynamic SME Sector
Source: ERIA (2013c)
The Framework for ASEAN SME Policy Index follows the approach of the
OECD SME Policy Index; that is, the Index is composed of a number of policy
dimensions, each of which is subdivided into a number of sub-dimensions.
Each sub-dimension is in turn composed of a number of indicators. Finally,
each indicator will have a number of levels of policy reform or a set of policy
reforms.
219
The following is a list of eight policy dimensions of the ASEAN Policy Index
based on the ASEAN SME Blueprint, the Strategic Plan, and the OECD:
1. Institutional framework;
2. Access to support services;
3. Cheaper and faster start-up and better legislation and regulation for
SMEs;
4. Access to finance;
5. Technology and technology transfer;
6. International market expansion;
7. Promotion of entrepreneurial education; and
8. More effective representation of SMEs’ interests.
The ASEAN SME Policy Index is different from the OECD SME Policy Index
in its policy dimensions, sub-dimensions, indicators, and levels of policy
reform because its design needs to reflect more specific circumstances of the
ASEAN region.
Each of the policy dimensions is further divided into sub-dimensions in each
specific area. Furthermore, the sub-dimensions are broken down into
indicators. Finally, the indicators are structured around six levels of policy
reform, starting from 1 for no specific policy measure or institution (poor) to
6 for a well-functioning institution or effective implementation of each policy
measure (best practice). For example, in order for business registration as one
of the indicators in the policy sub-dimension 3 for cheaper and faster start-up
to qualify as best practice, level 6, the registration process must take less than
5 working days, require only one administrative step, and cost less than US$50.
The assessment of the ASEAN SME Policy Index was conducted by an
independent research team from each AMS through a questionnaire survey and
in-depth interviews. The assessment, in the process, draws inputs from
government agencies, private sector and other SME stakeholders. The results
of the assessment from each country are put together for consultations with

220
government agencies and are compared and discussed at the workshop for
refinement. The results are then internally reviewed by the panel of experts
from the OECD and ERIA to ensure their consistency between countries and
across the region.
The process to come up with the SME Policy Index therefore is participatory
in its nature. At the same time, it offers a fair evaluation of policy
implementation through independent and peer-review process.
The method measuring policy implementation by means of the indicators
offers flexibility for a country to choose policies that suit well with the
country’s situation. This flexibility also means that the SME Policy Index is
adaptable to different policy processes and institutional settings, given a wide
difference in development and political settings of the AMSs.
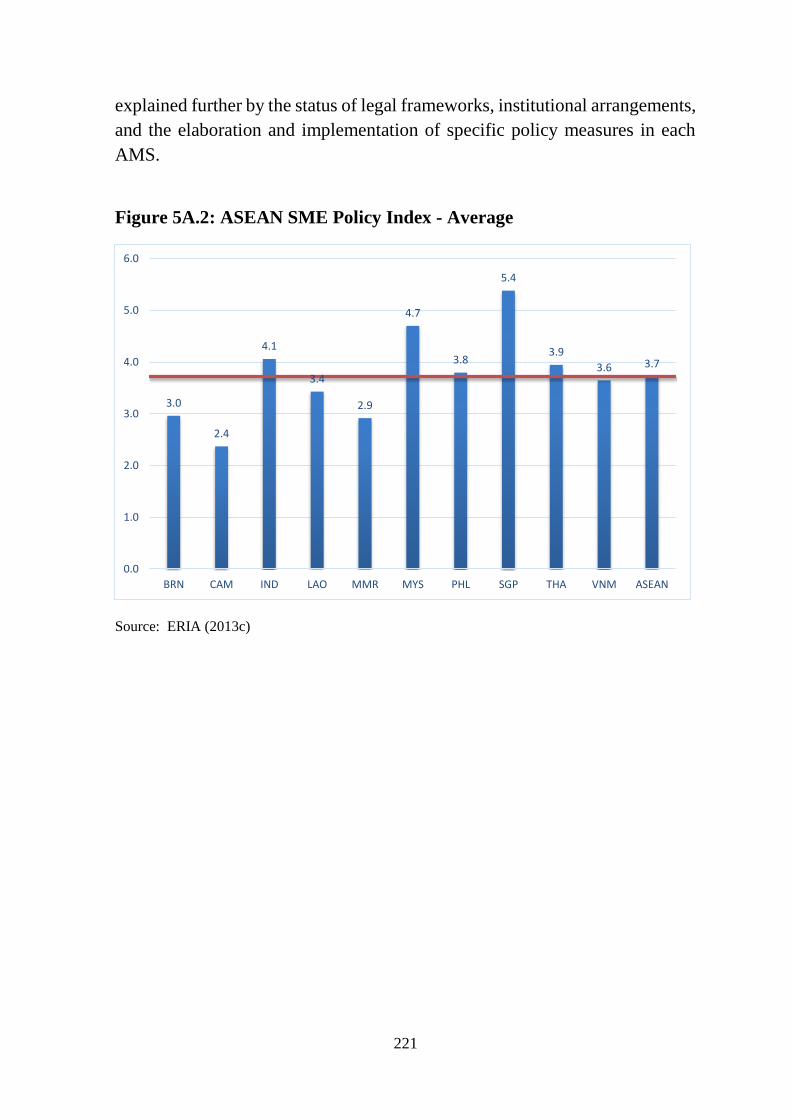
General Findings from the ASEAN SME Policy Index. The results from the
Policy Index suggest an uneven level of performances in the implementation
of SME development policy at the national level between the two traditional
groups of the AMSs, namely, the less developed members (Cambodia, Lao
PDR, Myanmar, and Viet Nam or the CLMV countries) and the more advanced
members which include Brunei Darussalam, Indonesia, Malaysia, the
Philippines, Thailand, and Singapore or the ASEAN-6, with the exception of
Brunei Darussalam which has a relatively lower score compared with Viet
Nam and Lao PDR (see Figure 5A.2).
On average, Singapore, Malaysia, Indonesia, Thailand, and the Philippines
have aggregate index scores above the ASEAN average, followed by Viet
Nam, Lao PDR, Brunei Darussalam, Myanmar, and Cambodia whose
aggregate index scores are below the ASEAN average.
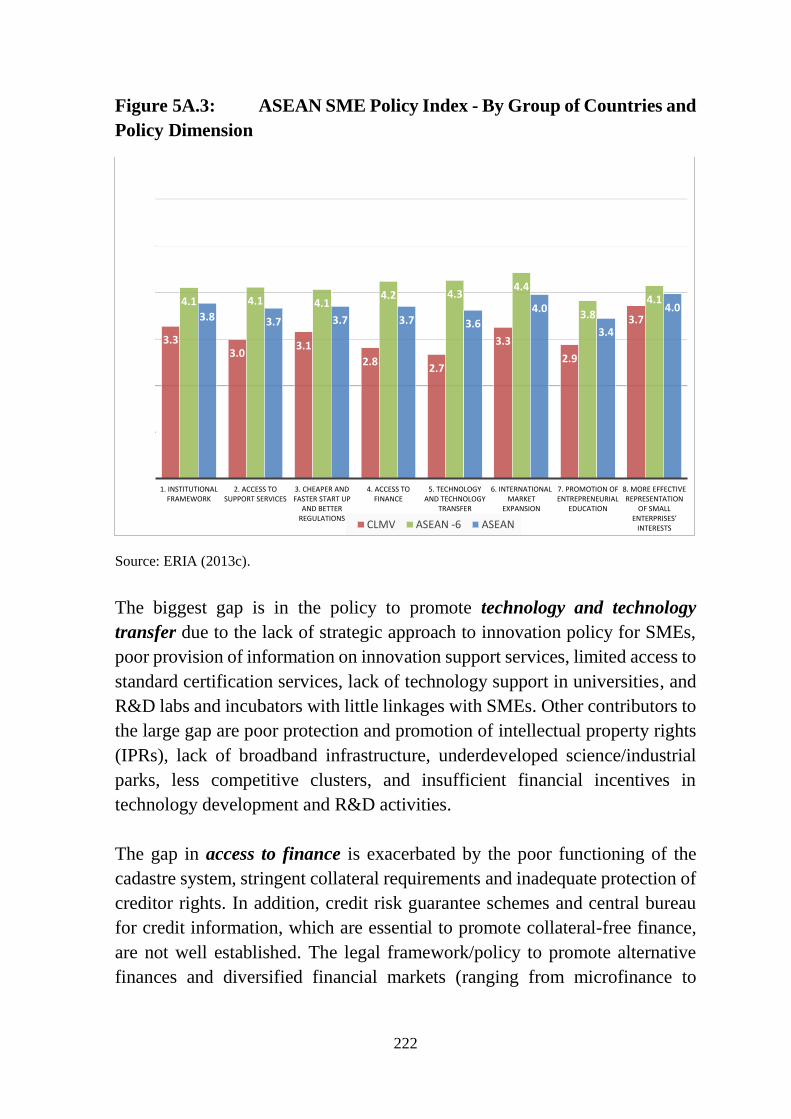
Across the eight policy dimensions, there are big gaps between the ASEAN
average, ASEAN-6 and the CLMV countries. The most significant gaps and
low regional standing are found in five policy dimensions. They are: (5)
Technology and technology transfer, (4) Access to finance, (7) Promotion of
entrepreneurial education, (3) Cheaper, faster start-up and better regulations,
and (2) Access to support services (see Figure 5A.3). Underlying the gaps of
performances between AMSs in these key policy dimensions would be
221
explained further by the status of legal frameworks, institutional arrangements,
and the elaboration and implementation of specific policy measures in each
AMS.
Figure 5A.2: ASEAN SME Policy Index - Average
Source: ERIA (2013c)
3.0
2.4
4.1
3.4
2.9
4.7
3.8
5.4
3.9
3.6 3.7
0.0
1.0
2.0
3.0
4.0
5.0
6.0
BRN CAM IND LAO MMR MYS PHL SGP THA VNM ASEAN
222
Figure 5A.3: ASEAN SME Policy Index - By Group of Countries and
Policy Dimension
Source: ERIA (2013c).
The biggest gap is in the policy to promote technology and technology
transfer due to the lack of strategic approach to innovation policy for SMEs,
poor provision of information on innovation support services, limited access to
standard certification services, lack of technology support in universities, and
R&D labs and incubators with little linkages with SMEs. Other contributors to
the large gap are poor protection and promotion of intellectual property rights
(IPRs), lack of broadband infrastructure, underdeveloped science/industrial
parks, less competitive clusters, and insufficient financial incentives in
technology development and R&D activities.
The gap in access to finance is exacerbated by the poor functioning of the
cadastre system, stringent collateral requirements and inadequate protection of
creditor rights. In addition, credit risk guarantee schemes and central bureau
for credit information, which are essential to promote collateral-free finance,
are not well established. The legal framework/policy to promote alternative
finances and diversified financial markets (ranging from microfinance to
3.33.0
3.1
2.82.7
3.3
2.9
3.7
4.1 4.1 4.14.2 4.3
4.4
3.8
4.1
3.8 3.7 3.7 3.7 3.6
4.0
3.4
4.0
1. INSTITUTIONAL FRAMEWORK
2. ACCESS TO SUPPORT SERVICES
3. CHEAPER AND FASTER START UP
AND BETTER REGULATIONS
4. ACCESS TO FINANCE
5. TECHNOLOGY AND TECHNOLOGY
TRANSFER
6. INTERNATIONAL MARKET
EXPANSION
7. PROMOTION OF ENTREPRENEURIAL
EDUCATION
8. MORE EFFECTIVE REPRESENTATION
OF SMALL ENTERPRISES’
INTERESTSCLMV ASEAN -6 ASEAN
223
leasing to factoring to venture capitals, equity funds, business angels, to stock
markets) is inadequate or lacking in a number of AMSs.
Access to support services to SMEs is severely hampered in the CLMV
countries by the lack of action plan for the provision of support services, poor
services of business development centres (BDS), lack of legal framework,
underutilisation of E-commerce and E-government services, and unreliable on-
line portal for SMEs.
There are also variations between AMSs in making cheaper, easy start-up, and
better legislation and regulations for SMEs. Procedures for business
registration and overall process for SMEs to entry into operation are, in
general, simpler, faster, and cheaper in more advanced AMSs than in the
CLMV countries. Most of the ASEAN-6 can provide online registration, one-
stop-shop services, and varieties of financial support for start-ups.
The capability to provide facilitating support for international market
expansion is relatively wide between the two groups of AMSs. It is because
export promotion programs, provision of advice and high quality information
are better structured in the ASEAN-6. They have also developed and run export
capacity building programs nationwide in a well-coordinated manner. More
financial facilities such as trade credits, grants, and insurance schemes are in
place in the ASEAN-6 to encourage SMEs to expand their market overseas,
with a faster and cheaper custom clearance.
Promotion of entrepreneurial education exhibits both gaps between AMSs
and lowest standing at the ASEAN level because most AMSs have not clearly
articulated entrepreneurial promotion policy and integrated it into their
national development plans with adequate budget, monitoring and evaluation.
Key competencies of entrepreneurship learning programs are not well
introduced into the general and higher education system. There is also not
much active collaboration with the private sector in curricular development,
research, customised training, coaching, internship, business awards and
scholarships. Non-formal education in entrepreneurship and management of
SMEs is not well promoted.
224
The overall development of institutional framework is progressing relatively
more evenly among AMSs. A common SME definition has been applied in
relevant government agencies in the implementation of the SME development
strategies in most of the ASEAN-6. In addition, AMSs tend to have a multi-
year SME development strategy that is implemented by a single institution
responsible for SME policy formulation and which is the executing agency
with an effective coordinating role. The mechanism for review, monitoring,
and evaluation of the strategy is clearly in place. Programs and measures are
put in place to facilitate the movement of SMEs from the informal to the formal
sector.
The gap in promoting an effective representation of SMEs’ interest is the
smallest in the region due to the active role of industrial, business or SME
associations in setting up structured consultation mechanism with government
agencies in policy formulation and advocacy process to represent SMEs’ voice
and interests domestically and internationally. However, most SME
associations still lack resources as well as technical and research capacity to
provide high quality services to help member firms gain access to regional and
global production networks.
Way forward engendering supportive policy environment for SMEs. The
results of the ASEAN SME Policy Index show that there is a lot to be done in
order to go towards the best practice in each of the policy areas. At the same
time, it is unrealistic to expect that the gaps can be addressed adequately soon.
It is best to view the Index as a mechanism for a step by step process of
improving the policy and institutional environment, and setting targets and
time line. In addition, the detailed nature of the ASEAN SME Policy Index
allows for a participatory approach to developing the way forward in each
AMS involving important stakeholders. Although the Index implicitly
presumes equal weighting of all the policy areas, it is likely that the areas of
technology, access to finance and easier and faster start-ups would be
especially important. Thus, for example, as the discussion in Chapter 4 of this
Report shows, support by China’s local governments to industrial clusters
(which are likely mainly SMEs) to strengthen their innovation capabilities has
been an important reason for the dynamism and global competitiveness of
many of China’s industrial clusters.
225
At the same time, it is not efficient and effective to just focus on one or two for
high scores; this is because the levels 5 and 6 in a number of the policy areas
would likely need resources and skills and regulatory capability that would be
difficult to obtain and develop soon, especially in the CLM countries. In the
end, a more balanced, gradual but consistently improving approach may be
the appropriate one to engender a supportive policy environment for SMEs,
with the relative prioritisation among the policy areas and indicators to be
dependent on the stakeholders’ assessment and judgment in each AMS.
Moreover, it is best that the exercise of stakeholder participation, specific
targets, time line, and action plans is done in a concerted manner among all
the AMSs in moving forward towards a more supportive policy and
institutional environment for SMEs in the region. In this way, there would be
greater coherence between the national SME policies and the ASEAN regional
initiatives under SAPASD.
Narrowing Development Gaps within ASEAN: IAI and
Myanmar
In addition to SME development, the Initiative for ASEAN Integration (IAI)
is the other major measure under Pillar 3 of the AEC Blueprint. IAI is
essentially a technical and development cooperation program to help the new
and poorer members of ASEAN, i.e., CLMV countries, accelerate their
economic integration and thereby share the expected benefits from ASEAN
integration. The results of the survey of key stakeholders in the CLMV
countries on the effectiveness of the IAI program as part of the Mid-Term
Review of the implementation of the AEC Blueprint indicate that the majority
of the respondents claim that (ERIA, MTR 2012):
The IAI projects contributed moderately or substantially to narrowing
the development gap with ASEAN-6 countries;
The performance of the IAI projects has lived up to expectations;
The IAI projects are relevant to the development needs and priorities of
the CLMV countries, even if they are less relevant to the needs of the
implementing agencies; and
The funds allocated to the IAI program are not sufficient.
226
It must be noted that the CLMV countries have integrated well with the rest of
ASEAN and the world during the past one and a half decades. The CLMV
countries have in fact been more forthcoming in their liberalisation
commitments in services and investment than a number of the ASEAN -6
countries, as the results of the ERIA AEC scorecard projects and the AEC Mid-
Term Review show. Where the CLMV countries lag behind the ASEAN-6
countries has been primarily in the areas of facilitation where financial and
technical resources are needed to implement the needed initiatives. Arguably,
the accelerated opening up of CLMV countries is due to fundamental country
level development strategy decisions and strong desire to integrate more with
ASEAN and the rest of East Asia and the world. Providing them support for
the integration process are the IAI program and the programs of the
international donor community in the individual CLMV countries.
The CLMV region has in fact been the remarkable story of ASEAN during the
past one and a half decades. As Table 1.2 of Chapter 1 of this Report shows,
Cambodia, Viet Nam and Lao PDR (especially during the past half-decade)
have been the star growth performers in ASEAN during the past one and a half
decades.3 Moreover, the drivers of such stellar growth performance are all
related to the accelerated economic integration with the region and the world;
that is, the sharp rise in foreign direct investment and international trade during
the period. Thus, for example, the average share of foreign direct investment
net inflow to GDP during 2006-2011 in Viet Nam, Cambodia and Lao PDR is
substantially higher than the ASEAN average, and very much higher than in
countries like Indonesia and the Philippines. Indeed, only Singapore, the
ASEAN’s perennial dominant FDI destination, has higher FDI share to GDP
than the CLV countries (ASEC, 2013, p. 41).
Similarly, Cambodia and especially Viet Nam have seen dramatic increase in
the share of exports and imports to GDP, an indication of the successful
integration of the two countries (but most especially Viet Nam) into the
regional production networks or (for Cambodia) global value chain mainly in
the garment industry. In either case, it is a strong indication of the countries’
3 Table 1.2 shows very high growth rates for Myanmar during the same period, in fact, the highest
average growth rate among AMSs. However, the quality of national income accounts of Myanmar is
highly suspect, and as such, it is not really clear what the true picture of the economic performance of
Myanmar is. Nonetheless, it is likely that the country experienced very robust growth during much of the
past decade in part because of the expansion in energy exports and the growth of agriculture.
227
greater economic integration with the rest of the world. As shown in Chapter
1 of this Report, the strong economic performance of the CLV countries is
mirrored to a large extent in the marked reduction in poverty rate and
significant rise of the middle class in the countries, most especially Viet Nam.
Indeed, Viet Nam stands tall among the emerging economies because of its
strong economic growth together with relatively equal distribution of income;
in contrast, the high growth in China was accompanied by an apparent marked
deterioration in the distribution of income.
The discussion above shows that ASEAN has seen some narrowing of the
development gap between the ASEAN -6 and the newer CLMV countries, even
if there remains a huge gap between the richest AMS, Singapore, and its
poorest, Myanmar.
Making Myanmar a star growth and development performer in ASEAN4.
Based on Myanmar official statistics, Myanmar is already the growth
performer in ASEAN during the past decade with an average growth rate in
the double digits. However, the official growth performance is generally
viewed to be a serious overestimate because the exchange rate is controlled
with a huge divergence between the official rate and the “black market” rate.
Adjusting for the currency overvaluation, the economy is estimated to have
grown by about 2.3 times during the 2000s instead of 4.2 times. With poor
statistics, it is difficult to determine what the true situation was in Myanmar
until 2010.5 It is likely that the true picture is in between the two extremes
stated above in part because a poor statistical system would likely
underestimate the output of un-marketed output from agriculture and the
informal manufacturing and services sectors which are very large segments of
the economy in poor countries. Nonetheless, even at the overestimated official
GDP per capita, Myanmar’s per capita GDP was only 0.2 percent of
Singapore’s and 8.6 percent of Malaysia’s in 2010.
Thus, one element of narrowing the development gap in ASEAN is to pull up
Myanmar to be the top performer in the growth arena during the next one and
half decades in ASEAN, and thereby reduce the development gap in the region.
4 This subsection draws heavily from Kudo (2013) and Kudo, Kumagai and Umezaki (2013). 5 In view of the seriousness of the data problem, President Thein Sein included accurate and reliable
statistics as one of the pillars of economic policies of the new Myanmar government (Kudo, Kumagai
and Umezaki, 2013).
228
Myanmar has the potential to be the star performer in ASEAN given its
resources, but more importantly, “there is a new dawn in the political and
economic landscape of Myanmar, with the country moving toward political
and civil reforms and economic growth” (Kudo, Kumagai and Umezaki, 2013,
p.1).
In support of the new dawn in Myanmar, the Economic Research Institute for
ASEAN and East Asia (ERIA) worked with the Myanmar Ministry of National
Planning and Economic Development (MNPED) in undertaking the Myanmar
Comprehensive Development Vision (MCDV) to provide a framework and
strategy for medium to long term development planning in the country. The
MCDV project was headed by Dr. Toshihiro Kudo, Japan’s foremost expert on
Myanmar.
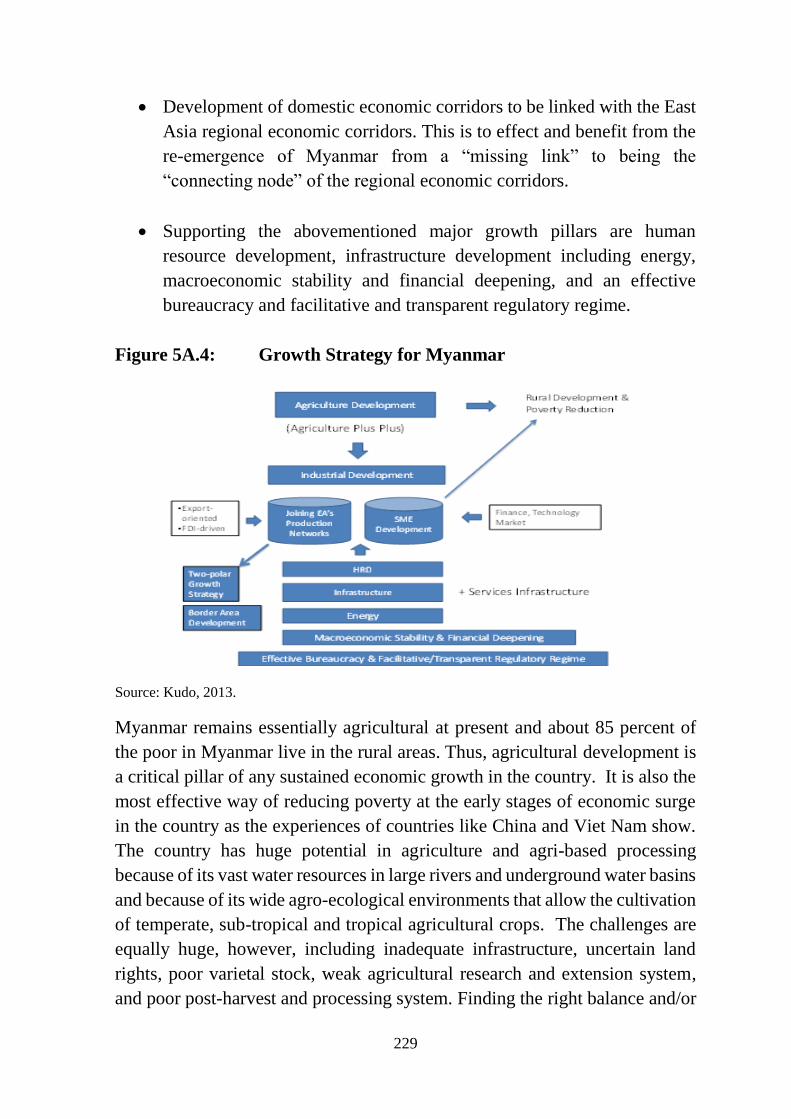
Figure 5A.4 presents the overall framework of the MCDV Growth Strategy. It
is anchored on the following (see Kudo, 2013):
“Agriculture Plus Plus,” which is agriculture development focused on
rising agriculture productivity (one plus) and growing value added
activities in the agriculture-processed manufacturing value chain
(another plus). The agriculture plus plus pillar is supplemented by a rural
development strategy focused on poverty reduction and greater
participation of stakeholders.
“Industry Plus Plus,” which is industrial development that is anchored
on Myanmar joining and embedding itself in East Asia’s production
networks (one plus) and SME development (another plus). Myanmar’s
success in joining and participating in East Asia’s regional production
networks entails FDI-driven, export oriented and private sector led
industrial development.
Two-polar growth strategy plus border area development, to ensure
balanced development. “Myanmar is composed of geographically and
ecologically diversified regions with a number of ethnic groups.
Therefore, growth should be inclusive for all people and balanced
among every region and state” (Kudo, Kumagai and Umezaki, 2013,
p.2).
229
Development of domestic economic corridors to be linked with the East
Asia regional economic corridors. This is to effect and benefit from the
re-emergence of Myanmar from a “missing link” to being the
“connecting node” of the regional economic corridors.
Supporting the abovementioned major growth pillars are human
resource development, infrastructure development including energy,
macroeconomic stability and financial deepening, and an effective
bureaucracy and facilitative and transparent regulatory regime.
Figure 5A.4: Growth Strategy for Myanmar
Source: Kudo, 2013.
Myanmar remains essentially agricultural at present and about 85 percent of
the poor in Myanmar live in the rural areas. Thus, agricultural development is
a critical pillar of any sustained economic growth in the country. It is also the
most effective way of reducing poverty at the early stages of economic surge
in the country as the experiences of countries like China and Viet Nam show.
The country has huge potential in agriculture and agri-based processing
because of its vast water resources in large rivers and underground water basins
and because of its wide agro-ecological environments that allow the cultivation
of temperate, sub-tropical and tropical agricultural crops. The challenges are
equally huge, however, including inadequate infrastructure, uncertain land
rights, poor varietal stock, weak agricultural research and extension system,
and poor post-harvest and processing system. Finding the right balance and/or
230
synergy between empowering small farmers with clearer land tenure and much
improved government support services including good seeds (which may take
a long process) and the possibly quicker growth spurt from encouraging large
plantations with private corporate support (but which is likely less inclusive)
would possibly be another challenge for the country.
Myanmar needs a dynamic manufacturing sector in order to attain growth rates
averaging about 7.5 percent per annum for the next two decades or so in order
to transform Myanmar’s economy dramatically. This requires an FDI-driven
growth; the huge surge in foreign investors’ interest on Myanmar -- in response
to the ongoing reforms and opening up -- not only in resources-based industries
but also in other industries especially manufacturing suggests that such FDI-
driven growth is already emerging for the country. The relatively liberal
investment regime as well as the effective lifting of the sanctions on the country
can be expected to put Myanmar well into the global value chains in such
labour intensive products like garments, and later with much better
connectivity, and bring Myanmar into the regional production networks. For
the latter to happen, however, Myanmar would need to markedly improve its
connectivity and logistics performance. Myanmar’s ranking of 129 in the
World Bank’s logistics performance index in 2012, which is way below Viet
Nam’s 53rd ranking or Indonesia’s 59th ranking and significantly lower than the
rankings of Cambodia and Lao PDR suggests the large challenge for Myanmar
to have a well- functioning logistics system that is needed in order to participate
actively in regional production networks.
Managing a transition from a closed economy to a liberalised economy for the
manufacturing sector has historically been difficult. It is worth noting that
Myanmar does not appear to experience large industrial restructuring
challenges in the face of the marked liberalisation of the Myanmar economy.
This suggests that the hitherto supposed “closed economy” was possibly a
heavily porous one because of porous borders with its neighbours like
Thailand. This bodes well for Myanmar as it moves forward into and beyond
2015. Nonetheless, a proactive role in providing a more supportive
environment for SMEs, as indicated by the significant rise in Myanmar’s
scoring in the ASEAN SME Policy Index, would help induce Myanmar’s
SMEs to adjust better to a more competitive investment and market
environment in the country.
231
The proposed two growth poles are Yangon and Mandalay, the two main
economic centres of Myanmar at present. Note that the capital Nay Pyi Taw is
in between the two centres, so linking the two would ultimately create one big
growth corridor for the country. Simulation results show that a two-polar
growth strategy would result in higher national output than a growth strategy
focused solely on Greater Yangon. Border area development is important for
Myanmar for two reasons: (1) the border areas are populated mainly by ethnic
groups other than the main ethnic group and thus neglecting them would create
a serious socio-political problem; and (2) the border areas are nearest to
robustly growing economies like Thailand and China, with the attendant
economic opportunities that they offer to the border areas of Myanmar.
The MCDV framework does not explicitly consider tourism services. Yet
Myanmar’s cultural and natural assets for tourism are huge, and the country is
a prime tourism destination hotspot in terms of tourism interest. It is best to
embed the tourism element in the growth strategy in the two-polar cum border
area development. This is because it would be Yangon and Mandalay that
would likely be the country’s gateways to the major tourism draws of the
country, including the two cities themselves and places like Bagan.
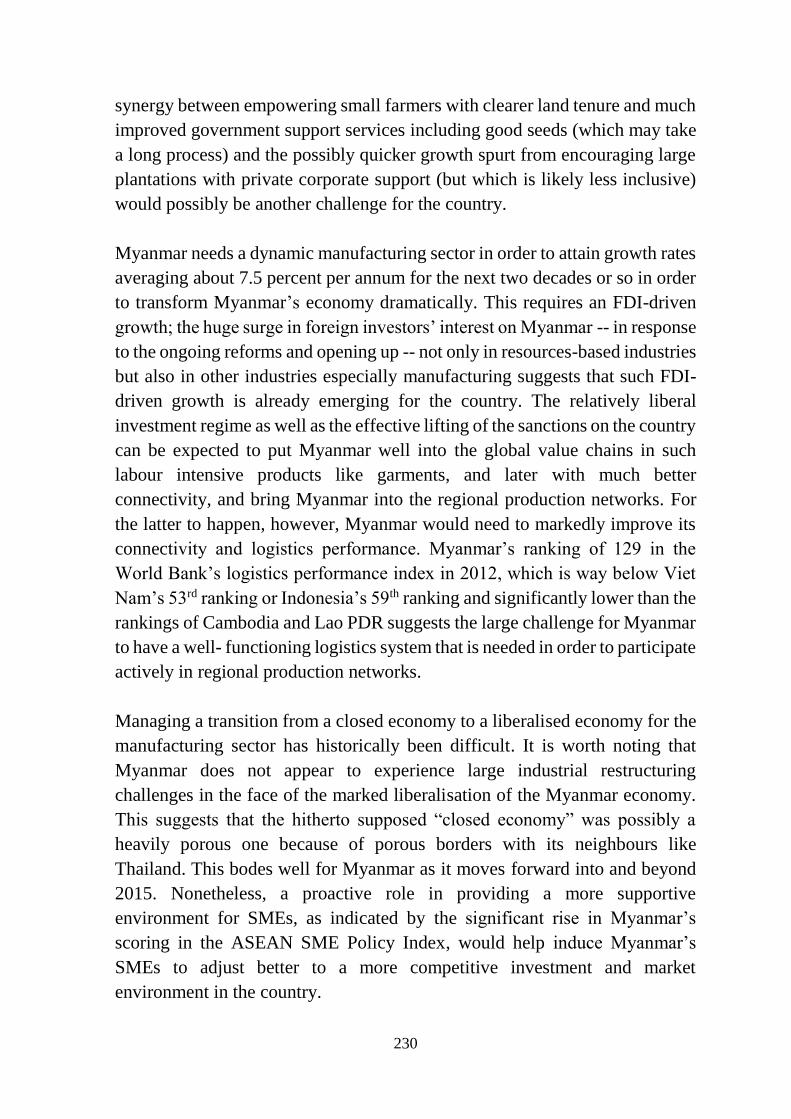
Finally, the remarkable changes and economic opening up that is on-going in
Myanmar have meant the “re-emergence of Myanmar from a missing link to a
connecting node” (Kudo, Sumagai and Umezaki, 2013, p.49) in the expanding
and deepening production networks in East Asia. This is because
geographically, Myanmar strategically connects India, China and the rest of
ASEAN, the three major growth regions in the developing world. The
connecting node function of Myanmar can enable it to participate more actively
in the production networks in the region (see Figure 5A.5).
232
Figure 5A.5: Myanmar as an Emerging Connecting Node
Source: Kimura, et al. (2011) reprinted in Kudo, Kumagai and Umezaki (2013)
Nonetheless, it requires much improved domestic infrastructure, development
of domestic economic corridors, and much reduced logistics and other service
link costs to link up Myanmar cities to the major regional corridors and benefit
well from the connecting node function for the regional economic corridors.
Given that there are binding resource constraints, it is indeed necessary to
undertake some prioritisation of investment projects. As the simulation results
suggest, it is best for Myanmar to prioritise the Yangon and Mandalay growth
poles in the meantime (Kudo, Kumagai and Umezaki, 2013).
In summary, the MCDV presents a cohesive framework for Myanmar to
consider in order for it to become the star growth and development performer
in ASEAN in the next two decades. This will follow up the sterling growth
performances of Cambodia and Lao PDR lately and Viet Nam early on. In the
process, development gaps within the region between the ASEAN -6 and the
CLMV countries can be expected to further narrow in the next two decades.
233
Connectivity, Geographic Inclusiveness and
Infrastructure Investments
Inclusive growth includes a better spatial balance of economic activities within
a country or across countries, that is, geographic inclusiveness. At the same
time, because there are societal benefits from economies of scale and
agglomeration economies, the complete equality across regions in a country is
not optimal. Thus, for example, the simulation results in MCDV for a two-
growth poles growth strategy in Myanmar give higher GDP than many more
growth poles in the country. At the same time, inclusive growth cannot be
achieved without thinking of interdependence between large cities and rural
areas or advanced economy and lagging economy. And it is connectivity
enhancement which is the key word for better balance between higher
economic growth and inclusive development. Connectivity enhancement
involves investment in infrastructure as well as improvement in trade
facilitation and logistics system and services.
An indication of the importance of connectivity is in the working of regional
production networks discussed earlier in Chapter 4. Better connectivity directly
reduces service-link costs in production networks, thereby allowing the
geographic expansion and deepening of the networks. Moreover, better
connectivity induces agglomeration of some industries to bigger cities as well
as dispersion of some labour-intensive industries to rural regions and/or
ASEAN poorer countries (i.e., CLM countries). Narrowing development gaps
between the ASEAN 6 and Viet Nam and the CLM countries includes better
connectivity of the latter countries that would enable them to participate in the
regional production networks.
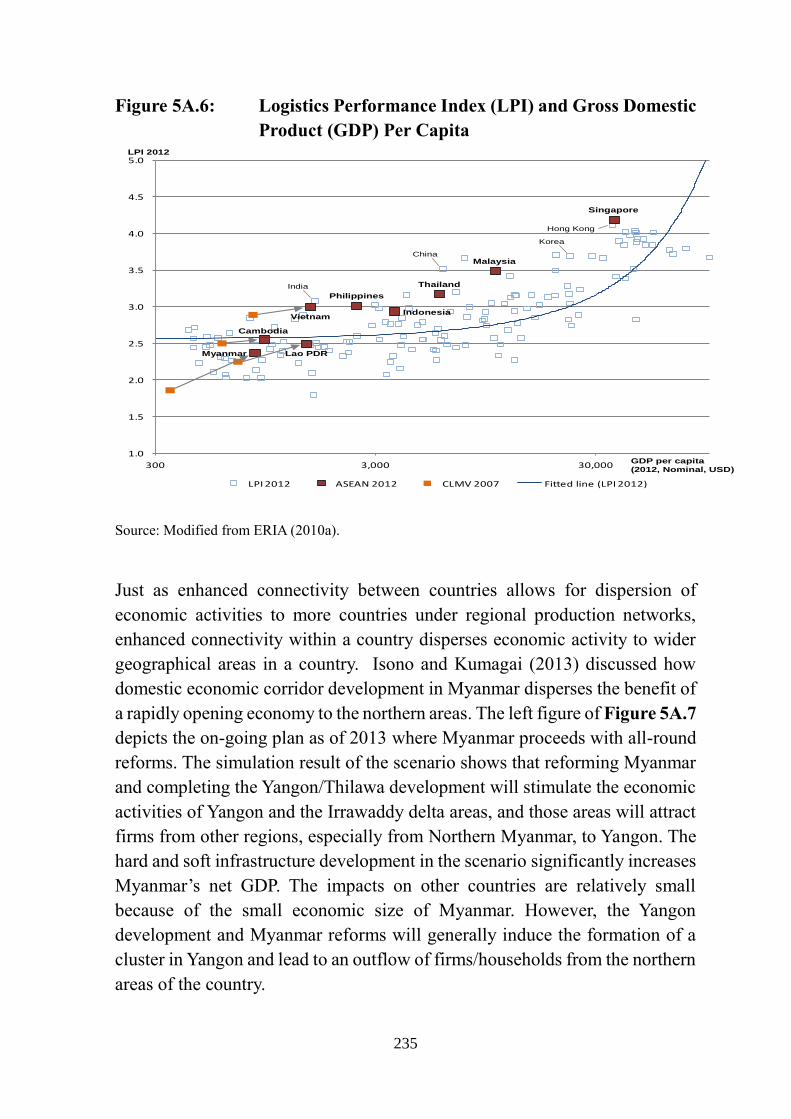
The ASEAN-5 countries and Viet Nam initiated trade and FDI driven
industrialisation from their primary cities. The fact can be supported by Figure
5A.6. The figure plots the correlation between international logistics
performance index (LPI) and gross domestic products (GDP) per capita6. We
find a high correlation between them, which is not very surprising. What is
noteworthy about the figure is that the AMSs more deeply involved in regional
production networks (i.e., Singapore, Malaysia, Thailand, Philippines, Viet
6 We use 2012 LPI data and 2012 GDP data. Data for Brunei are not available.
234
Nam and Indonesia) have LPIs that are significantly higher than what is
expected given their levels of per capita incomes. In contrast, Lao PDR,
Cambodia and Myanmar are on the line or below the line. Considering that LPI
is constructed based on the logistics performance data between primary cities
and primary ports, we observe that ASEAN forerunners and Viet Nam have
much better logistics performance between their primary cities and primary
ports than the international average. In fact, they developed international
standard ports, industrial zones and better access roads between them,
substantially improved customs procedures (and in two AMSs, adopted state-
of-the-art customs systems) and gave better incentives so that the countries
could attract large MNEs, many parts and components suppliers, multinational
logistics forwarders and world-class vessels. We can claim that there is a
challenge of raising logistics performance in the CLM countries for them to
attract production blocks and be firmly part of the regional production
networks.
235
Figure 5A.6: Logistics Performance Index (LPI) and Gross Domestic
Product (GDP) Per Capita
Source: Modified from ERIA (2010a).
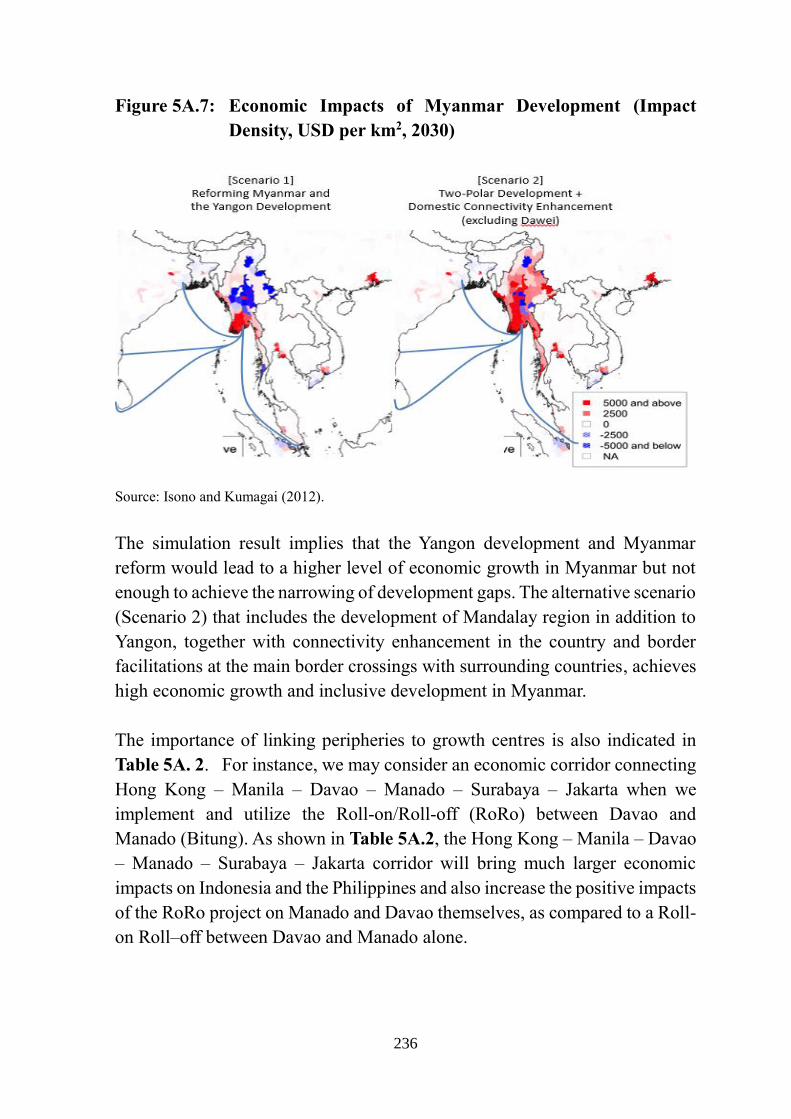
Just as enhanced connectivity between countries allows for dispersion of
economic activities to more countries under regional production networks,
enhanced connectivity within a country disperses economic activity to wider
geographical areas in a country. Isono and Kumagai (2013) discussed how
domestic economic corridor development in Myanmar disperses the benefit of
a rapidly opening economy to the northern areas. The left figure of Figure 5A.7
depicts the on-going plan as of 2013 where Myanmar proceeds with all-round
reforms. The simulation result of the scenario shows that reforming Myanmar
and completing the Yangon/Thilawa development will stimulate the economic
activities of Yangon and the Irrawaddy delta areas, and those areas will attract
firms from other regions, especially from Northern Myanmar, to Yangon. The
hard and soft infrastructure development in the scenario significantly increases
Myanmar’s net GDP. The impacts on other countries are relatively small
because of the small economic size of Myanmar. However, the Yangon
development and Myanmar reforms will generally induce the formation of a
cluster in Yangon and lead to an outflow of firms/households from the northern
areas of the country.
1.0
1.5
2.0
2.5
3.0
3.5
4.0
4.5
5.0
300 3,000 30,000
LPI 2012 ASEAN 2012 CLMV 2007 Fitted line (LPI 2012)
Singapore
Malaysia
Thailand
Indonesia
Philippines
Vietnam
Cambodia
Lao PDR
India
China
Korea
Hong Kong
GDP per capita (2012, Nominal, USD)
Myanmar
LPI 2012
236
Figure 5A.7: Economic Impacts of Myanmar Development (Impact
Density, USD per km2, 2030)
Source: Isono and Kumagai (2012).
The simulation result implies that the Yangon development and Myanmar
reform would lead to a higher level of economic growth in Myanmar but not
enough to achieve the narrowing of development gaps. The alternative scenario
(Scenario 2) that includes the development of Mandalay region in addition to
Yangon, together with connectivity enhancement in the country and border
facilitations at the main border crossings with surrounding countries, achieves
high economic growth and inclusive development in Myanmar.
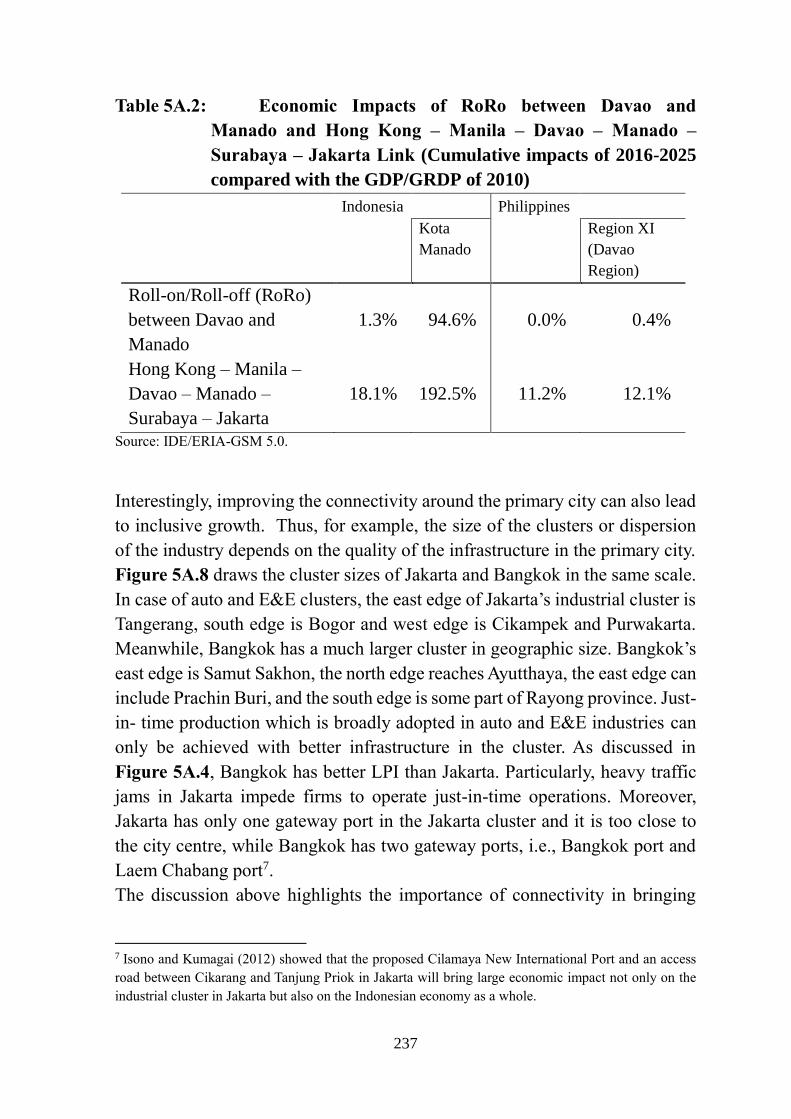
The importance of linking peripheries to growth centres is also indicated in
Table 5A. 2. For instance, we may consider an economic corridor connecting
Hong Kong – Manila – Davao – Manado – Surabaya – Jakarta when we
implement and utilize the Roll-on/Roll-off (RoRo) between Davao and
Manado (Bitung). As shown in Table 5A.2, the Hong Kong – Manila – Davao
– Manado – Surabaya – Jakarta corridor will bring much larger economic
impacts on Indonesia and the Philippines and also increase the positive impacts
of the RoRo project on Manado and Davao themselves, as compared to a Roll-
on Roll–off between Davao and Manado alone.
237
Table 5A.2: Economic Impacts of RoRo between Davao and
Manado and Hong Kong – Manila – Davao – Manado –
Surabaya – Jakarta Link (Cumulative impacts of 2016-2025
compared with the GDP/GRDP of 2010)
Indonesia Philippines
Kota
Manado Region XI
(Davao
Region)
Roll-on/Roll-off (RoRo)
between Davao and
Manado
1.3% 94.6% 0.0% 0.4%
Hong Kong – Manila –
Davao – Manado –
Surabaya – Jakarta
18.1% 192.5% 11.2% 12.1%
Source: IDE/ERIA-GSM 5.0.
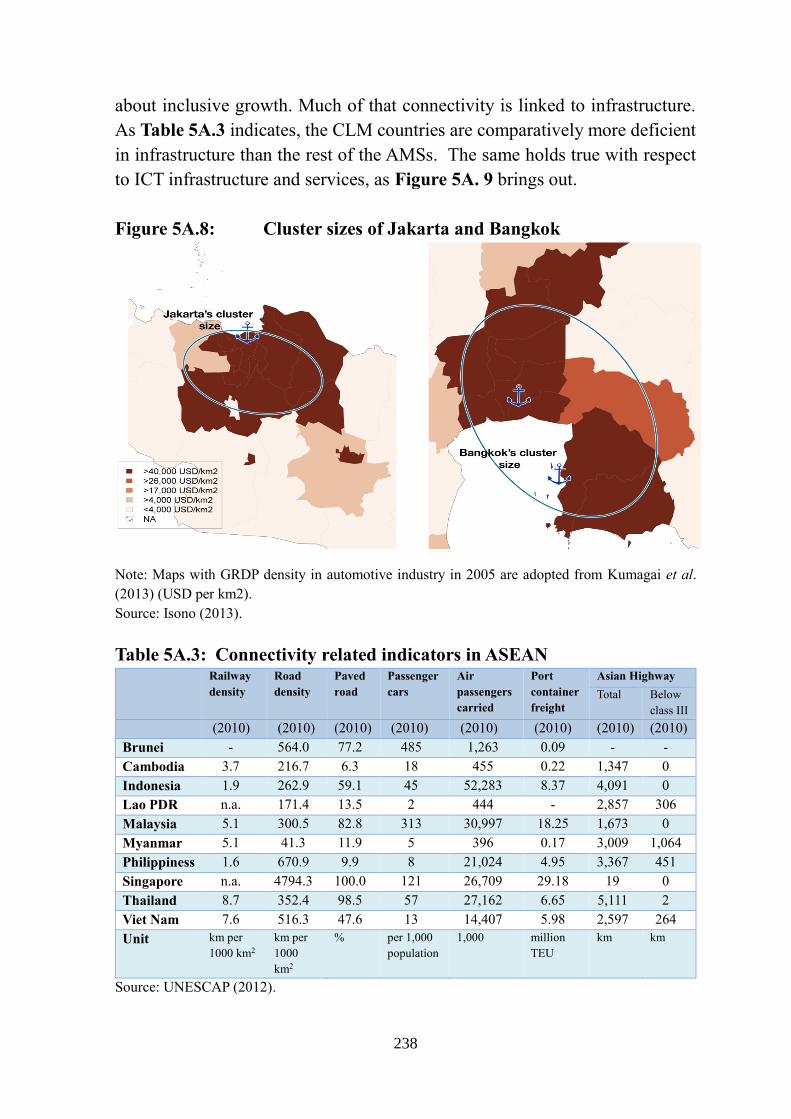
Interestingly, improving the connectivity around the primary city can also lead
to inclusive growth. Thus, for example, the size of the clusters or dispersion
of the industry depends on the quality of the infrastructure in the primary city.
Figure 5A.8 draws the cluster sizes of Jakarta and Bangkok in the same scale.
In case of auto and E&E clusters, the east edge of Jakarta’s industrial cluster is
Tangerang, south edge is Bogor and west edge is Cikampek and Purwakarta.
Meanwhile, Bangkok has a much larger cluster in geographic size. Bangkok’s
east edge is Samut Sakhon, the north edge reaches Ayutthaya, the east edge can
include Prachin Buri, and the south edge is some part of Rayong province. Just-
in- time production which is broadly adopted in auto and E&E industries can
only be achieved with better infrastructure in the cluster. As discussed in
Figure 5A.4, Bangkok has better LPI than Jakarta. Particularly, heavy traffic
jams in Jakarta impede firms to operate just-in-time operations. Moreover,
Jakarta has only one gateway port in the Jakarta cluster and it is too close to
the city centre, while Bangkok has two gateway ports, i.e., Bangkok port and
Laem Chabang port7.
The discussion above highlights the importance of connectivity in bringing
7 Isono and Kumagai (2012) showed that the proposed Cilamaya New International Port and an access
road between Cikarang and Tanjung Priok in Jakarta will bring large economic impact not only on the
industrial cluster in Jakarta but also on the Indonesian economy as a whole.
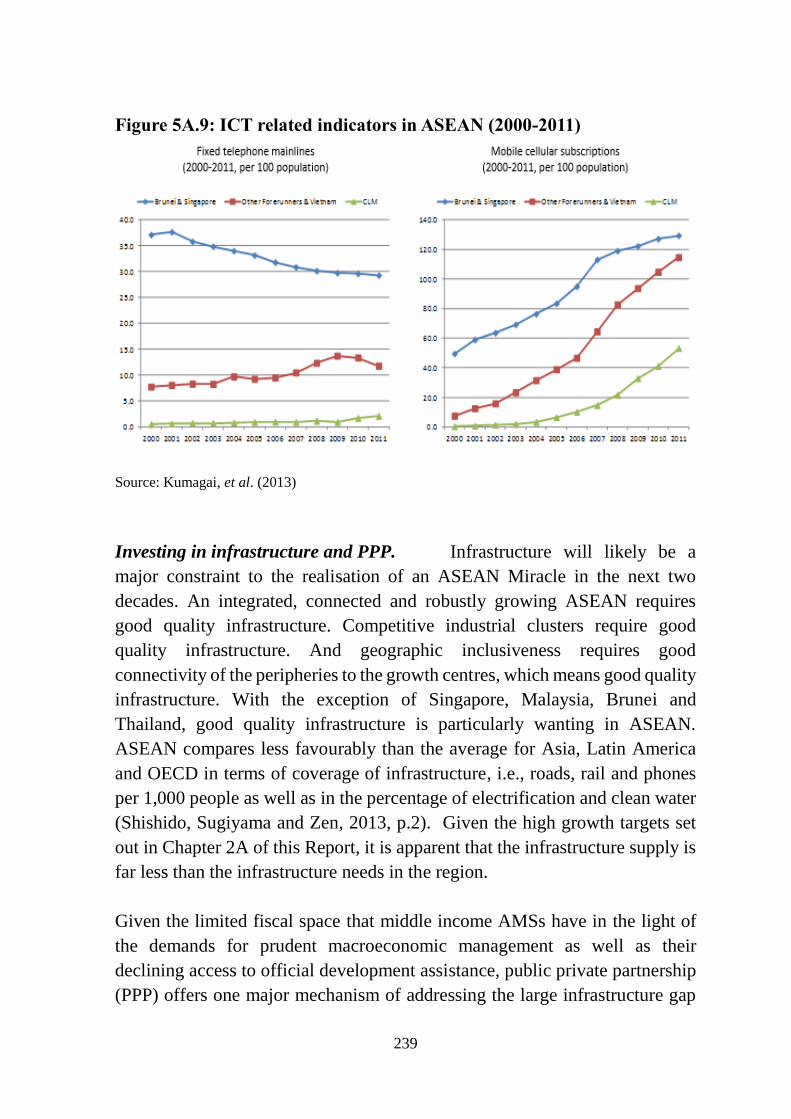
238
about inclusive growth. Much of that connectivity is linked to infrastructure.
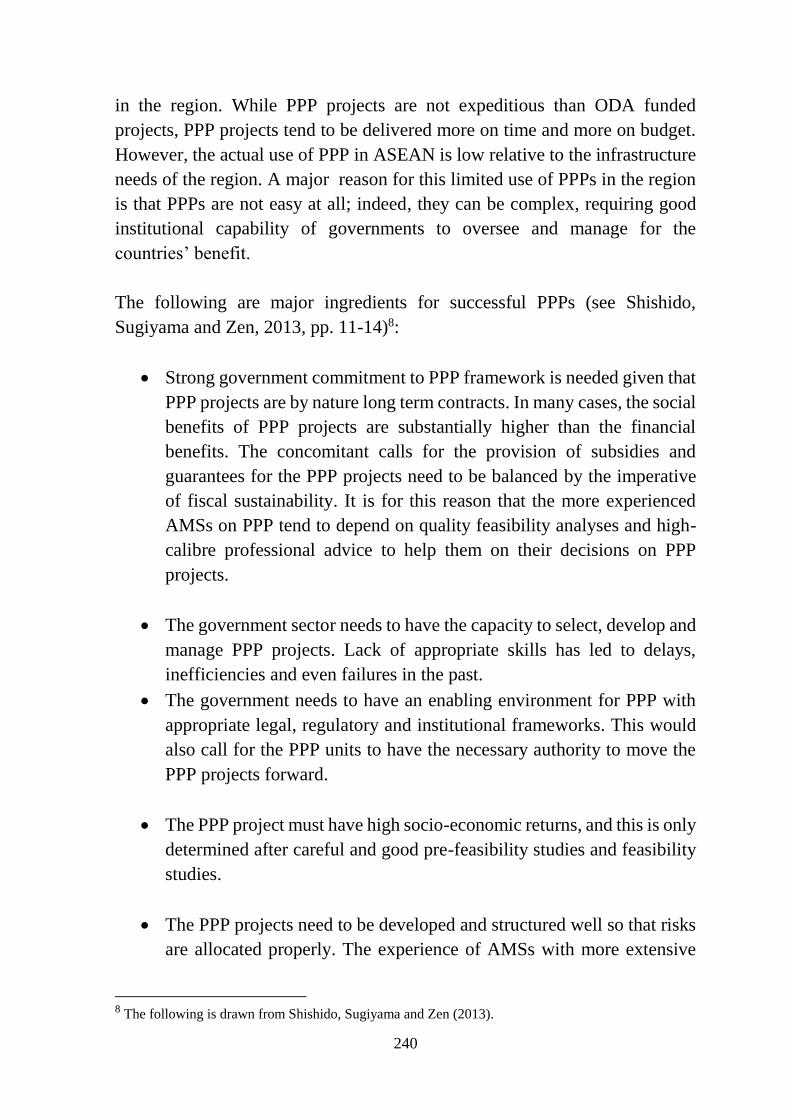
As Table 5A.3 indicates, the CLM countries are comparatively more deficient
in infrastructure than the rest of the AMSs. The same holds true with respect
to ICT infrastructure and services, as Figure 5A. 9 brings out.
Figure 5A.8: Cluster sizes of Jakarta and Bangkok
Note: Maps with GRDP density in automotive industry in 2005 are adopted from Kumagai et al.
(2013) (USD per km2).
Source: Isono (2013).
Table 5A.3: Connectivity related indicators in ASEAN
Railway
density
Road
density
Paved
road
Passenger
cars
Air
passengers
carried
Port
container
freight
Asian Highway
Total Below
class III
(2010) (2010) (2010) (2010) (2010) (2010) (2010) (2010)
Brunei - 564.0 77.2 485 1,263 0.09 - -
Cambodia 3.7 216.7 6.3 18 455 0.22 1,347 0
Indonesia 1.9 262.9 59.1 45 52,283 8.37 4,091 0
Lao PDR n.a. 171.4 13.5 2 444 - 2,857 306
Malaysia 5.1 300.5 82.8 313 30,997 18.25 1,673 0
Myanmar 5.1 41.3 11.9 5 396 0.17 3,009 1,064
Philippiness 1.6 670.9 9.9 8 21,024 4.95 3,367 451
Singapore n.a. 4794.3 100.0 121 26,709 29.18 19 0
Thailand 8.7 352.4 98.5 57 27,162 6.65 5,111 2
Viet Nam 7.6 516.3 47.6 13 14,407 5.98 2,597 264
Unit km per
1000 km2
km per
1000
km2
% per 1,000
population
1,000 million
TEU
km km
Source: UNESCAP (2012).
239
Figure 5A.9: ICT related indicators in ASEAN (2000-2011)
Source: Kumagai, et al. (2013)
Investing in infrastructure and PPP. Infrastructure will likely be a
major constraint to the realisation of an ASEAN Miracle in the next two
decades. An integrated, connected and robustly growing ASEAN requires
good quality infrastructure. Competitive industrial clusters require good
quality infrastructure. And geographic inclusiveness requires good
connectivity of the peripheries to the growth centres, which means good quality
infrastructure. With the exception of Singapore, Malaysia, Brunei and
Thailand, good quality infrastructure is particularly wanting in ASEAN.
ASEAN compares less favourably than the average for Asia, Latin America
and OECD in terms of coverage of infrastructure, i.e., roads, rail and phones
per 1,000 people as well as in the percentage of electrification and clean water
(Shishido, Sugiyama and Zen, 2013, p.2). Given the high growth targets set
out in Chapter 2A of this Report, it is apparent that the infrastructure supply is
far less than the infrastructure needs in the region.
Given the limited fiscal space that middle income AMSs have in the light of
the demands for prudent macroeconomic management as well as their
declining access to official development assistance, public private partnership
(PPP) offers one major mechanism of addressing the large infrastructure gap
240
in the region. While PPP projects are not expeditious than ODA funded
projects, PPP projects tend to be delivered more on time and more on budget.
However, the actual use of PPP in ASEAN is low relative to the infrastructure
needs of the region. A major reason for this limited use of PPPs in the region
is that PPPs are not easy at all; indeed, they can be complex, requiring good
institutional capability of governments to oversee and manage for the
countries’ benefit.
The following are major ingredients for successful PPPs (see Shishido,
Sugiyama and Zen, 2013, pp. 11-14)8:
Strong government commitment to PPP framework is needed given that
PPP projects are by nature long term contracts. In many cases, the social
benefits of PPP projects are substantially higher than the financial
benefits. The concomitant calls for the provision of subsidies and
guarantees for the PPP projects need to be balanced by the imperative
of fiscal sustainability. It is for this reason that the more experienced
AMSs on PPP tend to depend on quality feasibility analyses and high-
calibre professional advice to help them on their decisions on PPP
projects.
The government sector needs to have the capacity to select, develop and
manage PPP projects. Lack of appropriate skills has led to delays,
inefficiencies and even failures in the past.
The government needs to have an enabling environment for PPP with
appropriate legal, regulatory and institutional frameworks. This would
also call for the PPP units to have the necessary authority to move the
PPP projects forward.
The PPP project must have high socio-economic returns, and this is only
determined after careful and good pre-feasibility studies and feasibility
studies.
The PPP projects need to be developed and structured well so that risks
are allocated properly. The experience of AMSs with more extensive
8 The following is drawn from Shishido, Sugiyama and Zen (2013).
241
exposure to PPP is that the AMSs need high quality but expensive
professional, financial, legal, and technical, transactions, and other
advice. Though PPP is expensive and time consuming, it does not pay,
however, to cut corners.
Given the above, it is clear the PPP partners need to be capable.
The above list shows that PPPs are complex and sophisticated contracts. At the
same time, in view of the huge infrastructure needs of many AMSs to support
high target growth rates, it is apparent that AMSs need to invest in making the
appropriate policy, institutional, and human resource foundations for the
successful implementation of PPPs for the development of AMSs. And when
the PPP system is well performing, infrastructure as a constraint ends up
becoming infrastructure as an investment opportunity. Indeed, infrastructure
investments become a growth driver for many AMSs in the years ahead.
Towards a well performing PPP system in AMSs and the region, Shishido,
Sugiyama and Zen (2013) have the following recommendations:
Given that proper project development is crucial for attracting private
resources, AMSs need to invest more funds for PPP project
development. Project development costs account for 5-10 percent of
total project costs, much of it for expensive but necessary expert advice.
In contrast, AMSs tend to spend only 1-2 percent of the total cost.
For AMSs still learning the PPP ropes, unbundle larger PPP projects
into smaller and simpler projects to allow AMSs with limited experience
to understand the PPP structure and the underlying risks. This learning
by doing would help AMS government units gain more experience in
designing, implementing and managing PPP projects.
Establish an ASEAN Centre of PPP Excellence at the regional level,
staffed with high calibre experts in areas like finance, fiscal analysis, and
others. The PPP Centre of Excellence can disseminate best practices and
other lessons to AMSs, provide assistance to AMSs through advice on
areas (e.g., risk analyses and allocation) that are important in project
selection and development, and give advice to AMSs units on how to
242
enhance PPP-readiness (e.g., legal, regulatory, institutional) based in
part on discussion with potential private partners on the constraints they
face and their preferences. India’s Infrastructure and Leasing and
Financial Services (IL & FS) can be a model to consider for the ASEAN
Centre of PPP Excellence.
Engender a robust and enabling legal, regulatory, and institutional
environment in developing and implementing efficient PPP
infrastructure projects.
Create financial instruments that could mitigate project risks in light of
the changing capital markets in the aftermath of the global financial
crisis. Example is the Project Bond Credit Enhancement (PBCE) of the
European Investment Bank (EIB) for bond-financed projects. It is useful
to explore such an enhancement scheme for loan financed projects.
Agricultural Development and Food Security
Agricultural development is critical for inclusive growth in many AMSs with
a substantial rural sector. Rural poverty is significantly higher than urban
poverty, and the rural poor accounts for the vast majority of the total number
of poor in some AMSs. For Myanmar, Cambodia and Lao PDR where the
agriculture sector constitutes a large share of national output, agricultural
development is both a key growth driver for the whole economy and a powerful
instrument of poverty reduction. Studies have shown that agricultural growth
gives more poverty reduction bang than a corresponding percentage growth in
manufacturing or services. The impressive pace of poverty reduction in China
in the 1980s and in Viet Nam in the 1990s can be attributed mainly from the
marked increase in agricultural output and incomes together with the marked
increase in employment in labour intensive manufactures. The marked increase
in agricultural output in both countries arose largely from substantial rise in
agricultural productivity that ultimately allowed for a reduction in agricultural
labour force for shifts in employment in the growing manufacturing and
services sectors.
Although China and Viet Nam are highlighted above, the reduction in the
absolute employment in the agriculture sector, facilitated by productivity
243
growth in the agricultural sector, is part of the structural transformation of the
successful economies such as Thailand, albeit more gradually. Thus,
agricultural development through productivity growth reduces poverty directly
through the rise in incomes from farming (and fishing) and indirectly through
the release of labour from the agricultural sector and rural areas to the growing
non-agricultural sectors. Agricultural development through productivity
growth has a third channel of reducing poverty, i.e., agricultural productivity
growth tempers food prices and therefore pressures for wage increases which,
without corresponding productivity growth, can hurt significantly the
competitiveness of labour intensive manufactures and thereby of overall
employment prospects.
Agriculture sector performance of AMSs has been remarkable during the past
few decades, anchoring the region’s overall robust economic performance.
Agriculture GDP at constant 2000 prices grew in the 6.0 to 6.6 percent range
on the average per year for Indonesia, Malaysia and Thailand from the 1960s
up to 2010, an average of 6 percent per year for Cambodia during 1993-2010,
an average of around 5.5 percent per year for Lao PDR during 1984-2010 and
for the Philippines from the 1960s to 2010, and an average of 4.9 percent per
year for Viet Nam from the mid- 1980s to the mid-2000s (World Bank as
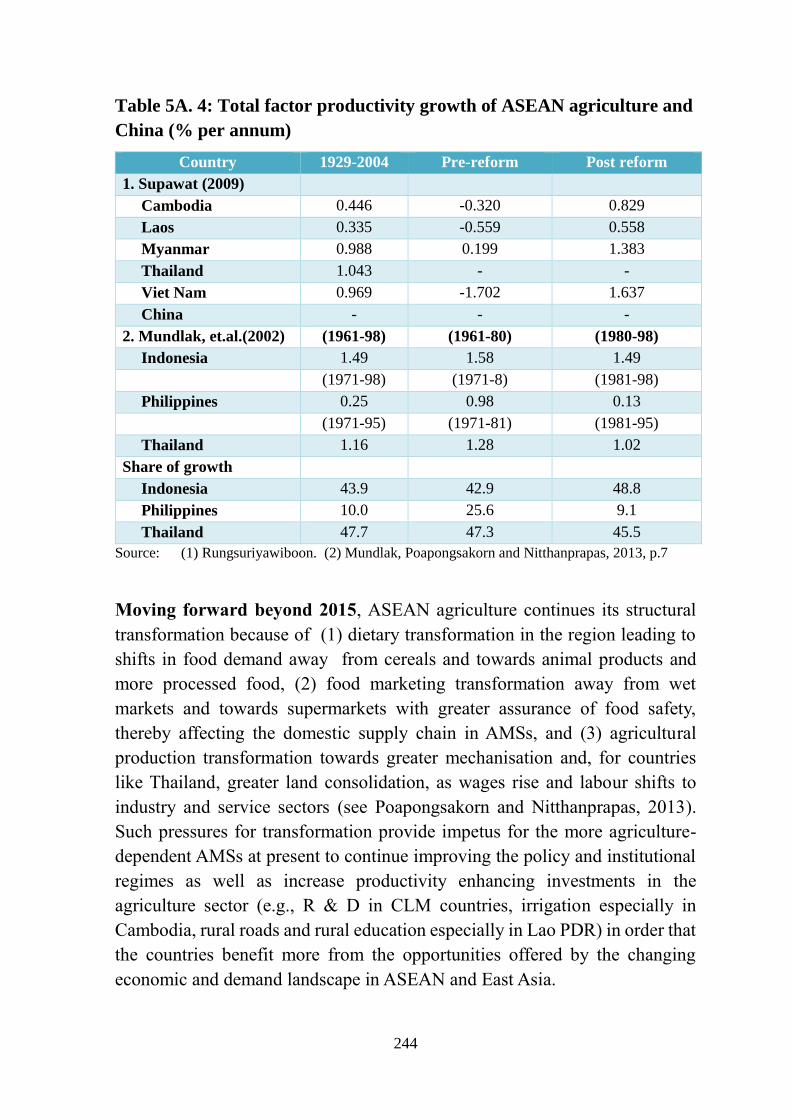
reported in Poapongsakorn and Nitthanprapas, 2013, p.3). Available data and
estimates suggest that productivity growth has been an important driver of the
robust growth of the agriculture sector in a number of AMSs (see Table 5A.4).
The table shows the marked improvement in agricultural total productivity
during the post reform period for the CLMV countries. Notice also the robust
growth of total factor productivity in Indonesia and Thailand in the decades
prior and during ASEAN’s first “golden decade” of 1985-1995 when Indonesia
and Thailand, together with Malaysia and Singapore, registered very high
overall economic growth rates. The poor total factor productivity growth of
Philippine agriculture underpinned to some extent the difficult economic
adjustment and mediocre overall economic performance of the country during
the 1980s through the 1990s and early 2000s. The Philippines had the slowest
rate of poverty reduction among the AMS during the period.
244
Table 5A. 4: Total factor productivity growth of ASEAN agriculture and
China (% per annum)
Country 1929-2004 Pre-reform Post reform
1. Supawat (2009)
Cambodia 0.446 -0.320 0.829
Laos 0.335 -0.559 0.558
Myanmar 0.988 0.199 1.383
Thailand 1.043 - -
Viet Nam 0.969 -1.702 1.637
China - - -
2. Mundlak, et.al.(2002) (1961-98) (1961-80) (1980-98)
Indonesia 1.49 1.58 1.49
(1971-98) (1971-8) (1981-98)
Philippines 0.25 0.98 0.13
(1971-95) (1971-81) (1981-95)
Thailand 1.16 1.28 1.02
Share of growth
Indonesia 43.9 42.9 48.8
Philippines 10.0 25.6 9.1
Thailand 47.7 47.3 45.5
Source: (1) Rungsuriyawiboon. (2) Mundlak, Poapongsakorn and Nitthanprapas, 2013, p.7
Moving forward beyond 2015, ASEAN agriculture continues its structural
transformation because of (1) dietary transformation in the region leading to
shifts in food demand away from cereals and towards animal products and
more processed food, (2) food marketing transformation away from wet
markets and towards supermarkets with greater assurance of food safety,
thereby affecting the domestic supply chain in AMSs, and (3) agricultural
production transformation towards greater mechanisation and, for countries
like Thailand, greater land consolidation, as wages rise and labour shifts to
industry and service sectors (see Poapongsakorn and Nitthanprapas, 2013).
Such pressures for transformation provide impetus for the more agriculture-
dependent AMSs at present to continue improving the policy and institutional
regimes as well as increase productivity enhancing investments in the
agriculture sector (e.g., R & D in CLM countries, irrigation especially in
Cambodia, rural roads and rural education especially in Lao PDR) in order that
the countries benefit more from the opportunities offered by the changing
economic and demand landscape in ASEAN and East Asia.
245
In addition, improvements in trade facilitation and infrastructure (including
modern wholesale markets and logistics facilities) as well as harmonisation of
standards and more streamlined SPS procedures discussed earlier would
encourage the further development of the agricultural supply chain not only
domestically but also regionally within ASEAN. Using gravity model, Okabe
and Urata (2013) show that intra-ASEAN agricultural trade would increase
substantially if the time and cost to import and export would be reduced
significantly (of which the latter is affected especially by the efficiency of
customs procedures, transparency of border administration, availability and
quality of transport services and infrastructure, and the quality of the regulatory
environment). This process of growing modernisation and integration of
ASEAN agriculture would help ensure that the region remains a competitive
global agricultural producer and possibly remains a net exporter of agriculture
products, unprocessed and processed.
The above implicitly assumes that the policy regime and incentive structure in
AMSs would encourage the agricultural sector in each AMS to adjust
according to each country’s comparative advantage. This means that
distortions within the agriculture sector are virtually eliminated. However,
there are in fact some policy distortions within the agriculture sector in some
AMSs, primarily through the protection from import competition of politically
sensitive crops especially rice and sugar as well as through the subsidisation of
the production of such politically sensitive crops. The effect of such distortion
is that scarce land is not efficiently utilised, thereby leading to less than robust
growth of the sector. In the more serious case, this leads to higher food costs
that eventually get embedded in higher wages, which have adverse effects on
the competitiveness of labour intensive manufactures in an open and integrated
ASEAN region under AEC.
The key reason for the policy distortions within the agriculture sector is the
political imperative of food security. This is most salient for countries like
Indonesia and the Philippines which are both large producers and net importers
of rice, arguably the most politically sensitive crop in the region. Thus, for
example, Intal, Oum and Simorangkir (2011, p.35) present the food security
conundrum for the Philippines as thus:
246
“The major challenge on food security for the Philippines is that the
country has relatively low land-to-population ratio but high population
growth. Moreover, it has low irrigation rate, but rice is a water-intensive
crop. It has emerged as the world’s largest rice importer but the world
rice trade is thin, resulting in highly variable price. The thinness of the
global market …is the result of government interventions to control the
importation... (and exportation)…of a politically sensitive commodity
like rice. The Philippines’ agricultural comparative advantage is in
tropical fruits and vegetable oils…plus fishery… Reducing the trade-–
off between the political imperative of food security and the
…(potentials of)… exports would call for a greater focus on productivity
enhancing investments (irrigation, roads, R & D…) and a substantial
reduction of funds for price stabilisation.”
Addressing the food security conundrum. Can the concern for food security
be reconciled with an open agriculture sector? Studies on the impact of the
2007-2008 global food price inflation show large negative impacts on poor
households that led them to borrow, take their children out of school, or migrate
out of their villages, among others (Reyes and Mandap, 2011). Agricultural
food protection tends to temper the effect of sharp global price hikes on
domestic food prices and their impact on households. However, such
protectionist policy results in distorted allocation of resources in the agriculture
sector which has adverse long run effects on the economy.
Simulations by Warr (2011), using a CGE model for Indonesia, suggest that
the long run solution is to gradually open up and eliminate the distortions in
the agriculture sector while at the same time stimulating more productivity
enhancing investments in agriculture. This result is consistent with the
quotation on the Philippine case presented above. The challenge is with respect
to the short run solution, of which the most important is how to strengthen
confidence on the international market. One of the major policy actions
undertaken during the 2007-2008 food price crisis was the imposition of export
restrictions, which exacerbated the global price rise, and likely encouraged the
net importing countries to import more, thereby further fuelling the global price
hikes. Thus, the important regional cooperation challenge is to have a regional
agreement on policy rules or rules of behaviour among AMSs (and other
East Asian countries including India) to prevent volatility-enhancing policies
247
by net exporting countries (e.g., export restrictions, export taxes) and to
encourage volatility-reducing policies by net importing countries (e.g.,
reduction in taxes) during food price inflation periods (see Intal, Oum and
Simorangkir, 2011, pp. 39-43).
Food security remains a significant concern in ASEAN. Using prevalence of
undernourishment as a key indicator of food insecurity as used by the Food and
Agriculture Organization (FAO), a number of AMSs (e.g., Lao PDR,
Cambodia, the Philippines) are seriously food insecure (see Table 2A.5 in
Chapter 2A of this Report) even if national food availability is adequate.
The 2007-2008 food crisis brought to the fore the urgency of concerted
regional initiatives on food security in the region. ASEAN crafted the ASEAN
Integrated Food Security (AIFS) Framework and the Strategic Plan of Action
on Food Security (SPA-FS). There are four components; namely, (1)
emergency/shortage relief, (2) sustainable food trade development, (3)
integrated food security information system, and (4) agri-innovation for
sustainable food production. The framework is comprehensive, addressing
both long run dimensions (component 4) and the short run (component 1). It
also highlights the role of conducive market and trade policies (component 2)
and effective information system (component 3) in order to ensure a food
secure ASEAN.
Component 3 is implemented with the establishment of the ASEAN Food
Security Information System (AFSIS) in 2002. On component 1, as a result of
the 2007-2008 global food crisis, ASEAN and the Plus Three countries (China,
Japan, and Korea) intensified efforts towards the establishment and
operationalisation of an emergency rice reserve in the region. The agreement
to establish the ASEAN Plus Three Emergency Rice Reserve (APTERR) was
signed in 2011 and it was entered into force in 2012. APTERR is meant to
enhance food security in the region as it can potentially be tapped by concerned
AMSs during emergencies and major shocks. Component 4 is addressed in
continuing ASEAN initiatives on R & D, climate change, while Component 2
is implemented primarily through AMSs’ commitments under ATIGA and
regional initiatives related to SPS. There is no regional agreement on policy
rules or behaviour among net exporters and net importers to prevent
exacerbation of price hikes during food shortages.
248
With the entry into force of the APTERR agreement, can there be another
commodity or set of commodities where an emergency reserve agreement
could also be signed and operationalised? Briones (2013) examined this issue,
with the choice of the commodity based on importance in demand, contribution
to livelihoods, storability, magnitude of price volatility, and viability of other
instruments for price stabilisation. After examining a number of crops (e.g.,
maize, sugar, and vegetable oils) based on the above criteria, there is none that
qualifies. This indicates that rice is indeed a unique commodity, making it
politically salient and workable to have an emergency reserve agreement
within the region. Given that an emergency reserve is compelling for rice only,
the author recommends that AMSs explore other policy options to enhance
food security, specifically (Briones, 2013):
Government programs targeted to specific disadvantaged groups such as
cash transfers to targeted poor households;
Establishing market –based instruments to reduce price instability at the
farmers level, e.g. commodity exchanges; and
Developing market-based instruments that mitigate the effects of
instability, e.g., options and futures.
Cash transfer to targeted poor households is already implemented in AMSs,
perhaps most aggressively by the Philippines. Commodity exchanges can
contribute to the modernisation of ASEAN agriculture as well as to the region’s
food security goals. Experiences of the development of commodity exchanges
in India, Brazil, Malaysia and South Africa indicate that commodity exchanges
also facilitate the development of the physical infrastructure for physical trade.
Thus, for example, the Multi commodity Exchange of India (MCX)
contributed substantially to the growth of mentha oil, cardamom and other
commodities through infrastructure development (e.g., warehouses),
expansion of warehouse-based financing, aggressive development of ICT
technologies, development of national electronic spot exchange, etc.. Brazil’s
Bolsa de Mercadores e Futuros (BM & F) facilitated trade in the secondary
market of Cedula de Produto Rural (CPR) thereby facilitating rural finance,
established an exporter call centre, developed links with China thereby helping
in market development. .Bursa Malaysia Derivatives Berhad became a global
price setter for FCPO as it focused on establishing a global price discovery
platform and on developing long term pricing models to help in price risk
249
management. It did not need to focus on the facilitation of physical trade,
finance and market development because Malaysia has a well-established, well
developed, and well regulated and rapidly growing global physical market for
palm oil. (See UNCTAD, 2009.) Thus, the development of commodity
exchanges can facilitate the improvement of physical trade, finance and market
development in addition to supporting food security goals.
While the discussion above focused primarily on the regional initiatives, much
of the challenge of ensuring food security lies at the national level. As implied
in the AIFS and SPA-FS, food security is now viewed more broadly than food
availability only. The FAO definition of food security entails the simultaneous
satisfaction of four basic dimensions: availability, physical access, economic
access and utilisation. This broader and multi-dimensional definition of food
security effectively expands the factors that impinge on food security. There
is thus a need for an integrated approach to ensuring food security, where the
interrelationships among the four dimensions of food security are
acknowledged and laid out. One key question arises: how robust is a country’s
food and agricultural system to address the food security challenge? A
corollary question is: which are the areas that need to be a focus for
intervention? (Syngenta, 2012, p.16). Towards this end, the Rice Bowl Index
provides a useful integrative framework and, being an index, a measuring tool
on the robustness of a country’s system for food security. The Rice Bowl Index
measures the following set of enabling and disabling factors and the basic
question that each set of factors addresses (Syngenta, 2012, pp.16-17):
Farm level factors: Do the farmers have the capability and means
to be productive?
Policy and Trade factors: Does the trade and policy environment
encourage open markets, investment and innovation?
Environmental factors: Will the environmental capacity in the country
provide for long-term agricultural productivity and sustainability?
Demand and price factors: How will the food security needs in the
country evolve in terms of quantity, affordability and access?
The findings from the Rice Bowl Index show that the countries with the most
stable food security over a period of time have a balance of the four sets of
factors, that farm level factors are the major contributors to the robustness of a
country’s food security system albeit also being the most volatile, that demand
250
and price factors have more impact during periods of greater price volatility,
and that the other two factors shape the longer term robustness of a country’s
food security system (Desker, Caballero-Anthony and Teng, 2013).
A comparison of the results of the Rice Bowl Index for a number of AMSs with
comparator countries in the East Asia Summit region shows that AMSs lag
behind, with countries differing on their robustness among the enabling and
disabling factors. In view of its potential usefulness as an organizing and
measuring tool on the robustness of food security systems in AMSs and the
region, it is worthwhile to have the Rice Bowl Index refined further for
ASEAN and then institutionalised in ASEAN.
Disaster Management and Safety Net Design for
ASEAN
Disaster management9. While the AMSs have been successful in achieving
economic growth and poverty reduction, ASEAN cannot avoid exposure to a
variety of disasters; in fact, ASEAN and East Asia is the most disaster-prone
region in the world (Sawada and Oum, 2012). The region is exposed to almost
all types of natural hazards, e.g., tsunamis, typhoons and cyclones,
earthquakes, floods, volcanic eruptions, etc. Indeed, Asia accounted for about
two-fifths of all natural disasters as well as the cost of the damages from the
disasters in the world during 2001-2010 (Sawada and Zen, 2013). In addition,
the number of reported disaster events more than doubled from the 1980s to
the 2000s (Fargher, et al., 2012, Box 1, p.4). The region has experienced major
natural disasters including the 2004 Indian Ocean Tsunami, 2008 Cyclone
Nargis, 2008 earthquake in Sichuan, China, 2009 earthquake in Padang, West
Sumatra, 2011 earthquake and tsunami in Japan, and most recently, the 2013
Typhoon Haiyan that devastated Central Philippines.
The cost to lives and property have been large, most vividly illustrated by the
over 250,000 deaths from the Indian Ocean tsunami, 69,000 deaths from the
Sichuan earthquake, and most recently, the more than 6,000 deaths from
Typhoon Haiyan. The economic cost has also been substantial stretching for a
number of years, worsening poverty, and eroding development gains.
9 This subsection draws heavily from Sawada and Zen (2013).
251
Given the disaster-prone condition of the majority of ASEAN member states,
ASEAN has been raising its collective efforts to cope with the challenges.
Since its inception back in 1976, ASEAN has been recognising and adopting
disaster management as one of its eight principles and objectives. A major step
was the decision to establish the ASEAN Committee on Disaster Management
in 2003, followed by the signing of the ASEAN Agreement on Disaster
Management and Emergency Response in 2005, as well as the ARF Statement
on Disaster Management and Emergency Response in 2006. The latest major
manifestation of the high policy importance given to disaster management is
the Cha-am Hua Hin Statement on EAS Disaster Management that was
adopted by the East Asia Summit (EAS) Leaders during the 4th EAS in 2009.
The Statement brings out forcefully that disaster management is not only an
ASEAN concern but in fact a major concern of the wider EAS region, the
world’s most natural disaster- prone region as averred earlier.
Given that the region is disaster-prone, the fundamental challenge for the
region is to make the region more disaster resilient and to substantially reduce
disaster losses in terms of human lives and in the social, economic and
environmental assets of communities and countries (UNISDR, 2005, p.3;
AIFDR Design Document, 2009, p.4). The Hyogo Framework for Action
2005-2015, drawing from the earlier Yokohama Strategy for a Safer World,
provides the five key strategies, and corresponding action points, towards
greater disaster resiliency and reduced losses from disasters, namely
(UNISDR, 2005, p.6):
Ensure that disaster risk reduction is a national and a local priority
with a strong institutional basis for implementation.
Identify, assess and monitor disaster risks and enhance early
warning.
Use knowledge, innovation and education to build a culture of
safety and resilience at all levels.
Reduce the underlying risk factors.
Strengthen disaster preparedness for effective response at all
levels.

252
As the Hyogo Framework stated, disaster risk arises when hazards (which in
the region is mainly hydrometeorogical in origin) interact with physical, social,
economic and environment vulnerabilities (Ibid, p. 1). It is apparent that one
critical way forward towards disaster reduction is for countries, communities
and people to understand better the various hazards and thereby build a culture
of safety and resilience, in tandem with understanding the social, economic,
and environmental vulnerabilities and their interaction with the various
hazards. Early warning systems, embedding disaster resiliency in social and
economic practices and policies in part as a means of reducing the underlying
risk factors, capacity building, drawing up emergency plans, disseminating and
teaching emergency knowledge, conducting emergency drills, constructing
early warning systems, investing in sturdier infrastructure, and engaging
communities combined together contribute to improved disaster resiliency. As
the above Hyogo Framework implies, building sufficient capacities for disaster
resiliency and preparedness needs to be the core foundation of disaster
management. To a large extent, the Australia-Indonesia Facility for Disaster
Reduction is primarily in support of this perspective of raising national
capacities towards disaster resiliency and reduction of disaster losses.
Nonetheless, there is clear basis for strong regional and even international
cooperation and partnerships in the various areas of action towards greater
disaster resiliency and lower disaster losses in AMSs and the region. As the
Typhoon Haiyan experience shows, international or regional surge capacity to
respond in the immediate aftermath of a major disaster, especially when the
disaster-stricken country is initially overwhelmed by the magnitude of the
crisis, can play a major role in tempering the adverse consequences of disasters.
Regional cooperation goes further than disaster response; indeed, in many
areas of action under the Hyogo Framework and as articulated in the Cha-am
Hua Hin Statement on EAS Disaster Management, regional cooperation and
countries joining together can make a significant difference. Thus, for
example, the ASEAN Regional Program on Disaster Management (ARPDM)
aims at enhancing cooperation among member countries, capacity building,
sharing of information and resources, external partnerships, as well as public
education and awareness raising. ARPDM is coordinated under the ASEAN
Agreement on Disaster Management and Emergency Response (AADMER),
which is the first Hyogo Framework for Action-related binding instrument in
the world. The operational body of AADMER is the ASEAN Coordinating
253
Centre for Humanitarian Assistance on Disaster Management (AHA Centre)
based in Jakarta (Sawada and Zen, 2013, pp. 17-18).
In addition to strengthening national capacities and regional cooperation in
disaster management, a creative use of market mechanisms can also contribute
to greater disaster resiliency and risk reduction. Specifically, ASEAN moving
forward beyond 2015 may well examine and implement insurance
mechanisms at the regional level to help address and manage the aftereffects
of natural disasters. Munic Re’s 2010 report shows that only 9 percent of
property losses due to natural disasters in Asia was covered by private
insurance as against about 75 percent coverage in the case of the Christchurch
earthquake (Sawada and Zen, 2013, p.2).
Not surprisingly, an analysis by Sawada suggests that significant income
shocks arising from natural disasters also translate to large consumption
shocks, a reflection of the incomplete insurance mechanism in the region (Ibid,
p. 14).
There is merit in strengthening the complementarities among market
mechanisms like insurance systems, government enforcement mechanisms,
and community social interactions and capital in order to improve disaster
resiliency. For idiosyncratic risks that affect individuals or small groups of
individuals, community-based mutual insurance mechanisms that tap a
community’s social capital can help weather losses from natural disasters. For
aggregate shocks that cover a wide area (e.g., natural disasters), government
enforcement mechanisms can contribute to increased participation rates, and
thereby make private insurance workable. These risks should be covered by
well-designed formal market or similar arrangements backed by the public
enforcement mechanisms in which country-specific or region-specific risks are
diversified away across countries or regions. There can also be regional
insurance mechanisms similar to the Caribbean Catastrophic Risk Insurance
Facility (CCRIF) which is a parametric, multinational hazard insurance fund
for hurricanes and earthquakes that works with the international reinsurance
market. The benefit of such funds as CCRIF was shown when the Haiti
government received funds from CCRIF twenty times its premium about 2
weeks after the earthquake (Sawada and Zen, 2013, p.29). The CCRIF is an
example of recent innovative ideas in insurance mechanisms against natural
254
disasters such as the “index insurance or parametric insurance contracts” which
“…pay out on storms that exceed a pre-designated speed, rainfall that falls
short of a threshold level, and earthquakes that exceed a certain seismic
intensity” (Sawada and Zen, 2013, p. 22).
The World Bank and other institutions have been piloting weather-based index
insurance contracts in Morocco, Mongolia, Peru, Viet Nam, Ethiopia,
Guatemala, India, Mexico, Nicaragua, Romania, and Tunisia. However, the
market for micro insurance is still underdeveloped in the South East Asian
region. For disaster linked micro-insurance, only Indonesia, the Philippines,
Thailand, and Viet Nam have developed small-scale or pilot projects, hence,
the coverage areas are still limited and the programs are at an early stage of
development.
Another creative use of market mechanism in tandem with government
enforcement and policy intervention is by incentivising disaster risk reduction
(DRR) policy. Thus, for example, countries could be constantly evaluated for
their DRR policy and given “seals of approval” which would allow them to
insure themselves explicitly with international re-insurers or implicitly by
issuing Catastrophic Bonds (CAT bonds) that allow for multi-year insurance.
The “seal of approval” would alleviate investors or insurers’ concerns about
the moral hazard generated by the disaster-continent financial support (Sawada
and Zen, 2013, p. 27).
In summary, it is best to quote verbatim from the Hyogo Framework for Action
2005-2015, as thus:
“There is now international acknowledgement that efforts to reduce
disaster risks must be systematically integrated into policies, plans and
programmes for sustainable development and poverty reduction, and
supported through bilateral, regional and international cooperation,
including partnerships. Sustainable development, poverty reduction,
good governance and disaster risk reduction are mutually supportive
policies, and in order to meet the challenges ahead, accelerated efforts
must be made to build the necessary capacities at the community and
national levels to manage and reduce risk” (UNISDR, Hyogo
Framework for Action, p. 1).
255
Thus, moving forward beyond 2015, it is recommended for ASEAN to:
Strengthen further the (a) operationalisation of regional
cooperation in disaster reduction and emergency response in the
region, (b) networking and sharing of best practices, experiences
and operational manuals among specialists, responders and
practitioners, and (c) operationalisation and enhancement of
standard operating procedures for greater compatibility and
effectiveness in disaster response. This is in part through the main
activities of the AHA Centre that include risk identification and
monitoring in tandem with a national focal point in each AMS,
facilitation of the establishment, maintenance, and periodic review of
regional standby agreements for disaster relief and emergency response.
This is in part through such mechanisms such as the ASEAN Regional
Disaster Emergency Response Simulation Exercise (ARDEX) for
capacity building and improved regional coordination.
Accelerate national efforts in ASEAN to integrate disaster risk
reduction in national policies and programs and to strengthen
national and local capacity in disaster management in AMSs
through better understanding of risk and vulnerability and their
interaction in prioritised areas and regions of AMSs, better capability to
reduce disaster risk in practice, and greater partnerships with regional
and international institutions and organisations. This approach is similar
to the strategies set out by the Australia-Indonesia Facility for Disaster
Reduction.
Develop formal mechanisms to diversify aggregate disaster risks at
national and regional levels and to elaborate multi-country risk
pooling schemes and sources, i.e., regional fund, to cover sovereign
disaster risk. While regional index insurance schemes (such as the
Pacific Catastrophe Risk Assessment and Financing Scheme) are
supported by development partners, the microcredit and insurance
programs are supported by informal community enforcement
mechanisms. Hence, complementarities among the market, the state,
and the community will be the key.
256
Another policy to consider is to support the acquisition and public
provision of hazard map and data. Rashcky and Chantarat (2013)
suggest the establishment of a regional centre for disaster risk data,
modelling and insurance. Reliable spatiotemporal- rich data on
exposures and disaster losses are largely unavailable in ASEAN
countries. These necessary risk data and modelling are critical in
enhancing risk-based pricing and supervision, in stimulating the
development of new insurance products, and in helping the
governments identify appropriate risk financing strategies for effective
and timely disaster responses.
Social protection10. One of the key premises of the framework in
Chapter 2B is that the pursuit of inclusive and balanced growth in ASEAN is
best pursued through greater reliance on dynamic economic forces tempered
by prudent safety net programs, rather than on activist and fiscally
unsustainable subsidisation policies and income redistribution programs.
Much of Chapter 5A shows that the more critical strategies for greater
inclusiveness also contribute to greater competitiveness, e.g., SME
development, better infrastructure connectivity and institutional connectivity.
Nonetheless, as ASEAN economies become more integrated with one another
and with the rest of the world, AMSs and their households become more
vulnerable to shocks coming from abroad. Moreover, a number of AMSs are
facing increasingly the challenges of an aging population. Thus, AMSs need to
have robust safety net and social protection programs, albeit more prudently
than a number of advanced countries in view of the fiscal constraints in many
AMSs.
At present, the nature and availability of social security programs varies
considerably within the ASEAN region. In general, programs are skewed
towards the formal sector, urban workers and government staff and are
predominantly publicly managed. In terms of areas of coverage, all countries
have programs for at least four of the eight branches that include sickness,
maternity, old age, invalidity, survivors, family allowances, employment
injury and unemployment. Thailand has the most comprehensive coverage.
Nearly all countries provide pensions for old age, disability, survivorship and
10 This subsection draws heavily from Asher and Zen (2013).
257
work injury. Coverage of sickness, maternity benefits, unemployment benefits
and family allowance is however limited, as is access to health care. While the
scope of coverage is large, most countries perform poorly on legal coverage
and effective population covered. Actual coverage may also be lower than legal
coverage because of the large informal sector.
Rapid growth of the working age population in ASEAN means that ASEAN
will have to deal with issues such as migration and informalisation of labour.
At the same time, the region faces the challenge of aging at relatively low
incomes, calling for serious attention and action from the policy makers. In
addition, the region has to deal with the issues of covering special groups
within the population like informal sector workers and migrants. Intra-ASEAN
labour migration has been growing and is 32 percent of total outward migration
and 60 percent of total inward migration but there is no social security
agreement among ASEAN countries, resulting in no portability of benefits for
60 percent of intra-ASEAN labour migrants (Pasadilla, 2011). Other issues to
be tackled on the social security are the effectiveness of service delivery and
imbalance in supply and demand.
Social security systems have the functions of smoothing consumption over
lifetime, insurance particularly against longevity and inflation risks, poverty
relief and even income redistribution. The challenge for efficient and effective
social security systems in AMSs is maintaining fairness and sustainability or
in effect, have social security programs that are fiscally viable in the longer
term and yet provide an adequate level of benefits to all, especially in the
context of tight fiscal resources and many competing urgent expenditure needs
(Asher and Zen, 2013, 4). As indicated earlier, coverage leaves much to be
desired in many AMSs.
Can AMSs raise substantially coverage and provide adequate level of benefits
while at the same time ensure fiscal viability? An examination of the
experiences of some countries (e.g., Japan, Chile, and Brazil) provide some
insights and recommendations for the way forward for ASEAN beyond
2015:
Prioritisation and tiering. For example, Chile has a tax funded pension
system called solidarity pillar to all citizens older than 65 years
258
belonging to the poorest 60 percent of the population, while the rest have
a voluntary pillar where all workers contribute. Similarly, Brazil has the
non-contributory second pillar, called social assistance, that ensures
universal coverage of all Brazilians; the social assistance includes
pension for the elderly and disabled with limited resources as well as
income transfers to poor families, the best known of which is the cash
transfer program called Bolsa Familia Programme. Brazil’s first pillar
for social insurance is contributory and also covers pension for old age.
Japan also has a two-tier strategy for its social security system, with the
upper layer for those with formal employment and the lower layer for
the rest of the population who are excluded from the upper layer. The
tax financed schemes for the lower layer are administered by local
governments. Note that in both Chile and Brazil, the tax-financed pillar
covers only the relatively poor segment of the population. This is
perhaps the take away on prioritisation and tiering; that is, the non-
contributory and tax financed pillar or tier is for the relatively poor
population only. This is one way of reducing the fiscal cost of the social
security system while at the same time expanding the coverage of the
system.
Strong health insurance systems. This is best exemplified by the
case of Japan where the health system is organised to provide equal
quality of medical service at equal cost to all and the patient can directly
approach any hospital for treatment. While the provision of equal quality
at equal cost for all is not realistic for many AMSs at the moment, it is
likely that the quality of medical care can be expected to improve over
time in AMSs as they develop. Nonetheless, the focus on health
insurance systems reflects the fact that medical emergencies can set back
families without insurance considerably financially, possibly forcing
them into indebtedness and unplanned sale of productive assets and into
poverty.
Controlling costs and modernising systems. Administrative costs are
likely to be high in ASEAN economies, and administrative capacities in
the relatively poorer AMSs are not adequate. Decentralised
implementation but with central government direction and supervision,
involvement of non-government organisations with similar objectives
259
subject to stringent centrally defined criteria, stronger governance and
administration of schemes, increased professionalism through evidence-
based policy making, and (for low income AMSs) building
administrative capacities of social security institutions are all possible
means, among others, of controlling costs and modernising systems in
the face of higher coverage.
Developing effective transfer mechanism that does not rely on
formal labour market relationships. Perhaps the best example of this
is Brazil’s Bolsa Familia programme, which is a conditional cash
transfer program for poor families. Analysts point that the Bolsa Familia
accounted for only 3 percent of all social sector expenditures in Brazil,
yet the program has been responsible for between 16 – 21 percent of the
decline in Brazil’s income inequality (arguably one of the worst in the
world until the 1990s) since 2001. The conditionalities imposed on
recipient families of the cash transfers are related to health and
education, which themselves also contribute to improved human capital
and competitiveness (or investment attractiveness) of the country. In
ASEAN, the Philippines has probably the largest conditional cash
transfer program in the region.
Integrated, systemic changes in systems under evidence-based
policy making. Improving the efficiency and effectiveness of the social
security systems in a number of AMSs may call for systemic and
integrated reform efforts. In the case of Chile, the social security reforms
were in tandem with capital market reforms, creation of autonomous
regulatory structures, and with a great focus on job creation. Such
reforms would call for evidence-based policy making with strong
reliance on good and transparent information that contributed to better
product development and informed policy making.