chapter 57 the score procedure · chapter 57 the score procedure overview the score procedure...
TRANSCRIPT
Chapter 57The SCORE Procedure
Chapter Table of Contents
OVERVIEW . . . . . . . . . . . . . . . . . . . . . . . . . . . . . . . . . . .3063Raw Data Set . . . . . . . . . . . . . . . . . . . . . . . . . . . . . . . . . .3063Scoring Coefficients Data Set . . . . . . . . . . . . . . . . . . . . . . . . . .3063Standardization of Raw Data . . . . . . . . . . . . . . . . . . . . . . . . . .3064
GETTING STARTED . . . . . . . . . . . . . . . . . . . . . . . . . . . . . .3064
SYNTAX . . . . . . . . . . . . . . . . . . . . . . . . . . . . . . . . . . . . .3068PROC SCORE Statement .. . . . . . . . . . . . . . . . . . . . . . . . . . .3069BY Statement . . . . . . . . . . . . . . . . . . . . . . . . . . . . . . . . . .3070ID Statement . . . . . . . . . . . . . . . . . . . . . . . . . . . . . . . . . .3071VAR Statement . . . . . . . . . . . . . . . . . . . . . . . . . . . . . . . . .3071
DETAILS . . . . . . . . . . . . . . . . . . . . . . . . . . . . . . . . . . . . .3071Missing Values . . . . . . . . . . . . . . . . . . . . . . . . . . . . . . . . .3071Regression Parameter Estimates from PROC REG. . . . . . . . . . . . . . .3072Output Data Set . . . . . . . . . . . . . . . . . . . . . . . . . . . . . . . . .3072Computational Resources . . . . . . . . . . . . . . . . . . . . . . . . . . . .3072
EXAMPLES . . . . . . . . . . . . . . . . . . . . . . . . . . . . . . . . . . .3073Example 57.1 Factor Scoring Coefficients . . . . . . . . . . . . . . . . . . .3073Example 57.2 Regression Parameter Estimates .. . . . . . . . . . . . . . . .3078Example 57.3 Custom Scoring Coefficients . . . . . . . . . . . . . . . . . .3083
REFERENCES . . . . . . . . . . . . . . . . . . . . . . . . . . . . . . . . . .3084

3062 � Chapter 57. The SCORE Procedure
SAS OnlineDoc: Version 8
Chapter 57The SCORE Procedure
Overview
The SCORE procedure multiplies values from two SAS data sets, one containingcoefficients (for example, factor-scoring coefficients or regression coefficients) andthe other containing raw data to be scored using the coefficients from the first dataset. The result of this multiplication is a SAS data set containing linear combinationsof the coefficients and the raw data values.
Many statistical procedures output coefficients that PROC SCORE can apply to rawdata to produce scores. The new score variable is formed as a linear combination ofraw data and scoring coefficients. For each observation in the raw data set, PROCSCORE multiplies the value of a variable in the raw data set by the matching scor-ing coefficient from the data set of scoring coefficients. This multiplication processis repeated for each variable in the VAR statement. The resulting products are thensummed to produce the value of the new score variable. This entire process is re-peated for each observation in the raw data set. In other words, PROC SCORE crossmultiplies part of one data set with another.
Raw Data Set
The raw data set can contain the original data used to calculate the scoring coeffi-cients, or it can contain an entirely different data set. The raw data set must containall the variables needed to produce scores. In addition, the scoring coefficients andthe variables in the raw data set that are used in scoring must have the same names.See the section “Getting Started” beginning on page 3064.
Scoring Coefficients Data SetThe data set containing scoring coefficients must contain two special variables: the
–TYPE– variable and the–NAME– or –MODEL– variable. The–TYPE– vari-able identifies the observations that contain scoring coefficients. The–NAME– or
–MODEL– variable provides a SAS name for the new score variable. PROC SCOREfirst looks for a–NAME– variable in the SCORE= input data set. If there is such avariable, the variable’s value is what SCORE uses to name the new score variable. Ifthe SCORE= data set does not have a–NAME– variable, then PROC SCORE looksfor a–MODEL– variable.
For example, PROC FACTOR produces an output data set that contains factor-scoring coefficients. In this output data set, the scoring coefficients are identified by
–TYPE–=’SCORE’. For–TYPE–=’SCORE’, the–NAME– variable has values of’Factor1’, ’Factor2’, and so forth. PROC SCORE gives the new score variables thenamesFactor1, Factor2, and so forth.
3064 � Chapter 57. The SCORE Procedure
As another example, the REG procedure produces an output data set that containsparameter estimates. In this output data set, the parameter estimates are identifiedby –TYPE–=’PARMS’. The –MODEL– variable contains the label used in theMODEL statement in PROC REG, or it uses MODELn if no label is specified. Thislabel is the name PROC SCORE gives to the new score variable.
Standardization of Raw Data
If the scoring coefficients data set contains observations with–TYPE–=’MEAN’and–TYPE–=’STD’, then the raw data are standardized before scoring. If the scor-ing coefficients data set does not contain observations with–TYPE–=’MEAN’ and
–TYPE–=’STD’, or if you use the NOSTD option, the raw data are not standardized.See the section “Examples” on page 3073 for further illustration.
If the scoring coefficients are obtained from observations with–TYPE–=’USCORE’,the raw data are standardized using the uncorrected standard deviations identifiedby –TYPE–=’USTD’, and the means are not subtracted from the raw data. Formore information on–TYPE–=’USCORE’ scoring coefficients in TYPE=UCORRor TYPE=UCOV output data sets, see Appendix A, “Special SAS Data Sets.”
Getting Started
The SCORE procedure multiplies the values from two SAS data sets and creates anew data set to contain the results of the multiplication. The variables in the newdata set are linear combinations of the variables in the two input data sets. Typically,one of these data sets contains raw data that you want to score, and the other data setcontains scoring coefficients.
The following example demonstrates how to use the SCORE procedure to multiplyvalues from two SAS data sets, one containing factor-scoring coefficients and theother containing raw data to be scored using the scoring coefficients.
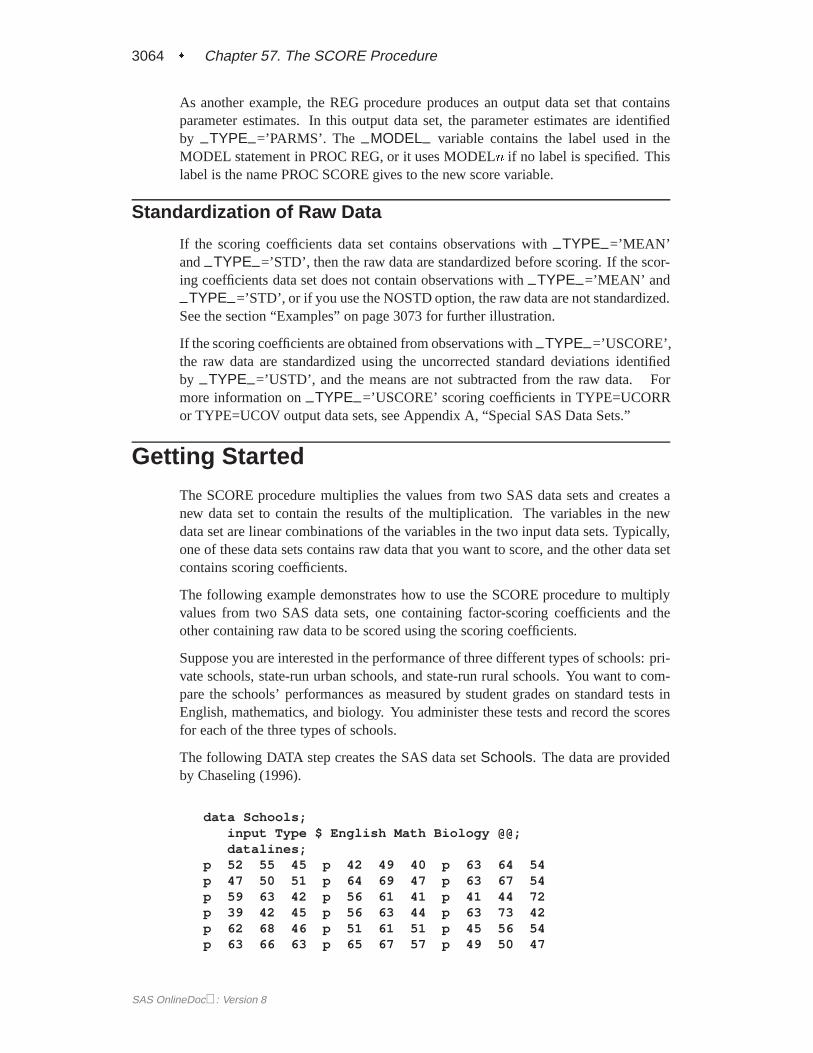
Suppose you are interested in the performance of three different types of schools: pri-vate schools, state-run urban schools, and state-run rural schools. You want to com-pare the schools’ performances as measured by student grades on standard tests inEnglish, mathematics, and biology. You administer these tests and record the scoresfor each of the three types of schools.
The following DATA step creates the SAS data setSchools. The data are providedby Chaseling (1996).
data Schools;input Type $ English Math Biology @@;datalines;
p 52 55 45 p 42 49 40 p 63 64 54p 47 50 51 p 64 69 47 p 63 67 54p 59 63 42 p 56 61 41 p 41 44 72p 39 42 45 p 56 63 44 p 63 73 42p 62 68 46 p 51 61 51 p 45 56 54p 63 66 63 p 65 67 57 p 49 50 47
SAS OnlineDoc: Version 8
Getting Started � 3065
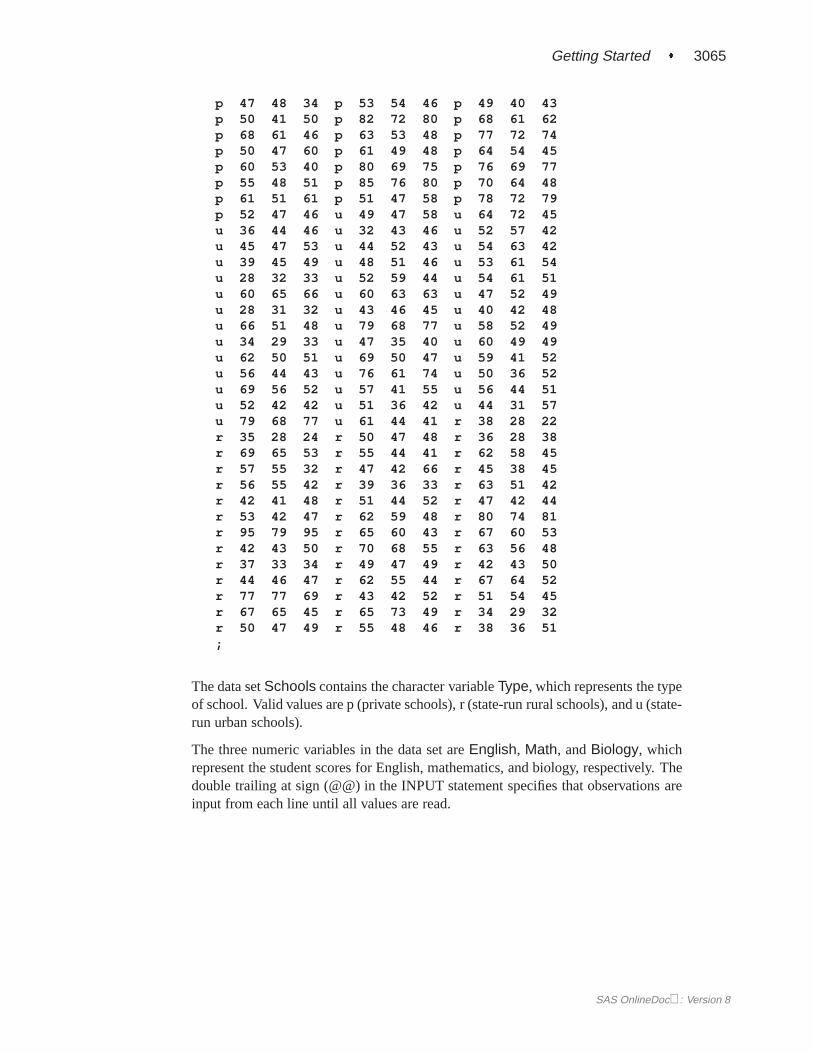
p 47 48 34 p 53 54 46 p 49 40 43p 50 41 50 p 82 72 80 p 68 61 62p 68 61 46 p 63 53 48 p 77 72 74p 50 47 60 p 61 49 48 p 64 54 45p 60 53 40 p 80 69 75 p 76 69 77p 55 48 51 p 85 76 80 p 70 64 48p 61 51 61 p 51 47 58 p 78 72 79p 52 47 46 u 49 47 58 u 64 72 45u 36 44 46 u 32 43 46 u 52 57 42u 45 47 53 u 44 52 43 u 54 63 42u 39 45 49 u 48 51 46 u 53 61 54u 28 32 33 u 52 59 44 u 54 61 51u 60 65 66 u 60 63 63 u 47 52 49u 28 31 32 u 43 46 45 u 40 42 48u 66 51 48 u 79 68 77 u 58 52 49u 34 29 33 u 47 35 40 u 60 49 49u 62 50 51 u 69 50 47 u 59 41 52u 56 44 43 u 76 61 74 u 50 36 52u 69 56 52 u 57 41 55 u 56 44 51u 52 42 42 u 51 36 42 u 44 31 57u 79 68 77 u 61 44 41 r 38 28 22r 35 28 24 r 50 47 48 r 36 28 38r 69 65 53 r 55 44 41 r 62 58 45r 57 55 32 r 47 42 66 r 45 38 45r 56 55 42 r 39 36 33 r 63 51 42r 42 41 48 r 51 44 52 r 47 42 44r 53 42 47 r 62 59 48 r 80 74 81r 95 79 95 r 65 60 43 r 67 60 53r 42 43 50 r 70 68 55 r 63 56 48r 37 33 34 r 49 47 49 r 42 43 50r 44 46 47 r 62 55 44 r 67 64 52r 77 77 69 r 43 42 52 r 51 54 45r 67 65 45 r 65 73 49 r 34 29 32r 50 47 49 r 55 48 46 r 38 36 51;
The data setSchools contains the character variableType, which represents the typeof school. Valid values are p (private schools), r (state-run rural schools), and u (state-run urban schools).
The three numeric variables in the data set areEnglish, Math, andBiology, whichrepresent the student scores for English, mathematics, and biology, respectively. Thedouble trailing at sign (@@) in the INPUT statement specifies that observations areinput from each line until all values are read.
SAS OnlineDoc: Version 8
3066 � Chapter 57. The SCORE Procedure
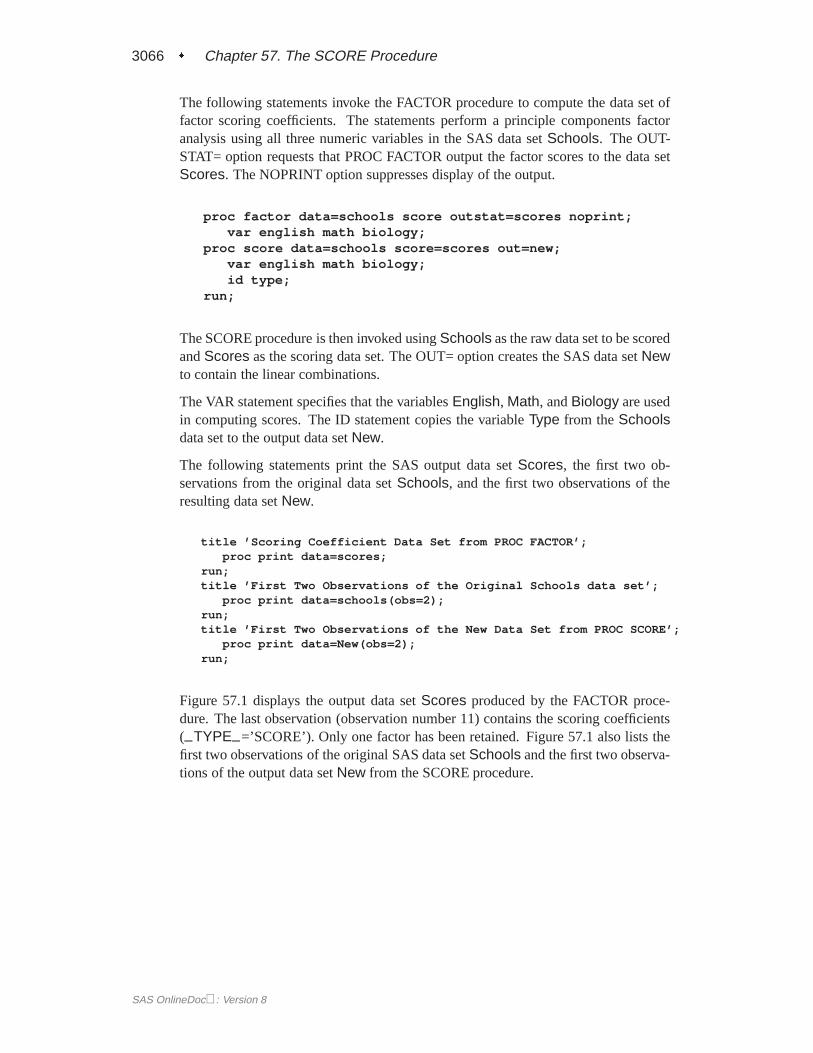
The following statements invoke the FACTOR procedure to compute the data set offactor scoring coefficients. The statements perform a principle components factoranalysis using all three numeric variables in the SAS data setSchools. The OUT-STAT= option requests that PROC FACTOR output the factor scores to the data setScores. The NOPRINT option suppresses display of the output.
proc factor data=schools score outstat=scores noprint;var english math biology;
proc score data=schools score=scores out=new;var english math biology;id type;
run;
The SCORE procedure is then invoked usingSchools as the raw data set to be scoredandScores as the scoring data set. The OUT= option creates the SAS data setNewto contain the linear combinations.
The VAR statement specifies that the variablesEnglish, Math, andBiology are usedin computing scores. The ID statement copies the variableType from theSchoolsdata set to the output data setNew.
The following statements print the SAS output data setScores, the first two ob-servations from the original data setSchools, and the first two observations of theresulting data setNew.
title ’Scoring Coefficient Data Set from PROC FACTOR’;proc print data=scores;
run;title ’First Two Observations of the Original Schools data set’;
proc print data=schools(obs=2);run;title ’First Two Observations of the New Data Set from PROC SCORE’;
proc print data=New(obs=2);run;
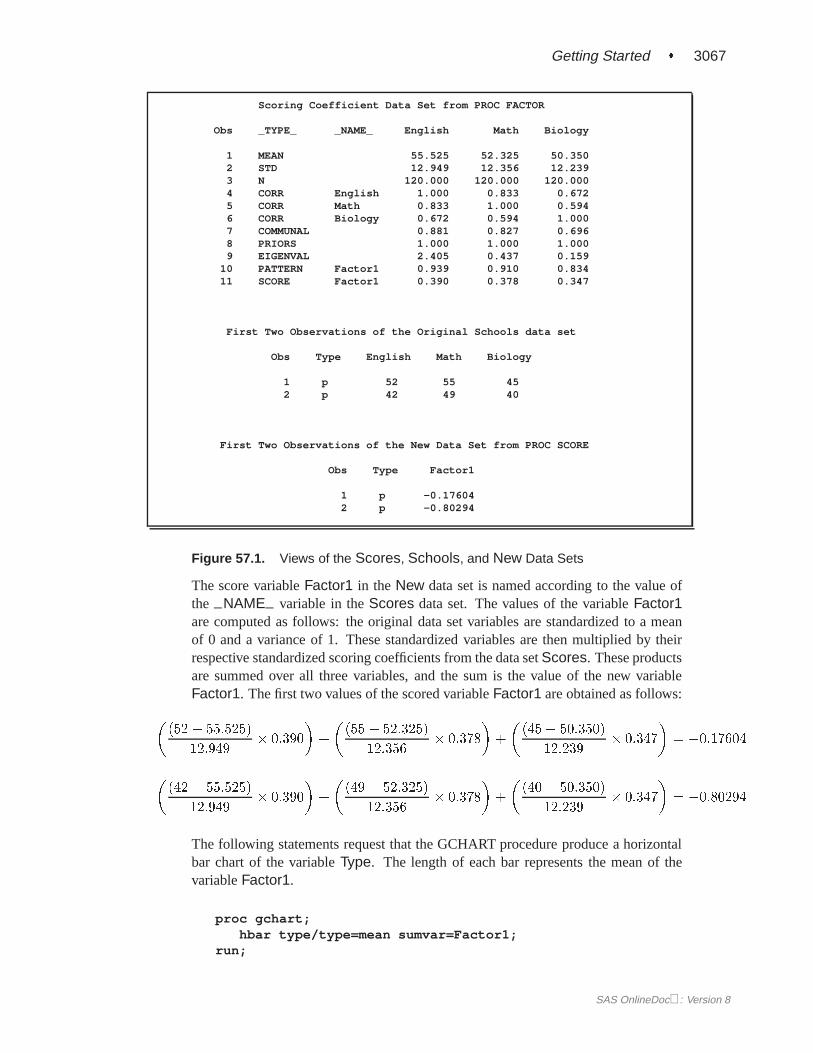
Figure 57.1 displays the output data setScores produced by the FACTOR proce-dure. The last observation (observation number 11) contains the scoring coefficients(–TYPE–=’SCORE’). Only one factor has been retained. Figure 57.1 also lists thefirst two observations of the original SAS data setSchools and the first two observa-tions of the output data setNew from the SCORE procedure.
SAS OnlineDoc: Version 8
Getting Started � 3067
Scoring Coefficient Data Set from PROC FACTOR
Obs _TYPE_ _NAME_ English Math Biology
1 MEAN 55.525 52.325 50.3502 STD 12.949 12.356 12.2393 N 120.000 120.000 120.0004 CORR English 1.000 0.833 0.6725 CORR Math 0.833 1.000 0.5946 CORR Biology 0.672 0.594 1.0007 COMMUNAL 0.881 0.827 0.6968 PRIORS 1.000 1.000 1.0009 EIGENVAL 2.405 0.437 0.159
10 PATTERN Factor1 0.939 0.910 0.83411 SCORE Factor1 0.390 0.378 0.347
First Two Observations of the Original Schools data set
Obs Type English Math Biology
1 p 52 55 452 p 42 49 40
First Two Observations of the New Data Set from PROC SCORE
Obs Type Factor1
1 p -0.176042 p -0.80294
Figure 57.1. Views of the Scores, Schools, and New Data Sets
The score variableFactor1 in the New data set is named according to the value ofthe –NAME– variable in theScores data set. The values of the variableFactor1are computed as follows: the original data set variables are standardized to a meanof 0 and a variance of 1. These standardized variables are then multiplied by theirrespective standardized scoring coefficients from the data setScores. These productsare summed over all three variables, and the sum is the value of the new variableFactor1. The first two values of the scored variableFactor1 are obtained as follows:
�(52 � 55:525)
12:949� 0:390
�+
�(55 � 52:325)
12:356� 0:378
�+
�(45� 50:350)
12:239� 0:347
�= �0:17604
�(42 � 55:525)
12:949� 0:390
�+
�(49 � 52:325)
12:356� 0:378
�+
�(40� 50:350)
12:239� 0:347
�= �0:80294
The following statements request that the GCHART procedure produce a horizontalbar chart of the variableType. The length of each bar represents the mean of thevariableFactor1.
proc gchart;hbar type/type=mean sumvar=Factor1;
run;
SAS OnlineDoc: Version 8
3068 � Chapter 57. The SCORE Procedure
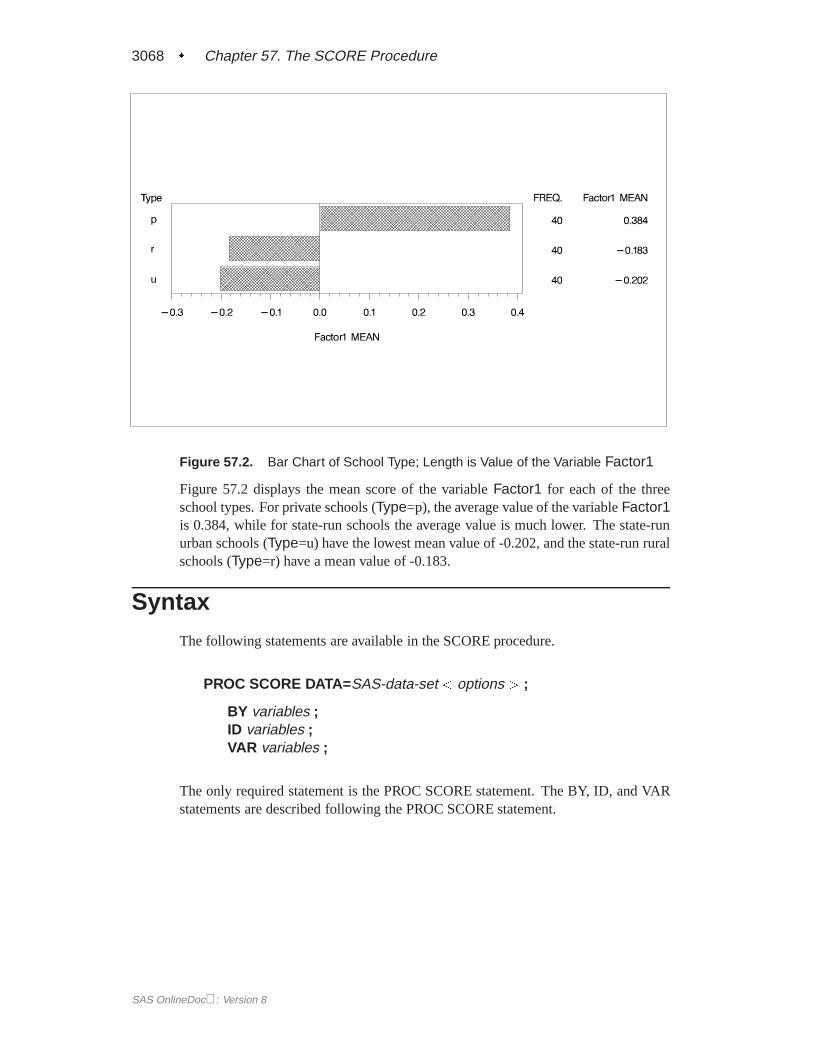
Figure 57.2. Bar Chart of School Type; Length is Value of the Variable Factor1
Figure 57.2 displays the mean score of the variableFactor1 for each of the threeschool types. For private schools (Type=p), the average value of the variableFactor1is 0.384, while for state-run schools the average value is much lower. The state-runurban schools (Type=u) have the lowest mean value of -0.202, and the state-run ruralschools (Type=r) have a mean value of -0.183.
Syntax
The following statements are available in the SCORE procedure.
PROC SCORE DATA=SAS-data-set < options > ;
BY variables ;ID variables ;VAR variables ;
The only required statement is the PROC SCORE statement. The BY, ID, and VARstatements are described following the PROC SCORE statement.
SAS OnlineDoc: Version 8
PROC SCORE Statement � 3069
PROC SCORE Statement
PROC SCORE DATA=SAS-data-set < options > ;
You can specify the following options in the PROC SCORE statement.
DATA=SAS-data-setnames the input SAS data set containing the raw data to score. This specification isrequired.
NOSTDsuppresses centering and scaling of the raw data. Ordinarily, if PROCSCORE finds–TYPE–=‘MEAN’, –TYPE–= ‘USCORE’, –TYPE–=‘USTD’,or –TYPE–=‘STD’ observations in the SCORE= data set, the procedure uses theseto standardize the raw data before scoring.
OUT=SAS-data-setspecifies the name of the SAS data set created by PROC SCORE. If you want tocreate a permanent SAS data set, you must specify a two-level name. (Refer to “SASFiles” in SAS Language Reference: Conceptsfor more information on permanentSAS data sets.) If the OUT= option is omitted, PROC SCORE still creates an outputdata set and automatically names it according to the DATAn convention, just as ifyou omitted a data set name in a DATA statement.
PREDICTspecifies that PROC SCORE should treat coefficients of�1 in the SCORE= data setas 0. In regression applications, the dependent variable is coded with a coefficient of�1. Applied directly to regression results, PROC SCORE produces negative resid-uals (see the description of the RESIDUAL option, which follows); the PREDICToption produces predicted values instead.
RESIDUALreverses the sign of each score. Applied directly to regression results, PROC SCOREproduces negative residuals (PREDICT�ACTUAL); the RESIDUAL option pro-duces positive residuals (ACTUAL�PREDICT) instead.
SCORE=SAS-data-setnames the data set containing the scoring coefficients. If you omit the SCORE=option, the most recently created SAS data set is used. This data set must have twospecial variables:–TYPE– and either–NAME– or –MODEL– .
TYPE=name | ‘string’specifies the observations in the SCORE= data set that contain scoring coefficients.The TYPE= procedure option is unrelated to the data set option that has the samename. PROC SCORE examines the values of the special variable–TYPE– in theSCORE= data set. When the value of–TYPE– matches TYPE=name, the observa-tion in the SCORE= data set is used to score the raw data in the DATA= data set.
SAS OnlineDoc: Version 8

3070 � Chapter 57. The SCORE Procedure
If you omit the TYPE= option, scoring coefficients are read from observations witheither–TYPE–=’SCORE’ or–TYPE–=’USCORE’. Because the default for PROCSCORE is TYPE=SCORE, you need not specify the TYPE= option for factor scoringor for computing scores from OUTSTAT= data sets from the CANCORR, CANDISC,PRINCOMP, or VARCLUS procedure. When you use regression coefficients fromPROC REG, specify TYPE=PARMS.
The maximum length of the argument specified in the TYPE= option depends onthe length defined by the VALIDVARNAME= SAS system option. For additionalinformation, refer toSAS Language Reference: Dictionary.
Note that the TYPE= option setting is not case-sensitive. For example, the two optionsettings, TYPE=’MyScore’ and TYPE=’myscore’, are equivalent.
BY Statement
BY variables ;
You can specify a BY statement with PROC SCORE to obtain separate scoring forobservations in groups defined by the BY variables. You can also specify a BY state-ment to apply separate groups of scoring coefficients to the entire DATA= data set.
If your SCORE= input data set is not sorted in ascending order, use one of the fol-lowing alternatives:
� Sort the data using the SORT procedure with a similar BY statement.
� Specify the BY statement option NOTSORTED or DESCENDING in the BYstatement for the SCORE procedure. The NOTSORTED option does not meanthat the data are unsorted but rather that the data are arranged in groups (ac-cording to values of the BY variables) and that these groups are not necessarilyin alphabetical or increasing numeric order.
� Create an index on the BY variables using the DATASETS procedure.
For more information on the BY statement, refer to the discussion inSAS LanguageReference: Concepts. For more information on the DATASETS procedure, refer tothe discussion in theSAS Procedures Guide.
If the DATA= data set does not contain any of the BY variables, the entire DATA=data set is scored by each BY group of scoring coefficients in the SCORE= data set.
If the DATA= data set contains some but not all of the BY variables, or if someBY variables do not have the same type or length in the DATA= data set as in theSCORE= data set, then PROC SCORE prints an error message and stops.
If all the BY variables appear in the DATA= data set with the same type and length asin the SCORE= data set, then each BY group in the DATA= data set is scored usingscoring coefficients from the corresponding BY group in the SCORE= data set. TheBY groups in the DATA= data set must be in the same order as in the SCORE= data
SAS OnlineDoc: Version 8
Missing Values � 3071
set. All BY groups in the DATA= data set must also appear in the SCORE= data set.If you do not specify the NOTSORTED option, some BY groups can appear in theSCORE= data set but not in the DATA= data set; such BY groups are not used incomputing scores.
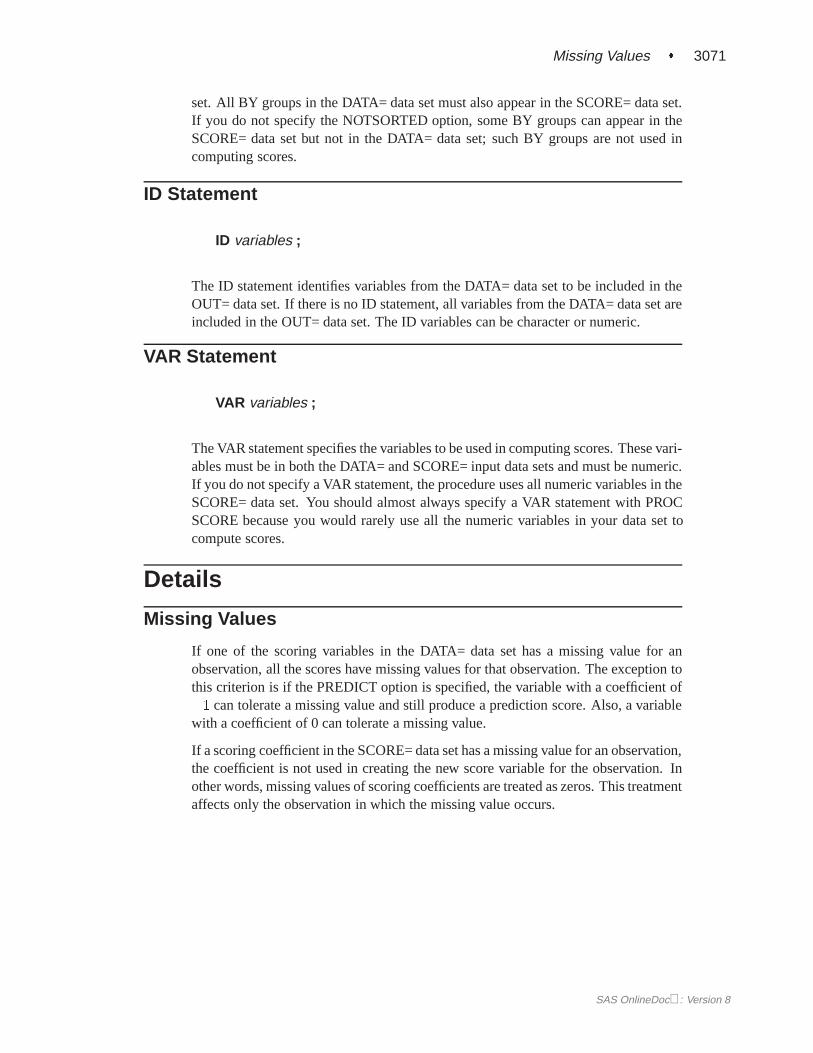
ID Statement
ID variables ;
The ID statement identifies variables from the DATA= data set to be included in theOUT= data set. If there is no ID statement, all variables from the DATA= data set areincluded in the OUT= data set. The ID variables can be character or numeric.
VAR Statement
VAR variables ;
The VAR statement specifies the variables to be used in computing scores. These vari-ables must be in both the DATA= and SCORE= input data sets and must be numeric.If you do not specify a VAR statement, the procedure uses all numeric variables in theSCORE= data set. You should almost always specify a VAR statement with PROCSCORE because you would rarely use all the numeric variables in your data set tocompute scores.
Details
Missing Values
If one of the scoring variables in the DATA= data set has a missing value for anobservation, all the scores have missing values for that observation. The exception tothis criterion is if the PREDICT option is specified, the variable with a coefficient of�1 can tolerate a missing value and still produce a prediction score. Also, a variablewith a coefficient of 0 can tolerate a missing value.
If a scoring coefficient in the SCORE= data set has a missing value for an observation,the coefficient is not used in creating the new score variable for the observation. Inother words, missing values of scoring coefficients are treated as zeros. This treatmentaffects only the observation in which the missing value occurs.
SAS OnlineDoc: Version 8

3072 � Chapter 57. The SCORE Procedure
Regression Parameter Estimates from PROC REG
If the SCORE= data set is an OUTEST= data set produced by PROC REG and ifyou specify TYPE=PARMS, the interpretation of the new score variables depends onthe PROC SCORE options chosen and the variables listed in the VAR statement. Ifthe VAR statement contains only the independent variables used in a model in PROCREG, the new score variables give the predicted values. If the VAR statement containsthe dependent variables and the independent variables used in a model in PROC REG,the interpretation of the new score variables depends on the PROC SCORE optionschosen. If you omit both the PREDICT and the RESIDUAL options, the new scorevariables give negative residuals (PREDICT�ACTUAL). If you specify the RESID-UAL option, the new score variables give positive residuals (ACTUAL�PREDICT).If you specify the PREDICT option, the new score variables give predicted values.
Unless you specify the NOINT option for PROC REG, the OUTEST= data set con-tains the variableINTERCEPT. The SCORE procedure uses theINTERCEPT valuein computing the scores.
Output Data Set
PROC SCORE produces an output data set but displays no output. The output OUT=data set contains the following:
� the ID variables, if any
� all variables from the DATA= data set, if no ID variables are specified
� the BY variables, if any
� the new score variables, named from the–NAME– or –MODEL– values inthe SCORE= data set
Computational Resources
Let
v = number of variables used in computing scores
s = number of new score variables
b = maximum number of new score variables in a BY group
n = number of observations
MemoryThe array storage required is approximately8(4v+(3+v)b+s) bytes. When you donot use BY processing, the array storage required is approximately8(4v + (4 + v)s)bytes.
TimeThe time required to construct the scoring matrix is roughly proportional tovs andthe time needed to compute the scores is roughly proportional tonvs.
SAS OnlineDoc: Version 8
Example 57.1. Factor Scoring Coefficients � 3073
Examples
The following three examples use a subset of theFitness data set. The complete dataset is given in Chapter 55, “The REG Procedure.”
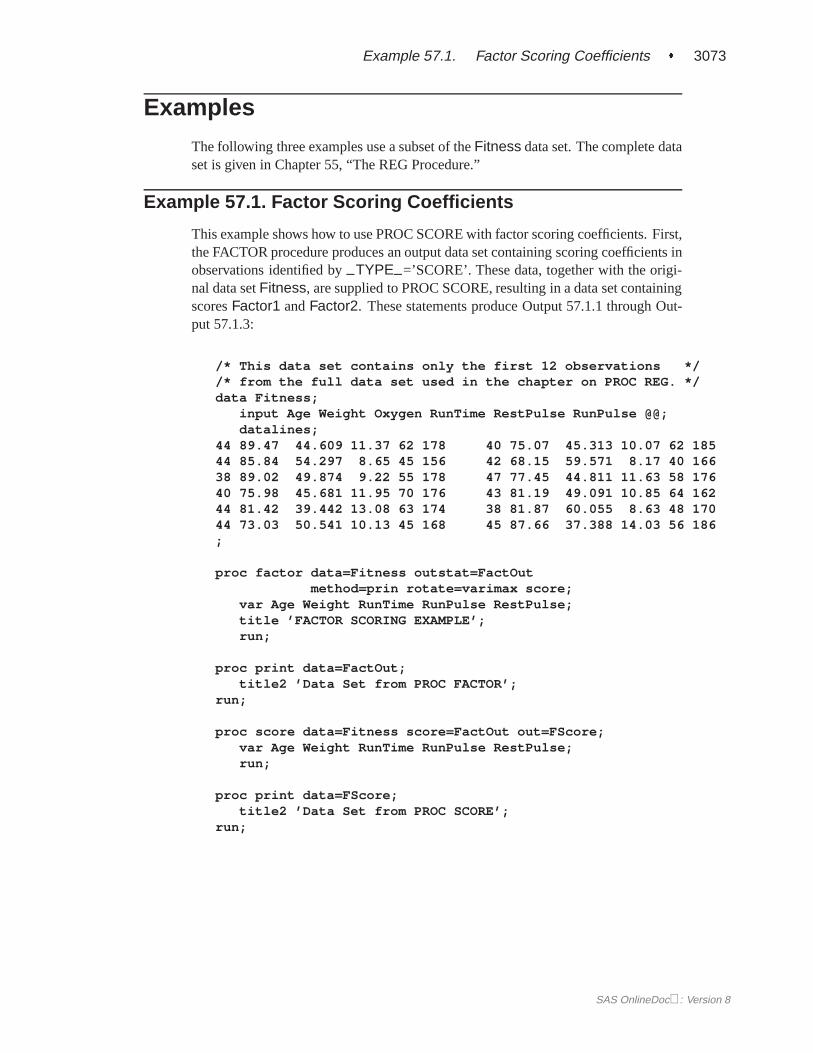
Example 57.1. Factor Scoring Coefficients
This example shows how to use PROC SCORE with factor scoring coefficients. First,the FACTOR procedure produces an output data set containing scoring coefficients inobservations identified by–TYPE–=’SCORE’. These data, together with the origi-nal data setFitness, are supplied to PROC SCORE, resulting in a data set containingscoresFactor1 andFactor2. These statements produce Output 57.1.1 through Out-put 57.1.3:
/* This data set contains only the first 12 observations *//* from the full data set used in the chapter on PROC REG. */data Fitness;
input Age Weight Oxygen RunTime RestPulse RunPulse @@;datalines;
44 89.47 44.609 11.37 62 178 40 75.07 45.313 10.07 62 18544 85.84 54.297 8.65 45 156 42 68.15 59.571 8.17 40 16638 89.02 49.874 9.22 55 178 47 77.45 44.811 11.63 58 17640 75.98 45.681 11.95 70 176 43 81.19 49.091 10.85 64 16244 81.42 39.442 13.08 63 174 38 81.87 60.055 8.63 48 17044 73.03 50.541 10.13 45 168 45 87.66 37.388 14.03 56 186;
proc factor data=Fitness outstat=FactOutmethod=prin rotate=varimax score;
var Age Weight RunTime RunPulse RestPulse;title ’FACTOR SCORING EXAMPLE’;run;
proc print data=FactOut;title2 ’Data Set from PROC FACTOR’;
run;
proc score data=Fitness score=FactOut out=FScore;var Age Weight RunTime RunPulse RestPulse;run;
proc print data=FScore;title2 ’Data Set from PROC SCORE’;
run;
SAS OnlineDoc: Version 8

3074 � Chapter 57. The SCORE Procedure
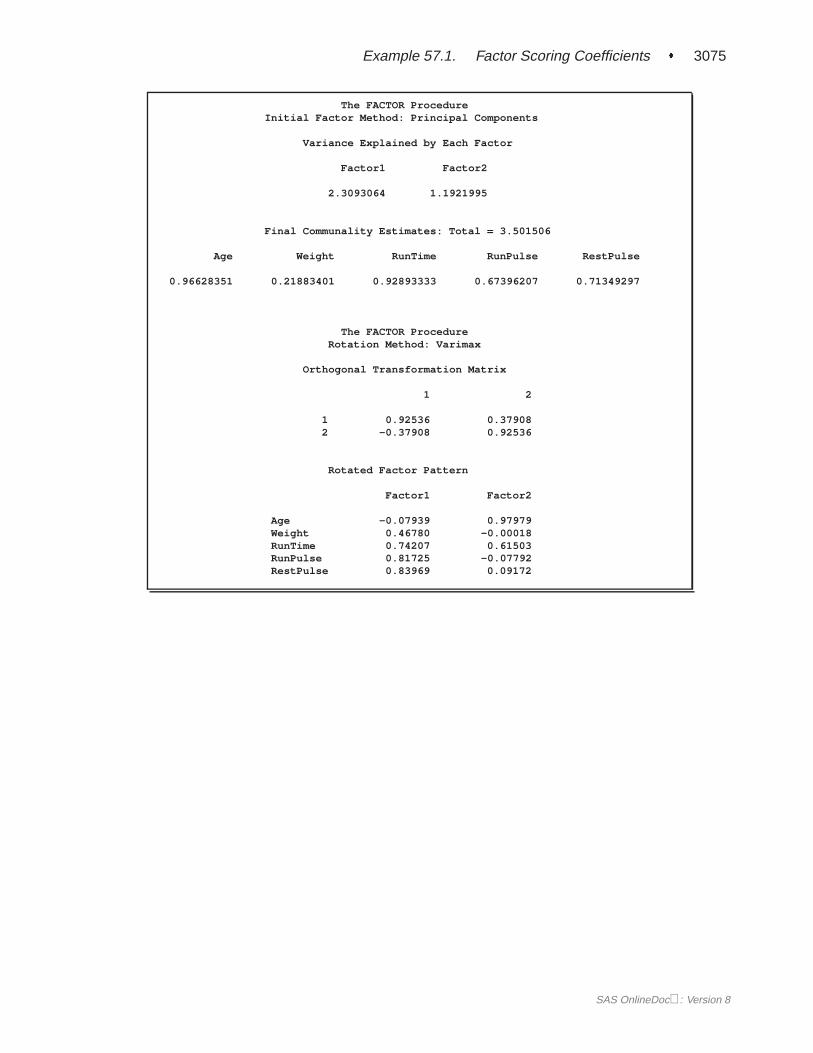
Output 57.1.1 shows the PROC FACTOR output. The scoring coefficients for the twofactors are shown at the end of the PROC FACTOR output.
Output 57.1.1. Creating an OUTSTAT= Data Set with PROC FACTOR
FACTOR SCORING EXAMPLE
The FACTOR ProcedureInitial Factor Method: Principal Components
Eigenvalues of the Correlation Matrix: Total = 5 Average = 1
Eigenvalue Difference Proportion Cumulative
1 2.30930638 1.11710686 0.4619 0.46192 1.19219952 0.30997249 0.2384 0.70033 0.88222702 0.37965990 0.1764 0.87674 0.50256713 0.38886717 0.1005 0.97735 0.11369996 0.0227 1.0000
Factor Pattern
Factor1 Factor2
Age 0.29795 0.93675Weight 0.43282 -0.17750RunTime 0.91983 0.28782RunPulse 0.72671 -0.38191RestPulse 0.81179 -0.23344
SAS OnlineDoc: Version 8
Example 57.1. Factor Scoring Coefficients � 3075
The FACTOR ProcedureInitial Factor Method: Principal Components
Variance Explained by Each Factor
Factor1 Factor2
2.3093064 1.1921995
Final Communality Estimates: Total = 3.501506
Age Weight RunTime RunPulse RestPulse
0.96628351 0.21883401 0.92893333 0.67396207 0.71349297
The FACTOR ProcedureRotation Method: Varimax
Orthogonal Transformation Matrix
1 2
1 0.92536 0.379082 -0.37908 0.92536
Rotated Factor Pattern
Factor1 Factor2
Age -0.07939 0.97979Weight 0.46780 -0.00018RunTime 0.74207 0.61503RunPulse 0.81725 -0.07792RestPulse 0.83969 0.09172
SAS OnlineDoc: Version 8
3076 � Chapter 57. The SCORE Procedure
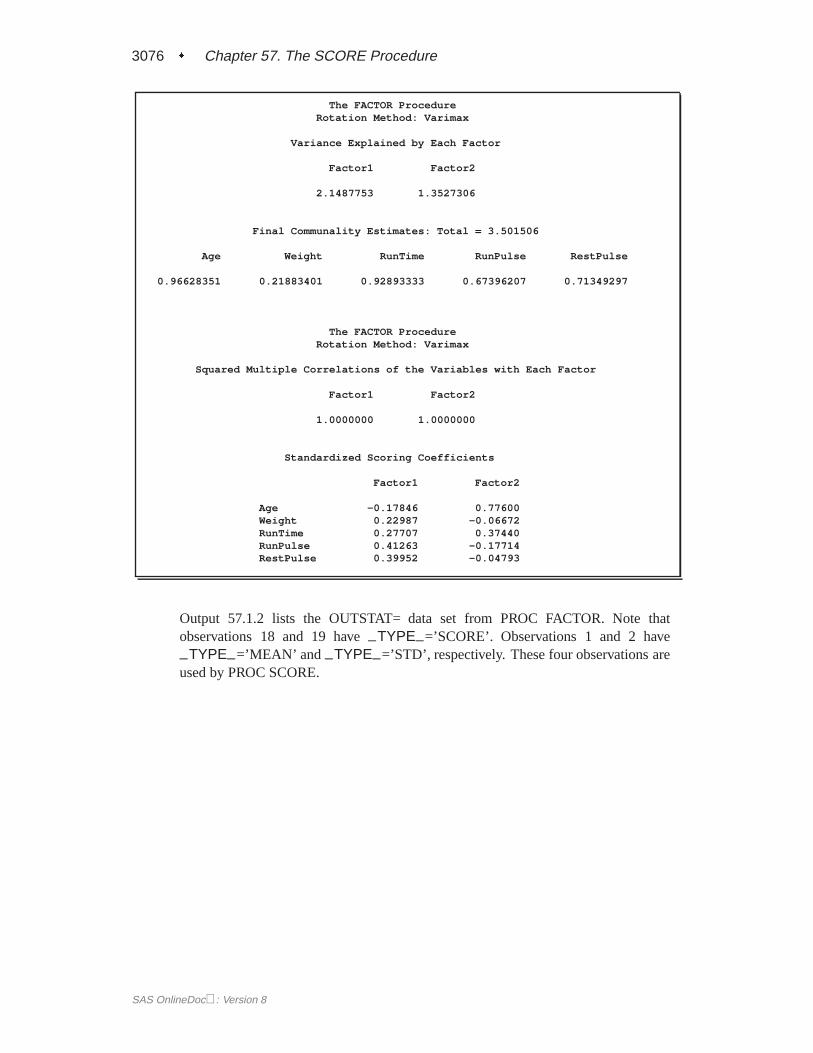
The FACTOR ProcedureRotation Method: Varimax
Variance Explained by Each Factor
Factor1 Factor2
2.1487753 1.3527306
Final Communality Estimates: Total = 3.501506
Age Weight RunTime RunPulse RestPulse
0.96628351 0.21883401 0.92893333 0.67396207 0.71349297
The FACTOR ProcedureRotation Method: Varimax
Squared Multiple Correlations of the Variables with Each Factor
Factor1 Factor2
1.0000000 1.0000000
Standardized Scoring Coefficients
Factor1 Factor2
Age -0.17846 0.77600Weight 0.22987 -0.06672RunTime 0.27707 0.37440RunPulse 0.41263 -0.17714RestPulse 0.39952 -0.04793
Output 57.1.2 lists the OUTSTAT= data set from PROC FACTOR. Note thatobservations 18 and 19 have–TYPE–=’SCORE’. Observations 1 and 2 have
–TYPE–=’MEAN’ and –TYPE–=’STD’, respectively. These four observations areused by PROC SCORE.
SAS OnlineDoc: Version 8

Example 57.1. Factor Scoring Coefficients � 3077
Output 57.1.2. OUTSTAT= Data Set from PROC FACTOR Reproduced with PROCPRINT
FACTOR SCORING EXAMPLEData Set from PROC FACTOR
RestObs _TYPE_ _NAME_ Age Weight RunTime RunPulse Pulse
1 MEAN 42.4167 80.5125 10.6483 172.917 55.66672 STD 2.8431 6.7660 1.8444 8.918 9.27693 N 12.0000 12.0000 12.0000 12.000 12.00004 CORR Age 1.0000 0.0128 0.5005 -0.095 -0.00805 CORR Weight 0.0128 1.0000 0.2637 0.173 0.23966 CORR RunTime 0.5005 0.2637 1.0000 0.556 0.66207 CORR RunPulse -0.0953 0.1731 0.5555 1.000 0.48538 CORR RestPulse -0.0080 0.2396 0.6620 0.485 1.00009 COMMUNAL 0.9663 0.2188 0.9289 0.674 0.7135
10 PRIORS 1.0000 1.0000 1.0000 1.000 1.000011 EIGENVAL 2.3093 1.1922 0.8822 0.503 0.113712 UNROTATE Factor1 0.2980 0.4328 0.9198 0.727 0.811813 UNROTATE Factor2 0.9368 -0.1775 0.2878 -0.382 -0.233414 TRANSFOR Factor1 0.9254 -0.3791 . . .15 TRANSFOR Factor2 0.3791 0.9254 . . .16 PATTERN Factor1 -0.0794 0.4678 0.7421 0.817 0.839717 PATTERN Factor2 0.9798 -0.0002 0.6150 -0.078 0.091718 SCORE Factor1 -0.1785 0.2299 0.2771 0.413 0.399519 SCORE Factor2 0.7760 -0.0667 0.3744 -0.177 -0.0479
Since the PROC SCORE statement does not contain the NOSTD option, the data inthe Fitness data set are standardized before scoring. For each variable specified inthe VAR statement, the mean and standard deviation are obtained from theFactOutdata set. For each observation in theFitness data set, the variables are then stan-dardized. For example, for observation 1 in theFitness data set, the variableAge isstandardized to0:5569 = [(44 � 42:4167)=2:8431].
After the data in theFitness data set are standardized, the standardized values ofthe variables in the VAR statement are multiplied by the matching coefficients in theFactOut data set, and the resulting products are summed. This sum is output as avalue of the new score variable.
Output 57.1.3 displays theFScore data set produced by PROC SCORE. This dataset contains the variablesAge, Weight, Oxygen, RunTime, RestPulse, andRun-Pulse from theFitness data set. It also containsFactor1 andFactor2, the two newscore variables.
SAS OnlineDoc: Version 8

3078 � Chapter 57. The SCORE Procedure
Output 57.1.3. OUT= Data Set from PROC SCORE Reproduced with PROCPRINT
FACTOR SCORING EXAMPLEData Set from PROC SCORE
Run Rest RunObs Age Weight Oxygen Time Pulse Pulse Factor1 Factor2
1 44 89.47 44.609 11.37 62 178 0.82129 0.356632 40 75.07 45.313 10.07 62 185 0.71173 -0.996053 44 85.84 54.297 8.65 45 156 -1.46064 0.365084 42 68.15 59.571 8.17 40 166 -1.76087 -0.276575 38 89.02 49.874 9.22 55 178 0.55819 -1.676846 47 77.45 44.811 11.63 58 176 -0.00113 1.407157 40 75.98 45.681 11.95 70 176 0.95318 -0.485988 43 81.19 49.091 10.85 64 162 -0.12951 0.367249 44 81.42 39.442 13.08 63 174 0.66267 0.85740
10 38 81.87 60.055 8.63 48 170 -0.44496 -1.5310311 44 73.03 50.541 10.13 45 168 -1.11832 0.5534912 45 87.66 37.388 14.03 56 186 1.20836 1.05948
Example 57.2. Regression Parameter Estimates
In this example, PROC REG computes regression parameter estimates for theFit-ness data. (See Example 57.1 to create theFitness data set.) The parameter esti-mates are output to a data set and used as scoring coefficients. For the first part ofthis example, PROC SCORE is used to score theFitness data, which are the samedata used in the regression.
In the second part of this example, PROC SCORE is used to score a new data set,Fitness2. For PROC SCORE, the TYPE= specification is PARMS, and the names ofthe score variables are found in the variable–MODEL– , which gets its values fromthe model label. The following code produces Output 57.2.1 through Output 57.2.3:
proc reg data=Fitness outest=RegOut;OxyHat: model Oxygen=Age Weight RunTime RunPulse RestPulse;
title ’REGRESSION SCORING EXAMPLE’;run;
proc print data=RegOut;title2 ’OUTEST= Data Set from PROC REG’;
run;
proc score data=Fitness score=RegOut out=RScoreP type=parms;var Age Weight RunTime RunPulse RestPulse;
run;
proc print data=RScoreP;title2 ’Predicted Scores for Regression’;
run;
proc score data=Fitness score=RegOut out=RScoreR type=parms;var Oxygen Age Weight RunTime RunPulse RestPulse;
run;
SAS OnlineDoc: Version 8
Example 57.2. Regression Parameter Estimates � 3079
proc print data=RScoreR;title2 ’Negative Residual Scores for Regression’;
run;
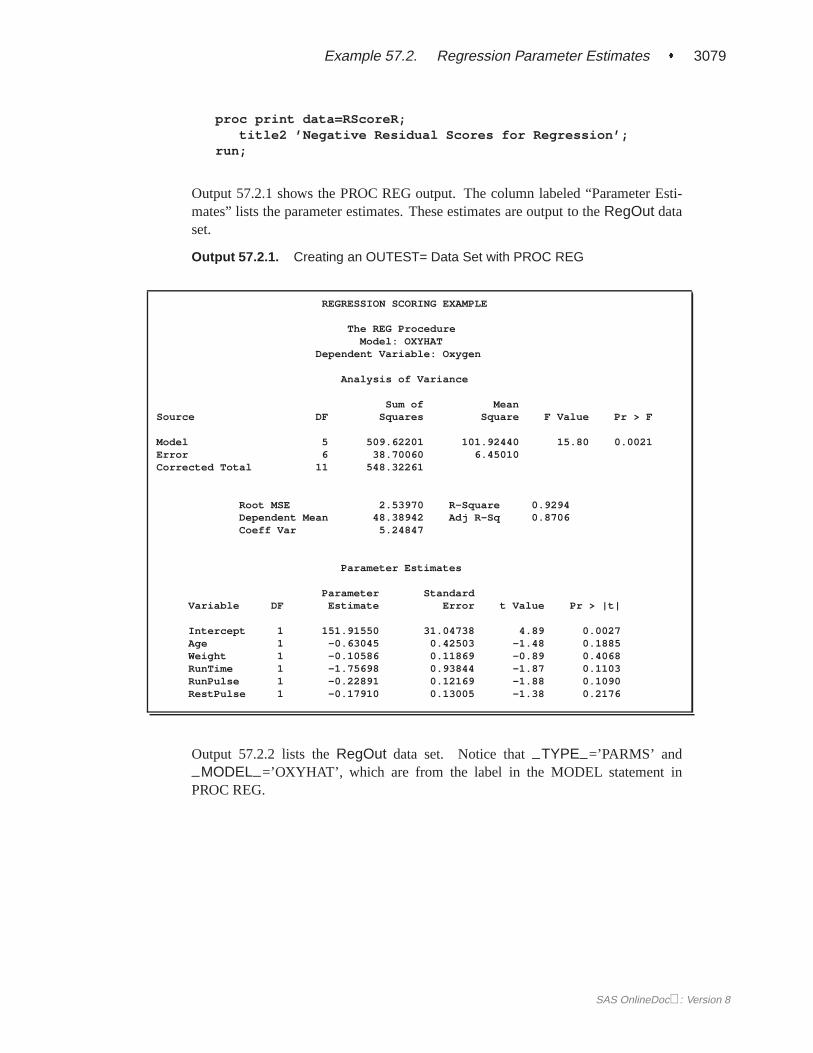
Output 57.2.1 shows the PROC REG output. The column labeled “Parameter Esti-mates” lists the parameter estimates. These estimates are output to theRegOut dataset.
Output 57.2.1. Creating an OUTEST= Data Set with PROC REG
REGRESSION SCORING EXAMPLE
The REG ProcedureModel: OXYHAT
Dependent Variable: Oxygen
Analysis of Variance
Sum of MeanSource DF Squares Square F Value Pr > F
Model 5 509.62201 101.92440 15.80 0.0021Error 6 38.70060 6.45010Corrected Total 11 548.32261
Root MSE 2.53970 R-Square 0.9294Dependent Mean 48.38942 Adj R-Sq 0.8706Coeff Var 5.24847
Parameter Estimates
Parameter StandardVariable DF Estimate Error t Value Pr > |t|
Intercept 1 151.91550 31.04738 4.89 0.0027Age 1 -0.63045 0.42503 -1.48 0.1885Weight 1 -0.10586 0.11869 -0.89 0.4068RunTime 1 -1.75698 0.93844 -1.87 0.1103RunPulse 1 -0.22891 0.12169 -1.88 0.1090RestPulse 1 -0.17910 0.13005 -1.38 0.2176
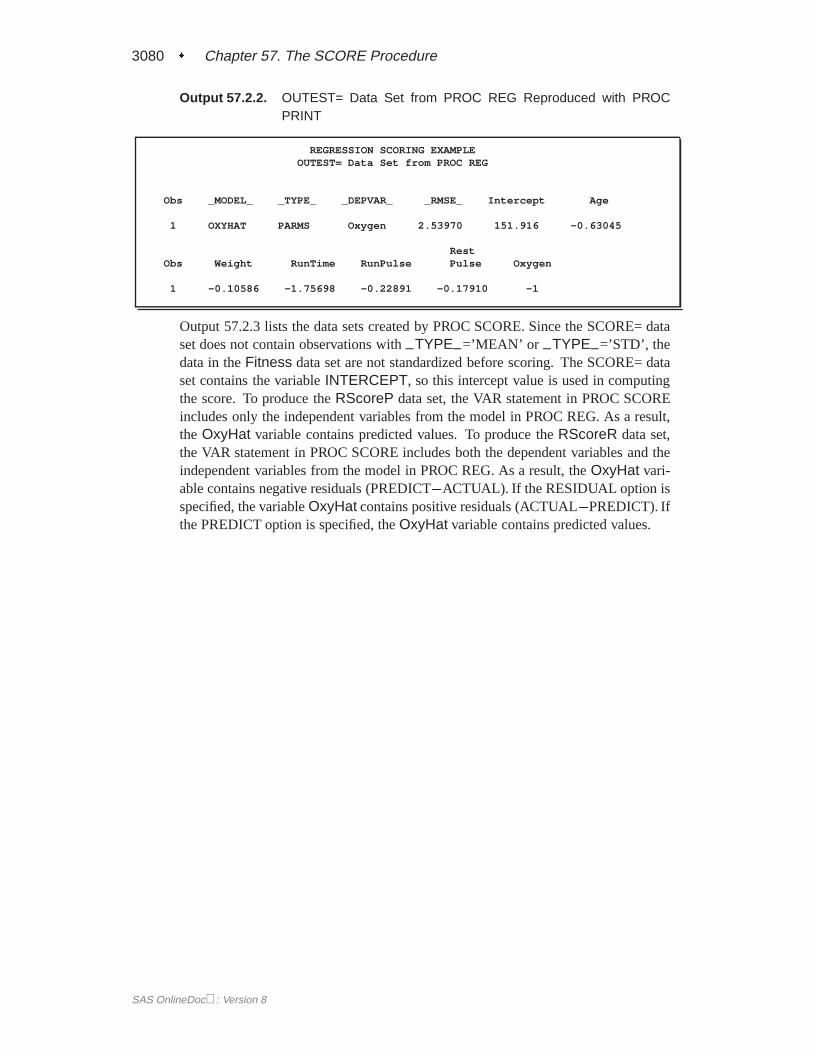
Output 57.2.2 lists theRegOut data set. Notice that–TYPE–=’PARMS’ and
–MODEL–=’OXYHAT’, which are from the label in the MODEL statement inPROC REG.
SAS OnlineDoc: Version 8
3080 � Chapter 57. The SCORE Procedure
Output 57.2.2. OUTEST= Data Set from PROC REG Reproduced with PROCPRINT
REGRESSION SCORING EXAMPLEOUTEST= Data Set from PROC REG
Obs _MODEL_ _TYPE_ _DEPVAR_ _RMSE_ Intercept Age
1 OXYHAT PARMS Oxygen 2.53970 151.916 -0.63045
RestObs Weight RunTime RunPulse Pulse Oxygen
1 -0.10586 -1.75698 -0.22891 -0.17910 -1
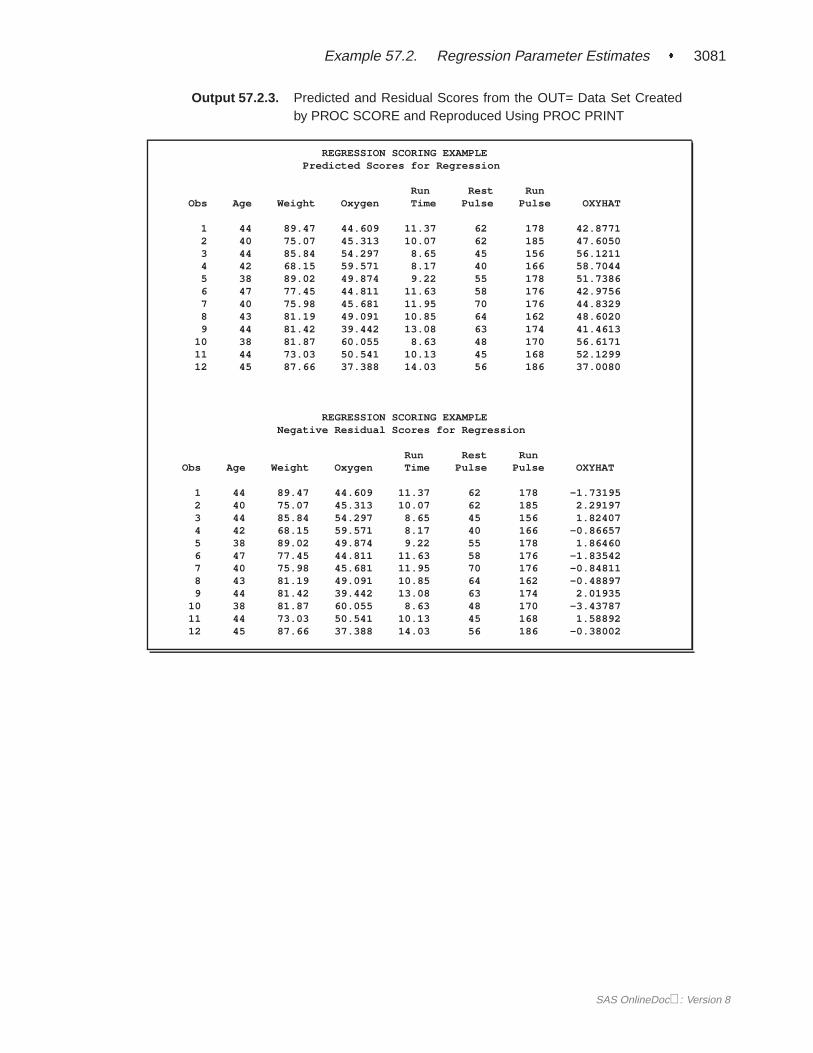
Output 57.2.3 lists the data sets created by PROC SCORE. Since the SCORE= dataset does not contain observations with–TYPE–=’MEAN’ or –TYPE–=’STD’, thedata in theFitness data set are not standardized before scoring. The SCORE= dataset contains the variableINTERCEPT, so this intercept value is used in computingthe score. To produce theRScoreP data set, the VAR statement in PROC SCOREincludes only the independent variables from the model in PROC REG. As a result,the OxyHat variable contains predicted values. To produce theRScoreR data set,the VAR statement in PROC SCORE includes both the dependent variables and theindependent variables from the model in PROC REG. As a result, theOxyHat vari-able contains negative residuals (PREDICT�ACTUAL). If the RESIDUAL option isspecified, the variableOxyHat contains positive residuals (ACTUAL�PREDICT). Ifthe PREDICT option is specified, theOxyHat variable contains predicted values.
SAS OnlineDoc: Version 8
Example 57.2. Regression Parameter Estimates � 3081
Output 57.2.3. Predicted and Residual Scores from the OUT= Data Set Createdby PROC SCORE and Reproduced Using PROC PRINT
REGRESSION SCORING EXAMPLEPredicted Scores for Regression
Run Rest RunObs Age Weight Oxygen Time Pulse Pulse OXYHAT
1 44 89.47 44.609 11.37 62 178 42.87712 40 75.07 45.313 10.07 62 185 47.60503 44 85.84 54.297 8.65 45 156 56.12114 42 68.15 59.571 8.17 40 166 58.70445 38 89.02 49.874 9.22 55 178 51.73866 47 77.45 44.811 11.63 58 176 42.97567 40 75.98 45.681 11.95 70 176 44.83298 43 81.19 49.091 10.85 64 162 48.60209 44 81.42 39.442 13.08 63 174 41.4613
10 38 81.87 60.055 8.63 48 170 56.617111 44 73.03 50.541 10.13 45 168 52.129912 45 87.66 37.388 14.03 56 186 37.0080
REGRESSION SCORING EXAMPLENegative Residual Scores for Regression
Run Rest RunObs Age Weight Oxygen Time Pulse Pulse OXYHAT
1 44 89.47 44.609 11.37 62 178 -1.731952 40 75.07 45.313 10.07 62 185 2.291973 44 85.84 54.297 8.65 45 156 1.824074 42 68.15 59.571 8.17 40 166 -0.866575 38 89.02 49.874 9.22 55 178 1.864606 47 77.45 44.811 11.63 58 176 -1.835427 40 75.98 45.681 11.95 70 176 -0.848118 43 81.19 49.091 10.85 64 162 -0.488979 44 81.42 39.442 13.08 63 174 2.01935
10 38 81.87 60.055 8.63 48 170 -3.4378711 44 73.03 50.541 10.13 45 168 1.5889212 45 87.66 37.388 14.03 56 186 -0.38002
SAS OnlineDoc: Version 8
3082 � Chapter 57. The SCORE Procedure
The second part of this example uses the parameter estimates to score a new data set.The following code produces Output 57.2.4 and Output 57.2.5:
/* The FITNESS2 data set contains observations 13-16 from *//* the FITNESS data set used in EXAMPLE 2 in the PROC REG *//* chapter. */data Fitness2;
input Age Weight Oxygen RunTime RestPulse RunPulse;datalines;
45 66.45 44.754 11.12 51 17647 79.15 47.273 10.60 47 16254 83.12 51.855 10.33 50 16649 81.42 49.156 8.95 44 180;
proc print data=Fitness2;title ’REGRESSION SCORING EXAMPLE’;title2 ’New Raw Data Set to be Scored’;
run;
proc score data=Fitness2 score=RegOut out=NewPred type=parmsnostd predict;
var Oxygen Age Weight RunTime RunPulse RestPulse;run;
proc print data=NewPred;title2 ’Predicted Scores for Regression’;title3 ’for Additional Data from FITNESS2’;
run;
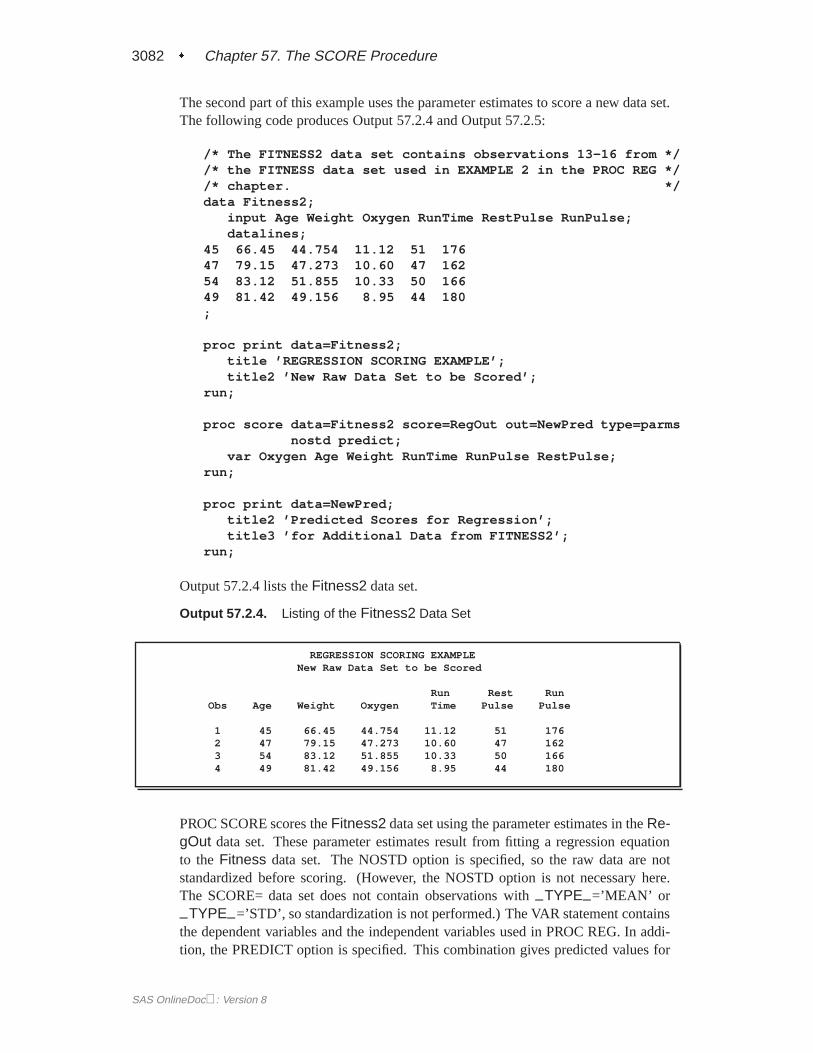
Output 57.2.4 lists theFitness2 data set.
Output 57.2.4. Listing of the Fitness2 Data Set
REGRESSION SCORING EXAMPLENew Raw Data Set to be Scored
Run Rest RunObs Age Weight Oxygen Time Pulse Pulse
1 45 66.45 44.754 11.12 51 1762 47 79.15 47.273 10.60 47 1623 54 83.12 51.855 10.33 50 1664 49 81.42 49.156 8.95 44 180
PROC SCORE scores theFitness2 data set using the parameter estimates in theRe-gOut data set. These parameter estimates result from fitting a regression equationto the Fitness data set. The NOSTD option is specified, so the raw data are notstandardized before scoring. (However, the NOSTD option is not necessary here.The SCORE= data set does not contain observations with–TYPE–=’MEAN’ or
–TYPE–=’STD’, so standardization is not performed.) The VAR statement containsthe dependent variables and the independent variables used in PROC REG. In addi-tion, the PREDICT option is specified. This combination gives predicted values for
SAS OnlineDoc: Version 8

Example 57.3. Custom Scoring Coefficients � 3083
the new score variable. The name of the new score variable isOxyHat, from thevalue of the–MODEL– variable in the SCORE= data set. Output 57.2.5 shows thedata set produced by PROC SCORE.
Output 57.2.5. Predicted Scores from the OUT= Data Set Created by PROCSCORE and Reproduced Using PROC PRINT
REGRESSION SCORING EXAMPLEPredicted Scores for Regression
for Additional Data from FITNESS2
Run Rest RunObs Age Weight Oxygen Time Pulse Pulse OXYHAT
1 45 66.45 44.754 11.12 51 176 47.55072 47 79.15 47.273 10.60 47 162 49.78023 54 83.12 51.855 10.33 50 166 43.96824 49 81.42 49.156 8.95 44 180 47.5949
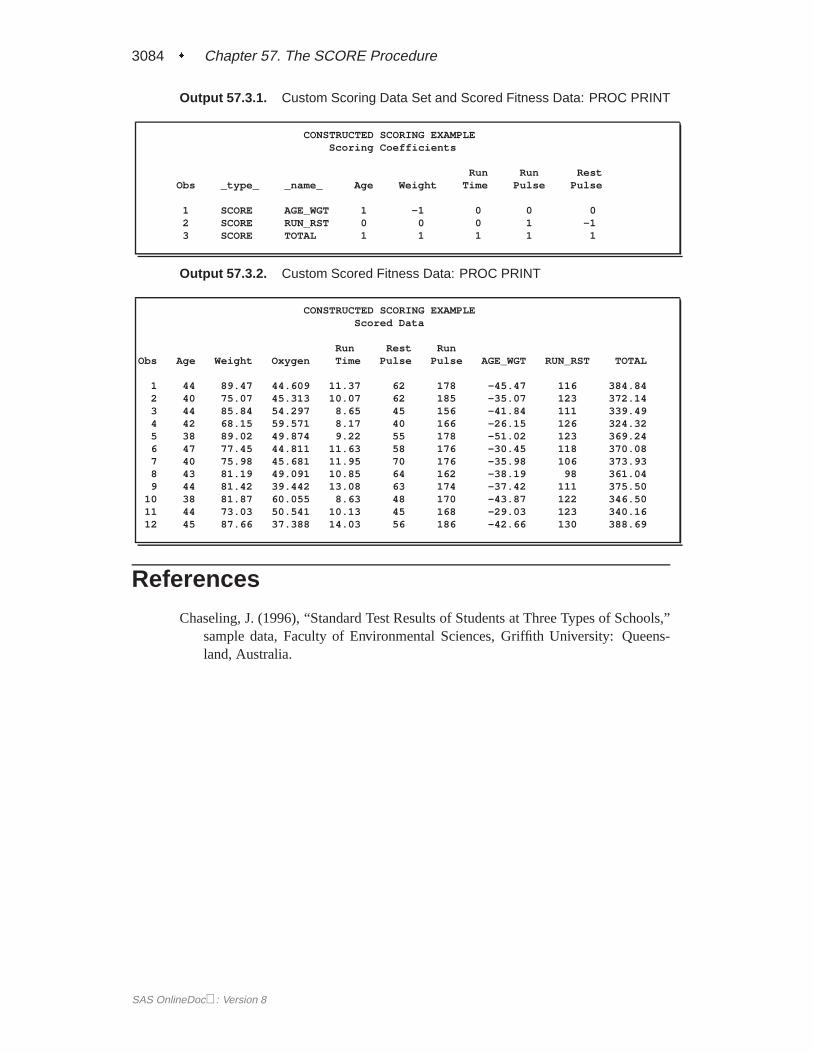
Example 57.3. Custom Scoring Coefficients
This example uses a specially created custom scoring data set and produces Out-put 57.3.1. The first scoring coefficient creates a variable that isAge�Weight;the second scoring coefficient evaluates the variableRunPulse�RstPulse; andthe third scoring coefficient totals all six variables. Since the scoring coefficientsdata set (data setA) does not contain any observations with–TYPE–=’MEAN’ or
–TYPE–=’STD’, the data in theFitness data set (see Example 57.1) are not stan-dardized before scoring.
data A;input _type_ $ _name_ $
Age Weight RunTime RunPulse RestPulse;datalines;
SCORE AGE_WGT 1 -1 0 0 0SCORE RUN_RST 0 0 0 1 -1SCORE TOTAL 1 1 1 1 1;
proc print data=A;title ’CONSTRUCTED SCORING EXAMPLE’;title2 ’Scoring Coefficients’;
run;
proc score data=Fitness score=A out=B;var Age Weight RunTime RunPulse RestPulse;
run;
proc print data=B;title2 ’Scored Data’;
run;
SAS OnlineDoc: Version 8
3084 � Chapter 57. The SCORE Procedure
Output 57.3.1. Custom Scoring Data Set and Scored Fitness Data: PROC PRINT
CONSTRUCTED SCORING EXAMPLEScoring Coefficients
Run Run RestObs _type_ _name_ Age Weight Time Pulse Pulse
1 SCORE AGE_WGT 1 -1 0 0 02 SCORE RUN_RST 0 0 0 1 -13 SCORE TOTAL 1 1 1 1 1
Output 57.3.2. Custom Scored Fitness Data: PROC PRINT
CONSTRUCTED SCORING EXAMPLEScored Data
Run Rest RunObs Age Weight Oxygen Time Pulse Pulse AGE_WGT RUN_RST TOTAL
1 44 89.47 44.609 11.37 62 178 -45.47 116 384.842 40 75.07 45.313 10.07 62 185 -35.07 123 372.143 44 85.84 54.297 8.65 45 156 -41.84 111 339.494 42 68.15 59.571 8.17 40 166 -26.15 126 324.325 38 89.02 49.874 9.22 55 178 -51.02 123 369.246 47 77.45 44.811 11.63 58 176 -30.45 118 370.087 40 75.98 45.681 11.95 70 176 -35.98 106 373.938 43 81.19 49.091 10.85 64 162 -38.19 98 361.049 44 81.42 39.442 13.08 63 174 -37.42 111 375.50
10 38 81.87 60.055 8.63 48 170 -43.87 122 346.5011 44 73.03 50.541 10.13 45 168 -29.03 123 340.1612 45 87.66 37.388 14.03 56 186 -42.66 130 388.69
References
Chaseling, J. (1996), “Standard Test Results of Students at Three Types of Schools,”sample data, Faculty of Environmental Sciences, Griffith University: Queens-land, Australia.
SAS OnlineDoc: Version 8
The correct bibliographic citation for this manual is as follows: SAS Institute Inc.,SAS/STAT ® User’s Guide, Version 8, Cary, NC: SAS Institute Inc., 1999.
SAS/STAT® User’s Guide, Version 8Copyright © 1999 by SAS Institute Inc., Cary, NC, USA.ISBN 1–58025–494–2All rights reserved. Produced in the United States of America. No part of this publicationmay be reproduced, stored in a retrieval system, or transmitted, in any form or by anymeans, electronic, mechanical, photocopying, or otherwise, without the prior writtenpermission of the publisher, SAS Institute Inc.U.S. Government Restricted Rights Notice. Use, duplication, or disclosure of thesoftware and related documentation by the U.S. government is subject to the Agreementwith SAS Institute and the restrictions set forth in FAR 52.227–19 Commercial ComputerSoftware-Restricted Rights (June 1987).SAS Institute Inc., SAS Campus Drive, Cary, North Carolina 27513.1st printing, October 1999SAS® and all other SAS Institute Inc. product or service names are registered trademarksor trademarks of SAS Institute Inc. in the USA and other countries.® indicates USAregistration.Other brand and product names are registered trademarks or trademarks of theirrespective companies.The Institute is a private company devoted to the support and further development of itssoftware and related services.