chapter 5 the properties of gases some of the properties of gases were discovered by balloonists...
TRANSCRIPT
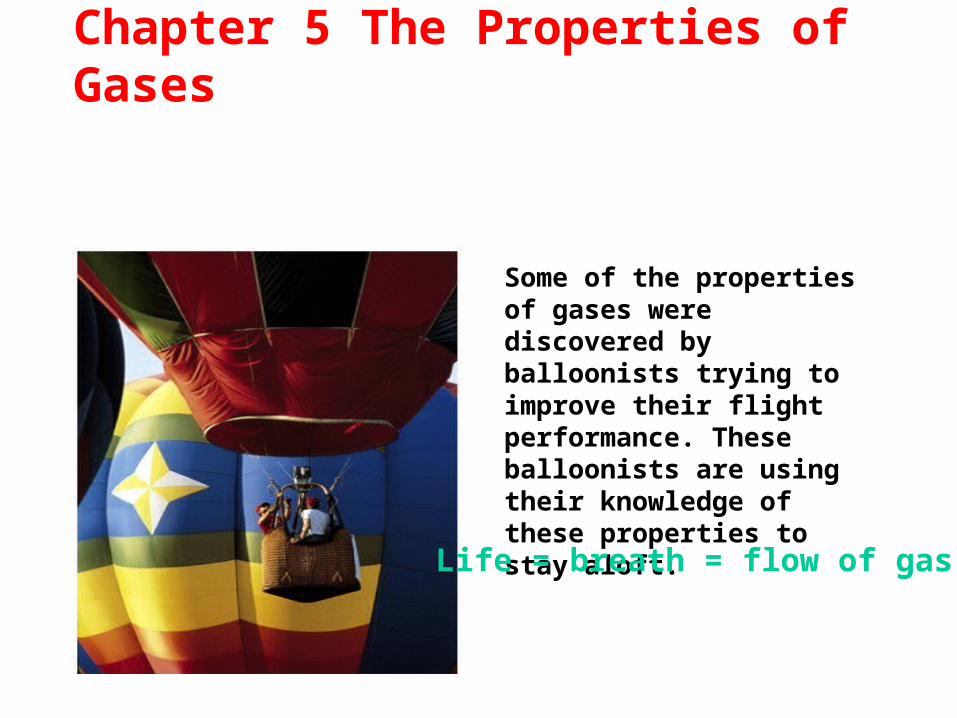
Chapter 5 The Properties of Gases
Some of the properties of gases were discovered by balloonists trying to improve their flight performance. These balloonists are using their knowledge of these properties to stay aloft.Life = breath = flow of gas
Assignment for Chapter 5
15, 21, 35, 47, 55, 67, 73
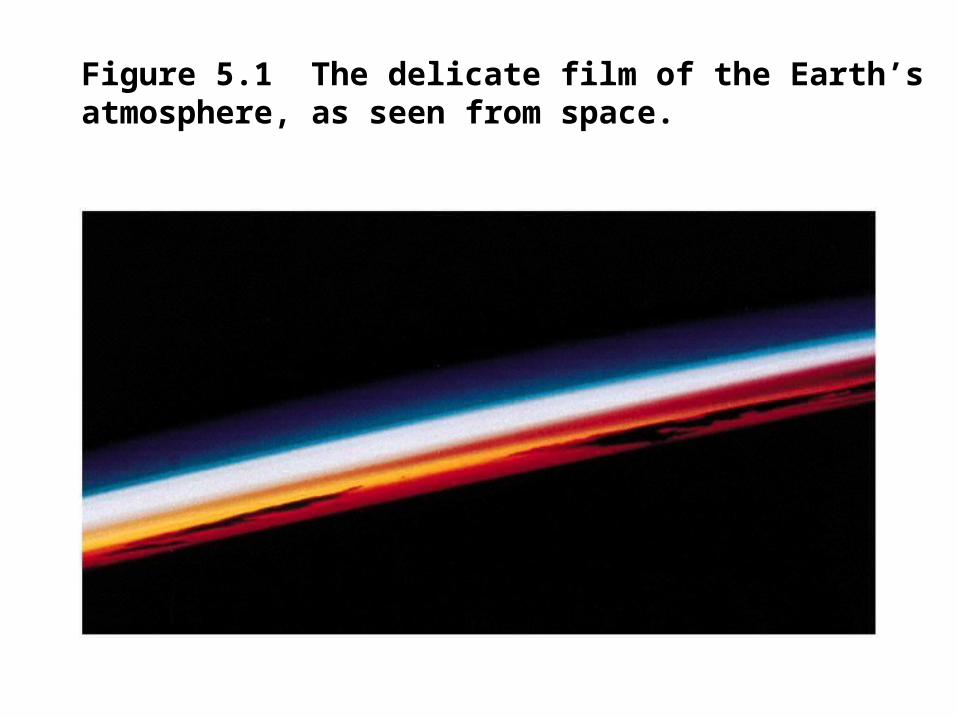
Figure 5.1 The delicate film of the Earth’s atmosphere, as seen from space.
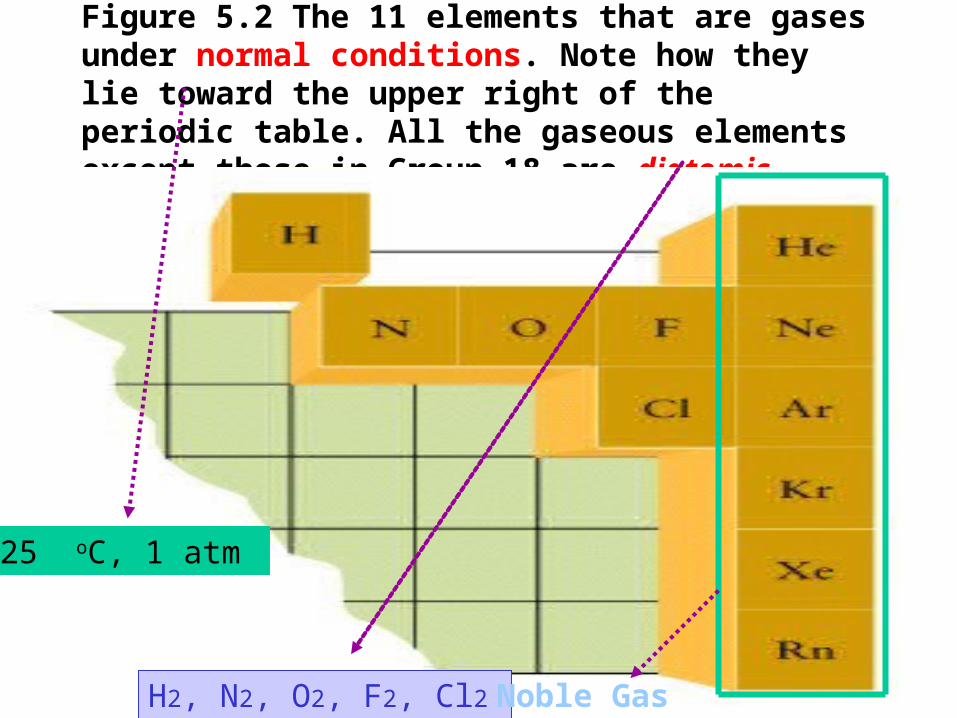
Figure 5.2 The 11 elements that are gases under normal conditions. Note how they lie toward the upper right of the periodic table. All the gaseous elements except those in Group 18 are diatomic.
25 oC, 1 atm
H2, N2, O2, F2, Cl2 Noble Gas
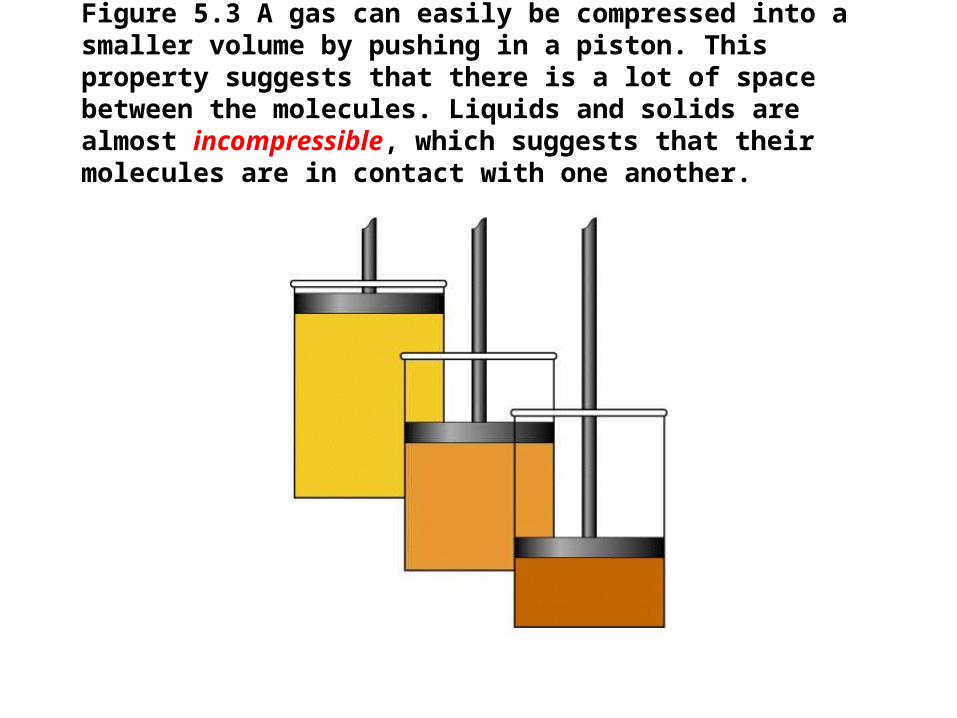
Figure 5.3 A gas can easily be compressed into a smaller volume by pushing in a piston. This property suggests that there is a lot of space between the molecules. Liquids and solids are almost incompressible, which suggests that their molecules are in contact with one another.
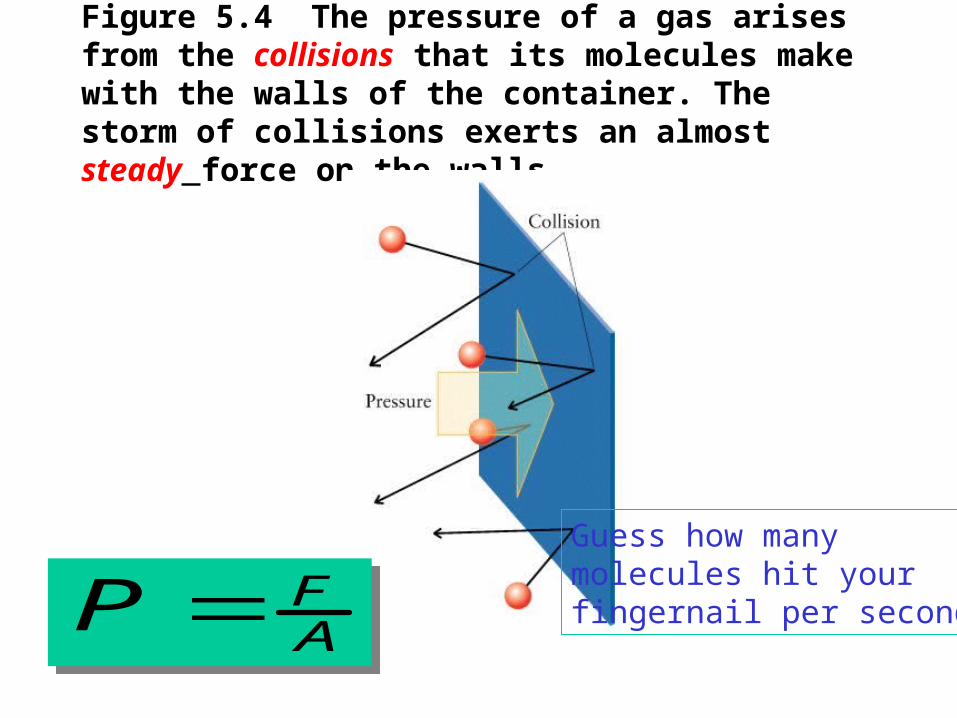
Figure 5.4 The pressure of a gas arises from the collisions that its molecules make with the walls of the container. The storm of collisions exerts an almost steady force on the walls.
AFP AFP
Guess how manymolecules hit your fingernail per second?
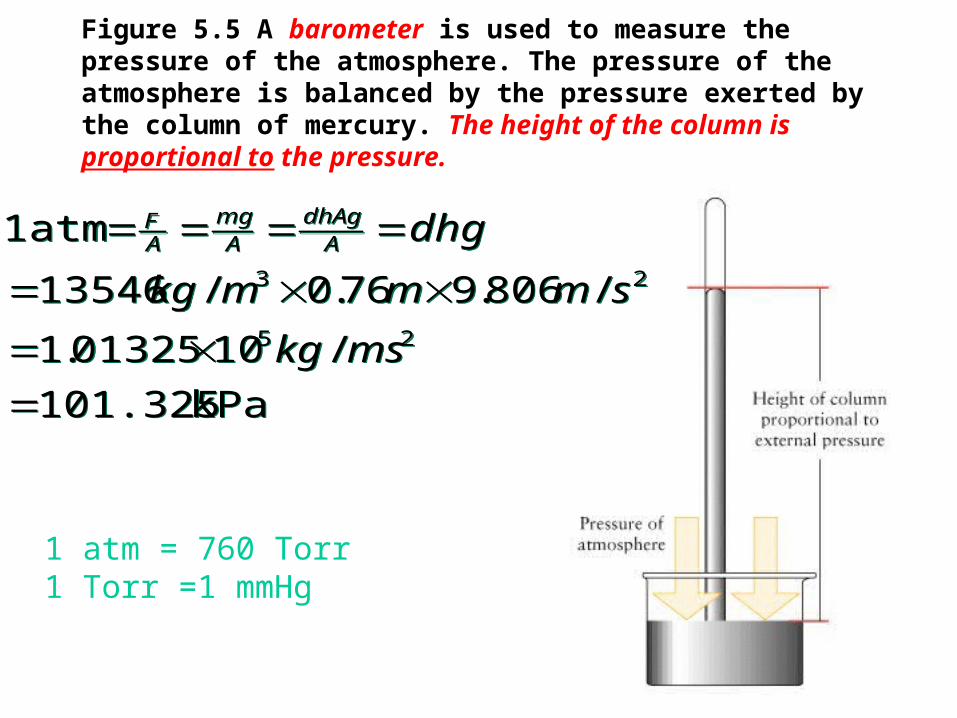
Figure 5.5 A barometer is used to measure the pressure of the atmosphere. The pressure of the atmosphere is balanced by the pressure exerted by the column of mercury. The height of the column is proportional to the pressure.
kPa 101.325
/1001325.1
/806.976.0/13546
atm 1
25
23
mskg
smmmkg
dhgAdhAg
Amg
AF
kPa 101.325
/1001325.1
/806.976.0/13546
atm 1
25
23
mskg
smmmkg
dhgAdhAg
Amg
AF
1 atm = 760 Torr1 Torr =1 mmHg
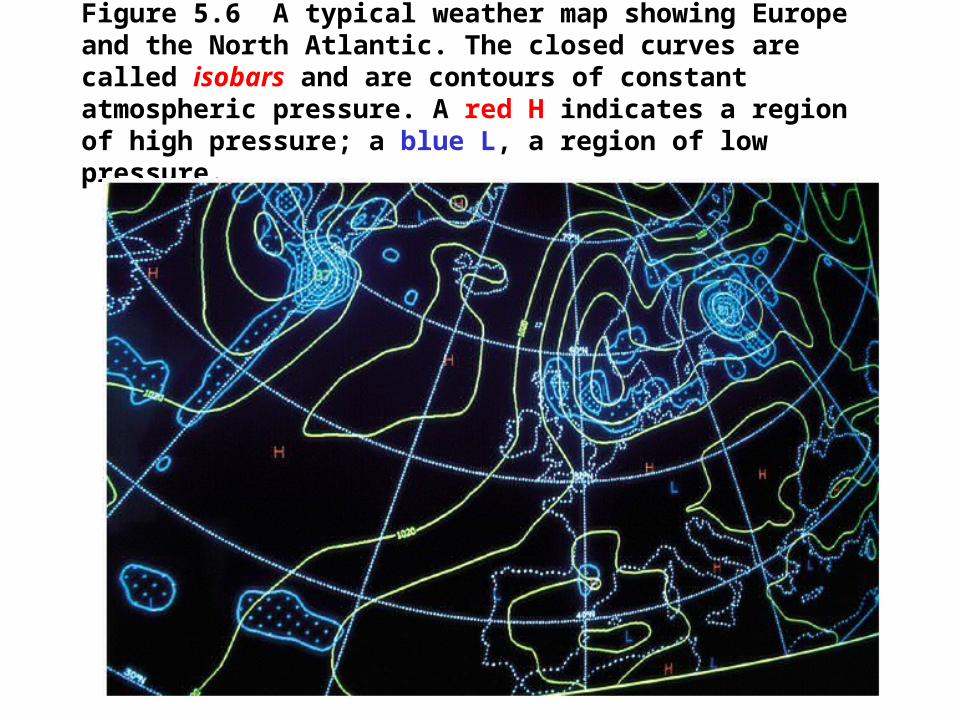
Figure 5.6 A typical weather map showing Europe and the North Atlantic. The closed curves are called isobars and are contours of constant atmospheric pressure. A red H indicates a region of high pressure; a blue L, a region of low pressure.
The Parameters for Describing a Gas
• Pressure (P)
• Volume (V)
• Temperature (T)
• Amount (Mole, n)
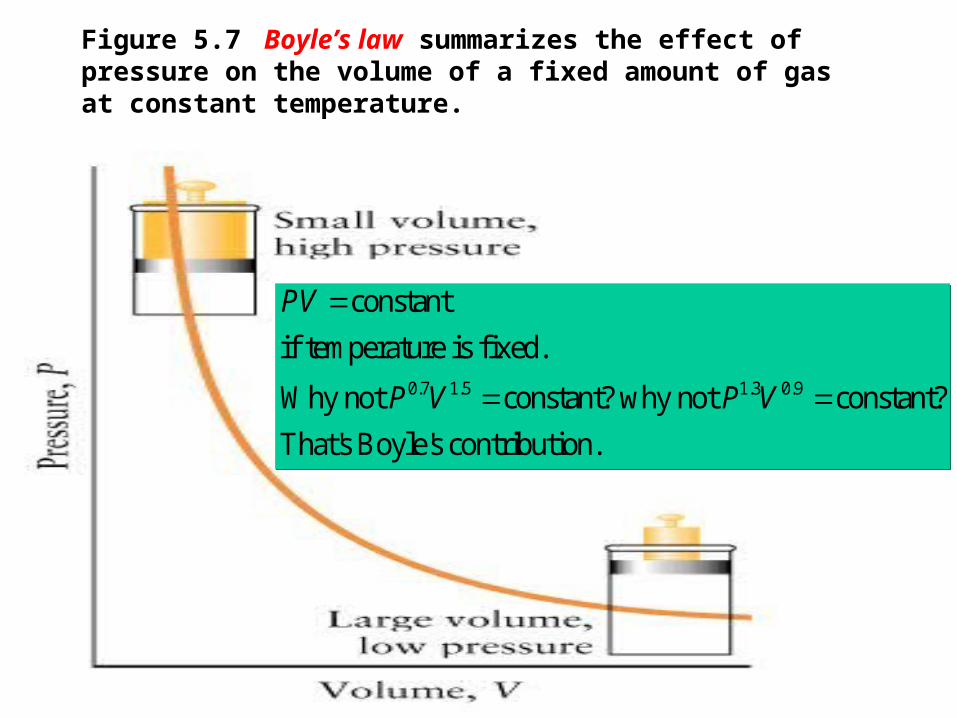
Figure 5.7 Boyle’s law summarizes the effect of pressure on the volume of a fixed amount of gas at constant temperature.
0.7 1.5 1.3 0.9
constant
if temperature is fixed.
Why not constant? why not constant?
That's Boyle's contribution.
PV
P V P V
0.7 1.5 1.3 0.9
constant
if temperature is fixed.
Why not constant? why not constant?
That's Boyle's contribution.
PV
P V P V
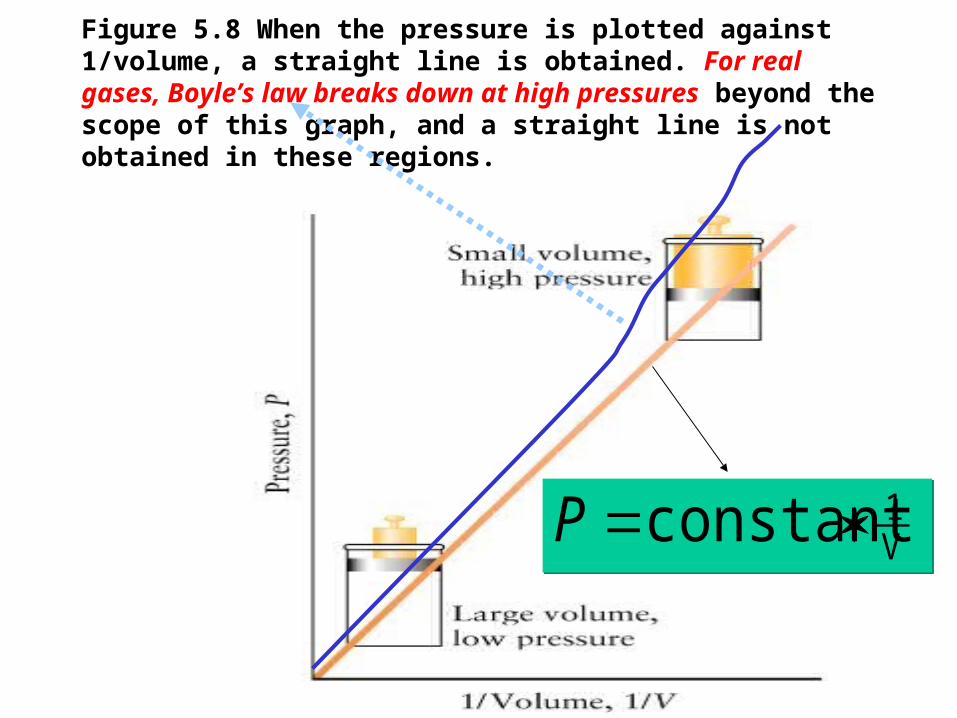
Figure 5.8 When the pressure is plotted against 1/volume, a straight line is obtained. For real gases, Boyle’s law breaks down at high pressures beyond the scope of this graph, and a straight line is not obtained in these regions.
constant V1P constant V1P
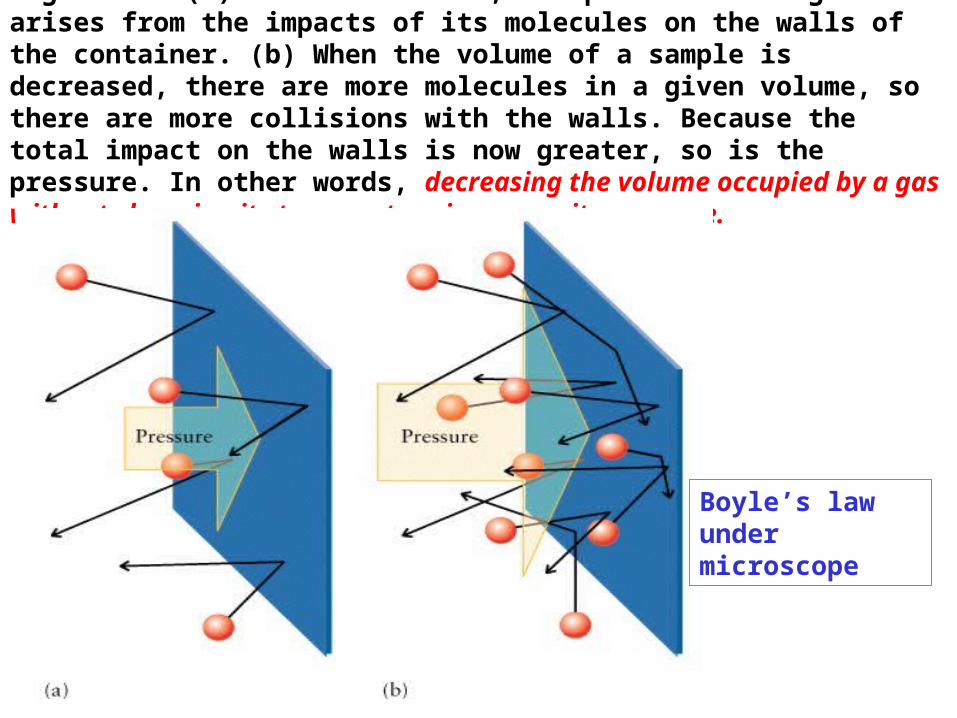
Figure 5.9 (a) As we have seen, the pressure of a gas arises from the impacts of its molecules on the walls of the container. (b) When the volume of a sample is decreased, there are more molecules in a given volume, so there are more collisions with the walls. Because the total impact on the walls is now greater, so is the pressure. In other words, decreasing the volume occupied by a gas without changing its temperature increases its pressure.
Boyle’s lawunder microscope

Figure 5.10 Charles’s Law: When the temperature of a gas is increased and it is free to change its volume at constant pressure (as depicted by the constant weight acting on the piston), the volume increases. A graph of volume against temperature is a straight line.
fixed. is pressure if
T*constantVfixed. is pressure if
T*constantV
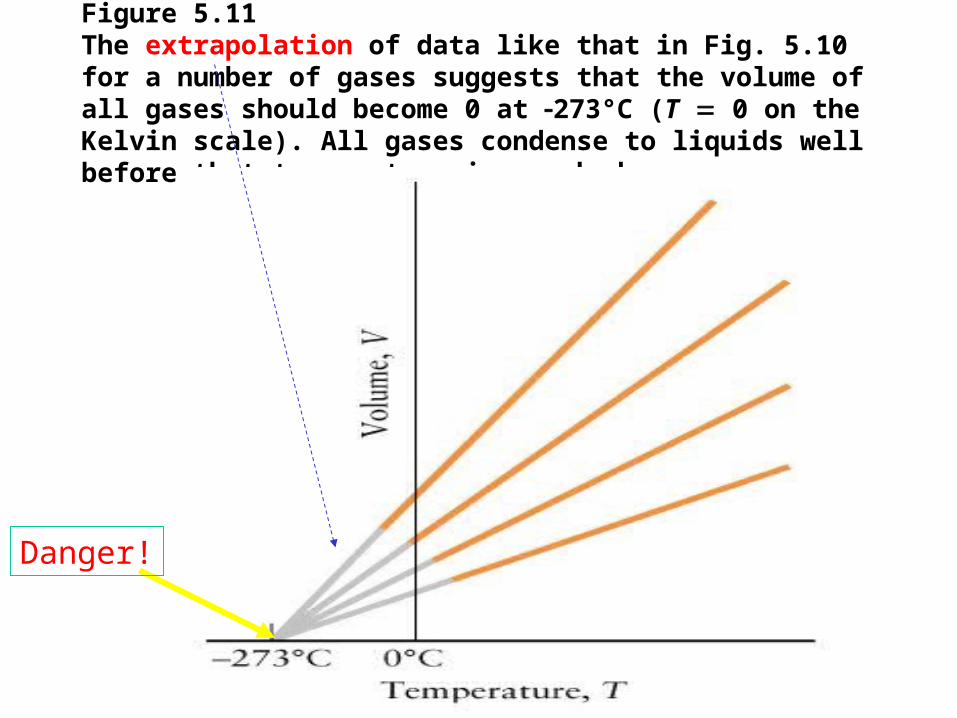
Figure 5.11The extrapolation of data like that in Fig. 5.10 for a number of gases suggests that the volume of all gases should become 0 at 273°C (T 0 on the Kelvin scale). All gases condense to liquids well before that temperature is reached.
Danger!
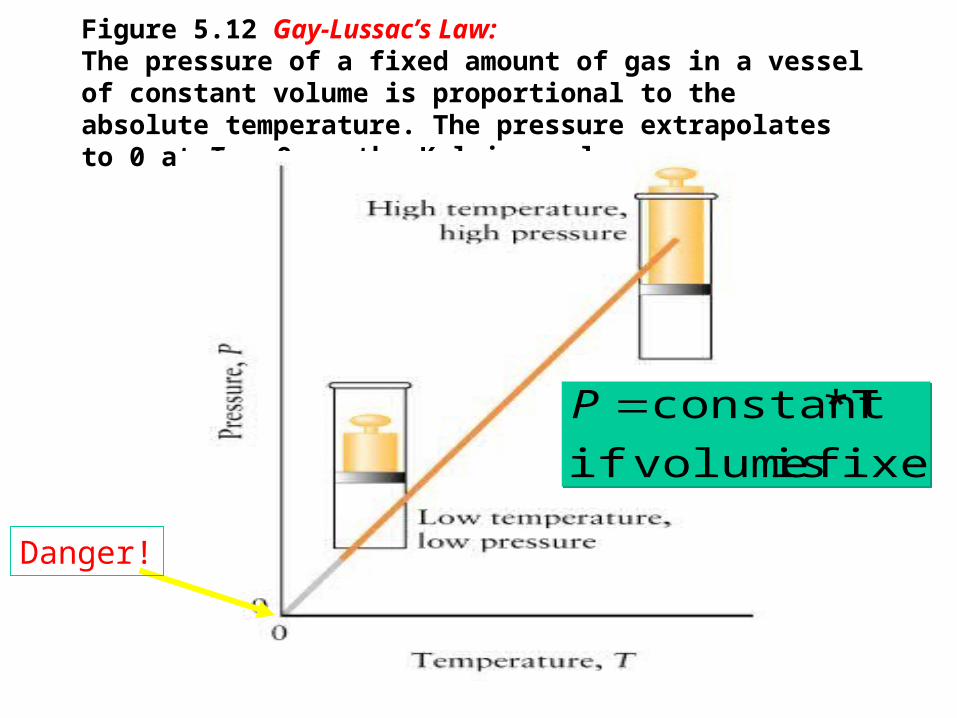
Figure 5.12 Gay-Lussac’s Law: The pressure of a fixed amount of gas in a vessel of constant volume is proportional to the absolute temperature. The pressure extrapolates to 0 at T 0 on the Kelvin scale.
fixed. is volumeif
T*constantPfixed. is volumeif
T*constantP
Danger!
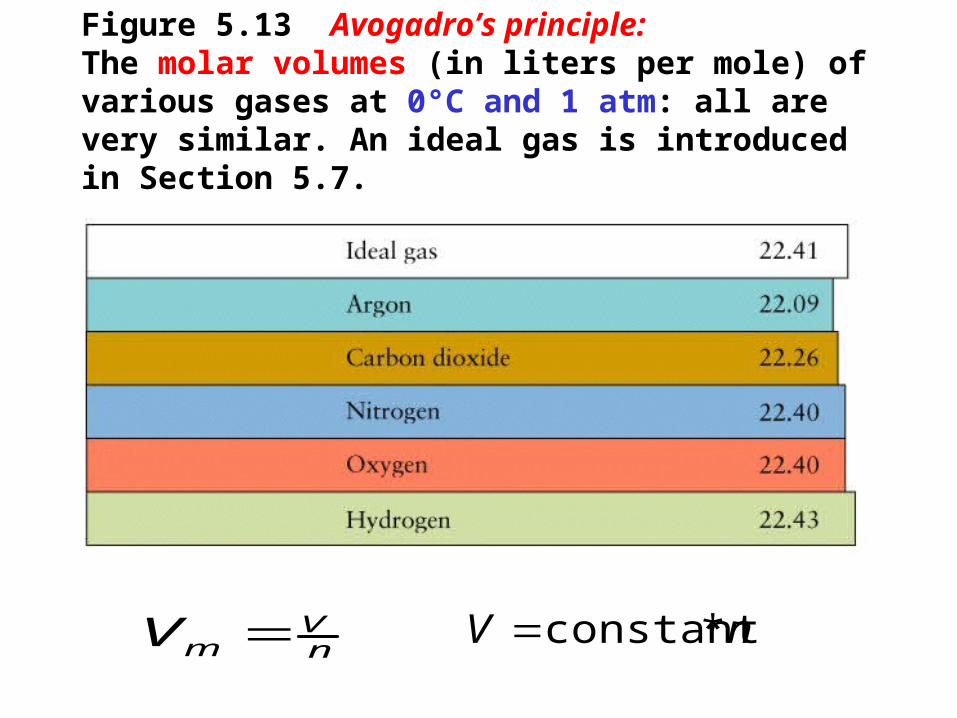
Figure 5.13 Avogadro’s principle:The molar volumes (in liters per mole) of various gases at 0°C and 1 atm: all are very similar. An ideal gas is introduced in Section 5.7.
nV
mV nV *constant
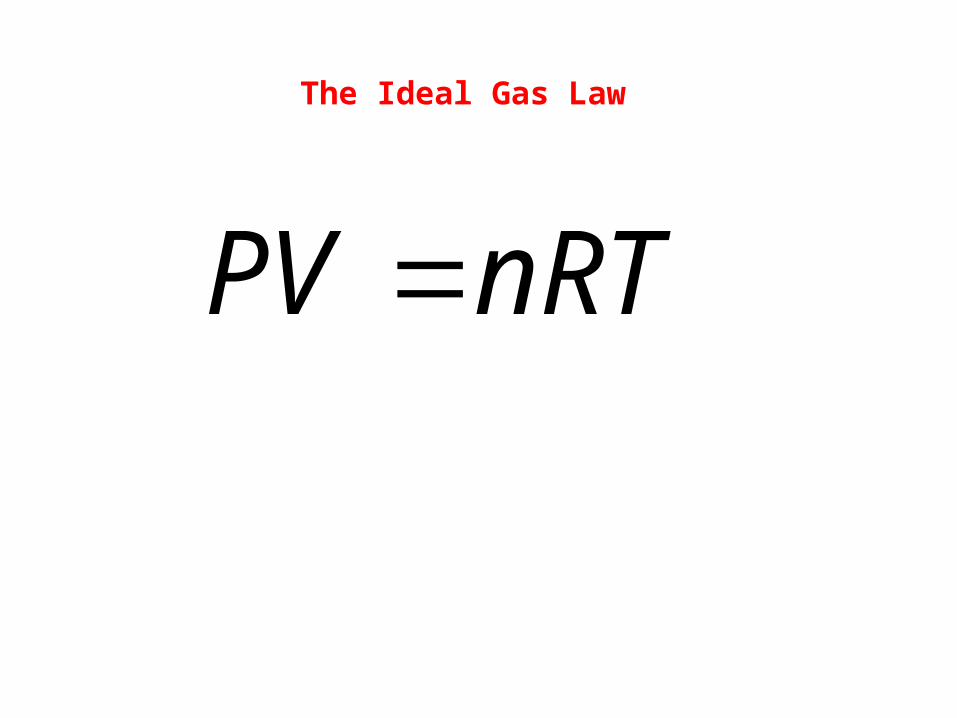
The Ideal Gas Law
nRTPV

Figure 5.14 A visualization of the effect of various changes on an ideal gas: (a) increasing temperature at constant volume; (b) increasing pressure at constant temperature; (c) increasing temperature at constant pressure; and (d) increasing the number of moles at constant temperature and pressure.
fixed ,nV
nRTPV fixed ,nV
nRTPV
fixed ,nT
nRTPV fixed ,nT
nRTPV
fixed ,nP
nRTPV fixed ,nP
nRTPV
fixed ,TP
nRTPV fixed ,TP
nRTPV
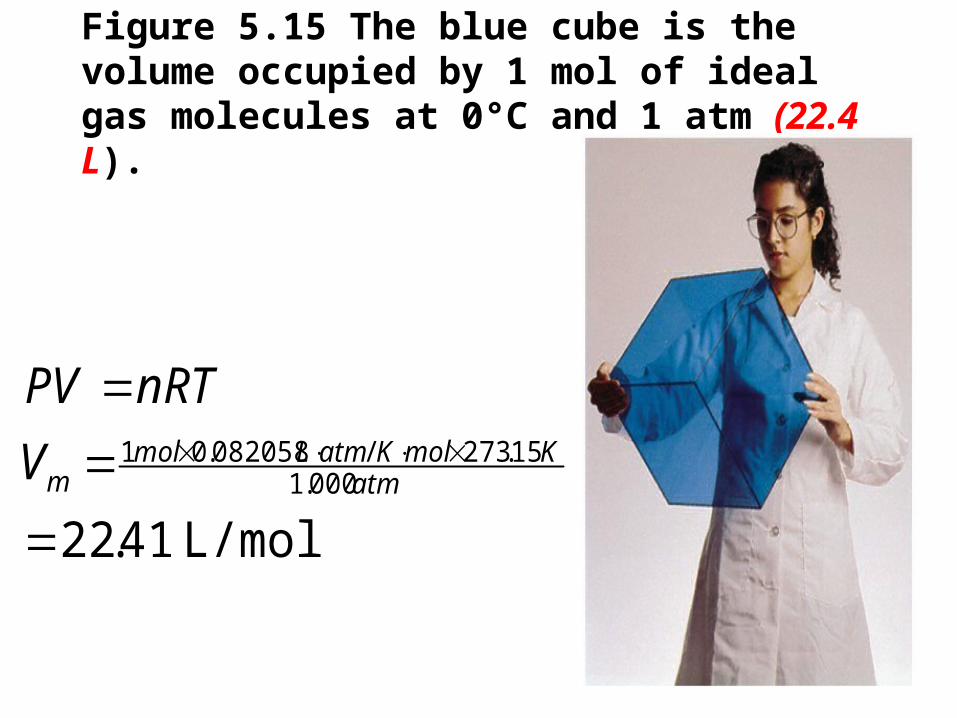
Figure 5.15 The blue cube is the volume occupied by 1 mol of ideal gas molecules at 0°C and 1 atm (22.4 L).
L/mol 41.22000.1
15.273/082058.01
atm
KmolKatmLmolmV
nRTPV
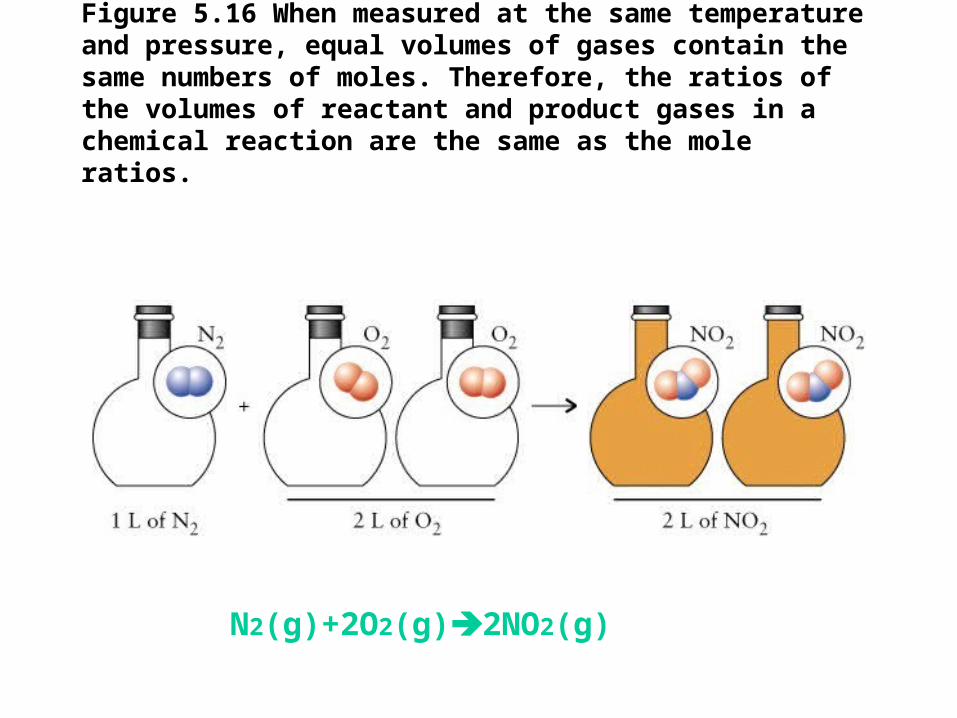
Figure 5.16 When measured at the same temperature and pressure, equal volumes of gases contain the same numbers of moles. Therefore, the ratios of the volumes of reactant and product gases in a chemical reaction are the same as the mole ratios.
N2(g)+2O2(g)2NO2(g)
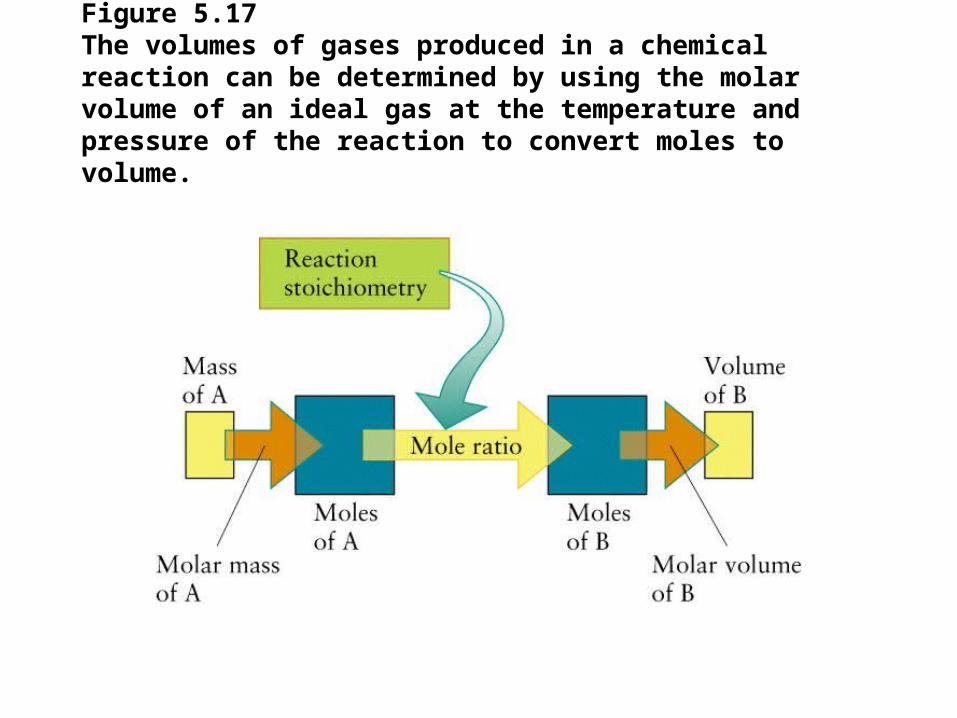
Figure 5.17 The volumes of gases produced in a chemical reaction can be determined by using the molar volume of an ideal gas at the temperature and pressure of the reaction to convert moles to volume.
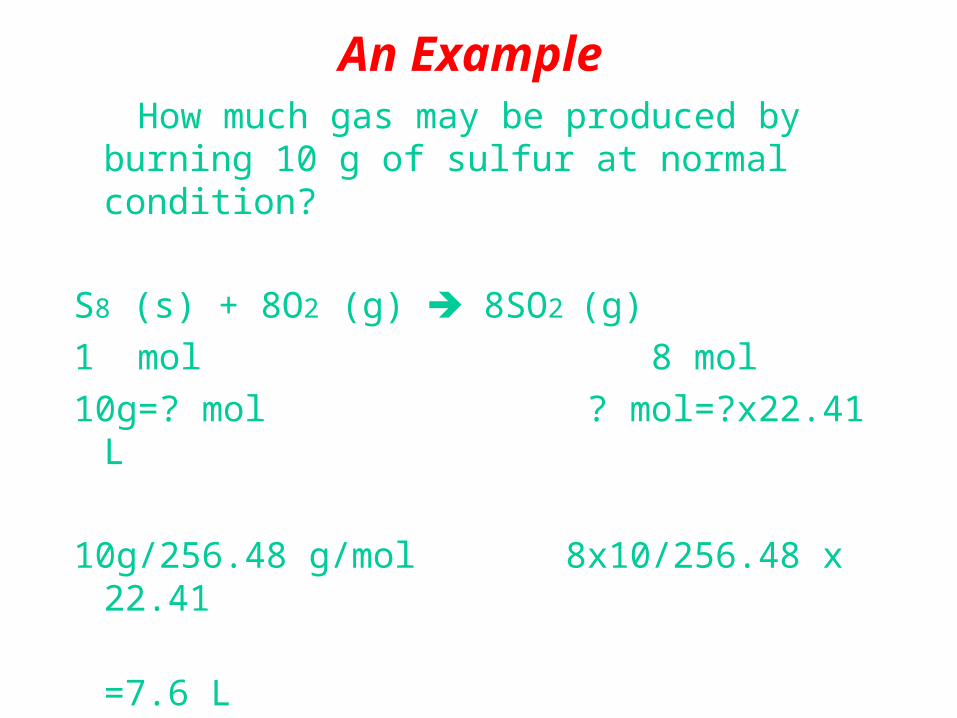
An Example How much gas may be produced by
burning 10 g of sulfur at normal condition?
S8 (s) + 8O2 (g) 8SO2 (g)
1 mol 8 mol
10g=? mol ? mol=?x22.41 L
10g/256.48 g/mol 8x10/256.48 x 22.41
=7.6 L
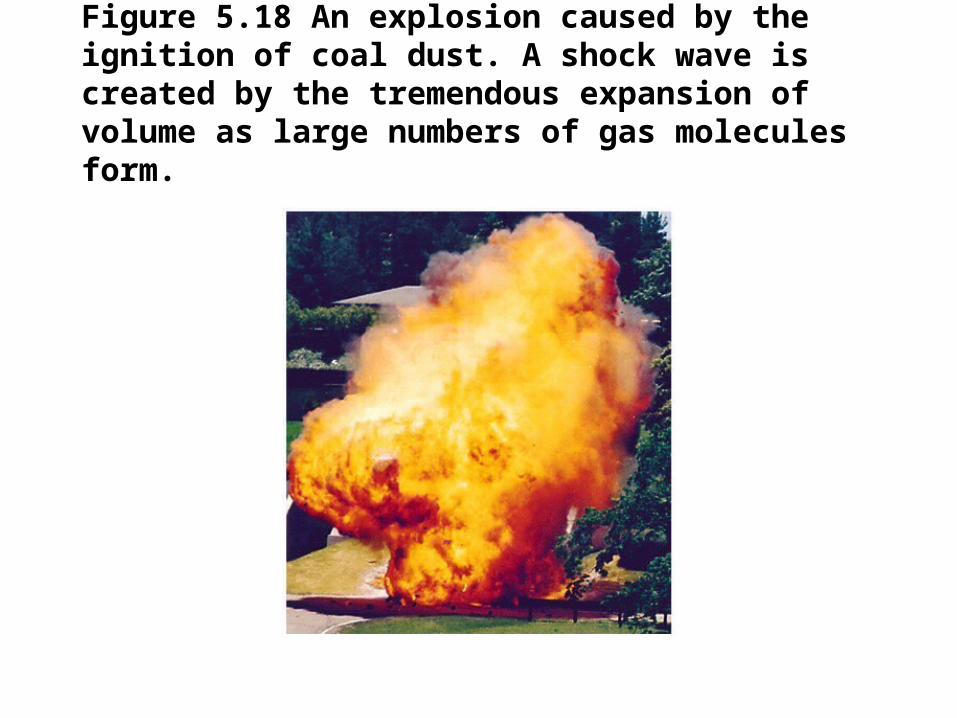
Figure 5.18 An explosion caused by the ignition of coal dust. A shock wave is created by the tremendous expansion of volume as large numbers of gas molecules form.
Nitroglycin4C8 H5(NO3)3(l) 6N2 (g)+O2(g)+12CO2(g)+10H2O(g)
Figure 5.19 The rapid decomposition of sodium azide, NaN3, results in the formation of a large volume of nitrogen gas. The reaction is triggered electrically in this air bag.
Figure 5.20 The Virgin Global Challenger is tested near Reno, Nevada, before beginning an attempt to circumnavigate the globe.
Figure 5.21 At the same temperature and pressure, a molecule occupies essentially the same volume in any gas. Hence, the greater the mass of each molecule, the greater the density of the gas. The illustration shows samples of hydrogen and chlorine at the same pressure, volume, and temperature. The numbers are the molar masses in grams per mole.
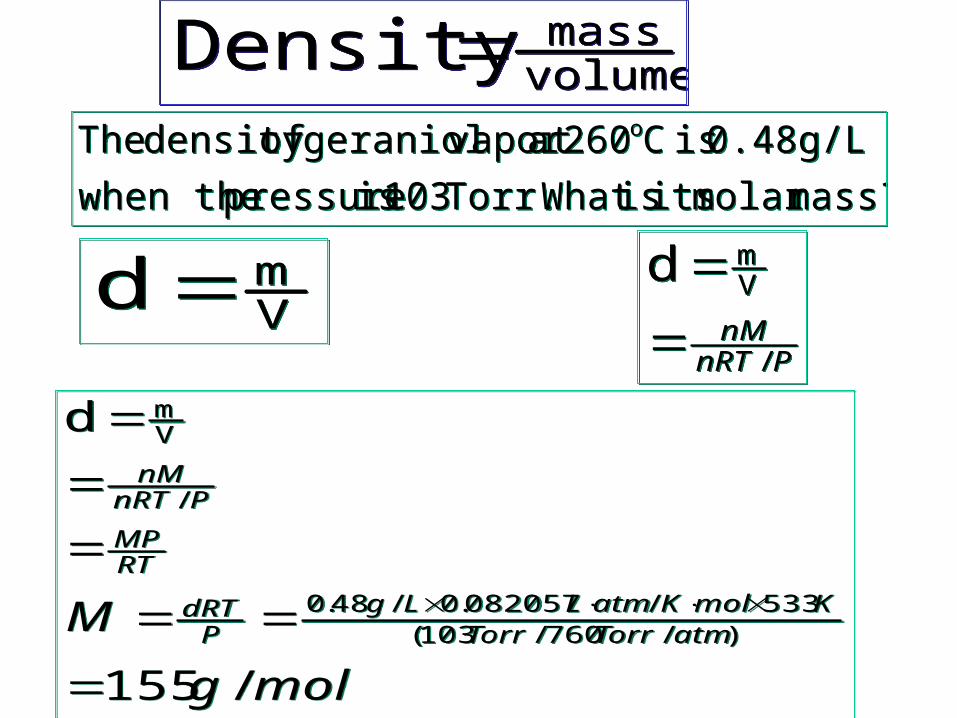
volumemassDensity volumemassDensity
mass?molar its is What Torr. 103 is pressure when the
0.48g/L is C 260at vapor geraniol ofdensity The o
mass?molar its is What Torr. 103 is pressure when the
0.48g/L is C 260at vapor geraniol ofdensity The o
PnRTnM
/
Vmd
PnRTnM
/
Vmd
Vmd Vmd
molg
M atmTorrTorrKmolKatmLLg
PdRT
RTMP
PnRTnM
/155
d
)/760/103(533/082057.0/48.0
/
Vm
molg
M atmTorrTorrKmolKatmLLg
PdRT
RTMP
PnRTnM
/155
d
)/760/103(533/082057.0/48.0
/
Vm
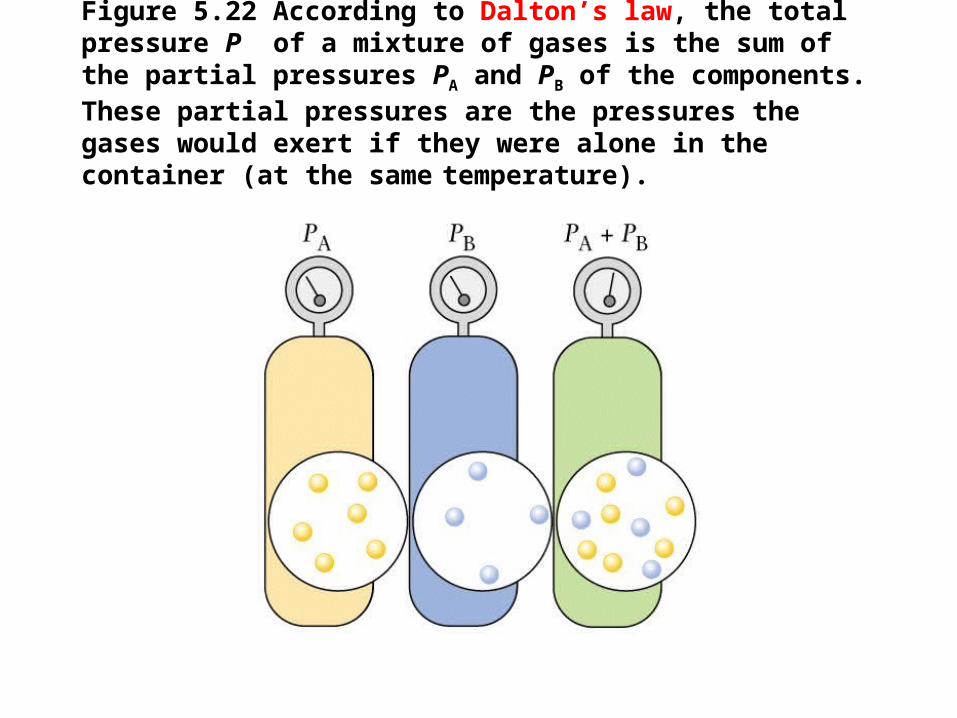
Figure 5.22 According to Dalton’s law, the total pressure P of a mixture of gases is the sum of the partial pressures PA and PB of the components. These partial pressures are the pressures the gases would exert if they were alone in the container (at the same temperature).
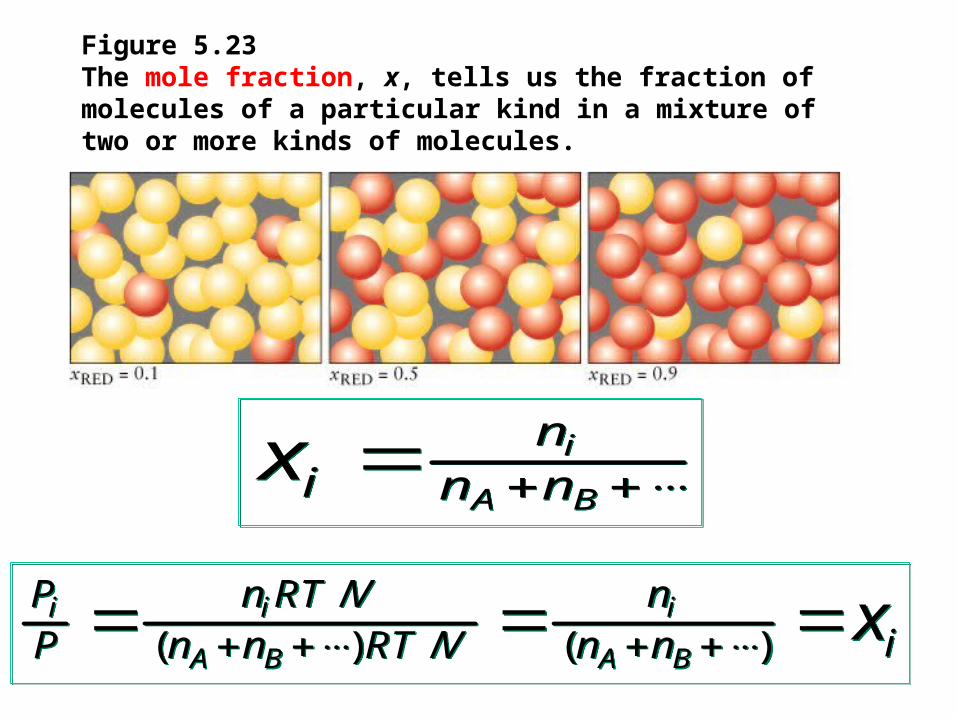
Figure 5.23 The mole fraction, x, tells us the fraction of molecules of a particular kind in a mixture of two or more kinds of molecules.
BA
i
nnn
ix BA
i
nnn
ix
/( ) / ( )
i i i
A B A B
P n RT V niP n n RT V n n x /
( ) / ( )i i i
A B A B
P n RT V niP n n RT V n n x
An Example
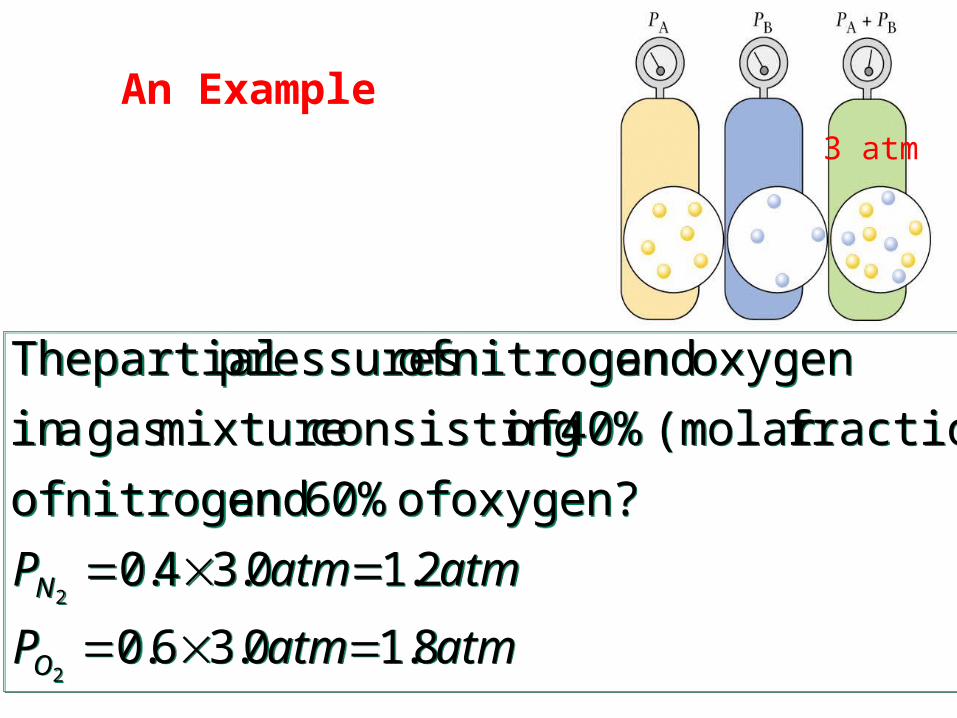
atmatmP
atmatmP
O
N
8.10.36.0
2.10.34.0
oxygen? of 60% andnitrogen of
fraction)(molar 40% of consisting mixture gas ain
oxygen andnitrogen of pressures partial The
2
2
atmatmP
atmatmP
O
N
8.10.36.0
2.10.34.0
oxygen? of 60% andnitrogen of
fraction)(molar 40% of consisting mixture gas ain
oxygen andnitrogen of pressures partial The
2
2
3 atm
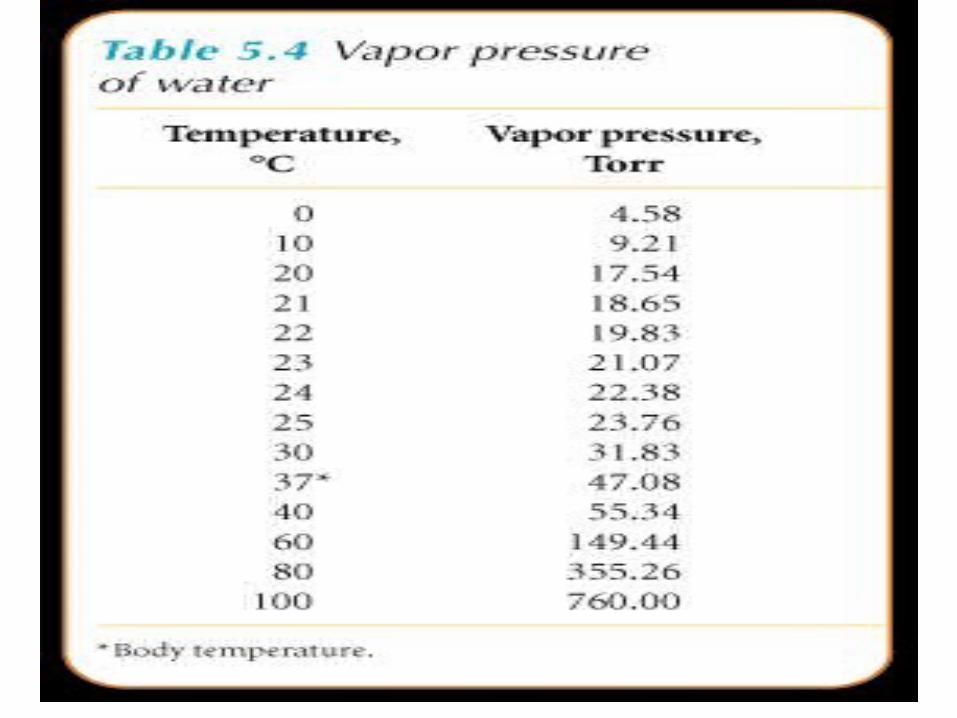
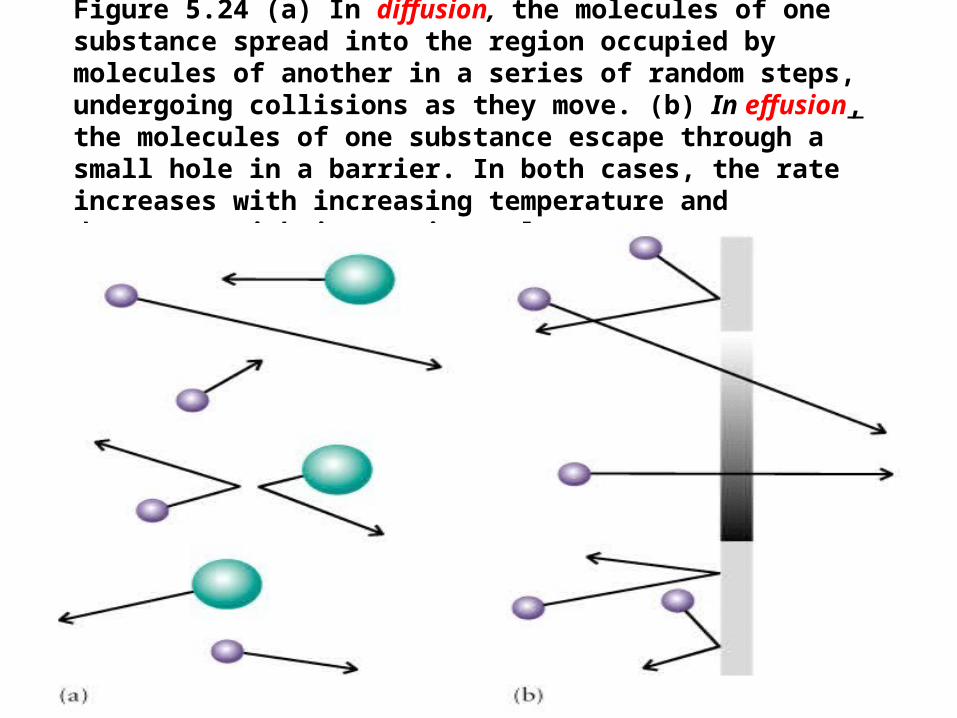
Figure 5.24 (a) In diffusion, the molecules of one substance spread into the region occupied by molecules of another in a series of random steps, undergoing collisions as they move. (b) In effusion, the molecules of one substance escape through a small hole in a barrier. In both cases, the rate increases with increasing temperature and decreases with increasing molar mass.
Meffuser 1massmolar
1effusion of Rate Meffuser 1massmolar
1effusion of Rate
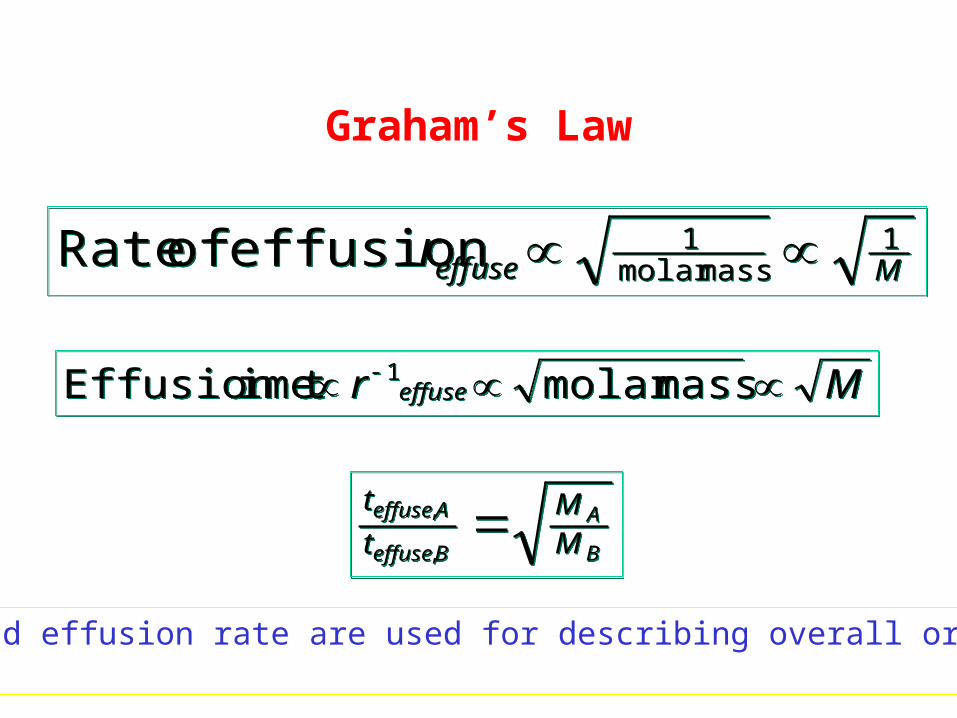
Graham’s Law
Mr effuse massmolar imeEffusion t 1 Mr effuse massmolar imeEffusion t 1
B
A
Beffuse
Aeffuse
MM
t
t ,
,
B
A
Beffuse
Aeffuse
MM
t
t ,
,
Diffusion and effusion rate are used for describing overall or directionalmotion.
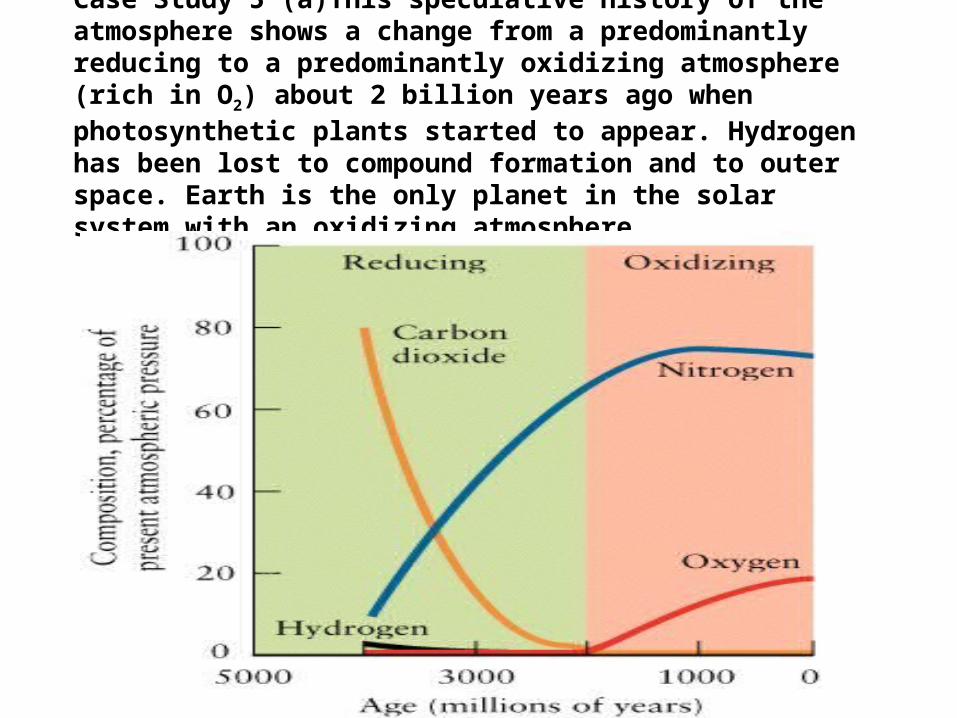
Case Study 5 (a)This speculative history of the atmosphere shows a change from a predominantly reducing to a predominantly oxidizing atmosphere (rich in O2) about 2 billion years ago when photosynthetic plants started to appear. Hydrogen has been lost to compound formation and to outer space. Earth is the only planet in the solar system with an oxidizing atmosphere.
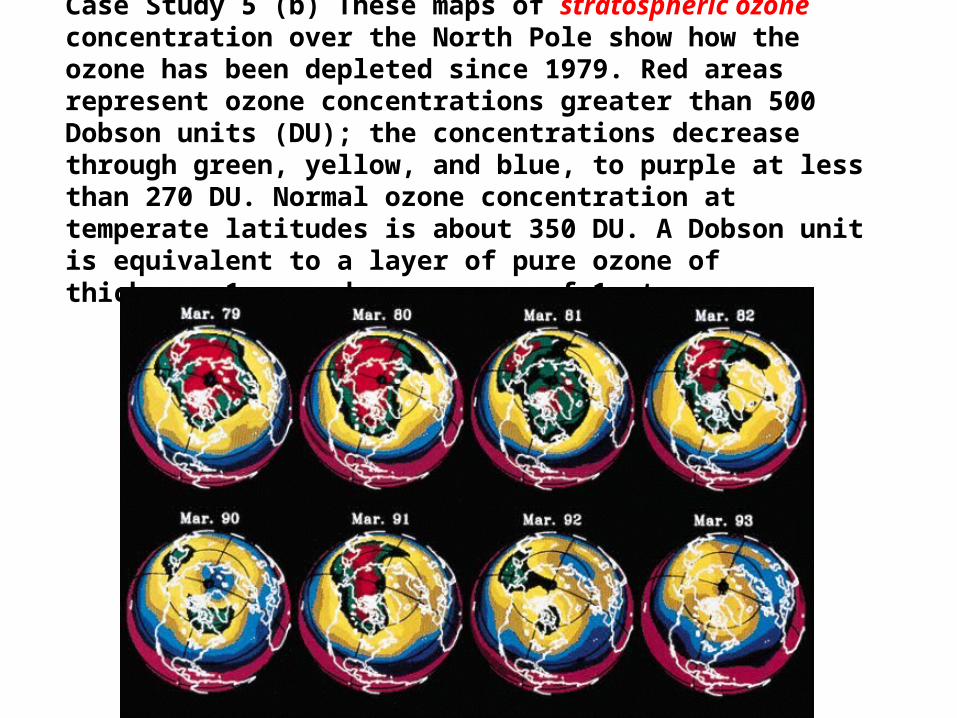
Case Study 5 (b) These maps of stratospheric ozone concentration over the North Pole show how the ozone has been depleted since 1979. Red areas represent ozone concentrations greater than 500 Dobson units (DU); the concentrations decrease through green, yellow, and blue, to purple at less than 270 DU. Normal ozone concentration at temperate latitudes is about 350 DU. A Dobson unit is equivalent to a layer of pure ozone of thickness 1 mm and a pressure of 1 atm.
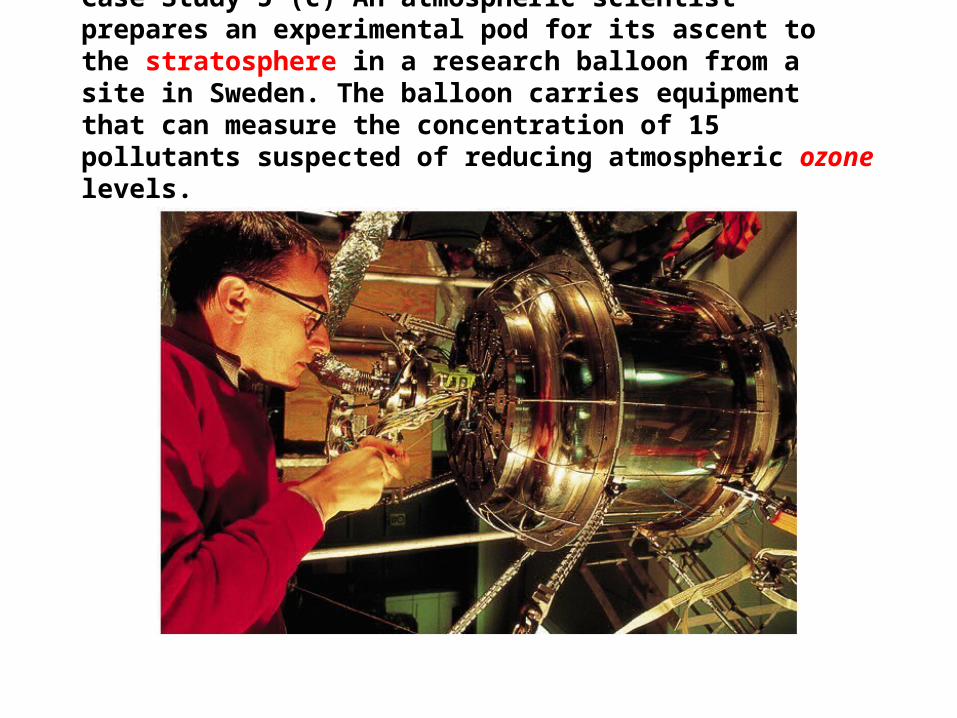
Case Study 5 (c) An atmospheric scientist prepares an experimental pod for its ascent to the stratosphere in a research balloon from a site in Sweden. The balloon carries equipment that can measure the concentration of 15 pollutants suspected of reducing atmospheric ozone levels.
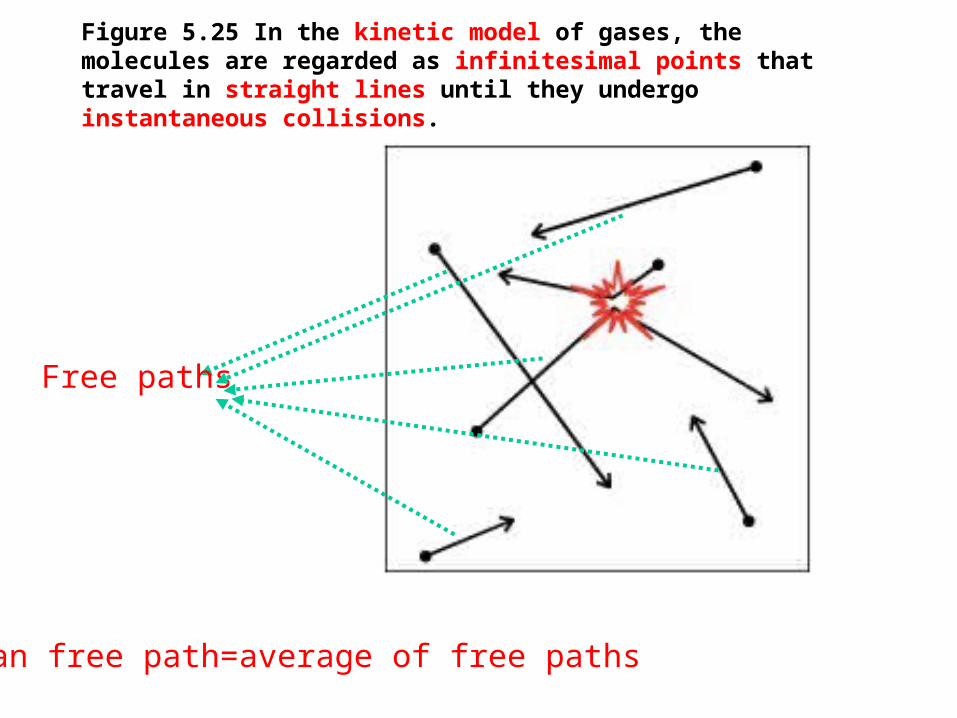
Figure 5.25 In the kinetic model of gases, the molecules are regarded as infinitesimal points that travel in straight lines until they undergo instantaneous collisions.
Mean free path=average of free paths
Free paths
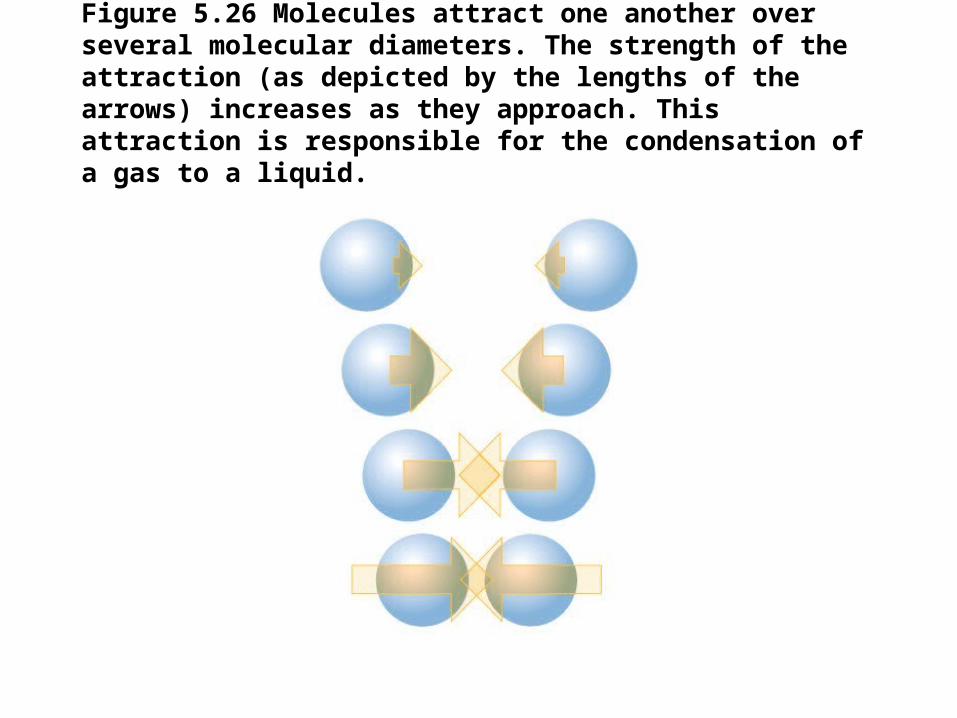
Figure 5.26 Molecules attract one another over several molecular diameters. The strength of the attraction (as depicted by the lengths of the arrows) increases as they approach. This attraction is responsible for the condensation of a gas to a liquid.
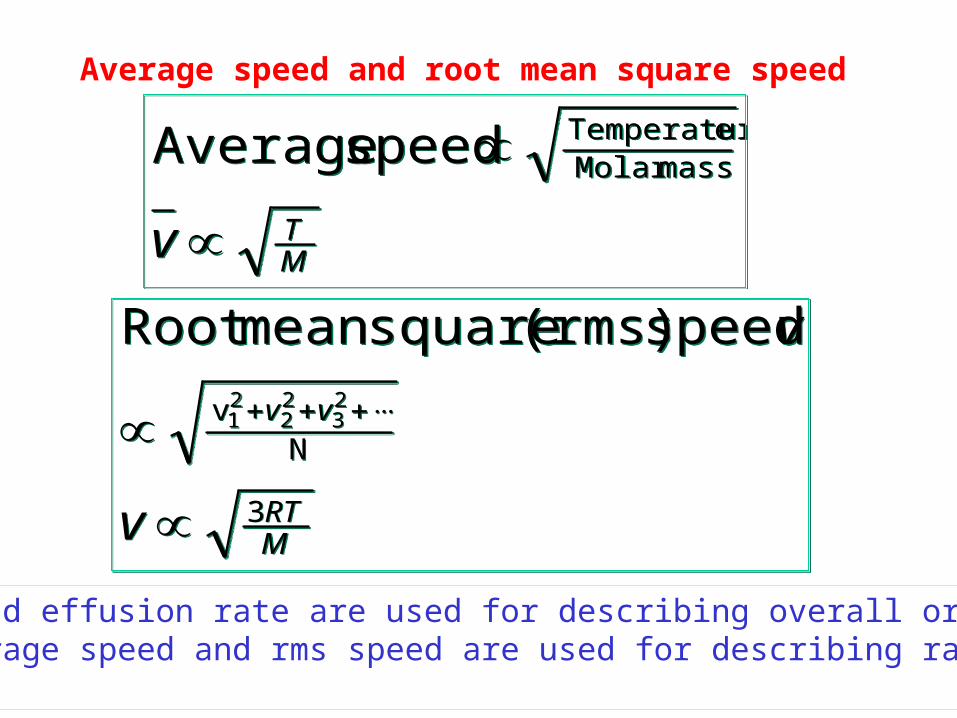
Average speed and root mean square speed
MTv
massMolar eTemperatur speed Average
MTv
massMolar eTemperatur speed Average
MRT
vv
v
v
3
Nv 2
322
21
speed (rms) squaremean Root
MRT
vv
v
v
3
Nv 2
322
21
speed (rms) squaremean Root
Diffusion and effusion rate are used for describing overall or directionalmotion. Average speed and rms speed are used for describing randommotion.
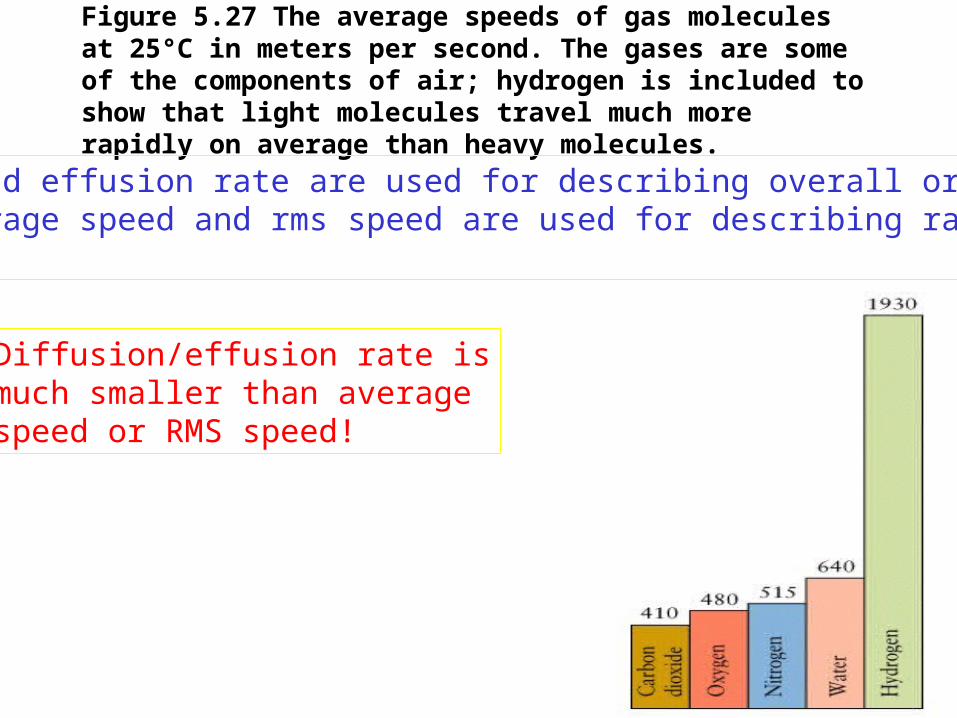
Figure 5.27 The average speeds of gas molecules at 25°C in meters per second. The gases are some of the components of air; hydrogen is included to show that light molecules travel much more rapidly on average than heavy molecules.
Diffusion/effusion rate ismuch smaller than average speed or RMS speed!
Diffusion and effusion rate are used for describing overall or directionalmotion. Average speed and rms speed are used for describing randommotion.

Investigating Matter 5.1 (a) The variation of temperature with altitude in the atmosphere and the various zones into which the atmosphere is divided. The temperature profile represents the consequences of the differing interactions of molecules with solar radiation.
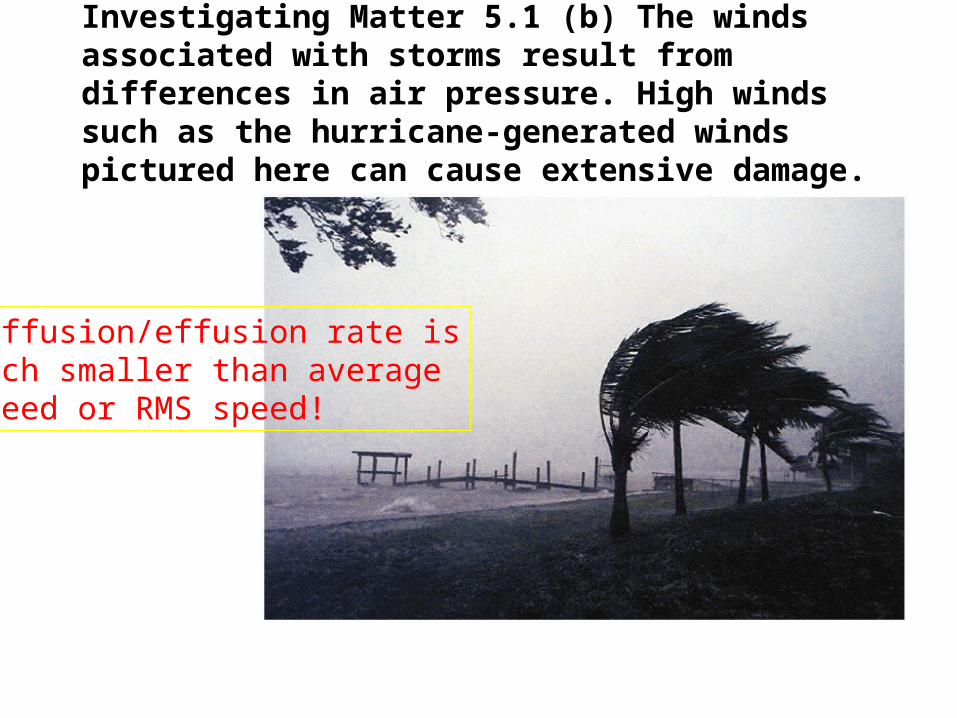
Investigating Matter 5.1 (b) The winds associated with storms result from differences in air pressure. High winds such as the hurricane-generated winds pictured here can cause extensive damage.
Diffusion/effusion rate ismuch smaller than average speed or RMS speed!
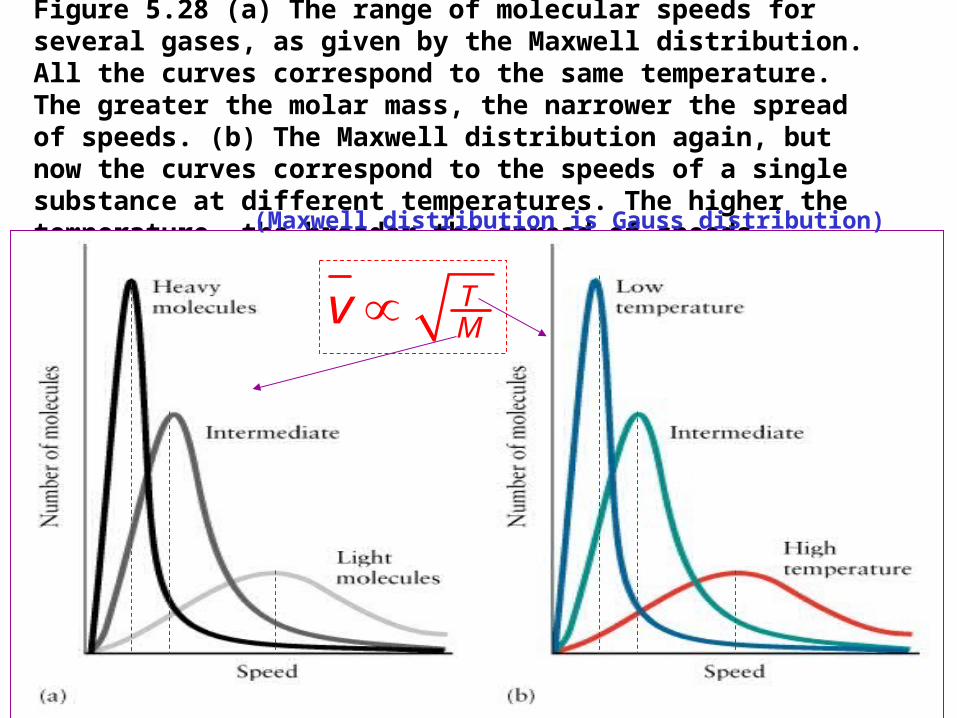
Figure 5.28 (a) The range of molecular speeds for several gases, as given by the Maxwell distribution. All the curves correspond to the same temperature. The greater the molar mass, the narrower the spread of speeds. (b) The Maxwell distribution again, but now the curves correspond to the speeds of a single substance at different temperatures. The higher the temperature, the broader the spread of speeds.
TMv
(Maxwell distribution is Gauss distribution)
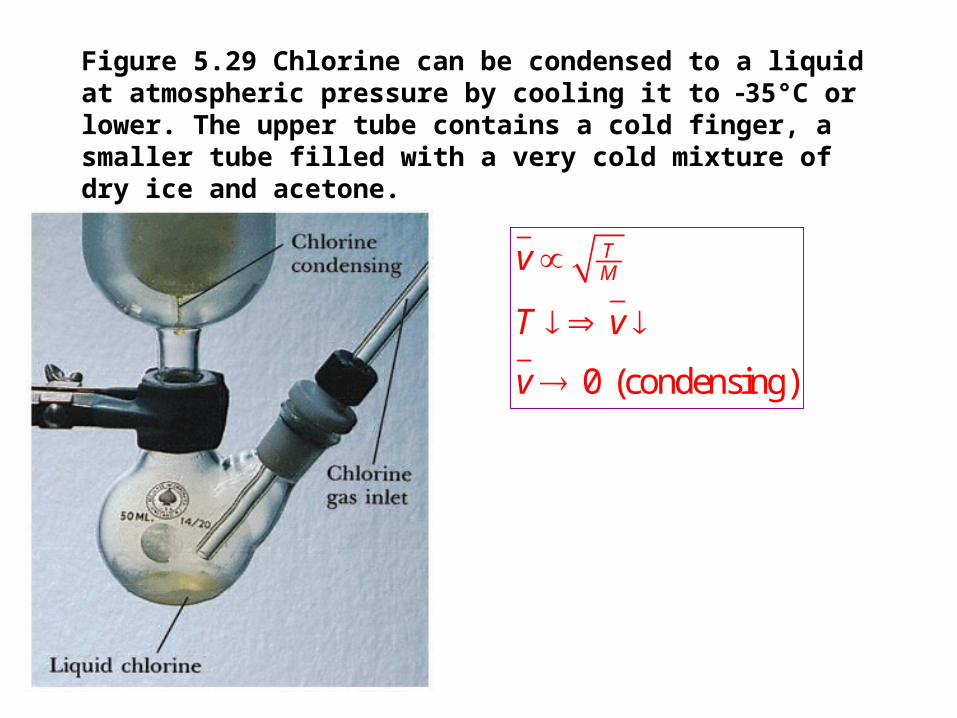
Figure 5.29 Chlorine can be condensed to a liquid at atmospheric pressure by cooling it to 35°C or lower. The upper tube contains a cold finger, a smaller tube filled with a very cold mixture of dry ice and acetone.
0 (condensing)
TMv
T v
v
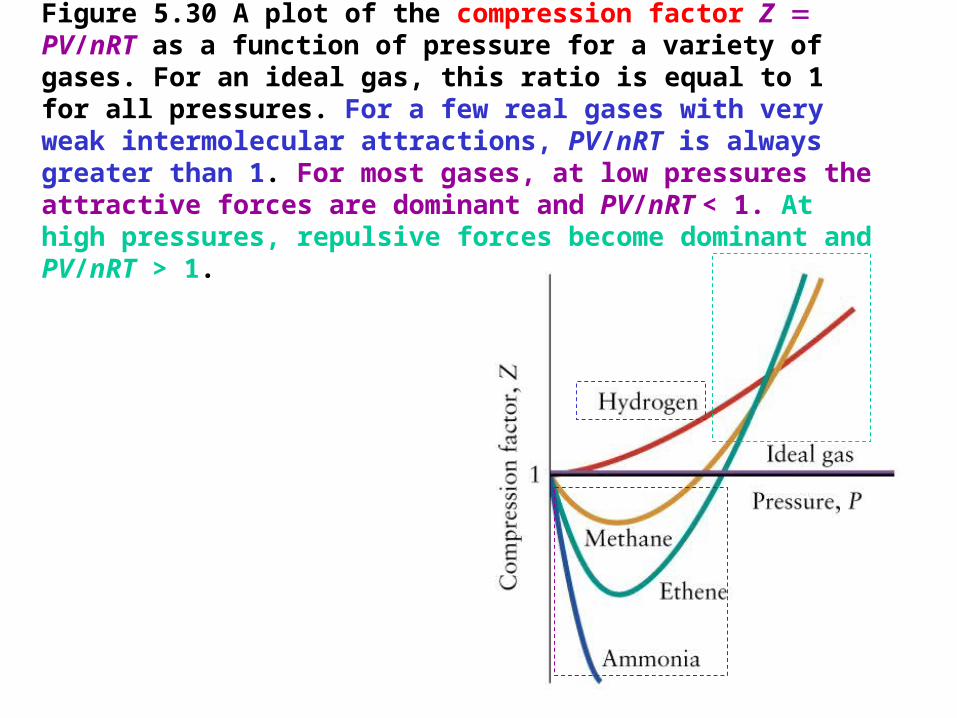
Figure 5.30 A plot of the compression factor Z PV/nRT as a function of pressure for a variety of gases. For an ideal gas, this ratio is equal to 1 for all pressures. For a few real gases with very weak intermolecular attractions, PV/nRT is always greater than 1. For most gases, at low pressures the attractive forces are dominant and PV/nRT < 1. At high pressures, repulsive forces become dominant and PV/nRT > 1.
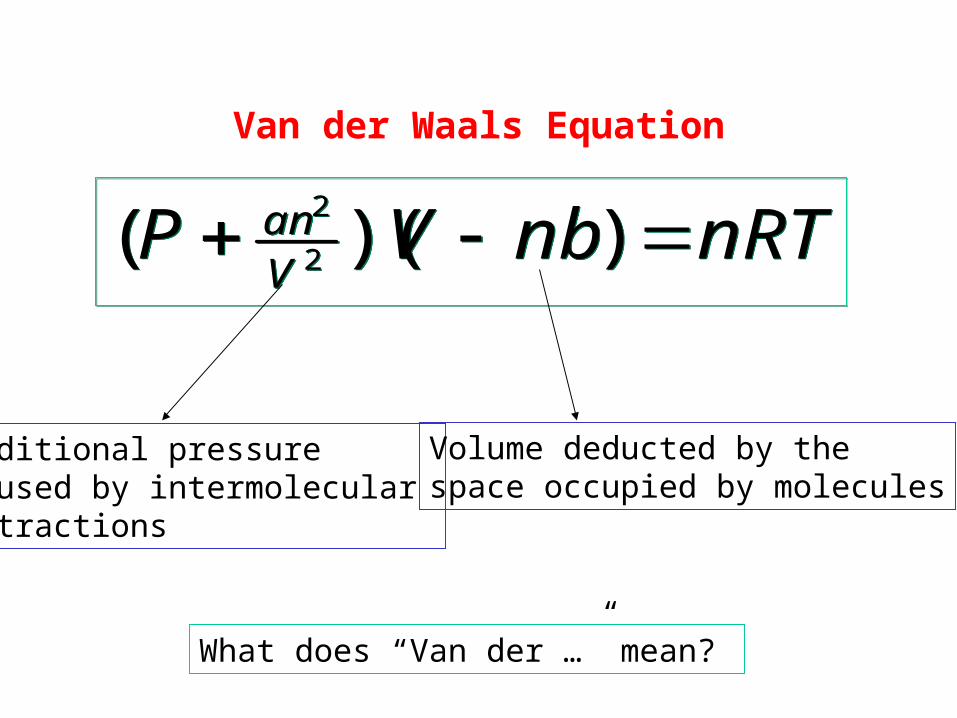
Van der Waals Equation
nRTnbVPVan ))(( 2
2
nRTnbVPVan ))(( 2
2
Additional pressureCaused by intermolecular attractions
Volume deducted by thespace occupied by molecules
What does “Van der …” mean?
Quiz
• Explain Dalton’s partial pressure formula
• Explain kinetic model of gas
• Write the expressions of average speed and root mean square speed of ideal gases
• What is Graham’s law?
• Write van der Waals equation and explain the physical meaning of the parameters
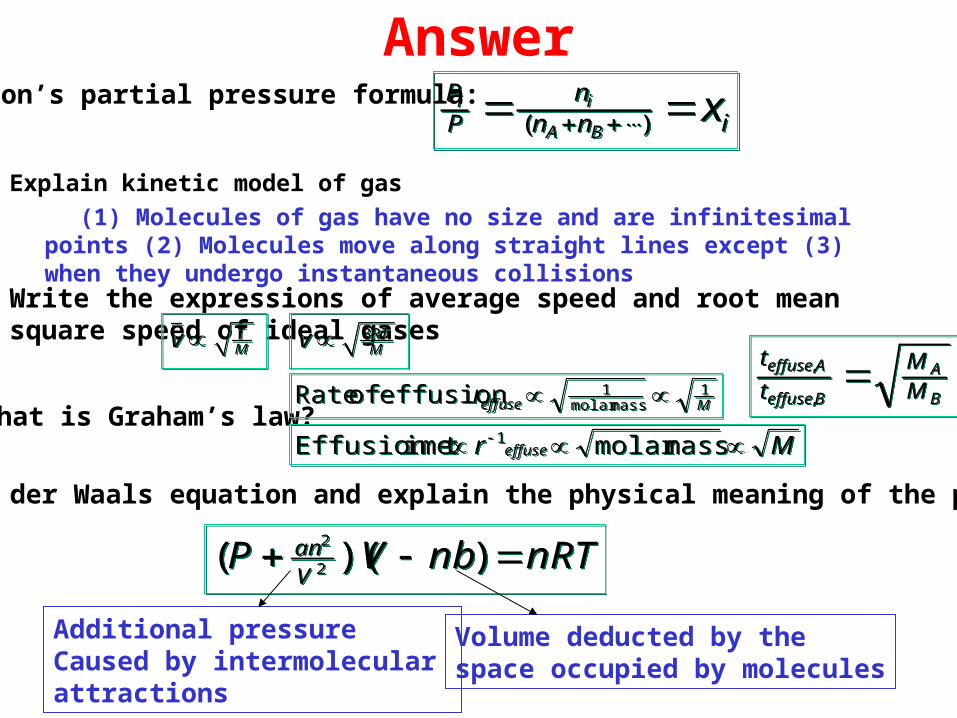
Answer
Explain kinetic model of gas
(1) Molecules of gas have no size and are infinitesimal points (2) Molecules move along straight lines except (3) when they undergo instantaneous collisions
Write the expressions of average speed and root mean square speed of ideal gases
Write van der Waals equation and explain the physical meaning of the parameters
TMv TMv 3RT
Mv 3RTMv
nRTnbVPVan ))(( 2
2
nRTnbVPVan ))(( 2
2
Additional pressureCaused by intermolecular attractions
Volume deducted by thespace occupied by molecules
( )i i
A B
P niP n n x ( )
i i
A B
P niP n n x Dalton’s partial pressure formula:
What is Graham’s law? Meffuser 1massmolar
1effusion of Rate Meffuser 1massmolar
1effusion of Rate
Mr effuse massmolar imeEffusion t 1 Mr effuse massmolar imeEffusion t 1
B
A
Beffuse
Aeffuse
MM
t
t ,
,
B
A
Beffuse
Aeffuse
MM
t
t ,
,

Assignment for Chapter 5
15, 21, 35, 47, 55, 67, 73