chapter 5, science framework, grades 6-8 - curriculum
TRANSCRIPT

The CA Science Framework was adopted by the California State Board of Education on November 3, 2016. The CA Science Framework has not been edited for publication. © by the California Department of Education.
Chapter 5
Grades Six Through Eight
Preferred Integrated Model
2016 Science Framework for California Public Schools Kindergarten through Grade 12

2016 California Science Framework Chapter 5 Grades 6-8 Preferred Integrated Model Page 7 of 306
The CA Science Framework was adopted by the California State Board of Education on November 3, 2016. The CA Science Framework has not been edited for publication. © by the California Department of Education.
Chapter 5
Grades Six Through Eight Preferred Integrated Course Model
Introduction to Grades Six Through Eight
Introduction to the Preferred Integrated Course Model for Grades Six Through Eight
Grade Six – Preferred Integrated Course Model
Integrated Grade Six Instructional Segment 1: Systems and Subsystems in Earth
and Life Sciences
Integrated Grade Six Instructional Segment 2: Earth System Interactions Cause
Weather
Integrated Grade Six Instructional Segment 3: Causes and Effects of Regional
Climates
Integrated Grade Six Instructional Segment 4: Effects of Global Warming on
Living Systems
Grade Seven – Preferred Integrated Course Model
Integrated Grade Seven Instructional Segment 1: Organisms and Nonliving
Things are Made of Atoms
Integrated Grade Seven Instructional Segment 2: Matter Cycles and Energy
Flows through Organisms and Rocks
Integrated Grade Seven Instructional Segment 3: Natural Processes and Human
Activities Shape Earth’s Resources and Ecosystems
Integrated Grade Seven Instructional Segment 4: Sustaining Biodiversity and
Ecosystem Services in a Changing World

2016 California Science Framework Chapter 5 Grades 6-8 Preferred Integrated Model Page 7 of 306
The CA Science Framework was adopted by the California State Board of Education on November 3, 2016. The CA Science Framework has not been edited for publication. © by the California Department of Education.
Grade Eight – Preferred Integrated Course Model
Integrated Grade Eight Instructional Segment 1: Objects Move and Collide
Integrated Grade Eight Instructional Segment 2: Noncontact Forces Influence
Phenomena
Integrated Grade Eight Instructional Segment 3: Evolution Explains Life’s Unity
and Diversity
Integrated Grade Eight Instructional Segment 4: Sustaining Local and Global
Biodiversity
Science Literacy and English Learners
References
Introduction to Grades Six Through Eight
The California Next General Science Standards (CA NGSS) defines two possible
progressions for middle school: the preferred Integrated Model which interweaves
science disciplines in a developmentally appropriate progression and the Discipline
Specific Model where each grade level focuses in depth on a different science
discipline.
The two models differ only in the sequence; every student is expected to meet each
middle school performance expectation by the end of grade. “Sequence” here refers to
which course (sixth, seventh, or eighth grade) a particular Performance Expectation
(PE) is mastered; this CA Science Framework makes no requirements about the order
in which PEs are taught within a given year. (The example course sequences in this CA
Science Framework describe possible storylines but are not the only way).

Table 5.1 shows a comparison of which Disciplinary Core Ideas (DCIs) are
emphasized in the PEs required at each grade level in the two models. For both
models, all eight Science and Engineering Practices (SEPs) are developed and all
seven Crosscutting Concepts (CCCs) are highlighted at some point during the course of
every year (though each lesson may only focus on one or two and each year may have
a slight emphasis on a particular subset).
As districts consider the progression that works best for their resources and local
context, they should be aware of the historical context, rationale for each model, and
potential limitations of each. This chapter outlines some of those issues.
Historical Background
The CA NGSS are aligned to the nationally developed NGSS. This nationwide effort
specified specific PEs for grades kindergarten through five but presented middle grade
standards in a grade span of sixth through eighth grade. Because California is a
kindergarten through eighth grade instructional materials adoption state, it requires that
standards be placed at specific grade levels – sixth, seventh, and eighth. Therefore, the
State Superintendent of Public Instruction (SSPI) recommended that the State Board of
Education (SBE) adopt specific placement of the standards for middle grades at each
grade level.
The SSPI convened the Science Expert Panel comprised of kindergarten through
grade twelve teachers, scientists, educators, business, industry representatives, and
informal science educators. This panel evaluated a range of options for the appropriate
organization and sequence of the PEs. The public provided feedback to the Science
Expert Panel via three open forums and a webinar. The Science Expert Panel
concluded that an integrated model for grades six through eight would be the most
effective model for optimizing student learning of NGSS; the panel subsequently
reviewed the national model that had been developed by Achieve, and adapted it to
better align with CA’s needs and recommended only the Preferred Integrated Model to
the SBE. The full list of events that led to the adoption of the Preferred Integrated
Course Model is described at the CDE Web site:
http://www.cde.ca.gov/pd/ca/sc/ngssintrod.asp. On November 6, 2013, the SBE

2016 California Science Framework Chapter 5 Grades 6-8 Preferred Integrated Model Page 5 of 306
The CA Science Framework was adopted by the California State Board of Education on November 3, 2016. The CA Science Framework has not been edited for publication. © by the California Department of Education.
unanimously passed the following motion: “To adopt the CDE staff recommendation that
the SBE adopt the proposed integrated model as the preferred model for middle grades
(6, 7, and 8) science instruction, and requested that the CDE reconvene the Science
Expert Panel to develop as an alternative model a discipline specific model based upon
the domain specific model outlined by Achieve in the NGSS Appendix K.” In December
2014, the Science Expert Panel reconvened to develop a Discipline Specific Model of
the NGSS.
The Board’s intent in their November 2013 action was for there to be one integrated
model in California for grades six through eight that was preferred by both the SSPI and
the SBE and one discipline specific model as an alternative.

Table 5.1. Comparison of When DCIs are Primarily Addressed in the Two Middle School Models
Disciplinary Core Idea Subtopic
Preferred Integrated
Discipline Specific
6 7 8 6 7 8
Earth & Space
1 Earth’s Place in the Universe Universe, Stars, Solar System X X
History of Planet Earth X X
2 Earth’s Systems Water Cycle, Weather, Climate X X
Rock cycle, Plate tectonics X X
3 Earth and Human Activity
Global climate change causes X X
Resources availability X X
Natural hazards X X
Resource consumption X X
Life
1 From Molecules to Organisms: Structures and Processes
Cells & Body Systems X X
Photosynthesis & Respiration X X
2 Ecosystems: Interactions, Energy, and Dynamics X X
3 Heredity: Inheritance and Variation of Traits
Sexual v. Asexual reproduction X X
Mutations X X
4 Biological Evolution: Unity and Diversity X X
Physical 1 Matter and its Interactions
Atoms, Molecules, States of Matter
X X
Chemical Reactions X X

2016 California Science Framework Chapter 5 Grades 6-8 Preferred Integrated Model Page 7 of 306
The CA Science Framework was adopted by the California State Board of Education on November 3, 2016. The CA Science Framework has not been edited for publication. © by the California Department of Education.
2 Motion and Stability: Forces and Interactions X X
3 Energy
Kinetic Energy & Collisions X X X
Heat & Heat Flow X X
Potential Energies & Gravity X X
4 Waves and Their Applications in Technologies for Information Transfer
X X
ETS Every course includes integrations with ETS X X X X X X
SEP Every course utilizes all eight SEPs X X X X X X
CCC Every course highlights all seven CCCs X X X X X X

2016 California Science Framework Chapter 5 Grades 6-8 Preferred Integrated Model Page 8 of 306
The CA Science Framework was adopted by the California State Board of Education on November 3, 2016. The CA Science Framework has not been edited for publication. © by the California Department of Education.
Learning from Other Successful Countries
The Science Expert Panel preferred the Integrated Model based in part on evidence
of the performance of other countries and provinces. Analyzing the science standards of
ten countries that produce significant scientific innovations and score highly on
international benchmark tests, Achieve (2010) found that all ten of these countries use
an integrated science model through middle school, and seven of the ten countries keep
science integrated all the way through grade ten. Summarizing qualitative trends from
their analysis, Achieve (2010) concluded that, "Standards based around 'unifying ideas'
for Primary through Lower Secondary seem to confer more benefits than a discipline-
based structure." This statement articulates part of the rationale behind the seven
crosscutting concepts from the CA NGSS that link together all disciplines of science and
engineering. Given that these CCCs cannot be comprehended within a single context or
even a single scientific discipline, the SBE adopted the integrated model as the
preferred model.
Matching University Training with Middle Grades Teaching
Many science teachers receive a university degree in a specific discipline of science
within a specific university department (i.e., biology, chemistry, physics, geology), so
they likely have stronger content knowledge in that field. Linda Darling-Hammond
summarizes the research on the weak but measurable link between a teacher’s subject
matter knowledge and student achievement by saying that, “the findings are not as
strong and consistent as one might suppose…. [perhaps] because subject matter
knowledge is a positive influence up to some level of basic competence in the subject
but is less important thereafter.” (Darling-Hammond 2000) Teachers with a general
science certification teaching middle school exceed that basic level of competence in all
sciences and should be able to teach effectively in both models. Perhaps more
important than university learning within a discipline is the pedagogical content
knowledge learned from years of experience teaching a specific subject area. Some of

2016 California Science Framework Chapter 5 Grades 6-8 Preferred Integrated Model Page 9 of 306
The CA Science Framework was adopted by the California State Board of Education on November 3, 2016. The CA Science Framework has not been edited for publication. © by the California Department of Education.
this PCK (pedagogical content knowledge) is discipline specific (such as awareness of
specific misconceptions within one’s discipline) (Sadler et. al. 2013), but much of it
relates to SEPs and CCCs that span all disciplines of science and will transfer fluidly
from one course model to the other. It was the judgment of the Science Expert Panel
that teachers will remain highly qualified to teach in both the Preferred Integrated and
Discipline Specific models.
Sequencing in a Developmentally-Based Learning Progression
The CA NGSS is intentionally designed so that students slowly build up knowledge
and skills in all three dimensions, addressing more sophisticated challenges or revisiting
simple ones at a deeper level as they progress through the grades. Achieve also noted
that even in exemplary standards, most countries paid insufficient attention to
developmental learning progressions. They suggest, “developers of new standards will
need to tease-out the prerequisite knowledge and skills, to provide a conceptual basis
for understanding (Achieve 2010).” Appendix E of the CA NGSS spells out the
developmental progression of ideas within each discipline, but there is also prerequisite
knowledge from one discipline that is applied in a separate discipline within the CA
NGSS. For example, it is difficult to fully understand photosynthesis, respiration, and
how matter is rearranged as organisms consume other organisms without a firm
understanding of atoms, molecules, and chemical reactions. In the Discipline specific
model, the LS DCIs appear in grade seven but core ideas about the nature of matter are
not introduced until grade eight. The Preferred Integrated Course Model was arranged
with this sequencing in mind, and the prerequisite knowledge is often placed within the
same course so that it can be taught alongside the application. Successful
implementation of the Discipline Specific Model will require some remediation of the
missing prerequisite knowledge, and the specific courses in this CA Science Framework
identify when these situations occur in each course.

2016 California Science Framework Chapter 5 Grades 6-8 Preferred Integrated Model Page 10 of 306
The CA Science Framework was adopted by the California State Board of Education on November 3, 2016. The CA Science Framework has not been edited for publication. © by the California Department of Education.
Introduction to the Preferred Integrated Course Model
for Grades Six through Eight
The Preferred Integrated Course Model provides a unique opportunity for teachers
to truly address real world phenomena, ask questions, and seek answers to those
questions without regard to disciplinary boundaries. In reality, all objects obey the laws
of physics, are made of chemical matter, interact with other parts of the Earth and
Space system, and are ultimately observed by us as living beings. Many professional
scientists do have disciplinary specializations, but more and more of these barriers are
being broken by interdisciplinary research.
The Preferred Integrated Course Model also supports the Next Generation Science
Standards for California Public Schools, Grades Kindergarten Through Grade Twelve
(CA NGSS) vision of a strong developmental progression where students spiral through
the curriculum, revisiting ideas in increasing complexity and detail. Complex scientific
problems exist within all the domains of science and engineering, and the Preferred
Integrated Course Model places the most complex phenomena at the end of the grade
span when students are most ready to face them. Students undergo a lot of growth from
sixth through eighth grade, and it makes the most sense to capitalize on their growth.
Integration was built directly into the architecture of the CA NGSS with the
dimension of Crosscutting Concepts (CCCs). These ideas are a common thread to all
disciplines. Deep understanding of the CCCs (along with the Science and Engineering
Practices or SEPs) provides a firm foundation for students to pursue future science in
any discipline. This course emphasizes the CCCs, including a strong focus on systems
at the beginning of grade six and a culmination with stability and change by the end of
grade eight (with all the other CCCs embedded along the way).
This course is designed to be an integrated course, as opposed to a coordinated
science course (Table 5.5.2): “Simply stated, the difference between coordinated and
integrated is the type of connections that can be made between and among the various
fields of science” (Sherriff 2015). Coordinated science delivers the different domains of

2016 California Science Framework Chapter 5 Grades 6-8 Preferred Integrated Model Page 11 of 306
The CA Science Framework was adopted by the California State Board of Education on November 3, 2016. The CA Science Framework has not been edited for publication. © by the California Department of Education.
science in succession while a true integration introduces and teaches related content
together to answer a single question about a phenomena within science.
Table 5.2. Integrated vs. Coordinated Science
Integrated Coordinated
Every science every year. Every science every year.
Performance Expectations are bundled
according to natural connections between
them and enable learning about the
connections in addition to what is
discipline specific.
Performance Expectations are bundled
according to discipline, resulting in
learning that is mostly discipline specific.
Connections between science disciplines
are clearly made for and by students.
Connections have to be "remembered" by
the student and the teacher.
Examples outside of a particular discipline
are given when appropriate.
Examples within a particular discipline are
normally given
A few examples:
Astronomy is taught in conjunction
with gravity and forces. The
connections and applications of
physics is applied to astronomy.
Heat (physics) is taught at the same
time with climate and weather as
the applied examples.
Light and the chemistry of
photosynthesis are all taught
interconnected.
A few examples:
Astronomy is taught conceptually
with gravity and forces taught in
separate units that may not connect
to astronomy.
Heat is taught as a separate
physics unit. Climate and weather
are taught as a separate unit.
Light is taught as a separate unit as
strictly physics with no connections
to life science needed.
Source: Sherriff 2015.

2016 California Science Framework Chapter 5 Grades 6-8 Preferred Integrated Model Page 12 of 306
The CA Science Framework was adopted by the California State Board of Education on November 3, 2016. The CA Science Framework has not been edited for publication. © by the California Department of Education.
Purpose and Limitations of this Example Course
The CA NGSS do not specify which phenomena to explore or the order to address
topics because phenomena need to be relevant to the students that live in each
community and should flow in an authentic manner. This chapter illustrates one possible
set of phenomena that will help students achieve the CA NGSS Performance
Expectations (PEs). The phenomena chosen for this statewide document will not be
ideal for every classroom in a state as large and diverse as California. Teachers are
therefore encouraged to select phenomena that will engage their students and use this
chapter’s examples as inspiration for designing their own instructional sequence.
In this chapter’s examples, each year is divided into Instructional Segments (IS)
centered on questions about observations of a specific phenomenon. Different
phenomena require different amounts of investigation to explore and understand, so
each IS should take a different fraction of the school year. As students achieve the PEs
within each IS, they uncover Disciplinary Core Ideas (DCIs) from the different fields of
science (Physical Science, Life Science, and Earth & Space Science) and engineering.
Students engage in multiple practices in each IS, not only those explicitly indicated in
the PEs. Students also focus on one or two CCCs as tools to make sense of their
observations and investigations; the CCCs are recurring themes in all disciplines of
science and engineering and help tie these seemingly disparate fields together. The
SEPs, DCIs, and CCCs grow in sophistication and complexity throughout the K–12
sequence. While this chapter calls out examples of the three dimensions in the text
using color coding, each element should be interpreted with this grade-appropriate
complexity in mind (Appendix 1 of this Framework clarifies the expectations at each
grade span in the developmental progression). Engineering, technology, and application
of science (ETS1) are a fundamental part of each course. As students explore their
environment during this grade span, they develop their growing understanding of the
interconnections and interdependence of Earth’s natural systems and human social
systems as outlined in California’s Environmental Principles and Concepts (EP&Cs). All
three of the CA NGSS dimensions and the EP&Cs will prepare students to make

2016 California Science Framework Chapter 5 Grades 6-8 Preferred Integrated Model Page 13 of 306
The CA Science Framework was adopted by the California State Board of Education on November 3, 2016. The CA Science Framework has not been edited for publication. © by the California Department of Education.
decisions about California’s future and become sources of innovative solutions to the
problems the state may face in the future.
Essential Shifts in the CA NGSS
The 1998 Science Content Standards for California Public Schools: Kindergarten
through Grade Twelve (1998 CA Science Standards) were written at a low cognitive
level (“Students know…”), with some attention paid to the process of science as a
separate set of “Investigation and Inquiry” standards. In the CA NGSS, every PE is
‘three-dimensional’, meaning that it requires proficiency in SEPs alongside a deep
understanding of DCIs and the ability to relate these ideas to CCCs that are common
across the disciplines. As a result, instructional materials and strategies must shift.
Some have described the CA NGSS as having “more depth and less breadth,” but
that may not be a precise description. In many of the instructional segments of these
middle school courses, students may be expected to know fewer details about
phenomena than they did in the 1998 CA Science Standards, with the focus shifted to
richer reasoning and opportunities to apply knowledge. These details are not missing
from the CA NGSS, but they have just been moved from middle school to the more
developmentally appropriate position in high school. The level of detail builds up slowly.
As teachers, we often complain that our students do not remember concepts from year-
to-year, but perhaps this forgetting is a consequence of our desire to provide self-
contained instruction segments that answer all the questions raised by the time of the
test, just like a 30-minute episode of a sitcom on television. The CA NGSS is more like
a long-running drama series with a number of interweaved storylines that develop over
years. In order to accomplish this slow build up, teachers will likely have to make major
modifications to some of their favorite lessons or even leave them behind because
those lessons focus on providing all the ‘answers’ where students memorize the details
and jargon that represent the current state of understanding of science by scientists.
The time they used to spend on those parts of the lessons will instead be invested in
asking students to apply their mental models [SEP-2] of the physical world like
scientists grappling with new situations, and to talk like scientists not by using scientific
words but by being able to provide evidence [SEP-7] to support their claims. Districts

2016 California Science Framework Chapter 5 Grades 6-8 Preferred Integrated Model Page 14 of 306
The CA Science Framework was adopted by the California State Board of Education on November 3, 2016. The CA Science Framework has not been edited for publication. © by the California Department of Education.
and schools will need to invest in significant resources for professional development to
help teachers make these modifications in supportive, collaborative environments.
Grade Six – Preferred Integrated Course Model
This section is meant to be a guide for educators on how to approach the teaching of
the CA NGSS in grade six according to the Preferred Integrated Course Model (see the
introduction to this chapter for further details regarding different models for grades six,
seven, and eight). It is not meant to be an exhaustive list of what can be taught or how it
should be taught.
A primary goal of this section is to provide an example of how to bundle the PEs into
integrated groups that can effectively guide instruction in four sequential IS. There is no
prescription regarding the relative amount of time to be spent on each IS. As shown in
figure 5.1, the overarching guiding concept for the entire year is, “Systems within
organisms and between them are adapted to Earth’s climate systems.”

2016 California Science Framework Chapter 5 Grades 6-8 Preferred Integrated Model Page 15 of 306
The CA Science Framework was adopted by the California State Board of Education on November 3, 2016. The CA Science Framework has not been edited for publication. © by the California Department of Education.
Figure 5.1. Grade Six Integrated Storyline
Guiding Concept: Systems within organisms and between them are adapted to Earth’s climate systems.
IS
Life Science (LS) Earth & Space Sciences (ESS)
Physical Science (PS)
Engineering, Technology, and Applications to Science (ETS)
1
A cell, a person, and planet Earth are each a system made up of subsystems.
Source: NASA/Goddard Space Flight Center 2008
All living things are made of cells. The body is a system made of interacting subsystems.
Water cycles among the land, ocean, and atmosphere. Weather and climate involve interactions among Earth’s subsystems
Design Criteria Evaluate Solutions
2
Weather conditions result from the interactions among different Earth subsystems.
Source: University of Wisconsin 2010
The movement of water and interacting air masses helps determine local weather patterns and conditions. The ocean has a strong influence on weather and climate.
Temperature measures the average kinetic energy of the particles that make up matter. Energy transfers from hot materials to cold materials. The type and amount of matter affects how much an object’s temperature will change.
Design Criteria Evaluate Solutions Analyze data Iteratively test and modify

2016 California Science Framework Chapter 5 Grades 6-8 Preferred Integrated Model Page 16 of 306
The CA Science Framework was adopted by the California State Board of Education on November 3, 2016. The CA Science Framework has not been edited for publication. © by the California Department of Education.
IS
Life Science (LS) Earth & Space Sciences (ESS)
Physical Science (PS)
Engineering, Technology, and Applications to Science (ETS)
3
Regional climates strongly influence regional plant and animal structures and behaviors.
Source: Geology Cafe 2012
Variations of inherited trains arise from genetic differences. Genetic traits and local conditions affect the growth of organisms. Organisms rely on their body structures and behavior to survive long enough to reproduce.
Energy input from the Sun varies with latitude, creating patterns in climate. Energy flow through the atmosphere, hydrosphere, geosphere, and biosphere affect local climate. Density variations drive global patterns of air and ocean currents.
The type and amount of matter affects how much an object’s temperature will change.
4
Human activities can change the amount of global warming, which impacts plants and animals.
Source: Chau 2016
Local conditions affect the growth of organisms. Organisms rely on their body structures and behavior to survive, but these adaptations may not be enough to survive as the climate changes.
Human changes to Earth’s environment can have dramatic impacts on different organisms. Burning fossils fuels is a major cause of global warming. Strategic choices can reduce the amounts and impacts of climate change.
Design Criteria Evaluate Solutions Analyze data

2016 California Science Framework Chapter 5 Grades 6-8 Preferred Integrated Model Page 17 of 306
The CA Science Framework was adopted by the California State Board of Education on November 3, 2016. The CA Science Framework has not been edited for publication. © by the California Department of Education.
In IS1, students define systems and system models [CCC-4] and apply these
ideas to different Earth science and life science contexts. A key understanding from IS1
is that systems [CCC-4] are made of component parts that interconnect with each
other. Moreover each of the component parts is itself a system that is made of
component parts. This notion of systems within systems within systems (also called
nested systems) is particularly apparent in analyzing a “human being system” that is
made of components called body systems (e.g., the circulatory system) that are made
of organs (e.g., the heart) that are made of tissues that consist of different kinds of cells.
In IS2, students explore California weather from the perspective of the flow of
energy and cycling of matter [CCC-5] within a system [CCC-4]. In grade five
students developed models [SEP-2] of how Earth’s systems interact (IS1 reviews the
systems). They also explored the reservoirs of the water cycle. In IS2 students deepen
their understanding by analyzing the processes of the water cycle and the physical
science underlying these processes. These Earth science and physical science
concepts are then applied to understanding weather in different California regions.
Patterns [CCC-1] of temperature and precipitation are causally related [CCC-2] to
geographical features such as proximity to the ocean, latitude, altitude, and proximity to
mountains. The water cycle is also very important conceptually because of its central
role in weather phenomena and because it provides an example of a property of a
whole system [CCC-4] that is different than the properties of its parts.
IS3 extends the students’ investigations to the more general level of regional climate
in different parts of the planet. At the level of climate, students can correlate the cause
and effect [CCC-2] relationships that determine regional climate patterns and the
circulation of matter and energy [CCC-5] by the atmosphere and ocean. Students also
correlate cause and effect [CCC-2] relationships between the climate of a region and
the structures and behaviors of plants and animals that live in that region. Regional
climate provides another compelling example of a property of a whole system [CCC-4].
IS4 concludes the year by scaling [CCC-3] from the regional climate level to the
level of global warming. In previous IS, students had several opportunities to design

2016 California Science Framework Chapter 5 Grades 6-8 Preferred Integrated Model Page 18 of 306
The CA Science Framework was adopted by the California State Board of Education on November 3, 2016. The CA Science Framework has not been edited for publication. © by the California Department of Education.
solutions to problems primarily from engineering and technology perspectives. During
IS4, they have opportunities to work on projects related to monitoring an environmental
issue and designing solutions [SEP-6] to reduce the impacts related to that issue.
Global climate change provides many opportunities to further develop and apply skills
relating to the technological and scientific aspects of solving societal problems. Global
climate change also provides a real world context where some of the criteria and
constraints can involve social motivations and patterns of behavior that must be
considered as part of the design in solving a problem.

2016 California Science Framework Chapter 5 Grades 6-8 Preferred Integrated Model Page 19 of 306
The CA Science Framework was adopted by the California State Board of Education on November 3, 2016. The CA Science Framework has not been edited for publication. © by the California Department of Education.
Integrated Grade Six Instructional Segment 1: Systems and Subsystems in Earth
and Life Science
The CCC of Systems and System Models [CCC-4] is a very useful tool that can
help learners to connect ideas within a topic and also across science disciplines. The
Overview chapter of this CA Science Framework provides a detailed definition of
systems [CCC-4] in the CA NGSS. In brief, systems are a just a way of thinking about
a small section of the world and the objects and processes that occur within that
section. In this IS, students practice defining systems, recognizing their components,
and describing how they interact using examples at a range of scales from cells to
organisms to the entire planet Earth.
Integrated Grade Six – Instructional Segment 1: Systems and
Subsystems in Earth and Life Science
Guiding Questions:
How are living systems and Earth systems similar and different?
What is the value of creating a systems model?
Performance Expectations
Students who demonstrate understanding can:
MS-LS1-1. Conduct an investigation to provide evidence that living things
are made of cells; either one cell or many different numbers
and types of cells. [Clarification Statement: Emphasis is on
developing evidence that living things (including Bacteria,
Archaea, and Eukarya) are made of cells, distinguishing
between living and non-living things, and understanding that
living things may be made of one cell or many and varied cells.
Viruses, while not cells, have features that are both common
with, and distinct from, cellular life.]
2016 California Science Framework Chapter 5 Grades 6-8 Preferred Integrated Model Page 20 of 306
The CA Science Framework was adopted by the California State Board of Education on November 3, 2016. The CA Science Framework has not been edited for publication. © by the California Department of Education.
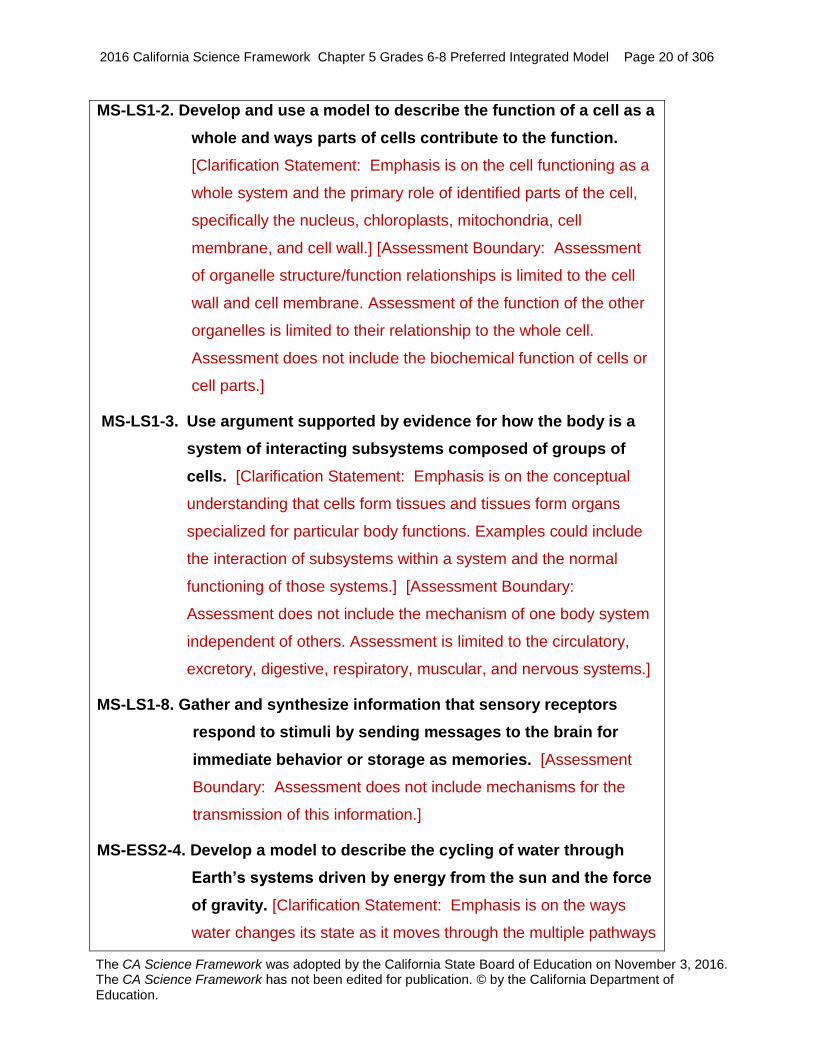
MS-LS1-2. Develop and use a model to describe the function of a cell as a
whole and ways parts of cells contribute to the function.
[Clarification Statement: Emphasis is on the cell functioning as a
whole system and the primary role of identified parts of the cell,
specifically the nucleus, chloroplasts, mitochondria, cell
membrane, and cell wall.] [Assessment Boundary: Assessment
of organelle structure/function relationships is limited to the cell
wall and cell membrane. Assessment of the function of the other
organelles is limited to their relationship to the whole cell.
Assessment does not include the biochemical function of cells or
cell parts.]
MS-LS1-3. Use argument supported by evidence for how the body is a
system of interacting subsystems composed of groups of
cells. [Clarification Statement: Emphasis is on the conceptual
understanding that cells form tissues and tissues form organs
specialized for particular body functions. Examples could include
the interaction of subsystems within a system and the normal
functioning of those systems.] [Assessment Boundary:
Assessment does not include the mechanism of one body system
independent of others. Assessment is limited to the circulatory,
excretory, digestive, respiratory, muscular, and nervous systems.]
MS-LS1-8. Gather and synthesize information that sensory receptors
respond to stimuli by sending messages to the brain for
immediate behavior or storage as memories. [Assessment
Boundary: Assessment does not include mechanisms for the
transmission of this information.]
MS-ESS2-4. Develop a model to describe the cycling of water through
Earth’s systems driven by energy from the sun and the force
of gravity. [Clarification Statement: Emphasis is on the ways
water changes its state as it moves through the multiple pathways
2016 California Science Framework Chapter 5 Grades 6-8 Preferred Integrated Model Page 21 of 306
The CA Science Framework was adopted by the California State Board of Education on November 3, 2016. The CA Science Framework has not been edited for publication. © by the California Department of Education.
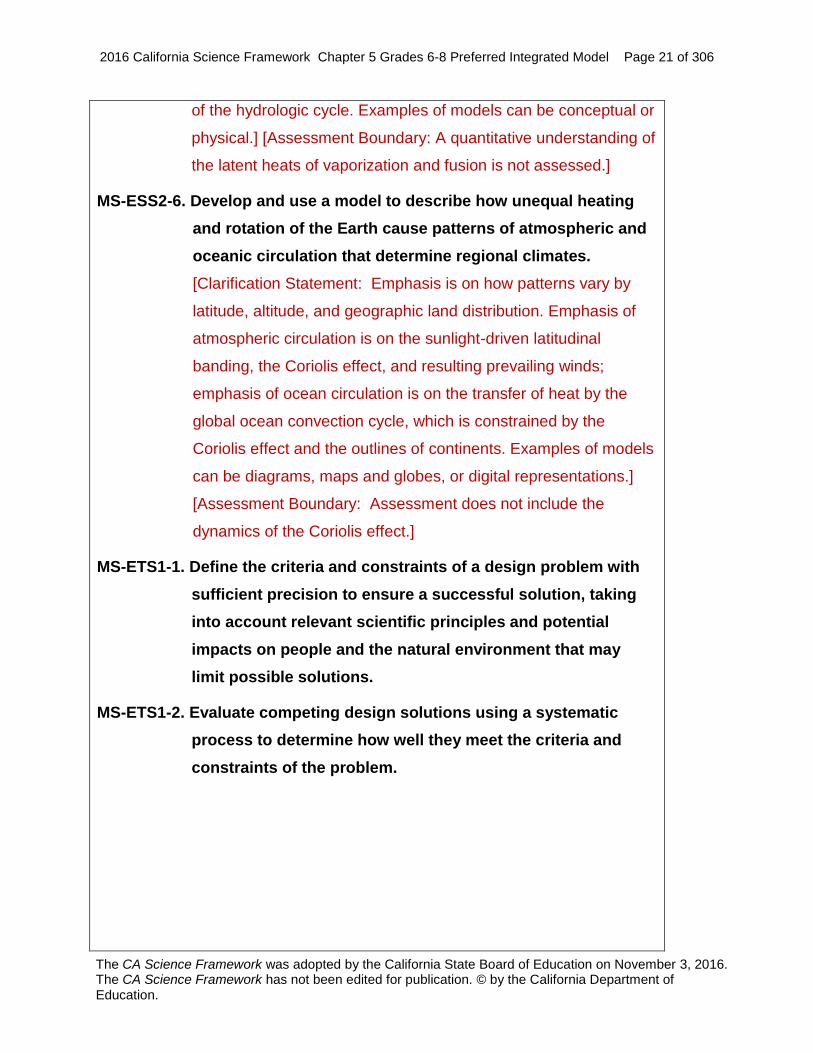
of the hydrologic cycle. Examples of models can be conceptual or
physical.] [Assessment Boundary: A quantitative understanding of
the latent heats of vaporization and fusion is not assessed.]
MS-ESS2-6. Develop and use a model to describe how unequal heating
and rotation of the Earth cause patterns of atmospheric and
oceanic circulation that determine regional climates.
[Clarification Statement: Emphasis is on how patterns vary by
latitude, altitude, and geographic land distribution. Emphasis of
atmospheric circulation is on the sunlight-driven latitudinal
banding, the Coriolis effect, and resulting prevailing winds;
emphasis of ocean circulation is on the transfer of heat by the
global ocean convection cycle, which is constrained by the
Coriolis effect and the outlines of continents. Examples of models
can be diagrams, maps and globes, or digital representations.]
[Assessment Boundary: Assessment does not include the
dynamics of the Coriolis effect.]
MS-ETS1-1. Define the criteria and constraints of a design problem with
sufficient precision to ensure a successful solution, taking
into account relevant scientific principles and potential
impacts on people and the natural environment that may
limit possible solutions.
MS-ETS1-2. Evaluate competing design solutions using a systematic
process to determine how well they meet the criteria and
constraints of the problem.

2016 California Science Framework Chapter 5 Grades 6-8 Preferred Integrated Model Page 22 of 306
The CA Science Framework was adopted by the California State Board of Education on November 3, 2016. The CA Science Framework has not been edited for publication. © by the California Department of Education.
The bundle of performance expectations above focuses on the following
elements from the NRC document A Framework for K–12 Science Education:
Highlighted
Science and
Engineering Practices
[SEP-1] Asking
Questions and
Defining Problems
[SEP-2] Developing
and Using Models
[SEP-6] Constructing
Explanations (for
science) and
Designing Solutions
(for engineering)
[SEP-7] Engaging in
Argument from
Evidence
[SEP-8] Obtaining,
Evaluating, and
Communicating
Information
Highlighted
Disciplinary Core Ideas
LS1.A: Structure and
Function
ESS2.C: The Role of
Water in Earth’s
Surface Processes
ESS2.D: Weather and
Climate
ETS1.A: Defining and
Delimiting Engineering
Problems
ETS1.B: Developing
Possible Solutions
Highlighted
Crosscutting Concepts
[CCC-2] Cause and
Effect
[CCC-4] System and
System Models

2016 California Science Framework Chapter 5 Grades 6-8 Preferred Integrated Model Page 23 of 306
The CA Science Framework was adopted by the California State Board of Education on November 3, 2016. The CA Science Framework has not been edited for publication. © by the California Department of Education.
Highlighted California Environmental Principles & Concepts:
Principle II The long-term functioning and health of terrestrial, freshwater,
coastal and marine ecosystems are influenced by their
relationships with human societies.
Principle III Natural systems proceed through cycles that humans depend
upon, benefit from and can alter.
Principle IV The exchange of matter between natural systems and human
societies affects the long term functioning of both.
CA CCSS Math Connections: 6.EE.9
CA ELD Connections: ELD.PI.6.6a-b,10,9,11a
CA CCSS ELA/Literacy Connections: RST.6-8.1, R.I.6.8, WHST.6-8.1,7,8,9, SL.6.5
The scientific definition of a system differs from the everyday language definition.
Students often equate systems with cycles such as a life cycle or a collection of circles
like the solar system. Rather than focusing initially on terminology and definitions,
students can begin this IS by exploring a situation that exemplifies the key features of
systems. Students obtain information [SEP-8] about the massive experiment called
Biosphere2 where scientists placed plants, animals, and people in an air-tight glass
building to see what challenges they faced as they tried to survive together as a system.
As an anchoring phenomenon for this unit, students learn about how the project failed
when some animals died and oxygen levels were unsafe. After watching a short video
that describes some of the events that occurred in the Biosphere experiment, students
consider the question, “What did the scientists in the Biosphere need to survive and
where did they get it?” For food, the people ate fish, “but what did the fish need to
survive and where did they get it?” As students draw a system model [SEP-2] that
traces out the exchange of energy and matter, they grapple with the key features of
systems [CCC-4]: boundaries, components, interactions, inputs/outputs, and one or
more system properties.

2016 California Science Framework Chapter 5 Grades 6-8 Preferred Integrated Model Page 24 of 306
The CA Science Framework was adopted by the California State Board of Education on November 3, 2016. The CA Science Framework has not been edited for publication. © by the California Department of Education.
Opportunities for ELA/ELD Connections
Have students explore the classroom and find examples of what they predict are
systems (e.g., sound, computer, body, ecosystems). Provide students with a graphic
organizer that has them write the reason they identified it is a system, using words,
phrases or sentences depending on their level of English proficiency. Place students in
groups, and using their graphic organizer, have students take turns to report the
information they gathered. Next, have them read appropriate science text and identify
the five features of systems within the text. Using evidence from text and language
frames, have them discuss the connections between their classroom example and
textual evidence, including a definition, gathered that either confirm or refute it as a
system. Ask students in their groups to revisit their classroom examples and reach
consensus on whether or not each meets the criteria of a system based on the five
important features [CCC-4]: boundaries, components, interactions, inputs/outputs, and
one or more system properties.
CA CCSS ELA/Literacy Standards: RST.6–8.1, 2, 4; SL.6–8.1
CA ELD Standards: ELD.PI.6–8.1, 2
Human Body Systems
Next students focus on their own body system (figure 5.2). Explicitly discussing the
features of a system [CCC-4] is just the first step in creating a system model [SEP-2]
that can explain different phenomena in a human body. For example, “Why does my
heart race when I get scared?” requires that students obtain information [SEP-8]
about how different components of the body interact. Students trace the chain of
interactions from the energy input to their system (via sense receptors) to low level
interactions in the nervous system to the endocrine system (transfer of energy as
electrical impulses). The endocrine system then transfers matter into the circulatory
system (adrenaline and other hormones) that stimulates the muscular system to react,
enabling a body as a whole to run away from a dangerous situation. The brain also
encodes these perceptions as memories to anticipate future problems (MS-LS1-8).

2016 California Science Framework Chapter 5 Grades 6-8 Preferred Integrated Model Page 25 of 306
The CA Science Framework was adopted by the California State Board of Education on November 3, 2016. The CA Science Framework has not been edited for publication. © by the California Department of Education.
Figure 5.2. Features of a Human Person System
Features of Systems
Source: Illustration adapted from Folsom and Daehler 2012.
When tracing out these interactions within he body system, students uncover the
middle school understanding that, “Systems may interact with other systems; they may
have subsystems and be a part of larger more complex systems” (NGSS Lead States
2013). In other words, the components of a system are generally themselves systems
that are made of smaller components (figure 5.3). Students must be able to use
examples of body phenomena to support an argument [SEP-7] that the human body
has interacting subsystems (MS-LS3-1).

2016 California Science Framework Chapter 5 Grades 6-8 Preferred Integrated Model Page 26 of 306
The CA Science Framework was adopted by the California State Board of Education on November 3, 2016. The CA Science Framework has not been edited for publication. © by the California Department of Education.
Figure 5.3. Systems Within Systems Within Systems
Body systems, such as the circulatory system, are examples of systems within systems
within systems. Source: Sussman 2000.
Engineering Connection: Systems Models of Organ and Tissue Donation
Teaching about organ and tissue donation provides opportunities to connect learning
about body systems [CCC-4] with a socially beneficial topic that also has strong
connections with engineering and technology. Donate Life California has an informative
website that includes educator resources, notably an Interactive Body Tour (see Donate
Life California at http://www.donatelifecalifornia.org/education/how-donation-works).
Students can work in groups to research and learn about organ and tissue donation
related to different body systems and diseases. They can create system diagrams
related to the different diseases and transplantation remedies as well as representing
the system for soliciting donors, identifying recipients, and getting the organs/tissues to
the patients in excellent condition and within the necessary criteria and time constraints.

2016 California Science Framework Chapter 5 Grades 6-8 Preferred Integrated Model Page 27 of 306
The CA Science Framework was adopted by the California State Board of Education on November 3, 2016. The CA Science Framework has not been edited for publication. © by the California Department of Education.
Students can also evaluate (SEP-8) how well the web page motivates people to
become donors. Without a large pool of potential donors, doctors won’t be able to
provide transplants to people that need them. Sharing these issues to policy makers
and the public are important aspects of communicating science [SEP-8]. Students
can also analyze donor recruitment as a system that they can identify constraints
[SEP-1] and propose solutions [SEP-6] to increase the number of people who
volunteer to become donors. This kind of system modeling [CCC-4] extends the
crosscutting concept beyond physical science and engineering into applications of
science to social issues.
Components of subsystems can even be considered systems themselves when
viewed at a smaller scale [CCC-3]. Students can focus in on a phenomenon that
requires them to understand interactions at the level of an individual cell. For example,
“What happens to the body when someone gets cancer?” Doctors have figured out that
cancer occurs when a cell ‘malfunctions,’ so students will need to know what a cell is
and how it normally functions. Students begin by performing an investigation [SEP-3]
to gather evidence that living things are made of cells and non-living things are not (MS-
LS1-1). Comparing microscope images of non-living objects and different types of cells,
students can identify similarities and differences between each of the cells. Then they
ask questions [SEP-1] about the role of the parts they see. Why do red blood cells
have no large circle in the center? Why is a sperm cell so small and an egg so big? Why
do all plant cells have a thick wall around them but animal cells do not? Why do all plant
cells have green circles in them but animal cells do not? With scaffolding from the
teacher and other resources, they use their observations to develop a model [SEP-2]
of what several parts of the cell do: the nucleus, mitochondria, chloroplasts, cell wall,
and cell membrane. The clarification statement of MS-LS1-2 specifies this limited set of
parts so that students can focus on the key structures that facilitate energy and
reproduction, and the details of other organelles will not be assessed in the middle
grades (student will expand their model in high school as part of the developmental
progression of the CA NGSS). Students obtain information [SEP-8] from books or
2016 California Science Framework Chapter 5 Grades 6-8 Preferred Integrated Model Page 28 of 306
The CA Science Framework was adopted by the California State Board of Education on November 3, 2016. The CA Science Framework has not been edited for publication. © by the California Department of Education.
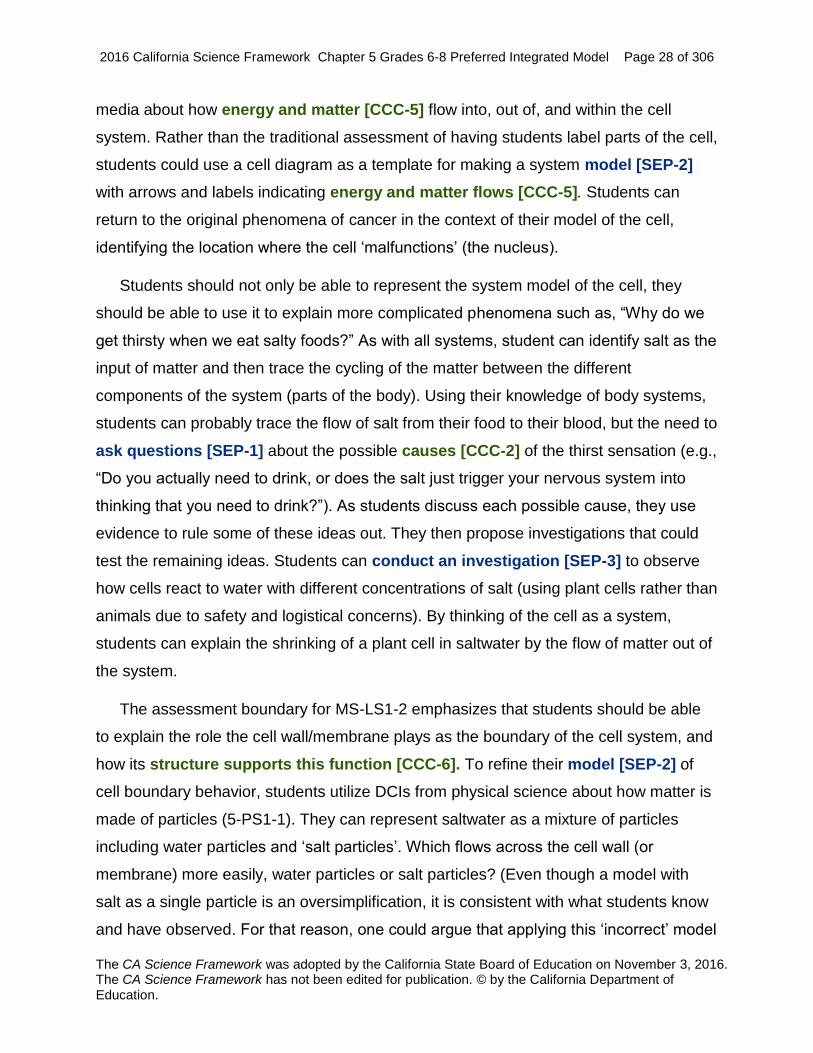
media about how energy and matter [CCC-5] flow into, out of, and within the cell
system. Rather than the traditional assessment of having students label parts of the cell,
students could use a cell diagram as a template for making a system model [SEP-2]
with arrows and labels indicating energy and matter flows [CCC-5]. Students can
return to the original phenomena of cancer in the context of their model of the cell,
identifying the location where the cell ‘malfunctions’ (the nucleus).
Students should not only be able to represent the system model of the cell, they
should be able to use it to explain more complicated phenomena such as, “Why do we
get thirsty when we eat salty foods?” As with all systems, student can identify salt as the
input of matter and then trace the cycling of the matter between the different
components of the system (parts of the body). Using their knowledge of body systems,
students can probably trace the flow of salt from their food to their blood, but the need to
ask questions [SEP-1] about the possible causes [CCC-2] of the thirst sensation (e.g.,
“Do you actually need to drink, or does the salt just trigger your nervous system into
thinking that you need to drink?”). As students discuss each possible cause, they use
evidence to rule some of these ideas out. They then propose investigations that could
test the remaining ideas. Students can conduct an investigation [SEP-3] to observe
how cells react to water with different concentrations of salt (using plant cells rather than
animals due to safety and logistical concerns). By thinking of the cell as a system,
students can explain the shrinking of a plant cell in saltwater by the flow of matter out of
the system.
The assessment boundary for MS-LS1-2 emphasizes that students should be able
to explain the role the cell wall/membrane plays as the boundary of the cell system, and
how its structure supports this function [CCC-6]. To refine their model [SEP-2] of
cell boundary behavior, students utilize DCIs from physical science about how matter is
made of particles (5-PS1-1). They can represent saltwater as a mixture of particles
including water particles and ‘salt particles’. Which flows across the cell wall (or
membrane) more easily, water particles or salt particles? (Even though a model with
salt as a single particle is an oversimplification, it is consistent with what students know
and have observed. For that reason, one could argue that applying this ‘incorrect’ model

2016 California Science Framework Chapter 5 Grades 6-8 Preferred Integrated Model Page 29 of 306
The CA Science Framework was adopted by the California State Board of Education on November 3, 2016. The CA Science Framework has not been edited for publication. © by the California Department of Education.
is more ‘scientifically accurate’ in that it exemplifies the tentative nature of scientific
models built on observable evidence. Students will revise this model of saltwater later in
high school when they find that a single ‘salt’ particle cannot explain the electrical
conductivity of saltwater.)
Earth Systems
The salt tolerance of plants is topic for agriculture and also motivates a transition to
looking at a larger system of systems, the planet Earth. What happens to plants near
the coast when rising sea level bring salty water into the soil? Students can obtain
information [SEP-8] about saltwater intrusion in coastal aquifers as an entry point into
thinking about the entire planet Earth as a system of interacting subsystems. In grade
five students learned that planet Earth can be thought of as four major systems (Table
5.). Some scientists argue that there should be a fifth sphere called the anthroposphere
that highlights the importance of humanity and all its creations.
Table 5.3. Earth's Systems
Earth’s
System
Earth’s Materials
Geosphere Rocks, minerals, and landforms at Earth’s surface and in its interior,
including soil, sediment, and molten rocks.
Hydrosphere Water, including ocean water, groundwater, glaciers and ice caps,
rivers, lakes, etc.
Atmosphere Gases surrounding the Earth (i.e., our air)
Biosphere Living organisms, including humans.
While in fifth grade, they focused on the functioning of each individual system, they
progress to understanding the Earth as a singular system where each of the Earth

2016 California Science Framework Chapter 5 Grades 6-8 Preferred Integrated Model Page 30 of 306
The CA Science Framework was adopted by the California State Board of Education on November 3, 2016. The CA Science Framework has not been edited for publication. © by the California Department of Education.
systems they learned in fifth grade are now viewed as a component or subsystem of the
larger scale planet system is now viewed as a component or subsystem of the larger
scale planet system. Learners of all ages generally expect that definitions, especially in
science, should be precise and either/or – that the geosphere, for example, is either its
own system or a component of a larger system, but not both at the same time. Older
grade levels in science often mark an advance beyond rigid “either/or” thinking toward
“both/and” nuances and complexity. In the case of saltwater intrusion, rising
temperature in the atmosphere exchanges energy with water in the hydrosphere
causing it to warm and expand. That water flows into soft sands in the geosphere where
it becomes a part of groundwater. There, plant roots bring it into the biosphere. When
thinking about Earth systems, water is commonly exchanged as output from one
subsystem and input to a different one, but water is also considered a subsystem of its
own (the hydrosphere). This ambiguity highlights how system boundaries can often be
challenging to define. The person modeling the system (scientist, teacher, student) has
the freedom to choose the boundaries of the system based upon the goal of the
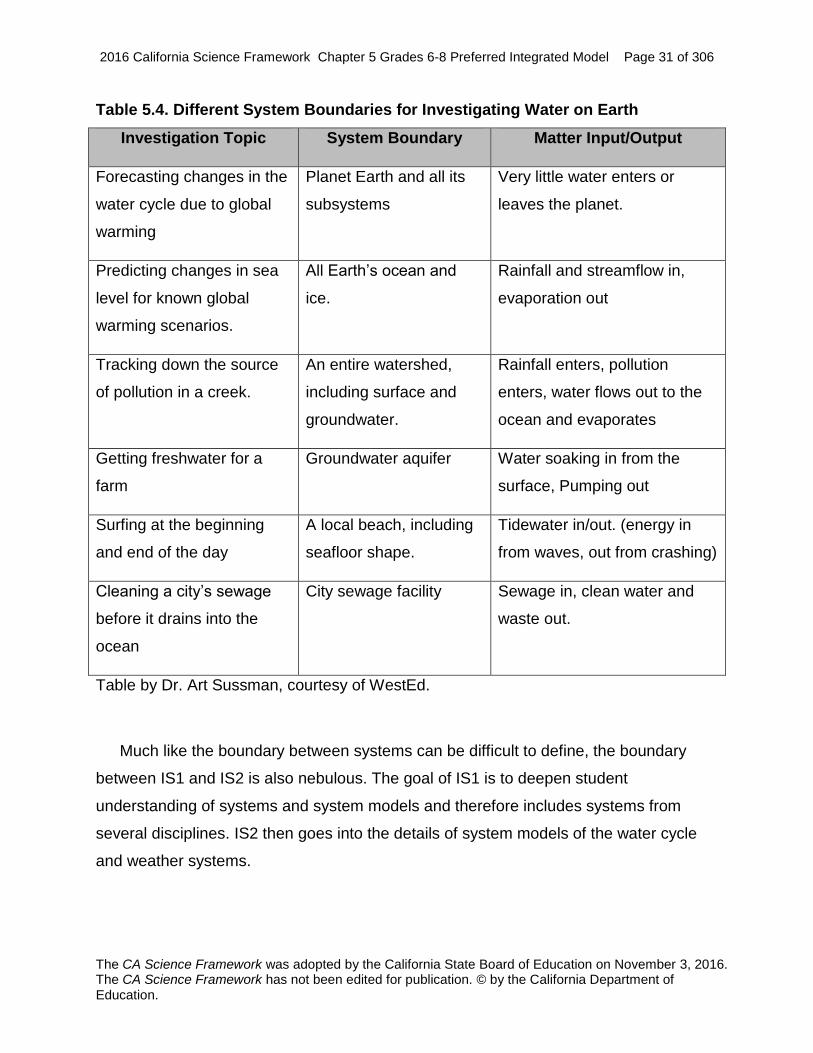
modeling. In studying water on Earth, Table 5.4. Different System Boundaries for
Investigating Water on Earth Table 5. indicates the boundaries that different people
might choose based on different goals of their investigations. Students also gain insight
into system boundaries by explicitly comparing the boundaries in body and cell systems
to boundaries in the Earth system. Students can practice identifying the appropriate
boundaries for investigating phenomena from other disciplines explored in earlier
grades (e.g., What causes an egg to break when it drops? [PS2.A] Why do animals
move into the city during a drought? [LS2.C] Why is gold so expensive? [ESS3.A]).
2016 California Science Framework Chapter 5 Grades 6-8 Preferred Integrated Model Page 31 of 306
The CA Science Framework was adopted by the California State Board of Education on November 3, 2016. The CA Science Framework has not been edited for publication. © by the California Department of Education.
Table 5.4. Different System Boundaries for Investigating Water on Earth
Investigation Topic System Boundary Matter Input/Output
Forecasting changes in the
water cycle due to global
warming
Planet Earth and all its
subsystems
Very little water enters or
leaves the planet.
Predicting changes in sea
level for known global
warming scenarios.
All Earth’s ocean and
ice.
Rainfall and streamflow in,
evaporation out
Tracking down the source
of pollution in a creek.
An entire watershed,
including surface and
groundwater.
Rainfall enters, pollution
enters, water flows out to the
ocean and evaporates
Getting freshwater for a
farm
Groundwater aquifer Water soaking in from the
surface, Pumping out
Surfing at the beginning
and end of the day
A local beach, including
seafloor shape.
Tidewater in/out. (energy in
from waves, out from crashing)
Cleaning a city’s sewage
before it drains into the
ocean
City sewage facility Sewage in, clean water and
waste out.
Table by Dr. Art Sussman, courtesy of WestEd.
Much like the boundary between systems can be difficult to define, the boundary
between IS1 and IS2 is also nebulous. The goal of IS1 is to deepen student
understanding of systems and system models and therefore includes systems from
several disciplines. IS2 then goes into the details of system models of the water cycle
and weather systems.

2016 California Science Framework Chapter 5 Grades 6-8 Preferred Integrated Model Page 32 of 306
The CA Science Framework was adopted by the California State Board of Education on November 3, 2016. The CA Science Framework has not been edited for publication. © by the California Department of Education.
Integrated Grade Six Instructional Segment 2: Earth System Interactions Cause
Weather
An integrated approach to weather phenomena investigates the causes of weather
in terms of a PS understanding of energy transfer, the mechanisms of weather in terms
of ESS systems, and the effects of weather on living systems. When drawing DCIs from
all the disciplines, students apply their understanding of systems [CCC-4] from IS1.
Students will consider cause and effect mechanisms [CCC-2] at a broad range of
scales [CCC-3] from the level of particles of matter up through the entire Earth system.
Integrated Grade Six – Instructional Segment 2: Earth System
Interactions Cause Weather
Guiding Questions:
Why is the weather so different in different parts of California?
How is weather related to the transfer of energy?
How do models help us understand the different kinds of weather in
California?
Performance Expectations
Students who demonstrate understanding can:
MS-ESS2-4. Develop a model to describe the cycling of water through
Earth’s systems driven by energy from the sun and the force
of gravity. [Clarification Statement: Emphasis is on the ways
water changes its state as it moves through the multiple pathways
of the hydrologic cycle. Examples of models can be conceptual or
physical.] [Assessment Boundary: A quantitative understanding of
the latent heats of vaporization and fusion is not assessed.]
MS-ESS2-6. Develop and use a model to describe how unequal heating
and rotation of the Earth cause patterns of atmospheric and
oceanic circulation that determine regional climates.

2016 California Science Framework Chapter 5 Grades 6-8 Preferred Integrated Model Page 33 of 306
The CA Science Framework was adopted by the California State Board of Education on November 3, 2016. The CA Science Framework has not been edited for publication. © by the California Department of Education.
[Clarification Statement: Emphasis is on how patterns vary by
latitude, altitude, and geographic land distribution. Emphasis of
atmospheric circulation is on the sunlight-driven latitudinal
banding, the Coriolis effect, and resulting prevailing winds;
emphasis of ocean circulation is on the transfer of heat by the
global ocean convection cycle, which is constrained by the
Coriolis effect and the outlines of continents. Examples of models
can be diagrams, maps and globes, or digital representations.]
[Assessment Boundary: Assessment does not include the
dynamics of the Coriolis effect].
MS-PS3-3. Apply scientific principles to design, construct, and test a
device that either minimizes or maximizes thermal energy
transfer. * [Clarification Statement: Examples of devices could
include an insulated box, a solar cooker, and a Styrofoam cup.]
[Assessment Boundary: Assessment does not include calculating
the total amount of thermal energy transferred.]
MS-PS3-4. Plan an investigation to determine the relationships among the
energy transferred, the type of matter, the mass, and the
change in the average kinetic energy of the particles as
measured by the temperature of the sample. [Clarification
Statement: Examples of experiments could include comparing
final water temperatures after different masses of ice melted in
the same volume of water with the same initial temperature, the
temperature change of samples of different materials with the
same mass as they cool or heat in the environment, or the same
material with different masses when a specific amount of energy
is added.] [Assessment Boundary: Assessment does not include
calculating the total amount of thermal energy transferred.]
MS-PS3-5. Construct, use, and present arguments to support the claim
that when the kinetic energy of an object changes, energy is

2016 California Science Framework Chapter 5 Grades 6-8 Preferred Integrated Model Page 34 of 306
The CA Science Framework was adopted by the California State Board of Education on November 3, 2016. The CA Science Framework has not been edited for publication. © by the California Department of Education.
transferred to or from the object. [Clarification Statement:
Examples of empirical evidence used in arguments could include
an inventory or other representation of the energy before and
after the transfer in the form of temperature changes or motion of
object.] [Assessment Boundary: Assessment does not include
calculations of energy.]
MS-ETS1-1. Define the criteria and constraints of a design problem with
sufficient precision to ensure a successful solution, taking
into account relevant scientific principles and potential
impacts on people and the natural environment that may
limit possible solutions.
MS-ETS1-3. Analyze data from tests to determine similarities and
differences among several design solutions to identify the
best characteristics of each that can be combined into a new
solution to better meet the criteria for success.
*The performance expectations marked with an asterisk integrate traditional
science content with engineering through a practice or Disciplinary Core Idea.
The bundle of performance expectations above focuses on the following
elements from the NRC document A Framework for K–12 Science Education:
Highlighted
Science and
Engineering Practices
[SEP-1] Asking
Questions and
Defining Problems
Highlighted
Disciplinary Core Ideas
ESS2.C: The Roles of
Water in Earth’s
Surface Processes
Highlighted
Crosscutting Concepts
[CCC-1] Patterns
[CCC-2] Cause and

2016 California Science Framework Chapter 5 Grades 6-8 Preferred Integrated Model Page 35 of 306
The CA Science Framework was adopted by the California State Board of Education on November 3, 2016. The CA Science Framework has not been edited for publication. © by the California Department of Education.
[SEP-2] Developing
and Using Models
[SEP-3] Planning and
Carrying Out
Investigations
[SEP-6] Constructing
Explanations (for
science) and
Designing Solutions
(for engineering)
[SEP-7] Engaging in
Argument from
Evidence
[SEP-8] Obtaining,
Evaluating, and
Communicating
Information
ESS2.D: Weather and
Climate
PS3.A: Definitions of
Energy
PS3.B: Conservation
of Energy and Energy
Transfer
ETS1.A: Defining and
Delimiting Engineering
Problems
ETS1.B: Developing
Possible Solutions
Effect
[CCC-3] Scale,
Proportion, and
Quantity
[CCC-4] System and
System Models
[CCC-5] Energy and
Matter: Flows, Cycles,
and Conservation
Highlighted California Environmental Principles & Concepts:
Principle III Natural systems proceed through cycles that humans depend
upon, benefit from and can alter.
Principle IV The exchange of matter between natural systems and human
societies affects the long term functioning of both.
Principle V Decisions affecting resources and natural systems are based on
a wide range of considerations and decision-making processes.
CA CCSS Math Connections: MP.2, 6.RP.1, 6.SP.5
CA ELD Connections: ELD.PI.6.6a-b,9,10,11a,

2016 California Science Framework Chapter 5 Grades 6-8 Preferred Integrated Model Page 36 of 306
The CA Science Framework was adopted by the California State Board of Education on November 3, 2016. The CA Science Framework has not been edited for publication. © by the California Department of Education.
CA CCSS ELA/Literacy Connections: SL.6.5, RST.6-8.1,3,7,9 WHST.6-8.1,7,8
Different parts of California experience dramatically different weather. As an
anchoring phenomenon for this IS, students will consider how some parts of California
are dry with desert vegetation while others are green and wetter. When students
examine a true color satellite image of California (Figure 5.4 5.4), they notice the effects
of weather patterns: green coastal ranges, brown deserts, fluffy white clouds, and
snowcapped peaks of the Sierra. Students ask questions [SEP-1] about specific
patterns [CCC-1] that they notice and what might cause [CCC-2] them. Understanding
the processes that drive day-to-day weather can help explain these longer term weather
patterns. The vignette below describes a sequence that focuses on explaining the
phenomenon of California’s climate zones drawing in DCIs from an ESS and PS.
Students will integrate LS in IS3 and IS4.
Figure 5.4. Satellite View of California
Source: NASA 2014

2016 California Science Framework Chapter 5 Grades 6-8 Preferred Integrated Model Page 37 of 306
The CA Science Framework was adopted by the California State Board of Education on November 3, 2016. The CA Science Framework has not been edited for publication. © by the California Department of Education.
Integrated Grade Six
Vignette 5.1. Interactions of Earth Systems Cause Weather
Performance Expectations
Students who demonstrate understanding can:
MS-ESS2-4. Develop a model to describe the cycling of water through Earth’s
systems driven by energy from the sun and the force of gravity.
[Clarification Statement: Emphasis is on the ways water changes its state
as it moves through the multiple pathways of the hydrologic cycle.
Examples of models can be conceptual or physical.] [Assessment
Boundary: A quantitative understanding of the latent heats of vaporization
and fusion is not assessed.]
MS-ESS2-6. Develop and use a model to describe how unequal heating and
rotation of the Earth cause patterns of atmospheric and oceanic
circulation that determine regional climates. [Clarification Statement:
Emphasis is on how patterns vary by latitude, altitude, and geographic
land distribution. Emphasis of atmospheric circulation is on the sunlight-
driven latitudinal banding, the Coriolis effect, and resulting prevailing
winds; emphasis of ocean circulation is on the transfer of heat by the
global ocean convection cycle, which is constrained by the Coriolis effect
and the outlines of continents. Examples of models can be diagrams,
maps and globes, or digital representations.] [Assessment Boundary:
Assessment does not include the dynamics of the Coriolis effect].
MS-PS3-4. Plan an investigation to determine the relationships among the energy
transferred, the type of matter, the mass, and the change in the
average kinetic energy of the particles as measured by the
temperature of the sample. [Clarification Statement: Examples of
experiments could include comparing final water temperatures after
different masses of ice melted in the same volume of water with the same
initial temperature, the temperature change of samples of different
materials with the same mass as they cool or heat in the environment, or

2016 California Science Framework Chapter 5 Grades 6-8 Preferred Integrated Model Page 38 of 306
The CA Science Framework was adopted by the California State Board of Education on November 3, 2016. The CA Science Framework has not been edited for publication. © by the California Department of Education.
the same material with different masses when a specific amount of energy
is added.] [Assessment Boundary: Assessment does not include
calculating the total amount of thermal energy transferred.]
The bundle of performance expectations above focuses on the following elements from
the NRC document A Framework for K–12 Science Education:
Highlighted
Science and Engineering
Practices
[SEP-1] Asking Questions and
Defining Problems
[SEP-2] Developing and Using
Models
[SEP-3] Planning and Carrying
Out Investigations
[SEP-6] Constructing
Explanations (for science) and
Designing Solutions (for
engineering)
Highlighted
Disciplinary Core Ideas
ESS2.C The Roles of
Water in Earth’s Surface
Processes
PS3.A Definitions of
Energy
PS3.B Conservation of
Energy and Energy
Transfer
Highlighted
Crosscutting
Concepts
[[CCC-1] Patterns
[CCC-2] Cause and
Effect
[CCC-4] System
and System
Models

2016 California Science Framework Chapter 5 Grades 6-8 Preferred Integrated Model Page 39 of 306
The CA Science Framework was adopted by the California State Board of Education on November 3, 2016. The CA Science Framework has not been edited for publication. © by the California Department of Education.
[SEP-7] Engaging in Argument
from Evidence
[SEP-8] Obtaining, Evaluating,
and Communicating Information
Connections to the CA CCSSM: 6.NS.7b, 6.NS.8, 6.EE.9, 6.SP.4
Connections to CA CCSS for ELA/Literacy: RST.6–8.1, 4; WHST. 6–8.1, 7; SL.6.1,
2, 3
Connections to CA ELD Standards: ELD.PI.6-8.1, 9, 10b
Introduction
Weather phenomena naturally integrate all disciplines of science and
engineering. Processes usually classified as ‘physical science’ govern the movement
and changes of matter, those classified as ‘Earth science’ describe these processes at
the macroscopic scale, and ‘life science’ processes describe how organisms respond
to these weather conditions. Engineers design solutions to minimize weather hazards
and for building devices that gather detailed weather data that helps inform other
scientists (especially satellite imagery).
Days 1-2: What is
Smoke/Fog/Steam
Students make
observations and ask
questions about a mystery
material.
Days 3-4: A Watched Pot
Never Boils
Students collect data about
how temperature changes
as ice is heated until it
melts and boils. They relate
these observations to
energy changes in different
states of matter.
Days 5-9: Questions
about California’s Climate
Zones
Groups of students
research individual climate
zones in California and
report back to the class.
Students ask questions
about what they hear.

2016 California Science Framework Chapter 5 Grades 6-8 Preferred Integrated Model Page 40 of 306
The CA Science Framework was adopted by the California State Board of Education on November 3, 2016. The CA Science Framework has not been edited for publication. © by the California Department of Education.
Days 10-11: Planning an
Investigation
Students plan and conduct
an investigation to compare
the effects of heat on water
versus air.
Day 12: Crafting an
Explanation
Students create, critique,
and revise a scientific
explanation that explains
their observations from the
previous day’s
investigation.
Days 13-14: Analyzing
Rainfall Data
Students make graphs
showing the relationship
between elevation and
precipitation in California
and relate these findings to
changes of state from
previous days.
Day 15: Explaining
California Climate
Students synthesize their
understanding from the
previous three weeks to re-
examine California’s
climate zones and explain
the patterns they see.
Days 1-2 – What is that Smoke/Fog/Steam?
Anchoring phenomenon: Students confront a mystery material that they describe as
smoke/fog/steam.
In small group and whole class discussions, students review the reservoirs of the
water cycle that they had learned in fifth grade. They describe the physical state of
water (solid, liquid, gas) in each of the reservoirs. However, even when they include the
atmosphere as a reservoir of the water cycle, students tend to emphasize liquid water in
clouds rather than the invisible water vapor gas in air.
2016 California Science Framework Chapter 5 Grades 6-8 Preferred Integrated Model Page 41 of 306
The CA Science Framework was adopted by the California State Board of Education on November 3, 2016. The CA Science Framework has not been edited for publication. © by the California Department of Education.
Ms. L then gets their excited attention by bringing out an insulated container that has
dry ice in it. She pours 91 percent isopropyl alcohol into the container to create an
extremely cold bath that bubbles. Something visible forms and flows around the
insulated container. Students describe it as smoke or fog or steam. Ms. L challenges
the students to make careful, detailed observations; to discuss these observations in
small groups; and to make an evidence-based [SEP-7] claim about the nature of the
“smoke/fog/steam,” or SFS as they start calling it for short. She points out that while
they are discussing, she will put some small pieces of dry ice into a latex-free surgical
glove, and tie off the end of the glove. That way they can capture some of the mystery
SFS material to investigate its properties.
The students reach a general consensus that the SFS id visible, that it fells sort of
cool and moist, and that it seems to be flowing downwards around the container. They
argue with evidence [SEP-7] that the SFS cannot be water vapor because it is visible.
However, there is much more confusion than consensus about what the SFS could be.
When Ms. L lifts the hugely expanded glove, students laugh about its shape, and
want to know more about the properties of SFS. When Ms. L is about to cut one of the
glove ‘fingers to release the material,” she asks students to predict what they expect to
see. Ms. L never lets her students make a prediction without explaining what influences
their expectation. She prompts students to describe what similar situation, background
knowledge, and/or observations they base this prediction upon. Ms. L cuts the glove
and releases the trapped material in a controlled manner. While they can see the glove
deflating, students are surprised that nothing appears to come out. After Ms. L
extinguishes a lit candle by “pouring” some of the invisible gas over it, they reach the
conclusion that this material must be a gas denser than regular air. What is the
relationship between the invisible gas and SFS? Has it somehow changed when inside
the glove?
Students return to their small groups to make a list of the most important
observations, and try again to make claims supported by evidence [SEP-7] about the
nature of the SFS. All the student groups realize that its visibility means that SFS could
not be water vapor or carbon dioxide. Gradually, discussions within the groups and then

2016 California Science Framework Chapter 5 Grades 6-8 Preferred Integrated Model Page 42 of 306
The CA Science Framework was adopted by the California State Board of Education on November 3, 2016. The CA Science Framework has not been edited for publication. © by the California Department of Education.
between them result in the conclusion that SFS must be water drops that condense
from water vapor in the air. One team shares a model drawing [SEP-2] that they made
that illustrates a progression of three stages:
1) cold carbon dioxide gas flowing over the edge of the container and then
sinking downward;
2) water vapor in the air cooling as the cold CO2 gas contacted it; and
3) the cooled water vapor condensing into small drops (fog).
Investigative phenomenon: Water in a test tube freezes when placed into the
dry/ice/isopropyl alcohol bath.
Ms. L concludes the lesson by putting a test tube of water with an inserted
temperature probe into the dry ice/isopropyl alcohol bath. She shows how quickly the
water freezes. She calls on students to read the temperature on the probe, and they
note that it was in minus degrees Celsius, meaning that it was colder than the freezing
point of water. She takes the test tube and carefully suspends it in warm water.
Students record the increase in temperature as the super-cooled ice warms towards
zero degrees C.
Days 3-4 – A Watched Pot Never Boils
Investigative phenomenon: When ice is heated until it melts and boils, the
temperature does not increase steadily the entire time.
The following day the students review their observations of the super-cooled ice.
Students then work in teams to slowly and steadily heat a mixture of ice and water.
They record the temperature every minute and also write a description about how much
the ice was melting at each time. The handout that she provides includes a data table
for recording temperature, elapsed time, and whether melting is happening. For safety
2016 California Science Framework Chapter 5 Grades 6-8 Preferred Integrated Model Page 43 of 306
The CA Science Framework was adopted by the California State Board of Education on November 3, 2016. The CA Science Framework has not been edited for publication. © by the California Department of Education.
reasons, the students stop their experiments when the temperature of their water
reaches 45°C.
Using graph paper, each student team creates a labeled graph and enters their data
on the graph. The students generally obtain graphs that show a mostly flat temperature
line near 0°C during the time of melting, and then a steady rise in temperature after all
the ice melts.
Ms. L then asks the teams to predict on their graph what it will look like the next day
when she demonstrates heating the water until it boils and while it keeps boiling. They
also need to note on their prediction when the boiling is happening just as they had
noted when the ice was melting.
The following day the teams share their predictions and their reasoning. Then Ms. L
demonstrates the heating of water to the boiling stage and for a period of continued
boiling. Students record the observed temperatures on their graphs, and compare the
observations with their predictions. At the end of the demonstration, students discuss
the results as a whole class.
The next day, Ms. L projects a graph of changes in the state of water that is posted
on the web by a chemistry teacher. Students discuss this graph in small groups, and
write explanations for what they thought was happening in the parts of the graph labeled
A, B, C, D and E (figure 5.5)

2016 California Science Framework Chapter 5 Grades 6-8 Preferred Integrated Model Page 44 of 306
The CA Science Framework was adopted by the California State Board of Education on November 3, 2016. The CA Science Framework has not been edited for publication. © by the California Department of Education.
Figure 5.5. Temperature Changes When Constantly Heating Ice
Continuously adding thermal energy increases the temperature from super-cooled ice to
superheated steam. Heating does not cause the temperature to significantly increase
during the state changes of melting (B) and boiling (D). Heating when there is no state
change happening results in temperature increasing (A, C and E).
Source: Mr. Kent’s Chemistry Page n.d.
The students consistently identify temperature as a measure of the average kinetic
energy of invisible particles of water. They correctly relate higher temperatures with
increase particle motion, and lower temperatures with decrease particle motion. Based
on their own experiments and the teacher demonstration, students readily explain
[SEP-6] that the upward lines occur when there is no state change happening. They
also readily state that the flat lines at B and D occur when there is a state change
happening. However, they have a hard time clearly explaining why the temperature is
not increasing during melting and boiling even though more thermal energy keeps being
added.

2016 California Science Framework Chapter 5 Grades 6-8 Preferred Integrated Model Page 45 of 306
The CA Science Framework was adopted by the California State Board of Education on November 3, 2016. The CA Science Framework has not been edited for publication. © by the California Department of Education.
Ms. L then displays a graphic showing the state changes as equations (figure 5.6).
She walks students through the example of melting, pointing to each component as she
describes it, “If you start with water as a solid (ice) and add energy, you get liquid
water.” Then, she asks students to identify which of the equations apply to the day’s
observations. Once they identify the right equation, she tells students to use that
equation to explain [SEP-6] why the temperature remains fairly constant during
evaporation even though thermal energy continues to be added. After five minutes, the
student group that includes Kelly starts clapping and cheering. Other students asks
them what has happened.
Figure 5.6: Equations Representing State Changes in Water
Evaporation and melting involve absorption of thermal energy. In contrast, condensation
and freezing involve the release of thermal energy.
Illustration by Dr. Art Sussman, courtesy of WestEd.
Kelly stands up and says that she thinks they had finally explained it, but didn’t
know if they could repeat the explanation. After encouragement, she says, “The hot
plate keeps giving off thermal energy. Usually that makes the water particles move
faster, so then the temperature goes up. But once the water boils, the hot plate energy
makes the boiling thing happen instead of making the particles move faster. So then the
temperature does not change. I think I just said that the right way, didn’t I?”

2016 California Science Framework Chapter 5 Grades 6-8 Preferred Integrated Model Page 46 of 306
The CA Science Framework was adopted by the California State Board of Education on November 3, 2016. The CA Science Framework has not been edited for publication. © by the California Department of Education.
Days 5-9 – Questions about California’s Climate Zones
Investigative phenomenon: California has different climate zones
Ms. L begins the next set of lessons by asking students how many different kinds of
places they know about in California. The conversation leads to a beginning list with
names of some cities, and also some descriptions based on types of natural
environments (beach, mountain, desert, redwood forest). She then distributes a map
showing 16 different California climate zones (figure 5.7). Students work in eight groups
to identify the previously listed locations on the map, any new locations that the map
make them think about, and also discuss what they think a “climate zone” means.

2016 California Science Framework Chapter 5 Grades 6-8 Preferred Integrated Model Page 47 of 306
The CA Science Framework was adopted by the California State Board of Education on November 3, 2016. The CA Science Framework has not been edited for publication. © by the California Department of Education.
Figure 5.7: California Map Showing 16 Different Climate Zones
California can be described as having 16 different climate zones.
Source: California Energy Commission 2015
After the students have time to engage with the task and do a preliminary whole
class sharing, Ms. L provides a handout describing eight representative zones that she
condenses from the Pacific Energy Center’s Guide to California Climate Zones. She

2016 California Science Framework Chapter 5 Grades 6-8 Preferred Integrated Model Page 48 of 306
The CA Science Framework was adopted by the California State Board of Education on November 3, 2016. The CA Science Framework has not been edited for publication. © by the California Department of Education.
uses a combined student-choice/teacher-assignment technique to allocate the eight
zones among the groups. Each team has to research their climate zone and develop
posters communicating [SEP-8] key features about their climate zone including
topography, geographic locations, distinctive climate features, and representative
graphs of annual temperatures/precipitation.
Students share and learn about the different climate zones through a gallery walk of
the posters, listening to presentations by the groups, and asking questions [SEP-1] of
the presenters. Most of the student questions are about factual matters at first, so Ms. L
encourages students to ask about the relationship between different features (i.e., “Your
picture shows a flat desert. Is the desert dry because it’s flat?”) or to compare one
geographic region to another (i.e., “Why is your region so much hotter than my region
during June when they have such similar temperatures in December?”). Facilitated
whole class discussions help summarize the differences between weather and climate,
the different kinds of climate zones in California, and possible causes [CCC-2] for the
differences in annual temperatures and precipitation. Students highlight key patterns
[CCC-1] (e.g., effects [CCC-2] of latitude, altitude, closeness to the ocean, and
closeness to mountains). Student teams also record any “cause and effect [CCC-2]”,
or “why”, questions they had about the data.
Toward the end of the week, each team shares their “why” questions [SEP-1]. The
questions tend to cluster into four groups:
* why it is so much colder in northern California than in southern California
even though they are both in the same state;
* why places near the ocean have temperatures that change less between day
and night;
* why higher altitudes have so much rain; and
* why the deserts are located where they are.
Ms. L concludes this discussion by saying that they will conduct some investigations
during the next week to help answer the last three questions, and that they will cover

2016 California Science Framework Chapter 5 Grades 6-8 Preferred Integrated Model Page 49 of 306
The CA Science Framework was adopted by the California State Board of Education on November 3, 2016. The CA Science Framework has not been edited for publication. © by the California Department of Education.
the first question in their next IS about climate around the world.
Days 10-11 Planning an Investigation
Investigative phenomenon: Air heats up faster than water.
At the start of the third week, Ms. L provides students a procedure to investigate
[SEP-3] differences between heating air and heating water. They use an electric light to
heat two identical bottles closed with rubber stoppers. One of the bottles is filled with
water and the other bottle is filled with air. Their task is to record and graph the
temperatures for 10 minutes while the light is on and then another 15 minutes after
turning off the light. Ms. L finds that her students take very poor quality measurements
when they do not understand the procedures. While one approach is to ask students to
plan the entire investigation themselves, she finds that they are not quite ready at this
point in the school year to design sophisticated investigations. Ms. L develops a
technique to scaffold the planning of investigations. Her handout of procedures has two
columns – one with the procedures and a second one with the label “reason for this
step” that has blanks for students to record data. Ms. L demonstrates how to fill in the
table by demonstrating what she would put for the justification of step 1. For step two,
she writes two possible justifications and asks the students to select the explanation
that they think is most clear. For step three, she writes an incomplete reason and asks
students to evaluate why the explanation is insufficient. Ms. L then has students work in
groups to record the reasons for the remaining steps. Ms. L calls their attention to the
data sheet and labeled graph that she has included in the written procedures. She tells
them that in future experiments the student teams will get to design their own data
sheets and graph labels. Before students record any actual data, she has them draw a
sketch of what they think the graph will look like after the experiment. As she circulates
around the room, she prompts students to add labels to their sketches to indicate what
might cause key changes in their graph.
Both bottles started at a temperature of 20°C. With the light on, the temperature in
the air bottle increases on average to 55°C while the temperature in the water bottle

2016 California Science Framework Chapter 5 Grades 6-8 Preferred Integrated Model Page 50 of 306
The CA Science Framework was adopted by the California State Board of Education on November 3, 2016. The CA Science Framework has not been edited for publication. © by the California Department of Education.
only increases on average to 23°C. After the lights are turned off, the air bottle
temperature generally decreases about 30°C while the water bottle decreases on
average only 1.5°C. Ms. L has the students compare their prediction to the actual
observations. Was anything unexpected?
After conducting the investigation [SEP-3], each student team creates and
displays a poster showing their results. In their poster, they made a claim about the
differences between heating air and heating water, and they write or illustrate the
evidence [SEP-7] for their claim. After a gallery walk and whole class discussion, the
class reaches a consensus claim that the same amount of added thermal energy
causes [CCC-2] the temperature of air to increase much more than the temperature of
water, and that the water releases its thermal energy much slower than the air did.
One student group agrees with the statement about the increase in temperature.
However they argue that the evidence [SEP-7] for a difference in cooling is very weak.
It is not fair, they point out, to compare cooling from 55°C with cooling from 23°C. Ms. L
takes this unplanned opportunity of the excellent student critique to ask if there is a way
to make a better comparison of the cooling rates of air and water. Several student
groups propose pre-heating bottles of air and water to the same temperature, and then
comparing their rates of cooling. A team of students volunteer to demonstrate the
experiment the following day. Their subsequent demonstration confirms that the same
volume of water cools at a much slower rate than the same volume of air. Since thermal
energy depends not on the volume of material but instead of the amount of the material
(its mass), the student comparison is not the most scientifically accurate. MS-PS4-3
requires that students be able to design an experiment that holds mass constant, but
Ms. L is happy to see that her students recognize the need for consistency when they
use equal volumes of material.
Investigative phenomenon: A small amount of water heats up faster than a larger
amount of water in a beaker.
She points out to students that the bottle with water feels much heavier and wonders if
that has something to do with it. This prompts another demonstration comparing two

2016 California Science Framework Chapter 5 Grades 6-8 Preferred Integrated Model Page 51 of 306
The CA Science Framework was adopted by the California State Board of Education on November 3, 2016. The CA Science Framework has not been edited for publication. © by the California Department of Education.
different masses of water. Students complete this exercise realizing that both the
amount (mass) of the material and the type of material affect how quickly its
temperature changes.
Day 12 – Crafting an Explanation
Everyday phenomenon: Coastal towns have mild climates while inland valleys have
temperature extremes.
Ms. L challenges her students to use the key ideas from their investigation to
explain [SEP-6] the pattern [CCC-1] that California locations near the ocean have less
variation in day/night temperature than locations farther away from the ocean. Each
team then communicates [SEP-8] its explanation and reasoning to a different team.
The process of creating, critiquing, and revising these explanations takes an entire class
period.
Days 13-14 – Analyzing Rainfall Data
Everyday phenomenon: It rains and snows a lot in the mountains.
Having discussed the temperature differences among California regions, students
transition to their questions about the precipitation differences. Students know it snows
in the mountains, so Ms. L decides to have them investigate the amount of rainfall in
east-west transects across California. Students obtain rainfall amounts from an online
database by clicking stations on a map (see California Data Exchange Center at
http://cdec.water.ca.gov/cdecstation/). For each station, the database reports the
latitude, longitude, monthly rainfall, and the elevation of the station (along with other
weather data). Students make a graph of rainfall versus longitude and a graph of
elevation versus longitude (figure 5.8). Because they want to compare the shapes of the
two curves, Ms. L teaches students how to plot the two lines on the same graph using
different vertical axes.

2016 California Science Framework Chapter 5 Grades 6-8 Preferred Integrated Model Page 52 of 306
The CA Science Framework was adopted by the California State Board of Education on November 3, 2016. The CA Science Framework has not been edited for publication. © by the California Department of Education.
Figure 5.8. Profile of Annual Rainfall Across California Heading East From San
Luis Obispo
The thinner red line shows the elevation at each point. Chart by M. d’Alessio with data
from California Department of Water Resources 2015.
Different students plot different locations in California and they all discover a remarkable
pattern [CCC-2] where the rainfall seems to go up as elevation goes up (figure 5.9).
Figure 5.9. Profile of Annual Rainfall Across California Passing through Chico
The thinner red line shows the elevation at each point. Chart by M. d’Alessio with data
from California Department of Water Resources 2015.
2016 California Science Framework Chapter 5 Grades 6-8 Preferred Integrated Model Page 53 of 306
The CA Science Framework was adopted by the California State Board of Education on November 3, 2016. The CA Science Framework has not been edited for publication. © by the California Department of Education.
When Ms. L asks students to explain what causes this relationship, students come
up with some crazy theories. Students do know that it tends to be colder in the
mountains, so Ms. L asks them to relate this idea back to the condensation they learned
about earlier in the lesson sequence. What happens to water when it gets colder? Ms. L
helps asks students to write an explanation in their science notebooks that responds to
the prompt, “It rains more at higher elevations because…” Their model is relatively
simplistic in middle school and does not include the effects of relative humidity, but they
are able to tie together many of the essential concepts.
Some students notice that the eastern part of the graphs tend to be high elevation,
but the rainfall is lower there. They ask questions [SEP-1] about what could cause this
pattern. Ms. L shows them animations of satellite maps of atmospheric moisture and
precipitation for several storms moving across California. The storms tend to move from
west to east, with the precipitation stopping as the storm moves to eastern California.
Ms. L introduces the idea that the matter has moved. Students need to develop a
conceptual model to describe the movement of water in space and time through all
these different forms.
Based on the California climate data that they had learned, each of the student
teams draw a systems model [SEP-2] of the water cycle for a location in their assigned
climate zone during two different seasons of the year. As a class, they begin by
reviewing the features of a systems diagram (boundary, components, inputs/outputs,
interactions, and system property).
After the student teams complete their initial models, Ms. L initiates an activity that
helps them create more accurate and complex water cycle diagrams. She knows from
experience and research that while students often can list the locations where water is
located, they tend to have very limited or simplified ideas about the dynamic nature of
the interconnections among these reservoirs. For example, even though they may have
seen clouds disappear because of evaporation of their water back into the atmosphere,
they tend to think that water in clouds can only precipitate (Ben-zvi-Assarf and Orion
2005). Students also tend to forget about all the possible pathways water can take to
leave a reservoir. For example, they tend to model water in a river as only flowing into

2016 California Science Framework Chapter 5 Grades 6-8 Preferred Integrated Model Page 54 of 306
The CA Science Framework was adopted by the California State Board of Education on November 3, 2016. The CA Science Framework has not been edited for publication. © by the California Department of Education.
the ocean, whereas in reality the river water can evaporate, soak into the ground, or be
taken into the body of a plant or animal.
To help students consider these complexities, Ms. L leads students through a simple
kinesthetic game. Each student plays the role of a water particle (or H2O molecule if
students are comfortable with that terminology) and move around the room through
different stations that represent different places that water is located (ocean, plant,
atmosphere, cloud, mountain glacier, polar ice cap, etc.). At each station, the student
rolls dice and read from an instruction sheet whether they stay at that station for another
turn or move to a different station via a water cycle process. In essence, the students
use their own bodies as components in a physical model [SEP-2] of all the processes
of the water cycle.
After the exercise, students comment about it and summarize what they learned.
Key points include:
* the number of inputs and outputs for the different reservoirs;
* the different residence times in the reservoirs;
* the changes in state associated with the water cycle interconnections;
* the cyclical, rather than linear, nature of the water cycle; and
* the role of gravity in causing [CCC-2] precipitation, downhill flow of surface
water, infiltration of surface water into the ground, and downhill flow of glacial ice.
After this kinesthetic lesson, student teams return to their regional water cycle
diagrams and incorporate more of these interconnections, inputs and outputs. Students
then share their regional water cycle diagrams, critique and extend each other’s
presentations, and achieve a more complete group understanding of water cycle
reservoirs and processes. As a whole class activity, they create a color-coded map
representing the average annual precipitation that includes all of their California regions.
To create this representation, they need to collaborate on deciding the range of values
to use, and how to represent the entire spectrum of data. They compare their whole
class model with a representation that Ms. L downloads from the internet (figure 5.10),

2016 California Science Framework Chapter 5 Grades 6-8 Preferred Integrated Model Page 55 of 306
The CA Science Framework was adopted by the California State Board of Education on November 3, 2016. The CA Science Framework has not been edited for publication. © by the California Department of Education.
which they then use to complete and revise their state map.
Figure 5.10. Map of Average Annual Precipitation in California
Color-coded map of average annual precipitation in different California regions with
mountains indicated by shaded relief. Source: Geology Cafe 2012.
Days 15 – Explaining California Climate
The lesson sequence concluded with presentations that the class makes for different
audiences about California climate and precipitation. In each presentation, students
highlight the patterns [CCC-1] of temperature and precipitation in each of the eight

2016 California Science Framework Chapter 5 Grades 6-8 Preferred Integrated Model Page 56 of 306
The CA Science Framework was adopted by the California State Board of Education on November 3, 2016. The CA Science Framework has not been edited for publication. © by the California Department of Education.
California regions that they had investigated. They also explain [SEP-6] the different
factors that were involved in causing [CCC-2] significant climate patterns such as
comparatively small variation in coastal day/night temperatures, high levels of mountain
precipitation, and the rain shadow effect of coastal and Sierra Nevada mountains on the
Central Valley and on Eastern California respectively.
Vignette Debrief
In this multi-week vignette, students apply PS concepts to explain an ESS
observation about climate and LS observation about habitats. Ms. L struggled with how
long to spend on each section, but quickly realizes that even three weeks on this
vignette felt rushed. She let students plan their own experiment, grapple with revising
their models of changes of state, and construct well thought out scientific explanations
with evidence and reasoning; all these activities take much longer than she thought. But
her assessment of student work shows that students gain a much better understanding
using this student-centered approach than when she speeds through things in previous
years.
This vignette illustrates the CA NGSS vision of blending SEPs, DCIs, and CCCs.
Ms. L began each part of the lesson sequence with an engaging phenomenon and
spent each lesson applying the three dimensions. While the lesson description
describes this blend, the sections below focus on relevant aspects of each dimension in
isolation, along with ties CA CCSS and the EP&Cs.
SEPs. As the students become more engaged with the content and comfortable with
the underlying physical science concepts, they began to have larger roles in designing
and conducting the investigations [SEP-3].
DCIs. Days 1-2 focus on different states of matter (PS1.A) and the definition of
thermal energy (PS3.A). Students build on this definition on Days 3-4 and richly explore
the relationship between thermal energy, states of matter, and a particle model of
matter (MS-PS1-4) on Days 10-12. Days 5-9 focus on general observations of weather
and climate in California (ESS2.D). On Days 13-15, students engage in integrating the
PS and ESS ideas, using the PS mechanisms to explain ESS phenomena.

2016 California Science Framework Chapter 5 Grades 6-8 Preferred Integrated Model Page 57 of 306
The CA Science Framework was adopted by the California State Board of Education on November 3, 2016. The CA Science Framework has not been edited for publication. © by the California Department of Education.
CCCs. In the process, students developed system models [CCC-4] of their regional
climates and engaged with key factors that cause [CCC-2] climate patterns, such as
increased precipitation at high elevations. The observed weather and climate effects in
California latitude, altitude, proximity to the ocean, and locations of mountains all set the
stage for deeper explorations in IS2 and IS3 of the patterns [CCC-1] that determine
regional climates (MS-ESS2-6).
EP&Cs. As written, Ms. L did not explicitly address any of the EP&Cs, though
students will build on their understanding of California climate later in the course when
they consider human impacts to the Earth system. Her focus on explaining the
California climate is important because it provides a familiar context and students were
able to ask informed questions based on their own experience on Day 9.
CA CCSS Connections to English Language Arts and Mathematics. On Days 4 and
13-14, students focus on developing and interpreting graphs (6.SP.4). Students obtain
and evaluate information about California’s climate zones on Days 5-9. Students
engage in structured discourse with teams throughout the vignette, including evaluating
and reviewing the ideas of their peers on Days 5-9 and again on Day 15 (SL.6.1). They
practice writing an informational text with the explanation on Day 12 (WHST. 6–8.1, 7).
Resources
Ben-zvi-Assarf, Orit, and Nir Orion. 2005. “A Study of Junior High Students' Perceptions
of the Water Cycle.” Journal of Geoscience Education 53 (4): 366–373.
California Energy Commission. 2015. California Building Climate Zone Areas.
http://www.energy.ca.gov/maps/renewable/building_climate_zones.html
(accessed January 3, 2017).
Geology Cafe. 2012. Precipitation and Relief Map of California.
http://geologycafe.com/california/maps/california_precipitation&relief1.htm
(accessed October 20, 2016).

2016 California Science Framework Chapter 5 Grades 6-8 Preferred Integrated Model Page 58 of 306
The CA Science Framework was adopted by the California State Board of Education on November 3, 2016. The CA Science Framework has not been edited for publication. © by the California Department of Education.
Mr. Kent’s Chemistry Page. N.d. Complex Calorimetry Problems.
http://www.kentchemistry.com/links/Energy/ComplexCalProblems.htm (accessed
October 20, 2016).
The Water Cycle in the Earth System
In IS1, students looked at Earth’s systems and began to consider the water cycle
that involves all of them. When students consider all the places that they see water in its
many forms, water is often moving (raindrops fall, a river flowing, steam rising, etc.). In
IS2, students investigate the physical mechanisms that drive this process. MS-ESS2-4
highlights the special role of sunlight in driving the state changes that occur as water
moves in multiple pathways between the reservoirs of the water cycle. The first learning
set in the IS2 vignette focused on these state transitions and the associated movements
of thermal energy, almost all of which entered the Earth system in the form of sunlight.
The force of gravity also causes [CCC-2] movement of water between reservoirs of
the water cycle. Most students can explain the role of gravity in causing precipitation
(“raindrops fall”) or surface water (“rivers flown downhill”), but they often overlook the
crucial role that gravity plays in the infiltration of surface water into the groundwater, the
flow of groundwater itself through tiny pores (similar to the way a saturated sponge drips
water down out of the bottom), and the flow of ice downhill in glaciers (illustrated by
time-lapse videos of glacier movements).
Opportunities for ELA/ELD Connections
To reinforce these cause and effect relationships [CCC-2] involving gravity and sunlight,
engage students by having them understand the water cycle processes by investigating
the levels of the tides in one costal city. Have students use a cause and effect chart to
identify the changes in the water cycle reservoirs respective to the effect the gravity
from the moon and the position of the sun. Have students create a commercial to pitch
to local fishermen on the best time to fish according to the tidal patters of that costal
city. Provide feedback on the student-created commercials to make sure they include

2016 California Science Framework Chapter 5 Grades 6-8 Preferred Integrated Model Page 59 of 306
The CA Science Framework was adopted by the California State Board of Education on November 3, 2016. The CA Science Framework has not been edited for publication. © by the California Department of Education.
appropriate vocabulary and accurately demonstrate actions that convey the roles of
gravity and sunlight on tidal patterns.
CA CCSS ELA/Literacy Standards: WHST.6–8.4; SL.6–8.1, 4, 5
CA ELD Standards: ELD.PI.6–8.9
Because of the water cycle, Californians are able to obtain a steady supply of fresh
water for drinking, irrigation, industrial, and agricultural uses (CA EP&C III). Even in
years with abundant precipitation, California still draws water from a total of seven
nearby states in addition to its own supply (Klausmeyer and Fitzgerald 2012). In this
way, California itself can be considered a system [CCC-4] with inputs and outputs. Of
the developed water supply for the state, more than 75 percent of it goes to agriculture
and helps California grow more food than any other state.
2016 California Science Framework Chapter 5 Grades 6-8 Preferred Integrated Model Page 60 of 306
The CA Science Framework was adopted by the California State Board of Education on November 3, 2016. The CA Science Framework has not been edited for publication. © by the California Department of Education.
Integrated Grade Six Snapshot 5.1. What’s in the Water?
Mrs. N’s class takes occasional walking field trips to a creek near the school to study
the local ecosystem. This time, students collect water samples and bring them back to
the classroom. Mrs. N asks students if they would want to drink the water in the puddles
and they all say no because it is too ‘dirty.’ But what does it mean for water to be dirty?
Students take turns looking at drops of water under the classroom microscopes. They
notice all sorts of tiny plants, moving animals, and bits of dirt even in water samples that
appear clear to the naked eye. Mrs. N gives the students the opportunity to compare
water from a local pond with tap water. They compare the pond water, to filtered pond
water and then tap water. Students observe that the filtered pond water has fewer
particles, than the unfiltered pond water, and that the tap water has almost no particles
in it. Mrs. N challenges students to come up with a system to quantify [CCC-3] the
amount of contamination in a water sample. Each group constructs a bar graph showing
the relative amount of contaminants and then compares their measurement to the other
groups. Are the differences related to the measurement technique or the water samples
themselves? Student groups decide to switch water droplet microscope slides with
another team to test out their ideas.
Water is one of California’s most important natural resources (ESS3.A). Students
then obtain information [SEP-8] from their water utility about the different
contaminants in their local drinking water (water agencies are required to publish an
annual report and most of these are available online. They evaluate how their water
compares to another city (such as Flint, Michigan which experienced unacceptable
levels of lead contamination in 2015). They learn the distinction between organic
contaminants (like bacteria) and inorganic ones (like lead and arsenic). To link to PS1.A
(Structure and Properties of Matter), students draw atomic-level representations of the
Anchoring phenomenon: Tiny microscopic organisms live in pond water.
Everyday phenomenon: Our drinking water is not pure H2O.

2016 California Science Framework Chapter 5 Grades 6-8 Preferred Integrated Model Page 61 of 306
The CA Science Framework was adopted by the California State Board of Education on November 3, 2016. The CA Science Framework has not been edited for publication. © by the California Department of Education.
solution of liquid water and heavy metal as mixtures of moving molecules. They use this
model to address the question, “Why does the solution appear clear and clean when it
is actually contaminated?” Inorganic contaminants such as heavy metals often take
many years to cause observable health effects, so Mrs. N decides to focus on infectious
diseases with their short-term health impacts.
While students can see the differences in both the real life water and the
measurements, they do not yet appreciate why these numbers matter. Mrs. N sets the
stage about the prevalence of water borne diseases by having students read an article
about life in Gold Rush-era California, including the regular deaths from diseases like
cholera and typhoid. An outbreak in 1850 may have killed 15 percent of Sacramento
residents (Roth 1997).
Sacramento was not unusual and infectious diseases were a major problem in US
cities until midway through twentieth century. Mrs. N was born in Pittsburgh where the
rate of death from diseases in 1900 was the highest of any major US city. Students read
an article about how city health officials and engineers changed that by installing a
water filtration system in their public water system that cut the death rate from typhoid
by almost a factor of ten within two years (figure 5.11). Mrs. N emphasizes ETS2.B
(“Influence of Engineering, Technology, and Science on Society and the Natural
World”).
Everyday phenomenon: Outbreaks of disease were common in California during
the Gold Rush Era.
Investigative phenomenon: When Pittsburgh installed a city-wide water filtration
system, the number of people dying from disease dropped within a year or two.

2016 California Science Framework Chapter 5 Grades 6-8 Preferred Integrated Model Page 62 of 306
The CA Science Framework was adopted by the California State Board of Education on November 3, 2016. The CA Science Framework has not been edited for publication. © by the California Department of Education.
Figure 5.11. Effect of Water Filtration on Typhoid Deaths in Pittsburgh
Source: Adapted from Pittsburgh City Photographer 1917
Mrs. N wants to make sure that students are able to see the connection between the
water filtration technology, the diseases, and the hands-on experience with the
organisms in the pond water. Working in groups, she has students draw a simple
pictorial model [SEP-2] that illustrates the relationships. Each student then individually
writes a caption with an explanation [SEP-6] about how water filters remove organisms
that cause [CCC-2] disease. Mrs. N tells students that next week they will design and
test their own water filters.
Before moving on, Mrs. N leads a discussion of one more aspect of the Pittsburgh
story. One factor that made the city so vulnerable to disease was that the local drinking
water source, the Alleghany River, was also a dumping ground for raw sewage for many
upstream communities. Mrs. N tells students that people releasing materials like

2016 California Science Framework Chapter 5 Grades 6-8 Preferred Integrated Model Page 63 of 306
The CA Science Framework was adopted by the California State Board of Education on November 3, 2016. The CA Science Framework has not been edited for publication. © by the California Department of Education.
sewage into a river is called water pollution. She asks students if they are aware of any
water pollution at the school or in the local community. Students identify several
examples of pollution on campus and in the streets by the school, including oil dripping
from cars that then flows down the gutters on the street and into the storm drains. One
of the students mentions that she has seen drains along the street that are labeled, “no
dumping, leads to ocean.” Mrs. N asks, “Why is this important?” Several students
mention that on a recent field trip to the coast they learned that oil coming from the
storm drain system has been observed along the coast and it has damaged parts of the
coastline and some of the wildlife that lives there (CA EP&Cs II and IV). Mrs. N asks
students to reflect on who is affected more by human pollution: natural systems or
humans themselves (the discussion sets the stage for the grade eight PE MS-ESS3-4).
Mrs. N asks students if they think that we still dump our sewage into rivers and
water. They then learn more about modern wastewater treatment (see “Our Water:
Sources and Uses” at http://californiaeei.org/framework/sci/OurWater) in preparation for
a trip to a local wastewater treatment plant.
Physical Science Models of the Water Cycle
Students experience the water cycle as everyday weather, and the process of
weather forecasting is one way that scientists use measurements to model and predict
interactions in the water cycle. Students can explore weather forecasts and weather
maps and notice the different variables being tracked, especially temperature. Weather
is ultimately driven by uneven heating of the planet. How do these temperature
differences cause the air movements that drives weather changes? In grade five,
students learned that objects that they could see or touch have kinetic energy when
they move and that matter is made of particles too small to be seen. In grade six,
students combine these ideas to show how temperature is just kinetic energy at the
invisible scale of particles. The snapshot below presents a phenomenon that allows
students to begin to relate motion at the macroscopic scale to motion at the microscopic
scale and temperature.

2016 California Science Framework Chapter 5 Grades 6-8 Preferred Integrated Model Page 64 of 306
The CA Science Framework was adopted by the California State Board of Education on November 3, 2016. The CA Science Framework has not been edited for publication. © by the California Department of Education.
Integrated Grade Six Snapshot 5.2. Motions and Thermal Energy
Mr. A began IS2 by eliciting what students knew about the forms and
transformations of energy based on daily experiences or what they remembered from
classroom investigations in grades four and five. He steered student small group
discussions towards phenomena in their daily lives such as the warming effect of
rubbing hands together or doing vigorous exercise. Building on those kinds of
experiences, students conducted investigations [SEP-3] that connected motions of
objects with changes in thermal energy. Mr. A emphasized these energy [CCC-5]
transformations because these experiences from our macroscopic level of reality are
necessary to help students connect the motion energy of invisible particles with the
observed temperature of materials.
For homework, students read an illustrated one-page handout about a scientific
paper published by Count Rumford in 1798. Count Rumford was born with the name
Benjamin Thompson in Massachusetts. During the War of Independence, Thompson
fought for the British against the American revolutionaries, and had to flee from his
home to save his life.
In Europe after the war, Thompson became famous as a scientist and inventor and
he was honored with the title and name of Count Rumford. In one famous public
experiment, Count Rumford used the process of making a cannon to investigate the
change of motion energy to thermal energy. He set up an experiment where a horse
trotting in a circle caused a metal borer to dig a hole into an iron cylinder that was
completely covered with water (figure 5.12). All the people watching were amazed when
the friction of the borer grinding into the cannon caused [CCC-2] the water to boil.
Anchoring phenomenon: Our hands warm up when we rub them together.
Investigative phenomenon: Count Rumford showed a horse was able boil water by
running around in circles to turn a metal cylinder.

2016 California Science Framework Chapter 5 Grades 6-8 Preferred Integrated Model Page 65 of 306
The CA Science Framework was adopted by the California State Board of Education on November 3, 2016. The CA Science Framework has not been edited for publication. © by the California Department of Education.
Figure 5.12. Count Rumford’s Energy Conversion Experiment
The kinetic energy of a horse moving in a circle heated water surrounding a cylinder of
iron so much that the water boiled without any fire. Source: Sussman 2006.
The day after the homework reading, the students discussed in small groups the
flows of energy [CCC-5] that were involved in the making of the cannon. They
diagrammed the cause and effect [CCC-2] relationships that were happening at the
macroscopic level (horse, metal boring machine, water) and also at the invisible level of
the water particles. After extensive small group and teacher-facilitated whole class
sharing of diagrams and discussions, they reached the following consensus statements:
*The motions that the people saw caused the heating and boiling that they could feel
and see;

2016 California Science Framework Chapter 5 Grades 6-8 Preferred Integrated Model Page 66 of 306
The CA Science Framework was adopted by the California State Board of Education on November 3, 2016. The CA Science Framework has not been edited for publication. © by the California Department of Education.
*at the macroscopic level (our level), kinetic energy of the horse transferred to kinetic
energy of the iron boring machine which transferred to thermal energy of the water;
*at the particle level, kinetic energy of the boring machine transferred to kinetic
energy of the water particles.
The following day, Mr. A introduced the design challenge for students in teams of
three to design, construct, and test a device [SEP-6] that either minimizes or
maximizes the transfer of thermal energy. Mr. A facilitated a whole class discussion
about constraints (such as safety, cost, class time, and availability of
materials/equipment) and criteria for success. Student teams brainstormed the
materials and the flows of thermal energy [CCC-5] that they would investigate. In their
initial design proposal, they specified the materials and processes they would use and
how they would test their devices. Student teams provided most of the feedback to each
other, with Mr. A intervening only as absolutely needed to keep the teams on task and
within the criteria and constraints. The engineering challenge concluded with student
teams presenting and comparing their project results and how their projects developed
over time.
Students then need opportunities to investigate how different materials respond to
heating (solids such as ice melting, liquids such as a pot of miso soup, and gases such
as a flask with a balloon on top, a comparison of soil and water being heated). After
initial observations of the phenomena, they should determine ways to systematically
monitor the mass and temperature to see if changes in either of these quantities can
help explain the macroscopic behaviors they see (MS-PS3-4). As they analyze their
data [SEP-4], they find that mass is unaffected by heating or cooling changes, but
temperature changes systematically based on the amount and type of material. With
scaffolding, students can be prompted to try to apply a model [SEP-2] of matter made
up of tiny particles to explain [SEP-6] each of the phenomena, slowly enhancing their
understanding of the conservation of matter and flows of energy [CCC-5]. Students
2016 California Science Framework Chapter 5 Grades 6-8 Preferred Integrated Model Page 67 of 306
The CA Science Framework was adopted by the California State Board of Education on November 3, 2016. The CA Science Framework has not been edited for publication. © by the California Department of Education.
refine these models using computer simulations of solids, liquids, and gases, observing
relationships between temperature and particle motion in the simulation (PhET
https://phet.colorado.edu/en/simulation/states-of-matter-basics). Students will return to
these models in grade seven (MS-PS1-4). In grade six, students can use this
conceptual model to explain [SEP-6] how air masses become less dense as they warm
up, and how particle motions change as matter changes state between solid, liquid, and
gas. These simulations also introduce students to the physical basis of air pressure.
Density and pressure differences along with state changes drive air movements and
precipitation.
Explaining Weather Patterns
Students then take their models of the water cycle, air pressure, and state changes
to investigate specific weather patterns. Using animations of real-time observations
(such as satellite data from visible light that reveals clouds and other wavelengths that
reveal water vapor; see Geostational Satellite Server: GOES Western U.S. Water Vapor
at http://www.goes.noaa.gov/browsw3.html), students collect data about the movement
of large air masses, noticing that the most intense precipitation and weather events
occur where air masses collide (MS-ESS2-5; Figure 5.13 5.13). They also use these
maps to predict the motion of air masses and predict the weather. These observations
form the evidence [SEP-7] that can be used to construct a complete explanation
[SEP-6] or a model [SEP-2] of the relationship between air masses and changing
weather conditions.

2016 California Science Framework Chapter 5 Grades 6-8 Preferred Integrated Model Page 68 of 306
The CA Science Framework was adopted by the California State Board of Education on November 3, 2016. The CA Science Framework has not been edited for publication. © by the California Department of Education.
Figure 5.13. Air Mass Interactions
Important components of a model of weather that describes the interaction of air
masses. Diagram by M. d’Alessio
These same physical principles allow students to explain weather patterns within
California. Why does it rain and snow more at high elevations than lower elevations in
California? Why is the temperature near the coast milder than areas further inland? Why
is it cooler in the mountains than lower elevations? The EEI Curriculum unit,
“Precipitation, People, and the Natural World” at
http://californiaeei.org/framework/sci/Precip provides a variety of resources that can
support this instruction.
Students may be able to share based on personal experience that mountain
temperatures tend to be cooler than temperatures at lower elevations. A very important
climate consequence of the colder temperatures at higher altitudes is that rising air
becomes colder and can hold less water vapor. As a result of this cooling, water
condenses, clouds form, and there is a much greater likelihood of precipitation in the
forms of rain or snow. The analyses [SEP-4] of California climate regions revealed this
correlation of increased precipitation with higher elevations.
Two generalizations could emerge from consistent research. If wind from a moist
area is blowing towards a mountain range, it is very likely that there will be high
amounts of precipitation on the side of the mountains that the winds first hits (called

2016 California Science Framework Chapter 5 Grades 6-8 Preferred Integrated Model Page 69 of 306
The CA Science Framework was adopted by the California State Board of Education on November 3, 2016. The CA Science Framework has not been edited for publication. © by the California Department of Education.
windward or upwind). The other side of the mountain (leeward or downwind) tends to be
much drier because most of the water vapor has condensed and precipitated on the
other side of the mountain. On the other hand, if the wind blowing towards the mountain
has very low humidity, then it is likely that both sides of the mountain will be dry. This
condition tends to occur in the middle of continents or locations where the prevailing
winds tend to blow toward the ocean.
The temperature and amount of humidity in a mass of air reflects where that mass of
air first formed. If it first formed over a warm ocean, the air mass will be warm and
humid. If it first formed over a dry continental area, the air mass will be dry and its
temperature will depend on whether the continental area was hot or cold.
The clarification statement for MS-ESS2-5 indicates that students will not be
assessed on weather map symbols. This is largely a reaction to the fact that these
symbols are no longer necessary for illustrating weather patterns in the digital age. For
example, real-time wind patterns are indicated with animations of the flow of individual
particles (Viégas and Wattenberg 2016) or with familiar rainbow color scales (Beccario
2016). These visualization tools allow teachers to spend more time helping students
recognize and explain [SEP-6] patterns [CCC-1] with less time devoted to memorizing
symbols.
Engineering Connection: Finding the Optimal Site for a Wind Farm
As air masses move, they go up, over, or around mountains. The landscape shape
therefore has a big impact on wind speeds. Students analyze data [SEP-4] showing the
average wind speed at different locations around their city. They look for patterns
[CCC-1] that provide evidence that the landscape shape influences wind speed. Using
information about topography and typical wind speeds and directions, they determine

2016 California Science Framework Chapter 5 Grades 6-8 Preferred Integrated Model Page 70 of 306
The CA Science Framework was adopted by the California State Board of Education on November 3, 2016. The CA Science Framework has not been edited for publication. © by the California Department of Education.
the optimal placement of a wind farm that could provide clean energy for their city. They
might also need to consider human constraints such as how the land is currently used
and who owns it (CA EP&C V).
Integrating the CCCs in Grade Six Instructional Segment 2
The CCC of “Scale, Proportion, and Quantity [CCC-3]” at the middle school level
includes the notion that, “Time, space and energy phenomena can be observed at
various scales using models to study systems that are too large or too small.” Clearly
this concept applies when we relate the macroscopic property of temperature with the
submicroscopic motions of particles. Similarly, both weather and climate describe the
same conditions of the atmosphere (temperature, moisture, and movement), but at
different scales [CCC-3] of time (and space). In general, climate describes a relatively
long period of time (decades to millennia) and often applies across relatively large
geographic areas. Weather generally refers to the same conditions at a specific location
during a very short period of time.
The color-coded map of average annual precipitation in California in figure 5.10 is an
example of a model that describes phenomena (climate properties) that occur at scales
that are too spatially and temporally large to directly observe. Each small area of color
corresponds to a calculated average based on many locations that measured and
recorded the amount of precipitation each day for decades or perhaps a century or
more. This kind of map is a systems model [SEP-2] that is especially useful and
prevalent in Earth and Space science. Color-coded maps can display data in ways that
reveal important patterns [CCC-1] related to spatial location. Students may initially
respond to the aesthetics of the colors rather than the science patterns and the vast
amounts of data that these kinds of models [SEP-2] summarize and communicate.
While this kind of color-coded modeling representation is also used to some extent
in other scientific disciplines, its special appropriateness in Earth and Space Science
topics helps reveal a general principle about CCCs. While the CCCs do apply across

2016 California Science Framework Chapter 5 Grades 6-8 Preferred Integrated Model Page 71 of 306
The CA Science Framework was adopted by the California State Board of Education on November 3, 2016. The CA Science Framework has not been edited for publication. © by the California Department of Education.
many disciplines, they still may apply in somewhat different ways and extents in the
different scientific disciplines.
The CCC of Systems and System Models [CCC-4] that featured so prominently in
IS1 still has a very significant presence in IS2. It is a vital and underlying aspect of many
of the other CCCs. As mentioned when discussing scale [CCC-3], many systems
involve interactions at scales that are so large or so small that they are best understood
through system models. Descriptions of the Energy and Matter [CCC-5] refer often to
tracking the flows of energy and matter into and out of systems. Finally, each of the
California regional climates investigated in IS2 is an example of a whole system
property that emerges or arises from the interactions of the components of the regional
system with each other and with the incoming sunlight.

2016 California Science Framework Chapter 5 Grades 6-8 Preferred Integrated Model Page 72 of 306
Integrated Grade Six Instructional Segment 3: Causes and Effects of Regional
Climates
Integrated Grade Six – Instructional Segment 3: Causes and Effects of
Regional Climates
Guiding Questions:
Why is the climate so different in different regions of the planet?
Why are organisms so different in different regions of the planet?
What makes organisms so similar to but also different from their
parents?
What makes animals behave the way they do, and how does their
behavior affect their survival and reproduction?
Performance Expectations
Students who demonstrate understanding can:
MS-ESS2-5. Collect data to provide evidence for how the motions and
complex interactions of air masses results in changes in
weather conditions. [Clarification Statement: Emphasis is on
how air masses flow from regions of high pressure to low
pressure, causing weather (defined by temperature, pressure,
humidity, precipitation, and wind) at a fixed location to change
over time, and how sudden changes in weather can result when
different air masses collide. Emphasis is on how weather can be
predicted within probabilistic ranges. Examples of data can be
provided to students (such as weather maps, diagrams, and
visualizations) or obtained through laboratory experiments (such
as with condensation).] [Assessment Boundary: Assessment
does not include recalling the names of cloud types or weather
symbols used on weather maps or the reported diagrams from

2016 California Science Framework Chapter 5 Grades 6-8 Preferred Integrated Model Page 73 of 306
The CA Science Framework was adopted by the California State Board of Education on November 3, 2016. The CA Science Framework has not been edited for publication. © by the California Department of Education.
weather stations.]
MS-ESS2-6. Develop and use a model to describe how unequal heating
and rotation of the Earth cause patterns of atmospheric and
oceanic circulation that determine regional climates.
[Clarification Statement: Emphasis is on how patterns vary by
latitude, altitude, and geographic land distribution. Emphasis of
atmospheric circulation is on the sunlight-driven latitudinal
banding, the Coriolis effect, and resulting prevailing winds;
emphasis of ocean circulation is on the transfer of heat by the
global ocean convection cycle, which is constrained by the
Coriolis effect and the outlines of continents. Examples of models
can be diagrams, maps and globes, or digital representations.]
[Assessment Boundary: Assessment does not include the
dynamics of the Coriolis effect].
MS-PS3-4. Plan an investigation to determine the relationships among the
energy transferred, the type of matter, the mass, and the
change in the average kinetic energy of the particles as
measured by the temperature of the sample. [Clarification
Statement: Examples of experiments could include comparing
final water temperatures after different masses of ice melted in
the same volume of water with the same initial temperature, the
temperature change of samples of different materials with the
same mass as they cool or heat in the environment, or the same
material with different masses when a specific amount of energy
is added.] [Assessment Boundary: Assessment does not include
calculating the total amount of thermal energy transferred.]
MS-LS1-4. Use argument based on empirical evidence and scientific
reasoning to support an explanation for how characteristic
animal behaviors and specialized plant structures affect the
probability of successful reproduction of animals and plants
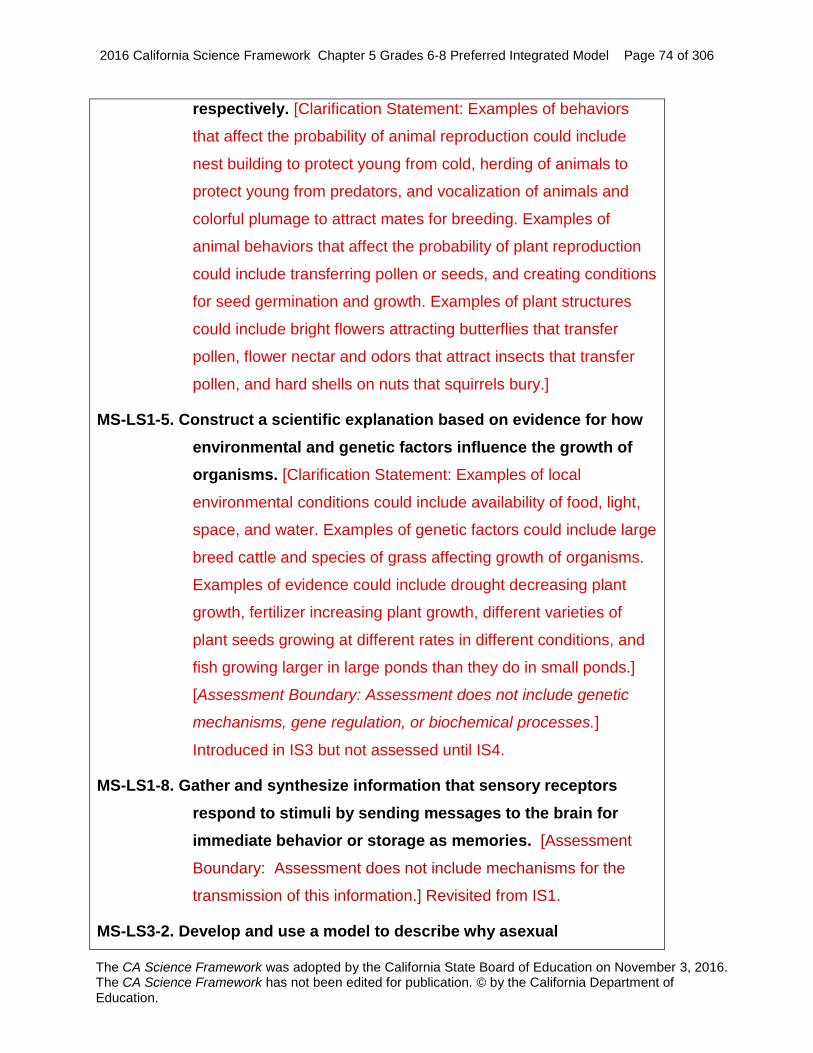
2016 California Science Framework Chapter 5 Grades 6-8 Preferred Integrated Model Page 74 of 306
The CA Science Framework was adopted by the California State Board of Education on November 3, 2016. The CA Science Framework has not been edited for publication. © by the California Department of Education.
respectively. [Clarification Statement: Examples of behaviors
that affect the probability of animal reproduction could include
nest building to protect young from cold, herding of animals to
protect young from predators, and vocalization of animals and
colorful plumage to attract mates for breeding. Examples of
animal behaviors that affect the probability of plant reproduction
could include transferring pollen or seeds, and creating conditions
for seed germination and growth. Examples of plant structures
could include bright flowers attracting butterflies that transfer
pollen, flower nectar and odors that attract insects that transfer
pollen, and hard shells on nuts that squirrels bury.]
MS-LS1-5. Construct a scientific explanation based on evidence for how
environmental and genetic factors influence the growth of
organisms. [Clarification Statement: Examples of local
environmental conditions could include availability of food, light,
space, and water. Examples of genetic factors could include large
breed cattle and species of grass affecting growth of organisms.
Examples of evidence could include drought decreasing plant
growth, fertilizer increasing plant growth, different varieties of
plant seeds growing at different rates in different conditions, and
fish growing larger in large ponds than they do in small ponds.]
[Assessment Boundary: Assessment does not include genetic
mechanisms, gene regulation, or biochemical processes.]
Introduced in IS3 but not assessed until IS4.
MS-LS1-8. Gather and synthesize information that sensory receptors
respond to stimuli by sending messages to the brain for
immediate behavior or storage as memories. [Assessment
Boundary: Assessment does not include mechanisms for the
transmission of this information.] Revisited from IS1.
MS-LS3-2. Develop and use a model to describe why asexual

2016 California Science Framework Chapter 5 Grades 6-8 Preferred Integrated Model Page 75 of 306
The CA Science Framework was adopted by the California State Board of Education on November 3, 2016. The CA Science Framework has not been edited for publication. © by the California Department of Education.
reproduction results in offspring with identical genetic
information and sexual reproduction results in offspring with
genetic variation. [Clarification Statement: Emphasis is on using
models such as Punnett squares, diagrams, and simulations to
describe the cause and effect relationship of gene transmission
from parent(s) to offspring and resulting genetic variation.]
The bundle of performance expectations above focuses on the following
elements from the NRC document A Framework for K–12 Science Education:
Highlighted
Science and
Engineering Practices
[SEP-1] Asking
Questions and
Defining Problems
[SEP-2] Developing
and Using Models
[SEP-3] Planning and
Carrying Out
Investigations
[SEP-4] Analyzing and
Interpreting Data
[SEP-6] Constructing
Explanations (for
science) and
Highlighted
Disciplinary Core Ideas
ESS2.C: The Roles of
Water in Earth’s
Surface Processes
ESS2.D: Weather and
Climate
PS3.A: Definitions of
Energy
PS3.B: Conservation
of Energy and Energy
Transfer
Highlighted
Crosscutting Concepts
[CCC-1] Patterns
[CCC-2] Cause and
Effect
[CCC-3] Scale,
Proportion, and
Quantity
[CCC-4] System and
System Models
[CCC-5] Energy and
Matter: Flows, Cycles,

2016 California Science Framework Chapter 5 Grades 6-8 Preferred Integrated Model Page 76 of 306
The CA Science Framework was adopted by the California State Board of Education on November 3, 2016. The CA Science Framework has not been edited for publication. © by the California Department of Education.
Designing Solutions
(for engineering)
[SEP-7] Engaging in
Argument from
Evidence
[SEP-8] Obtaining,
Evaluating, and
Communicating
Information
ETS1.A: Defining and
Delimiting Engineering
Problems
ETS1.B: Developing
Possible Solutions
and Conservation
[CCC-6] Structure and
Function
Highlighted California Environmental Principles & Concepts:
Principle II The long-term functioning and health of terrestrial, freshwater,
coastal and marine ecosystems are influenced by their
relationships with human societies.
Principle IV The exchange of matter between natural systems and human
societies affects the long term functioning of both.
CA CCSS Math Connections: 6.SP.2, 4, 5, MP.2, MP.4
CA ELD Connections: ELD.PI.6.1,5,6 a-b, 9,10,11a
CA CCSSELA/Literacy Connections: RST.6-8.1,2,3,4,7,9 RI.6.8, WHST.6-
8.1,2,7,8,9, SL.6.5
In this IS, students will grapple with the anchoring phenomenon that it is warm in the
tropics and cold at the poles. In IS2 students analyzed climate data [SEP-4] for eight
different California regions. As a result of that analysis, four key factors were identified
as having strong causal effects [CCC-2] on regional climates: 1) latitude; 2) altitude; 3)
proximity to mountains; and 4) proximity to the ocean.

2016 California Science Framework Chapter 5 Grades 6-8 Preferred Integrated Model Page 77 of 306
The CA Science Framework was adopted by the California State Board of Education on November 3, 2016. The CA Science Framework has not been edited for publication. © by the California Department of Education.
Figure 5.14 illustrates the combination of these four factors at the scale [CCC-3] of
regional climates around the planet. Students begin IS3 by investigating the
temperature at different latitudes and different times of year around the globe. These
investigations lay the groundwork for Integrated Grade Eight when students will finally
explain the seasons (MS-ESS1-1) after collecting data on seasonal weather patterns
since kindergarten.
Figure 5.14. Average Annual Temperatures
Color-coded map of average annual temperature around the world. Note the major
effect of latitude, and the colder high elevation regions, such as the Himalayas in Asia.
Source: Climate Charts 2007.
In IS2 students explained [SEP-6] that the oceans have a strong effect on
temperatures near the coast because the water retains heat much longer than the
surrounding land or air. In IS3, students extend their analysis of ocean effects on
temperature by investigating [SEP-3] the effects of ocean currents that transport
thermal energy from equatorial regions to colder temperate regions. This analysis is
then connected to the more global scale [CCC-3] of ocean currents and wind patterns.
Having attained deeper understandings of the many intersecting factors and Earth
system interactions that cause [CCC-2] regional climates, students then focus on the

2016 California Science Framework Chapter 5 Grades 6-8 Preferred Integrated Model Page 78 of 306
The CA Science Framework was adopted by the California State Board of Education on November 3, 2016. The CA Science Framework has not been edited for publication. © by the California Department of Education.
effects [CCC-2] that these very different regional climates have on organisms. In grade
four, students cited internal and external structures of plants and animals as evidence
[SEP-7] that organisms have structural adaptations that support survival, growth,
behavior, and reproduction. In grade five, students developed models [SEP-2] that
described how organisms survive only in environments in which their specific needs can
be met.
Students deepen and revisit these concepts in grade six IS3 by investigating [SEP-
3] plant and animal structures [CCC-6] are adapted to climatic and other abiotic
conditions in an ecosystem. In elementary school, students provided evidence that
animals had specific structures and behaviors that enabled them to survive in specific
conditions (3-LS4-3). But how is it that all the organisms in a specific environment have
the structures and behaviors that allow them to take advantage of that specific
environment? This IS lays the foundation for understanding natural selection in grade
eight. It focuses on both adaptation and introduces sexual reproduction. It uses specific
phenomena related to attracting mates to also introduce sensory stimuli and the
nervous system. While adaptation ties well to climate, these other topics are part of a
life science storyline that easily could be separated out into its own IS.
Climate Depends on Latitude
Keeping this broad outline of the IS3 sequence in mind, students begin exploring
more deeply the effects of latitude on climate. Students should observe maps and ask
detailed questions [SEP-1] about what they see. They should be able to describe
patterns [CCC-1] they see, such as the reddish areas in figure 5.14 clearly indicate that
latitudes closer to the equator are generally much warmer than latitudes that are further
north or south.
How can the equator appear to receive more energy than the either of the poles
despite the fact that they all receive their energy from the same Sun? The key is that the
Earth is a sphere. Sunlight arrives at Earth as parallel rays (figure 5.15), but hits the
surface at nearly a 90° angle near the equator and at flatter/smaller angles near the

2016 California Science Framework Chapter 5 Grades 6-8 Preferred Integrated Model Page 79 of 306
The CA Science Framework was adopted by the California State Board of Education on November 3, 2016. The CA Science Framework has not been edited for publication. © by the California Department of Education.
poles because of Earth’s round shape. The light spreads out over a larger area near the
poles (figure 5.16), meaning that each square foot patch of the surface receives a
smaller proportion [CCC-3] of the energy coming from the Sun than that same patch
does at the equator, which causes the sunlight on that patch to be less intense. When
the sun shines down at a 90° angle, a patch of land receives twice the energy compared
to a 30° angle, so this effect has a big impact on the temperature.
Figure 5.15. Earth-Sun System Scale
A scale illustration of the Earth-Sun system (top). The Sun is 5 pixels wide and the
Earth is 1075 pixels away, but is only 0.05 pixels wide, which is too small to display. At
this scale, it is easier to recognize that rays of sunlight arrive at Earth as parallel rays at
all latitudes (bottom). Diagram by M. d’Alessio.
Students perform an investigation [SEP-3] of the relationship between light
intensity and angle by shining a flashlight at a piece of paper at different angles while
keeping the distance between the light and the paper constant (NASA 2008). Students
can directly observe how the patch of light gets dimmer when it strikes the page at a low
angle and spreads out over a large area. While a piece of paper is flat, students
simulate the parallel rays of sunlight arriving at Earth by shining their flashlight on a
round ball and observing how the patch of light is small and intense near the equator
but spread out near the poles.

2016 California Science Framework Chapter 5 Grades 6-8 Preferred Integrated Model Page 80 of 306
The CA Science Framework was adopted by the California State Board of Education on November 3, 2016. The CA Science Framework has not been edited for publication. © by the California Department of Education.
Figure 5.16. Angle of the Sun’s Rays Affect Intensity
Effect of the angle of the Sun’s rays on area of the Earth’s surface it illuminates. At
angles smaller than 90°, the energy is spread out over a larger area. Diagram by M.
d’Alessio.
Thermal Energy Transport
Movements of thermal energy are major factors in causing [CCC-2] the
observed patterns [CCC-1] of regional climates. One major concept is that thermal
energy [CCC-5] moves from warmer locations/objects to cooler locations/objects. A
related major concept is that these movements of thermal energy occur in three distinct
ways (Table 5.). Students can investigate [SEP-3] and research each of these three
ways of heating, create a brief report about one or more of them, and explain [SEP-6]
the differences in terms of the underlying science. Given the state of their physical
science knowledge, the mechanisms need to be stated in fairly general terms. For
example, conduction and convection can be described in terms of particles vibrating or
moving, and radiation can be described as waves of energy similar to sunlight that
move through space and transfer energy.

2016 California Science Framework Chapter 5 Grades 6-8 Preferred Integrated Model Page 81 of 306
The CA Science Framework was adopted by the California State Board of Education on November 3, 2016. The CA Science Framework has not been edited for publication. © by the California Department of Education.
Table 5.5. Thermal Energy Moves in Three Ways
WAYS THERMAL
ENERGY MOVES
PHYSICAL SCIENCE EXAMPLES
CONDUCTION
Warm object touches cooler
object and makes it
warmer. Electromagnetic
waves not involved
Hot sand burns your feet.
Hot ground warms air that
touches it.
Handle of heated pan
becomes hot.
CONVECTION
Warm liquid or gas flows
into cooler area and makes
it warmer. Electromagnetic
waves not involved.
Warm air rises and is
replaced by cooler air. Hot
water in heated pot rises
from bottom to top.
RADIATION
Objects do not touch each
other. Electromagnetic
waves radiate from warmer
object, are absorbed by
cooler object and make it
warmer.
Sunlight heats your body
Standing near a hot wall or
hot cliff.
A wood fire or an outside
gas or electric heater heats
your body.
Contrasting the three different ways that thermal energy moves from warmer objects to
cooler objects based on the underlying physical science. Table created by Dr. Art
Sussman, courtesy of WestEd.
Students can reflect on and discuss a simplified model [SEP-2] to apply their
experiences and knowledge of the three modes of thermal energy movement to the
context of the Earth system (figure 5.17). Sunlight travels as radiation from the Sun to
enter the Earth system where it initially mostly heats the surface (ocean and land).

2016 California Science Framework Chapter 5 Grades 6-8 Preferred Integrated Model Page 82 of 306
The CA Science Framework was adopted by the California State Board of Education on November 3, 2016. The CA Science Framework has not been edited for publication. © by the California Department of Education.
Earth’s surface transfers some of the thermal energy to the atmosphere by conduction,
and convection then moves that energy within the atmosphere.1
Figure 5.17. Earth’s Energy Flows
A simplified model illustrating energy flows that have major effects on weather and
climate. Illustration by Dr. Art Sussman, courtesy of WestEd.
The teacher can prompt students to think about and discuss concept number four in
figure 5.17, the transfer of thermal energy by convection. Why does thermal energy
move from the equator toward the poles? Student explanations [SEP-6] should include
the evidence from prior investigations [SEP-3] that sunlight hits equatorial regions at
angles closer to 90° than the smaller angles at the poles, and also that thermal energy
[CCC-5] moves from warmer regions toward colder regions. Students may find it
contradictory that there is such a large difference in temperature between the equator
1 In Instructional Segment 4, students will learn via Model 2 that radiation from Earth’s surface also plays a very significant role in heating the atmosphere and in Earth’s global climate.

2016 California Science Framework Chapter 5 Grades 6-8 Preferred Integrated Model Page 83 of 306
The CA Science Framework was adopted by the California State Board of Education on November 3, 2016. The CA Science Framework has not been edited for publication. © by the California Department of Education.
and the poles when convection tends to equalize temperature differences. It turns out
that the poles would be much colder and the tropics much hotter if winds and ocean
currents did not move thermal energy away from the equator.
Students can collect data from cities around the world and create a graph showing
the average temperature at different latitudes (figure 5.18). They also know from IS2
that when air masses rise, they cool and condense. They should be able to predict that
warm air rising from the equator should cause higher rainfall there. By analyzing data
from their cities, students confirm this is true, but recognize another pattern as well.
There is another peak in rainfall near 50° latitude (both north and south). Students can
use this evidence to make an argument [SEP-7] that air could be rising there as well.
Figure 5.18. Temperature and Rainfall Vary Systematically with Latitude
Source: Thebiologyprimer 2015
The rainfall versus latitude analysis provides evidence that the wind convection from
the equator toward the poles actually happens via sequential “steps” that are called
convection cells (figure 5.19). The two convection cells just north and just south of the
equator (indicated by the line labeled 0°) each have skinny red arrows representing
warm air traveling toward the poles and skinny blue arrows representing colder air from

2016 California Science Framework Chapter 5 Grades 6-8 Preferred Integrated Model Page 84 of 306
The CA Science Framework was adopted by the California State Board of Education on November 3, 2016. The CA Science Framework has not been edited for publication. © by the California Department of Education.
the polar regions traveling toward the equator. The illustration shows three sequential
convection cells connecting the equator and South Pole. Similarly, three sequential
convection cells connect the equator and the North Pole (though the third cell near the
South Pole is not visible from the angle shown in figure 5.19). This illustration also
shows thicker arrows that represent winds that blow east and west.
Figure 5.19 Thermal Energy and Wind Convection Cells
Wind convection in the atmosphere moves thermal energy from the 30 degrees latitude
toward the poles (skinny red and blue arrows in the convection cells). Image credit:
Adapted from Summey n.d.
Students can then combine all they have learned in IS2 and IS3 into one summary
of the evidence from their data of relationships between the movement of air masses at
different scales and weather patterns (table 5.6; MS-ESS2-5). Because many of the
conditions that determine weather are ‘permanent’ on the timescale of ecosystems
(latitude, topography, proximity to water bodies), the weather patterns in a region

2016 California Science Framework Chapter 5 Grades 6-8 Preferred Integrated Model Page 85 of 306
The CA Science Framework was adopted by the California State Board of Education on November 3, 2016. The CA Science Framework has not been edited for publication. © by the California Department of Education.
remain relatively consistent. The word climate refers to these consistent patterns of
weather that each location experiences. It rarely snows in San Francisco or Los
Angeles, and it almost always rains more often on the western side of the Sierra
Nevada mountains than the eastern side, and it rains a lot more in northern California
(closer to the upward motion of air masses for Earth’s two northern convection cells)
than it does in southern California (closer to the downward motion of air masses from
convection cells).
Table 5.6. Air Movements and Weather
CONDITION AIR MOVEMENT WEATHER SAMPLE
LOCATION
Convection cell near
equator
Warm moist air
rising
Thunderstorms;
Heavy precipitation
Equatorial Pacific
Islands
Convection cell at
30° latitudes
Dry air sinking Desert Sahara Desert
Arabian Desert
Warm air mass and
cold air mass collide
Warm air rising Clouds and
precipitation likely
Variable
Windward side of
coastal mountain
Moist air rising Rain and/or snow California Coast and
Sierra Nevada
Leeward side of
mountain
Dry air sinking Clear weather Central Valley
Southwest US
desert
High pressure
system
Air sinking Clear and sunny
weather
Variable
Low pressure
system
Air rising Cloudy and wet
weather
Variable
Table by Dr. Art Sussman, courtesy of WestEd.

2016 California Science Framework Chapter 5 Grades 6-8 Preferred Integrated Model Page 86 of 306
The CA Science Framework was adopted by the California State Board of Education on November 3, 2016. The CA Science Framework has not been edited for publication. © by the California Department of Education.
Organism Traits, Heredity, and Reproduction
Ecosystems develop around the abiotic conditions such as climate because these
abiotic factors strongly influence the kinds of organisms can live in an environment.
These same factors also help determine [CCC-2] the organism structures and
behaviors (adaptations) that will have the most success with respect to survival and
reproduction. Teams of students can research a distinctive environment (e.g., the
barren granite of the peaks in the Sierra Nevada mountains, the dark shade beneath
towering coast redwood trees, or the brackish mud of a salt marsh), and organize and
communicate information [SEP-8] about the plant and animal traits that promote
success in that environment. Sharing across teams that have investigated [SEP-3]
very different kinds of environments can then lead to generalizations about significant
patterns [CCC-1]. The question is, how do these traits develop in organisms? Hence
the transition to heredity and reproduction. Students have been gathering evidence that
organisms look and act like their parents since back in grade one (1-LS3-1; 3-LS3-1).
Now, they begin to develop models of the mechanisms for heredity.
Organism structures and behaviors are features that generally apply to all members
of a species. Examples of human features are eye color, body size, blood type, and
personality such as introversion/extroversion. If a feature normally has a pattern of
varying among individuals, then we describe those variations as being traits of that
feature. For example, each different blood type is a trait, as is each different eye color or
hair color. Many features vary across a very wide spectrum of possibilities, and we
usually clump these variations into groups that we generalize and simplify, such as
describing people’s height feature as being very short, short, average, tall, or very tall.
For the middle school student, this discussion of traits goes beyond scientific facts
(Health Standards 7-8.1.8G, 7-8.2.2.G).
Discussions of traits can get side-tracked by either/or arguments about the roles of
genes and the environment in determining traits. Students gathered evidence in grade
three that traits can be inherited (3-LS3-1) or influenced by the environment (3-LS3-2),
and now they must integrate these two seemingly separate ideas. As discussed early in
IS1, many features and processes of the natural world occur across a very wide

2016 California Science Framework Chapter 5 Grades 6-8 Preferred Integrated Model Page 87 of 306
The CA Science Framework was adopted by the California State Board of Education on November 3, 2016. The CA Science Framework has not been edited for publication. © by the California Department of Education.
spectrum of possibilities and often do not fall definitively at one end of the spectrum or
the other. In the case of organism traits, there are some traits that are essentially all
genetic (e.g., blood type) and other traits that have a very large environmental
component (e.g., large muscles due to exercise or being able to play the guitar). Most
traits, however, are a combination of genetic and environmental influence, and can be
placed somewhere along the spectrum between the extremes examples (figure 5.20).
Figure 5.20. Genetic vs Environmental Traits
Some traits are essentially all genetic, and some are mostly environmental. Most traits
are strongly influenced by genes and the environment. Source: Daehler and Folsom
2015.
Students can experience the interplay between genetics and environment by
analyzing [SEP-4] actual height data from provenance studies in trees. Ponderosa pine
trees have a very large range and have been extensively studied. In some areas of the
western US, 100-year-old ponderosa pines might be 60 feet tall but in other areas they
tower more than 150 feet (Meyer 1938). Students can ask questions about what climatic
conditions can explain these differences. Then, students can plan an investigation
[SEP-2] that would determine if any of the height difference is due to genetic differences

2016 California Science Framework Chapter 5 Grades 6-8 Preferred Integrated Model Page 88 of 306
The CA Science Framework was adopted by the California State Board of Education on November 3, 2016. The CA Science Framework has not been edited for publication. © by the California Department of Education.
in the trees rather than the environment. While students can’t actually wait decades for
the results of their investigations, they can determine what they would vary and control
for in experimental design. Then, they can obtain information from actual provenance
studies where seeds of trees from different environments are brought together and
grown under the same conditions (Callaham 1962). Seeds from some regions do
indeed produce trees that are shorter than other regions under all growing conditions,
the tree that grows tallest depends on the specific growing conditions in the experiment.
For example, a seed whose parents lived at high altitude in northern Arizona grows
taller than a seed from the Sierra Nevada foothills of California in research trials when
the days are cold and the nights are warm, but the California seeds grow taller when
both day and night are moderate temperatures. In other words, students are now able to
provide an evidence-based explanation based on scientific data from the field (MS-LS1-
5) for the patterns they observed in the classroom in grade three (3-LS3-1, 3-LS3-2).
In addition to a general emphasis on adaptations that promote growth and survival
(MS-LS1-5), the PEs in IS3 emphasize evaluating factors that promote reproductive
success (MS-LS1-4) and analyzing different modes of reproduction (MS-LS3-2).
Students know that some plants depend on animals from grade two when they
developed a simple design that mimicked the role of animals in pollinating flowers (2-
LS2-2). Students can examine how climate alters the reproductive behavior of plants, by
examining the differences between insect-pollinated and wind-pollinated plants. What
are the benefits and disadvantages of each? Students consider if different climate
conditions would be more favorable to one method over another, providing their
reasoning. They then compare the structures of wind-pollinated plants with insect-
pollinated plants, eventually sorting through pictures and trying to identify the mode of
pollination from the structure (InquireBotany n.d.). Students construct an argument
[SEP-7] supporting how these structures increase the chance of successful
reproduction (MS-LS1-4).

2016 California Science Framework Chapter 5 Grades 6-8 Preferred Integrated Model Page 89 of 306
The CA Science Framework was adopted by the California State Board of Education on November 3, 2016. The CA Science Framework has not been edited for publication. © by the California Department of Education.
Integrated Grade Six Snapshot 5.3. Asexual and Sexual Reproduction
Ms. Z wanted to use an engaging activity to help students transition from their
analyses of the causal connections between genes and traits to developing a model
[SEP-2] to compare asexual and sexual reproduction (MS-LS3-2). Basing the activity on
an interactive lesson from the University of Utah Genetic Science Learning Center
website (Sexual vs. Asexual Reproduction accessed at:
http://learn.genetics.utah.edu/content/basics/reproduction/). Ms. Z provided background
information about reproduction in sunflowers, earthworms, strawberries, and whiptail
lizards. Students discussed in teams how to describe the reproductive process in each
organism (asexual, sexual, or both) and the evidence [SEP-7] for their categorizations.
Whole class sharing resulted in common answers and evidence. Small student teams
then had time to explore the website (possibilities would be in computer lab, in class
with tablets, at home, in a library) in order to select two organisms that have different
processes of sexual reproduction.
The following day, student teams made system models [CCC-4] of the
reproduction processes for each of their two selected organisms. Each of the system
models had to explain [SEP-6] why the progeny would have identical or different
genetic information from each other. Students posted one of their system models on the
wall, and then individually walked around the room, and analyzed [SEP-4] each posted
model. They pasted sticky notes next to the models with any questions or
disagreements [SEP-7] they had with respect to the conclusions and/or evidence. After
the presenters had time to look at the sticky notes, the whole class paid attention as
each presenting team appropriately responded [SEP-8] to the comments.
Sexual reproduction in animals can then lead to investigations [SEP-3] that link
back to the body systems concepts in IS1. Students compile each of the reproductive
processes described in the online Genetic Science Learning Center resource to list and
compare all animal behaviors that play a significant role in the reproduction. In order to
Anchoring phenomenon: Sunflowers, earthworms, strawberries, and whiptail lizards
reproduce using different processes.

2016 California Science Framework Chapter 5 Grades 6-8 Preferred Integrated Model Page 90 of 306
The CA Science Framework was adopted by the California State Board of Education on November 3, 2016. The CA Science Framework has not been edited for publication. © by the California Department of Education.
do so, the students discuss the criteria for how they will categorize different kinds of
behavior. If students have difficulty suggesting valuable criteria, the teacher can prompt
the discussion with examples that exemplify choice, rigid instinctive behavior, memory,
reasoning, and flexibility. Students can do more research about some of the examples
that may lead to surprising findings, such as the amount of navigation, memory,
analysis, learning, and communication involved when a honeybee chooses where to fly
to from the hive to gather nectar.
Students then tie their understanding of reproduction back to regional climate. Are
there certain climate conditions where asexual reproduction might be advantageous
(e.g., when a successful organism needs to quickly reproduce) or where sexual
reproduction might be better (e.g., when climate conditions change and identical
offspring will all be equally vulnerable to dying off)? Ms. Z presents students several
brief case studies and asks students to construct an argument [SEP-7] about which
reproductive style is likely to be most successful in each situation.
Investigative phenomenon: Bowerbirds, peacocks, fruit flies, and vervet monkeys all
put on displays where the male ‘shows off’ for the female.
Ms. Z instructs students to extend their investigations [SEP-3] into behaviors by
focusing on female choice in reproduction (not including humans). Key factors related to
these investigations include stimuli provided by the male, female sensory receptors,
female behavioral response, and female memory (MS-LS1-8). The teacher provides a
list of possible examples (such as bowerbirds, peacocks, fruit flies, and vervet
monkeys). For example, female vervet monkeys respond more favorably to males that
show caring behavior toward infants. As a result, male vervet monkeys behave better
toward infants when a female is watching. Student teams pick one of the suggested
examples of female choice or a different one that they independently researched and
evaluated [SEP-8].
After the teams have conducted the first round of research, the whole class decides
on the criteria for a complete investigation and report. Teams extend and conclude their

2016 California Science Framework Chapter 5 Grades 6-8 Preferred Integrated Model Page 91 of 306
The CA Science Framework was adopted by the California State Board of Education on November 3, 2016. The CA Science Framework has not been edited for publication. © by the California Department of Education.
investigation by developing and presenting a report to the class about their example of
female choice including explaining [SEP-6] the evidence and reasoning how the
behavior affects the probability of successful reproduction (MS-LS1-4).
These life science learning experiences in grade six provide a foundation for deeper
explorations in grade seven (PEs and DCIs focused on LS2: Ecosystems) and in grade
eight (PEs and DCIs focused on L3: Heredity and L4: Biological Evolution).
Animals and plants have intricate structures and behaviors for sexual reproduction,
but why? Whenever students identify patterns [CCC-1] in structure/function
relationships [CCC-6], they should be encouraged to ask about the cause/effect
mechanisms [CCC-2]. In this case, each parent contributes to the traits of the offspring
therefore leading to greater diversity of traits. To connect this otherwise unconnected
topic back to climate, students can consider the question, “How could a greater diversity
of traits help an organism survive in a wider range of climates?” Students analyze
[SEP-4] the results of Mendel’s experiments with pea plants or other simple examples
of genetic inheritance that allows students to develop models inheritance. The
clarification statement of MS-LS3-2 indicates that students should be able to construct
models [SEP-2] of inheritance such as Punnett squares or other depictions and
simulations.
While these simple models are useful, classic genetics tends to reinforce a
misconception that each trait is caused by one gene. Students may also hold a parallel
misconception that each gene influences only one trait. Students can counter these
misconceptions by citing evidence [SEP-7] such as that the ABCC11 gene on
chromosome 16 influences the type of earwax a person has and also the amount of
underarm odor. Figure 5.21 contrasts incorrect and correct concepts about the causal
[CCC-2] linkages between genes and traits. As part of the developmental progression
of the CA NGSS, students do not need to understand the specifics mechanisms or
terminology of DNA or protein synthesis until high school.

2016 California Science Framework Chapter 5 Grades 6-8 Preferred Integrated Model Page 92 of 306
The CA Science Framework was adopted by the California State Board of Education on November 3, 2016. The CA Science Framework has not been edited for publication. © by the California Department of Education.
Figure 5.21. Incorrect and Correct Ideas about Genes and Traits
Multiple genes typically determine a specific trait, and an individual gene typically
influences multiple traits. Source: Daehler and Folsom 2015.

2016 California Science Framework Chapter 5 Grades 6-8 Preferred Integrated Model Page 93 of 306
The CA Science Framework was adopted by the California State Board of Education on November 3, 2016. The CA Science Framework has not been edited for publication. © by the California Department of Education.
Integrated Grade Six Instructional Segment 4: Effects of Global Warming on
Living Systems
Integrated Grade Six – Instructional Segment 4: Effects of Global Warming on Living Systems
Guiding Questions:
How do human activities affect Earth’s systems?
How do we know our global climate is changing?
Performance Expectations
Students who demonstrate understanding can:
MS-ESS3-3. Apply scientific principles to design a method for monitoring
and minimizing a human impact on the environment.*
[Clarification Statement: Examples of the design process include
examining human environmental impacts, assessing the kinds of
solutions that are feasible, and designing and evaluating
solutions that could reduce that impact. Examples of human
impacts can include water usage (such as the withdrawal of water
from streams and aquifers or the construction of dams and
levees), land usage (such as urban development, agriculture, or
the removal of wetlands), and pollution (such as of the air, water,
or land).]
MS-ESS3-5. Ask questions to clarify evidence of the factors that have
caused the rise in global temperatures over the past century.
[Clarification Statement: Examples of factors include human
activities (such as fossil fuel combustion, cement production, and
agricultural activity) and natural processes (such as changes in
incoming solar radiation or volcanic activity). Examples of
evidence can include tables, graphs, and maps of global and
regional temperatures, atmospheric levels of gases such as
carbon dioxide and methane, and the rates of human activities.
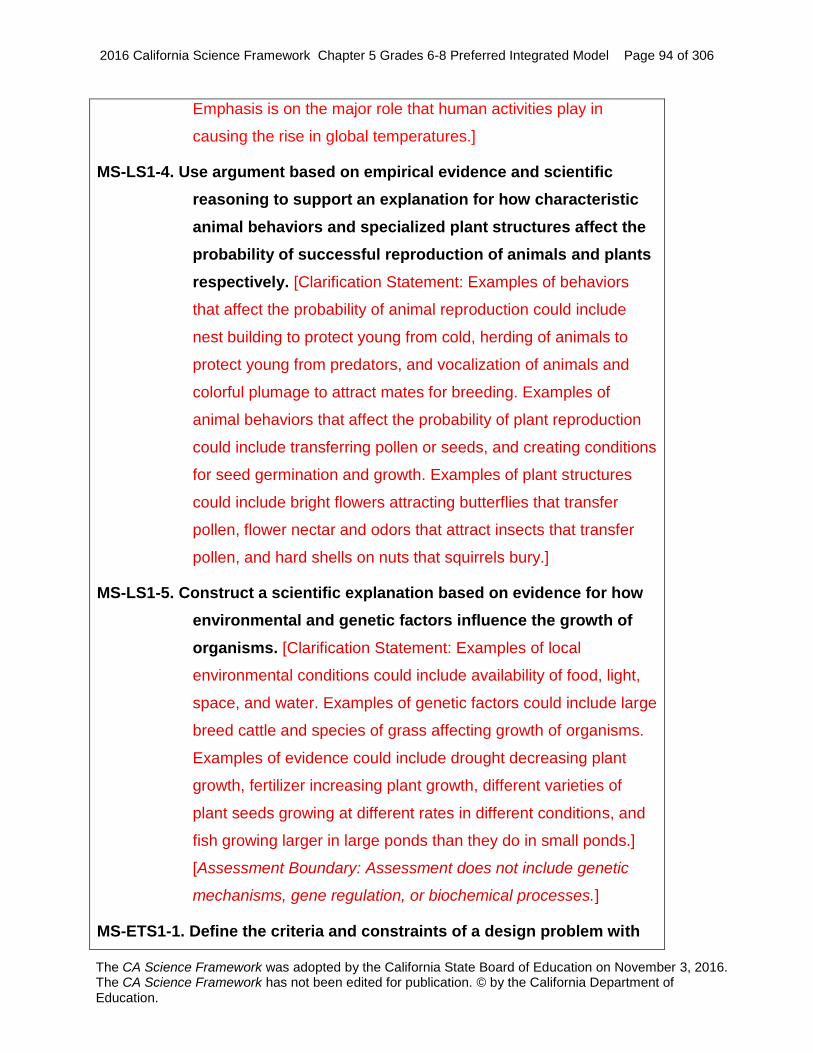
2016 California Science Framework Chapter 5 Grades 6-8 Preferred Integrated Model Page 94 of 306
The CA Science Framework was adopted by the California State Board of Education on November 3, 2016. The CA Science Framework has not been edited for publication. © by the California Department of Education.
Emphasis is on the major role that human activities play in
causing the rise in global temperatures.]
MS-LS1-4. Use argument based on empirical evidence and scientific
reasoning to support an explanation for how characteristic
animal behaviors and specialized plant structures affect the
probability of successful reproduction of animals and plants
respectively. [Clarification Statement: Examples of behaviors
that affect the probability of animal reproduction could include
nest building to protect young from cold, herding of animals to
protect young from predators, and vocalization of animals and
colorful plumage to attract mates for breeding. Examples of
animal behaviors that affect the probability of plant reproduction
could include transferring pollen or seeds, and creating conditions
for seed germination and growth. Examples of plant structures
could include bright flowers attracting butterflies that transfer
pollen, flower nectar and odors that attract insects that transfer
pollen, and hard shells on nuts that squirrels bury.]
MS-LS1-5. Construct a scientific explanation based on evidence for how
environmental and genetic factors influence the growth of
organisms. [Clarification Statement: Examples of local
environmental conditions could include availability of food, light,
space, and water. Examples of genetic factors could include large
breed cattle and species of grass affecting growth of organisms.
Examples of evidence could include drought decreasing plant
growth, fertilizer increasing plant growth, different varieties of
plant seeds growing at different rates in different conditions, and
fish growing larger in large ponds than they do in small ponds.]
[Assessment Boundary: Assessment does not include genetic
mechanisms, gene regulation, or biochemical processes.]
MS-ETS1-1. Define the criteria and constraints of a design problem with

2016 California Science Framework Chapter 5 Grades 6-8 Preferred Integrated Model Page 95 of 306
The CA Science Framework was adopted by the California State Board of Education on November 3, 2016. The CA Science Framework has not been edited for publication. © by the California Department of Education.
sufficient precision to ensure a successful solution, taking
into account relevant scientific principles and potential
impacts on people and the natural environment that may
limit possible solutions.
MS-ETS1-2. Evaluate competing design solutions using a systematic
process to determine how well they meet the criteria and
constraints of the problem.
*The performance expectations marked with an asterisk integrate traditional science
content with engineering through a practice or Disciplinary Core Idea.
The bundle of performance expectations above focuses on the following
elements from the NRC document A Framework for K–12 Science Education:
Highlighted
Science and
Engineering Practices
[SEP-1] Asking
Questions and
Defining Problems
[SEP-2] Developing
and Using Models
[SEP-3] Planning and
Carrying Out
Investigations
[SEP-4] Analyzing and
Interpreting Data
Highlighted
Disciplinary Core Ideas
ESS3.C: Human
Impacts on Earth
Systems
ESS3.D: Global
Climate Change
LS1.B: Growth and
Development of
Organisms
Highlighted
Crosscutting Concepts
[CCC-1] Patterns
[CCC-2] Cause and
Effect
[CCC-3] Scale,
Proportion, and
Quantity
[CCC-4] System and

2016 California Science Framework Chapter 5 Grades 6-8 Preferred Integrated Model Page 96 of 306
The CA Science Framework was adopted by the California State Board of Education on November 3, 2016. The CA Science Framework has not been edited for publication. © by the California Department of Education.
[SEP-5] Using
mathematics and
Computational
Thinking
[SEP-7] Engaging in
Argument from
Evidence
[SEP-8] Obtaining,
Evaluating, and
Communicating
Information]
ETS1.A: Defining and
Delimiting Engineering
Problems
ETS1.B: Developing
Possible Solutions
System Models
[CCC-5] Energy and
Matter: Flows, Cycles,
and Conservation
[CCC-7] Stability and
Change
Highlighted California Environmental Principles & Concepts:
Principle I The continuation and health of individual human lives and of human
communities and societies depend on the health of the natural
systems that provide essential goods and ecosystem services.
Principle II The long-term functioning and health of terrestrial, freshwater,
coastal and marine ecosystems are influenced by their
relationships with human societies.
Principle IV The exchange of matter between natural systems and human
societies affects the long term functioning of both.
CA CCSS Math Connections: MP.2, 6RP.1,6.EE.6, 6.SP.2,4
CA ELD Connections: ELD.PI.6.1,5,6 a-b, 9,10,11a
CA CCSS ELA/Literacy Connections: RI.6.8,RST.6-8.1, 2 WHST.6-8.7,
WHST.6-8.8,

2016 California Science Framework Chapter 5 Grades 6-8 Preferred Integrated Model Page 97 of 306
The CA Science Framework was adopted by the California State Board of Education on November 3, 2016. The CA Science Framework has not been edited for publication. © by the California Department of Education.
In this IS, students collect evidence that Earth’s climate is changing. At the sixth
grade level, the scope of their understanding is intended to be limited. Students analyze
data [SEP-4], recognize patterns [CCC-1], and ask questions [SEP-1] about what
causes [CCC-2] these patterns. Middle school students are not expected to explain
why the Earth is warming in much detail – they will develop models explaining the
causal mechanisms when they get to high school. The clarification statement for MS-
ESS3-5 indicates that emphasis should be placed on the way human activities might
influence the climate.
For this IS, the anchoring phenomenon is that the temperature on Earth has warmed
over the last 150 years, but the pattern of warming is complex. Students begin to
analyze data [SEP-4] showing the temperature history over the last century (figure
5.22). While graphs like figure 5.22 are simple enough for students to interpret,
scientists also use more sophisticated interactive displays of data that depict how
temperatures have changed in space and time. More advanced visualizations allow
students to zoom into areas of interest (such as regions within California) and watch the
time progression (see California Energy Commission, Cal-Adapt, http://cal-
adapt.org/tools/). As students see the data depicted in new ways, they should be able to
ask more detailed questions. For example, the bottom panel of figure 5.22 shows that
the northern hemisphere has warmed more than the southern hemisphere. Why? The
eastern part of South America warmed more than the west. Is that due to deforestation
of the Amazon, or does it involve more complex interactions? The lowest temperatures
are shortly after 1900. What caused that? Did it affect the whole planet equally? These
are the types of questions [SEP-1] we want our students to start asking even though
they won’t have the tools to answer them yet in sixth grade.

2016 California Science Framework Chapter 5 Grades 6-8 Preferred Integrated Model Page 98 of 306
The CA Science Framework was adopted by the California State Board of Education on November 3, 2016. The CA Science Framework has not been edited for publication. © by the California Department of Education.
Figure 5.22.Temperature Changes Over Time
Temperature changes over time depicted as a graph of average annual temperatures
for the entire globe since 1880 (top) and a map showing changes at different locations,
comparing the average from the first portion of the 21st century to the 20th century
(bottom). The 21st century is warmer than the 19th and 20th centuries. Source: NASA
2016.

2016 California Science Framework Chapter 5 Grades 6-8 Preferred Integrated Model Page 99 of 306
The CA Science Framework was adopted by the California State Board of Education on November 3, 2016. The CA Science Framework has not been edited for publication. © by the California Department of Education.
Opportunities for ELA/ELD Connections
To help data come alive and help students compile it for particular audience, have them
obtain information [SEP-8] about the effect [CCC-2] temperature changes [CCC-7] have
on sea level, glaciers, or storm intensity. In groups, or pairs, students research one
aspect of the effect of temperature change on sea level, glaciers, or storm intensity
using government reports summarizing these changes (such as EPA Climate Change
Indicators, National Climate Assessment, or NASA’s Climate Effects Web portal).
Working in groups, students collaborate on creating a one page campaign ad for an
environmental magazine that includes a headline, a picture and a visual that represents
[SEP-8] the data gathered. Have each group present their ad to the class as if the class
was the editing team of the environmental magazine. To ensure that students who may
need it have time to rehearse or practice speaking, have the group decide each
member’s role, including English learners, so all students understand their part in the
presentation.
CA CCSS ELA/Literacy Standards: RST.6–8.2, 7; WHST.6–8.7, 9; SL.6–8.5
CA ELD Standards: ELD.PI.6–8.9
Climate Change Causes
Several possible natural mechanisms exist that can cause [CCC-2] climate
changes [CCC-7] over human timescale [CCC-3] (tens or hundreds of years),
including variations in the Sun’s energy output, ocean circulation patterns, atmospheric
composition, and volcanic activity (see ESS3.D). When ocean currents change their
flow patterns [CCC-1], such as during El Niño Southern Oscillation conditions, some
global regions become warmer or wetter and others become colder or drier. When
scientists make computer simulations that include only these natural changes [CCC-7],
they cannot match the temperature changes from the last century (figure 5.23). But
there are also changes that are caused by human activity (CA EP&Cs III, IV). Many
aspects of modern society result in the release of carbon dioxide and other greenhouse
gases. These include automobiles, power plants or factories that use coal, oil, or gas as

2016 California Science Framework Chapter 5 Grades 6-8 Preferred Integrated Model Page 100 of 306
The CA Science Framework was adopted by the California State Board of Education on November 3, 2016. The CA Science Framework has not been edited for publication. © by the California Department of Education.
an energy source, cement production for buildings and roads, burning forest and
agricultural land, and even the raising of livestock whose digestive processes emit
methane. Greenhouse gases increase the capacity of Earth to retain energy, so
changes in these gases cause changes in Earth’s average temperature. Changes in
surface or atmospheric reflectivity change the amount of energy from the Sun that
enters the planetary system. Icy surfaces, clouds, aerosols, and larger particles in the
atmosphere, such as from volcanic ash, reflect sunlight and thereby decrease the
amount of solar energy that can enter the weather/climate system. Many surfaces that
humans construct (e.g., roads, most buildings, agricultural fields versus natural forests)
absorb sunlight and thus increase the energy [CCC-5] in the system [CCC-4]. As
students analyze data [SEP-4] about greenhouse gas concentrations in the
atmosphere, they observe a very similar patterns [CCC-1] to the change in
temperature (figure 5.24). In fact, computer models of climate show that human
activities are an important part of the cause [CCC-2] of global temperature changes
(figure 5.23).
Figure 5.23. Global Climate Outputs
Outputs of different computer models of global climate compared to observations. The
colored bands are thick because they represent hundreds of different models created by
many different researchers using different assumptions. While the models have slight
variations in their output, only models that include human-induced changes can explain

2016 California Science Framework Chapter 5 Grades 6-8 Preferred Integrated Model Page 101 of 306
The CA Science Framework was adopted by the California State Board of Education on November 3, 2016. The CA Science Framework has not been edited for publication. © by the California Department of Education.
the observed temperature record. Source: Intergovernmental Panel on Climate Change
(IPCC) 2014.
Opportunities for Math Connections
Global average temperature rises as humans emit more greenhouse gases. This
rate of emission depends on two key variables: population growth, and energy
consumed per person. Students must construct an argument from evidence [SEP-7]
that connects these population and energy use ideas to a significant impact on Earth’s
systems (MS-ESS3-4). To gather evidence for their argument, students obtain
information [SEP-8] from online resources that list population and energy consumption
patterns [CCC-1]. Students will use mathematical thinking [SEP-5] to create
meaningful comparisons between the energy use in different states and countries. For
example, energy use per person is an example of a ‘unit rate’ from ratio thinking in
mathematics (CA CCSSM 6.RP.2). People in the US use more than twice as much
energy per person than the average European country (U.S. Energy Information
Administration 2012), probably because our homes are bigger and spaced further apart.
Californians, on average, use less energy per person than nearly every other state in
the US (U.S. Energy Information Administration 2012), partly due to our mild climate
and partly due to effective energy efficiency programs. Despite this fact, the average
Californian still uses more than 10 times more energy than the average person in the
continent of Africa. These comparisons are examples of ratios and ratio language (CA
CCSSM 6.RP.1). Many developing countries around the world have growing
populations and are rapidly changing their lifestyles to include more energy intensive
tools. They will start consuming energy at rates more like California or even the US
average, which could have a huge impact on global climate and global emissions.
Computer models [SEP-2] that forecast changes [CCC-7] in global climate rely on
accurate estimates about energy consumption in the future, and in high school students
will use computer simulations to explore the effects of these assumptions (HS-ESS3-5).

2016 California Science Framework Chapter 5 Grades 6-8 Preferred Integrated Model Page 102 of 306
The CA Science Framework was adopted by the California State Board of Education on November 3, 2016. The CA Science Framework has not been edited for publication. © by the California Department of Education.
Figure 5.24. Global Warming Cause and Effect
Graphs with similar trends and patterns illustrate global warming causes and effects.
Source: IPCC 2014.

2016 California Science Framework Chapter 5 Grades 6-8 Preferred Integrated Model Page 103 of 306
The CA Science Framework was adopted by the California State Board of Education on November 3, 2016. The CA Science Framework has not been edited for publication. © by the California Department of Education.
Impacts of Climate Change on the Biosphere
Organisms have structural and behavioral adaptations that help them succeed and
reproduce in their current environment (MS-LS1-4). The climate changes that have
already happened affect behaviors of species, especially the timing of migrations,
blooming, and maturing of seeds. Computer analyses of business-as-usual climate
change scenarios project more dramatic and rapid changes that are likely to have
deleterious effects on many organisms (MS-LS1-5).
Each of the integrated middle school grades includes PEs that relate to human
impacts on the environment. These are generally associated with DCI LS2
(Ecosystems: Interactions, Energy, and Dynamics) and DCI ESS3 (Earth and Human
Activity). In addition to the global climate topic highlighted in the previous snapshot,
Integrated Grade Six includes MS-ESS3-4 focused on designing a method for
monitoring and minimizing a human impact on the environment. The following snapshot
addresses that PE and has an emphasis on engineering design.
Integrated Grade Six Snapshot 5.4. Monitoring and Minimizing Human
Environmental Impacts
Anchoring phenomenon: Monarch butterflies fly long distances every year.
Following their investigations [SEP-3] related to climate change, students in Ms.
D’s class became concerned about the ways that climate change can harm organisms
and ecosystems. Monarch populations west of the Rocky Mountains escape winter by
flying very long distances to California. The students live in a coastal town with one of
the major California winter nesting areas for monarch butterflies. They were very
concerned when they learned that climate change was affecting organism migrations.
Students in Team A already volunteered with the local conservation group to protect
their public Monarch protection area. The scale of the global climate change issue
inspired them to think at a broader scale [CCC-3] about all the places that the
2016 California Science Framework Chapter 5 Grades 6-8 Preferred Integrated Model Page 104 of 306
The CA Science Framework was adopted by the California State Board of Education on November 3, 2016. The CA Science Framework has not been edited for publication. © by the California Department of Education.
butterflies needed during the summer and on their long journey to Central and Southern
California. They decided to gather information about the major threats that the
butterflies faced on their long journey, and to network with schools on that pathway to
collaborate on monitoring the Monarch population, the local threats to the Monarchs
(especially related to habitat, food and climate), and possible local solutions to those
threats (MS-ESS3-3).
Investigative problem: How can we get more output from our solar panels?
Students in Team B argued that the Monarchs, and lots of other organisms, needed
long-term solutions to climate change especially switching to renewable energy
sources, and they gathered information [SEP-8] about making electricity from solar
photovoltaic cells. Their project integrated PS and ESS DCIs while designing a solution
to an LS problem. The school was in the process of seeking funds to purchase and
install some solar modules. Team B started investigating how much extra solar
electricity the school could get if the solar cells tracked the sun during the day rather
than remaining stationary, and whether those gains would be worth the cost and any
other issues related to the placement of the solar cells. They created a poster that
explained [SEP-6] how solar cells are energy conversion devices (PS3.A, B) and included a
model [SEP-2] of how sunlight travels in straight lines (PS4.B) until it is absorbed by the solar
cells which are oriented at a specific angle relative to the light rays.
Investigative problem: How can we reduce the amount of energy and water we use?
Students in Team C had learned about a different school in the county that had
instituted a successful major energy saving program. They wanted their school to
monitor and minimize consumption of electricity and natural gas (MS-ESS3-3). Team C
started analyzing data [SEP-4] about the school energy sources and consumption, and
what resources in the school and community were available for collaboration, especially

2016 California Science Framework Chapter 5 Grades 6-8 Preferred Integrated Model Page 105 of 306
The CA Science Framework was adopted by the California State Board of Education on November 3, 2016. The CA Science Framework has not been edited for publication. © by the California Department of Education.
the local utility company. They were particularly interested in digital devices that could
monitor and control consumption of energy. These devices helped the students
measure and reduce the per capita energy consumption, which they will discuss again
in grade eight (MS-ESS3-4).
Ms. D assisted all three teams, especially with helping them establish a shared
understanding about clearly articulating the criteria that could be used to evaluate the
success of their project and the constraints that could limit and impede success. In
addition to collaborating and sharing within their team, the students also had regular
meetings to share across the teams so they could gain insights and feedback from a
larger and more diverse group. Ms. D also encouraged the three teams to include in
their criteria and constraints the longer-term prospects for each of their projects, and
how they could use different communication systems to implement their project and
begin to support its sustainability.
The focus in IS4 on monitoring/minimizing human environmental impacts as well
as on global climate change complete the year’s science education and reconnect with
the systems thinking explored in IS1, especially the emphasis on properties of the whole
system [CCC-4]. Earth’s web of life is a whole system property that emerges from the
interactions of organisms with each other and with the huge diversity of Earth
environments. Global climate is a whole system property that emerges from the
interactions of the Earth subsystems with each other and with the inflow of sunlight.
Human actions can change the Earth system’s components and interactions in ways
that profoundly alter organisms and climate at local, regional and global levels.
Integrated Grade Six can help build a middle school foundation of science and
engineering understandings and practices related to citizenship and sustainability that
can grow in depth in the succeeding middle school and high school grades. (Two EEI
Curriculum units, “Energy: It’s Not All the Same to You”
http://californiaeei.org/framework/sci/Energy and “Responding to Environmental
Change” http://californiaeei.org/framework/sci/Respond provide a variety of resources
that can support this instruction.)

2016 California Science Framework Chapter 5 Grades 6-8 Preferred Integrated Model Page 106 of 306
The CA Science Framework was adopted by the California State Board of Education on November 3, 2016. The CA Science Framework has not been edited for publication. © by the California Department of Education.
Grade Seven – Preferred Integrated Course Model
This section is meant to be a guide for educators on how to approach the teaching of
the CA NGSS in grade seven according to the Preferred Integrated Course Model (see
the introduction to this chapter for details regarding different models for grades six,
seven, and eight). This section is not meant to be an exhaustive list of what can be
taught or how it should be taught.
A primary goal of this section is to provide an example of how to bundle the PEs into
integrated groups that can effectively guide instruction in four sequential IS. There is no
prescription regarding the relative amount of time to be spent on each IS. As shown in
figure 5.25, the overarching guiding concept for the entire year is, “Natural processes
and human activities cause energy to flow and matter to cycle through Earth’s systems.”

2016 California Science Framework Chapter 5 Grades 6-8 Preferred Integrated Model Page 107 of 306
The CA Science Framework was adopted by the California State Board of Education on November 3, 2016. The CA Science Framework has not been edited for publication. © by the California Department of Education.
Figure 5.25. Grade Seven Integrated Storyline
Guiding Concept: Natural processes and human activities cause energy to flow and matter to cycle through Earth’s
systems.
IS
Life Science Earth & Space
Sciences Physical Science
Engineering, Technology, and Applications to
Science
1
Living and nonliving things are made of atoms
Source: M d’Alessio
Organisms are made of molecules of mostly six different elements.
Earth materials are mostly made of eight different elements. Earth has mineral, energy, and water resources.
The interaction and motions of atoms explain the properties of matter. Thermal energy affects particle motion and physical state.
2
Matter cycles and energy flows in systems of all scales within the Earth system.
Source: Cambridge College Primary Science 2017
Organisms grow and get energy by rearranging atoms in food molecules.
Earth’s cycles of matter are driven by solar energy, Earth’s internal thermal energy, and gravity.
Chemical reactions make new substances and can release or absorb thermal energy. Mass is conserved in physical changes and chemical reactions.
Design Criteria Evaluate Solutions Analyze data Iteratively test and modify
3 Natural processes and human activities have shaped Earth’s resources and ecosystems.
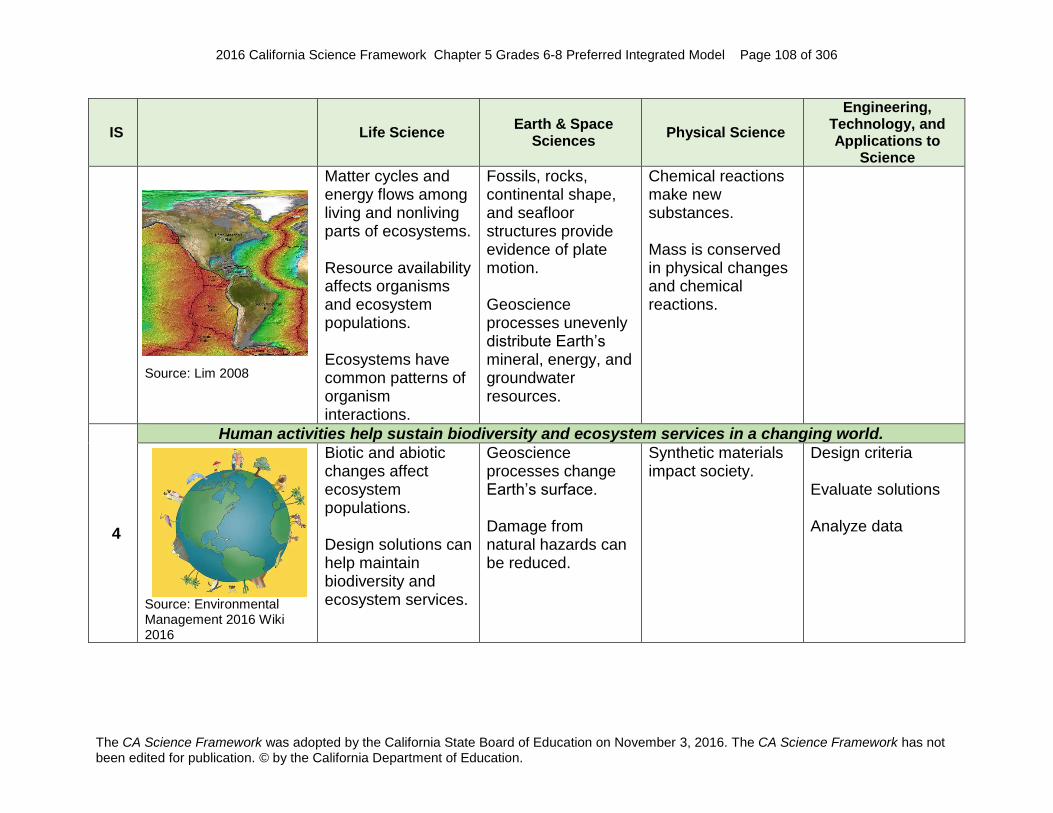
2016 California Science Framework Chapter 5 Grades 6-8 Preferred Integrated Model Page 108 of 306
The CA Science Framework was adopted by the California State Board of Education on November 3, 2016. The CA Science Framework has not been edited for publication. © by the California Department of Education.
IS
Life Science Earth & Space
Sciences Physical Science
Engineering, Technology, and Applications to
Science
Source: Lim 2008
Matter cycles and energy flows among living and nonliving parts of ecosystems. Resource availability affects organisms and ecosystem populations. Ecosystems have common patterns of organism interactions.
Fossils, rocks, continental shape, and seafloor structures provide evidence of plate motion. Geoscience processes unevenly distribute Earth’s mineral, energy, and groundwater resources.
Chemical reactions make new substances. Mass is conserved in physical changes and chemical reactions.
4
Human activities help sustain biodiversity and ecosystem services in a changing world.
Source: Environmental Management 2016 Wiki 2016
Biotic and abiotic changes affect ecosystem populations. Design solutions can help maintain biodiversity and ecosystem services.
Geoscience processes change Earth’s surface. Damage from natural hazards can be reduced.
Synthetic materials impact society.
Design criteria Evaluate solutions Analyze data
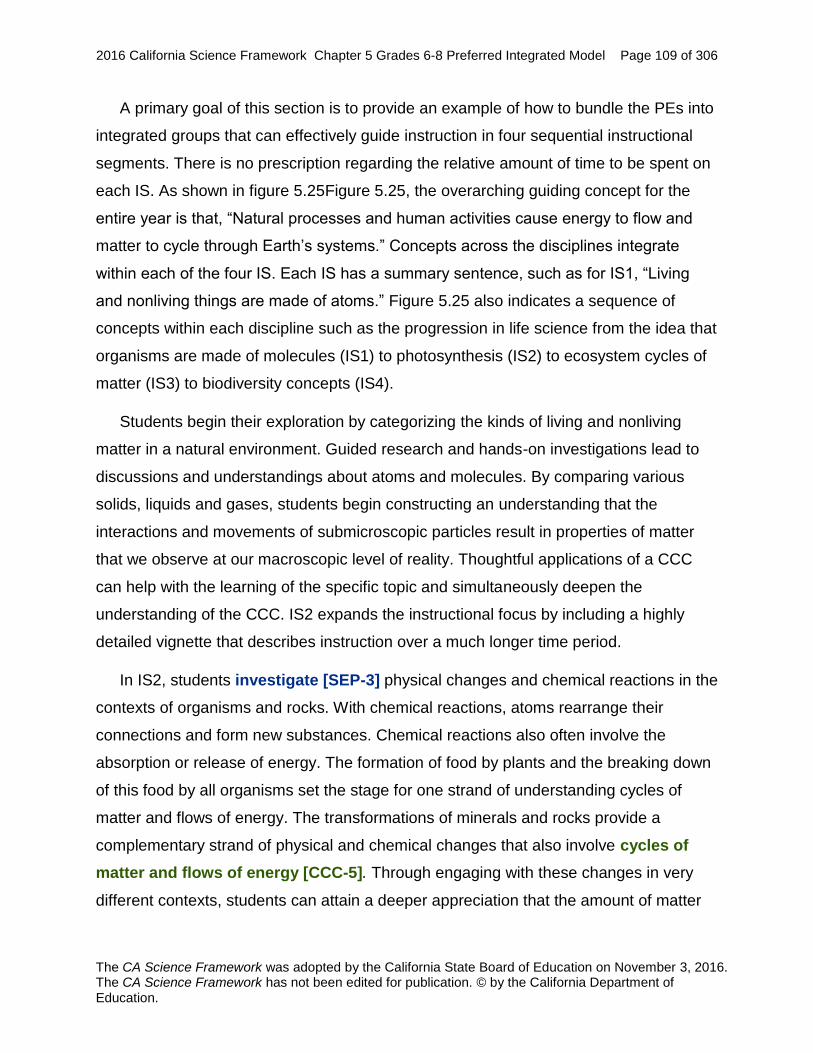
2016 California Science Framework Chapter 5 Grades 6-8 Preferred Integrated Model Page 109 of 306
The CA Science Framework was adopted by the California State Board of Education on November 3, 2016. The CA Science Framework has not been edited for publication. © by the California Department of Education.
A primary goal of this section is to provide an example of how to bundle the PEs into
integrated groups that can effectively guide instruction in four sequential instructional
segments. There is no prescription regarding the relative amount of time to be spent on
each IS. As shown in figure 5.25Figure 5.25, the overarching guiding concept for the
entire year is that, “Natural processes and human activities cause energy to flow and
matter to cycle through Earth’s systems.” Concepts across the disciplines integrate
within each of the four IS. Each IS has a summary sentence, such as for IS1, “Living
and nonliving things are made of atoms.” Figure 5.25 also indicates a sequence of
concepts within each discipline such as the progression in life science from the idea that
organisms are made of molecules (IS1) to photosynthesis (IS2) to ecosystem cycles of
matter (IS3) to biodiversity concepts (IS4).
Students begin their exploration by categorizing the kinds of living and nonliving
matter in a natural environment. Guided research and hands-on investigations lead to
discussions and understandings about atoms and molecules. By comparing various
solids, liquids and gases, students begin constructing an understanding that the
interactions and movements of submicroscopic particles result in properties of matter
that we observe at our macroscopic level of reality. Thoughtful applications of a CCC
can help with the learning of the specific topic and simultaneously deepen the
understanding of the CCC. IS2 expands the instructional focus by including a highly
detailed vignette that describes instruction over a much longer time period.
In IS2, students investigate [SEP-3] physical changes and chemical reactions in the
contexts of organisms and rocks. With chemical reactions, atoms rearrange their
connections and form new substances. Chemical reactions also often involve the
absorption or release of energy. The formation of food by plants and the breaking down
of this food by all organisms set the stage for one strand of understanding cycles of
matter and flows of energy. The transformations of minerals and rocks provide a
complementary strand of physical and chemical changes that also involve cycles of
matter and flows of energy [CCC-5]. Through engaging with these changes in very
different contexts, students can attain a deeper appreciation that the amount of matter

2016 California Science Framework Chapter 5 Grades 6-8 Preferred Integrated Model Page 110 of 306
The CA Science Framework was adopted by the California State Board of Education on November 3, 2016. The CA Science Framework has not been edited for publication. © by the California Department of Education.
always remains the same. In physical changes and in chemical reactions, the numbers
of each type of participating atom remains the same (MS-PS1-5).
As the year progresses, students begin exploring cycles of matter and flows of
energy at larger scales [CCC-3], such as different kinds of natural environments and
their ecosystems. Ecosystems by their very nature embody the integration of Earth
science and life science. This integration is especially evident in the flows of matter and
energy that connect organisms with each other and with their physical environments.
Students also investigate the geoscience processes that change Earth’s surfaces at
varying time and spatial scales [CCC-3], and that result in the uneven distribution of
Earth’s mineral, energy, and groundwater resources. These physical environments play
large roles in determining features of the organisms that live in the local ecosystems.
Students explore biotic and abiotic interactions within these ecosystems, and the
resulting macroscopic cycles of matter, flows of energy, and changes in organism
populations. These general patterns [CCC-1] apply across ecosystems that may
otherwise appear to be very different from each other.
Towards the end of the year, students address challenges to sustainability by
applying their understandings of the natural processes and human activities that shape
Earth’s resources and ecosystems. These environmental challenges can cover a wide
variety of contexts such as adverse consequences of synthetic materials, natural
hazards (e.g., earthquakes and hurricanes), climate change, and habitat destruction.
In IS4, students research issues related to sustaining biodiversity and ecosystem
services. They then have the responsibility to design engineering solutions that rely on
the basic science skills that they developed in earlier instructional segments. They apply
their knowledge, such as a systems-based [CCC-4] understanding of how Earth’s
organisms, including humans, are intimately connected with each other and with Earth’s
cycles of matter and flows of energy [CCC-5]. In their design challenges, students
define the problem, balance criteria and constraints, and evaluate their proposed
solutions.

2016 California Science Framework Chapter 5 Grades 6-8 Preferred Integrated Model Page 111 of 306
The CA Science Framework was adopted by the California State Board of Education on November 3, 2016. The CA Science Framework has not been edited for publication. © by the California Department of Education.
Integrated Grade Seven Instructional Segment 1: Organisms and Nonliving
Things Are Made of Atoms
According to the development progressions in the CA NGSS (Appendix 1 of this
Framework), patterns [CCC-1] at the middle school level include the concept,
“Macroscopic patterns are related to the nature of microscopic atomic-level structure.”
IS1 constantly moves back and forth between these two scales [CCC-3] as students
confront phenomena and try to use models to explain them at the atomic-level.
Integrated Grade Seven – Instructional Segment 1: Organisms and
Nonliving Things Are Made of Atoms
Guiding Questions:
How does the matter in living and nonliving things differ?
How does adding or removing thermal energy affect the physical states
of matter?
How do interactions at the atomic level help us understand the
observable properties of organisms and nonliving matter?
Performance Expectations
Students who demonstrate understanding can:
MS-ESS3-1. Construct a scientific explanation based on evidence for how
the uneven distributions of Earth’s mineral, energy, and
groundwater resources are the result of past and current
geoscience processes. [Clarification Statement: Emphasis is
on how these resources are limited and typically non-renewable,
and how their distributions are significantly changing as a result of
removal by humans. Examples of uneven distributions of
resources as a result of past processes include but are not limited
to petroleum (locations of the burial of organic marine sediments

2016 California Science Framework Chapter 5 Grades 6-8 Preferred Integrated Model Page 112 of 306
The CA Science Framework was adopted by the California State Board of Education on November 3, 2016. The CA Science Framework has not been edited for publication. © by the California Department of Education.
and subsequent geologic traps), metal ores (locations of past
volcanic and hydrothermal activity associated with subduction
zones), and soil (locations of active weathering and/or deposition
of rock).]
MS-PS1-1. Develop models to describe the atomic composition of simple
molecules and extended structures. [Clarification Statement:
Emphasis is on developing models of molecules that vary in
complexity. Examples of simple molecules could include
ammonia and methanol. Examples of extended structures could
include sodium chloride or diamonds. Examples of molecular-
level models could include drawings, 3D ball and stick structures,
or computer representations showing different molecules with
different types of atoms.] [Assessment Boundary: Assessment
does not include valence electrons and bonding energy,
discussing the ionic nature of subunits of complex structures, or a
complete description of all individual atoms in a complex
molecule or extended structure is not required.]
MS-PS1-3. Gather and make sense of information to describe that
synthetic materials come from natural resources and impact
society. [Clarification Statement: Emphasis is on natural
resources that undergo a chemical process to form the synthetic
material. Examples of new materials could include new medicine,
foods, and alternative fuels.] [Assessment Boundary:
Assessment is limited to qualitative information.] (Introduced, but
assessed in IS4)
MS-PS1-4. Develop a model that predicts and describes changes in
particle motion, temperature, and state of a pure substance
when thermal energy is added or removed. [Clarification
Statement: Emphasis is on qualitative molecular-level models of
solids, liquids, and gases to show that adding or removing

2016 California Science Framework Chapter 5 Grades 6-8 Preferred Integrated Model Page 113 of 306
The CA Science Framework was adopted by the California State Board of Education on November 3, 2016. The CA Science Framework has not been edited for publication. © by the California Department of Education.
thermal energy increases or decreases kinetic energy of the
particles until a change of state occurs. Examples of models
could include drawings and diagrams. Examples of particles
could include molecules or inert atoms. Examples of pure
substances could include water, carbon dioxide, and helium.]
The bundle of performance expectations above focuses on the following
elements from the NRC document A Framework for K–12 Science Education:
Highlighted
Science and
Engineering Practices
[SEP-2] Developing
and Using Models
[SEP-6] Constructing
Explanations (for
science) and
Designing Solutions
(for engineering)
[SEP-7] Engaging in
Argument from
Evidence
Highlighted
Disciplinary Core Ideas
PS1.A: Structure and
Properties of Matter
PS3.A: Definitions of
Energy
LS2.A: Interdependent
Relationships in
Ecosystems
ESS3.A: Earth’s
Natural Resources
Highlighted
Crosscutting Concepts
[CCC-1] Patterns
[CCC-2] Cause and
Effect
[CCC-3] Scale,
Proportion, and
Quantity
[CCC-5] Energy and
Matter: Flows, Cycles,
and Conservation

2016 California Science Framework Chapter 5 Grades 6-8 Preferred Integrated Model Page 114 of 306
The CA Science Framework was adopted by the California State Board of Education on November 3, 2016. The CA Science Framework has not been edited for publication. © by the California Department of Education.
[CCC-6] Structure and
Function
Highlighted California Environmental Principles & Concepts:
Principle I The continuation and health of individual human lives and of human
communities and societies depend on the health of the natural
systems that provide essential goods and ecosystem services.
Principle II The long-term functioning and health of terrestrial, freshwater,
coastal and marine ecosystems are influenced by their
relationships with human societies.
CA CCSS Math Connections: 6.EE.6, 6.RP.3, 6.NS.5, 7.EE.4, MP.2, MP.4,
CA ELD Connections: ELD.PI.6.1,5,6 a-b, 9,10,11a
CA CCSSELA/Literacy Connections: RST.6-8.1,7, WHST.6-8.2,8,
For this IS, the anchoring phenomenon is based on students looking at the world
around them and considering, “What are things in the world made out of?” Students can
go outside to the schoolyard or nearby natural setting and sit silently, recording in their
notebook all the different materials they see nearby. Are there patterns [CCC-1] that
allow them to group matter into different categories (like living, nonliving, or once living;
solid, liquid, or gas)? Students can compare the local environment around them to a
picture or diagram of an environment that includes a full range of materials that can
motivate the rest of the unit (figure 5.26; see the Environment Diagrams produced by
WestEd for this purpose, http://we-mss.weebly.com/teacher-resources.html).
Environment diagrams should be selected so that they include living and nonliving parts
of environments (to motivate MS-LS2-3) and illustrate processes that may cause
uneven distributions of resources in different environments (to motivate MS-ESS3-1). A
single environment diagram ties together all of grade seven (e.g., rivers), though

2016 California Science Framework Chapter 5 Grades 6-8 Preferred Integrated Model Page 115 of 306
The CA Science Framework was adopted by the California State Board of Education on November 3, 2016. The CA Science Framework has not been edited for publication. © by the California Department of Education.
students can also periodically break out into small groups to apply their understanding
to other environment diagrams.
Figure 5.26. A River Environment
A river environment with diverse forms of living and nonliving matter. Source: Daehler
and Folsom 2013.
Particle Models of Materials in the Environment
One of the key features of the environment diagrams is the existence of water in all
three states (solid, liquid, and gas). Water is something students directly observe in their
everyday life (at least in two of its three states, as water vapor is hard to directly
observe even though they see its effects regularly), and they have explored the water
cycle in grade six. As such, water is the perfect bridge between the concrete
observations that characterized elementary school and observations in middle school

2016 California Science Framework Chapter 5 Grades 6-8 Preferred Integrated Model Page 116 of 306
The CA Science Framework was adopted by the California State Board of Education on November 3, 2016. The CA Science Framework has not been edited for publication. © by the California Department of Education.
where students use what they can see in everyday life to infer what occurs at scales
[CCC-3] that they cannot directly experience. What is water made out of, what actually
happens when it changes between solid, liquid, and gas?
Just as organisms are made of building blocks (cells) that are too small to see with
the naked eye (sixth grade MS-LS1-1), all of matter is made of building blocks
(particles) that are orders of magnitude smaller, and that cannot be seen even with the
most powerful light microscopes. In grade five, students developed a model of matter
made up of particles too small to see. In the CA NGSS, students will progressively
refine this model throughout middle and high school. In grade seven, students will
include features that:
particles are always moving,
particles can interact (including collide, attract, and repel one another), and
particles can be complex structures called molecules that are made up of smaller
particles called atoms. Or, particles can be individual atoms.
It is not until high school that students add the additional refinement that:
atoms have an internal structure and are made up of parts that have positive and
negative electrical charges.
The structure [CCC-6] of atoms, the periodic table, and the details of chemical
bonding are all addressed in detail when it is developmentally appropriate during high
school (HS-PS1-1 through HS-PS1-8). This focus contrasts with the 1998 CA Science
Content Standards where the periodic table was introduced in fifth grade and the interior
structure [CCC-6] of atoms was introduced in eighth grade. Part of the motivation is
that these features are best understood in light of a more complete understanding of
electromagnetic interactions, which are complex enough that they are introduced in high
school. Teachers are expected to use the name of elements and compounds essential
for life and use language that describes the atoms bonding together, but the features
that make the elements different and the details of chemical bonds are not part of the
middle grade expectations. Taking the time to develop a robust, particulate model of
matter is a significant undertaking and lays key foundations for success in high school

2016 California Science Framework Chapter 5 Grades 6-8 Preferred Integrated Model Page 117 of 306
The CA Science Framework was adopted by the California State Board of Education on November 3, 2016. The CA Science Framework has not been edited for publication. © by the California Department of Education.
physical science. To emphasize this slow developmental progression, teachers should
maintain the grade five terminology of matter made as particles in the first part of the IS
and then formally introduce the distinction between atoms and molecules near the end.
In Preferred Integrated grade six, students investigated objects heating up as energy
transferred to them. These investigations introduced the DCI that thermal energy is
really just the energy of motion of individual particles (PS3.A). When studying the water
cycle in grade six, students also recognized changes in the state of matter (MS-ESS2-
4). In grade seven, will develop models [SEP-2] that explain the relationships between
thermal energy, changes of state, and the motion of particles at scales too small to see
(MS-PS1-4). Because the focus is on developing a conceptual model, students spend
most of their time in this IS observing simple phenomena involving heat transfer and
trying to develop a model at the level of particles for each situation. The evidence
statement for MS-PS1-4 outlines a range of “Connections” where students can connect
their model to the real world (in other words, the phenomena students should be able
explain or predict using their model). In many cases, computer simulations or
animations can quickly illustrate key concepts, but these models should not be
introduced to students until they have time to grapple with the observations and develop
their own models. The representation they use to depict their conceptual models can be
physical, kinesthetic (using their bodies), pictorial (a diagram), use stop motion
animation, or anything else the students can dream up (figure 5.27). As students create
and manipulate their models, they are forced to decide how to represent things; they
must figure out where to move their body in a kinesthetic model, what to draw in a
diagram, etc. Each of these decisions requires them to think about what actually
happens in the physical system. This process takes a lot of time, and a simple two
minute demonstration can sometimes spur model development and revision that takes
several class periods. For example, push a cork down to the bottom of a cup and
release it. It quickly rises to the surface. Do the same thing with a penny and it stays at
the bottom. In both cases, the water seems to be ‘pushing down’ on the objects, so how
do individual collisions between particles cause the cork to rise up? If collisions are
pushing the cork upwards, why doesn’t it just keep going up and launch out of the
water? And if we figure all those things out, where in the system [CCC-4] does the
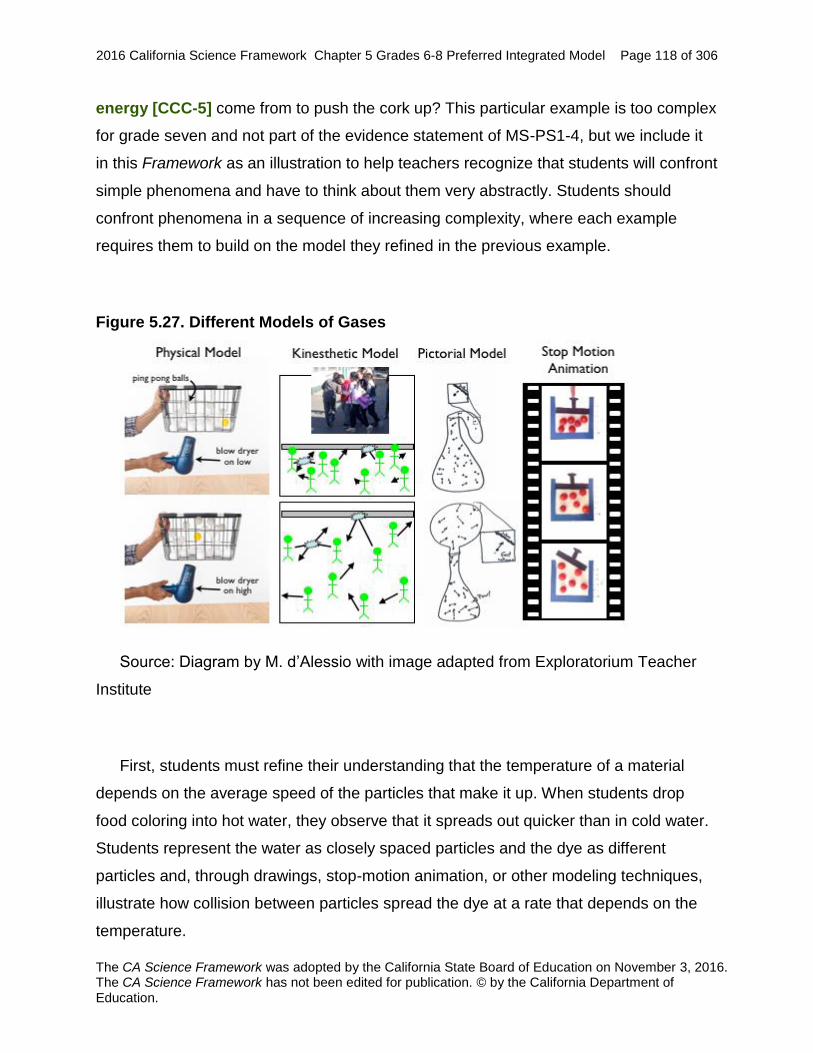
2016 California Science Framework Chapter 5 Grades 6-8 Preferred Integrated Model Page 118 of 306
The CA Science Framework was adopted by the California State Board of Education on November 3, 2016. The CA Science Framework has not been edited for publication. © by the California Department of Education.
energy [CCC-5] come from to push the cork up? This particular example is too complex
for grade seven and not part of the evidence statement of MS-PS1-4, but we include it
in this Framework as an illustration to help teachers recognize that students will confront
simple phenomena and have to think about them very abstractly. Students should
confront phenomena in a sequence of increasing complexity, where each example
requires them to build on the model they refined in the previous example.
Figure 5.27. Different Models of Gases
Source: Diagram by M. d’Alessio with image adapted from Exploratorium Teacher
Institute
First, students must refine their understanding that the temperature of a material
depends on the average speed of the particles that make it up. When students drop
food coloring into hot water, they observe that it spreads out quicker than in cold water.
Students represent the water as closely spaced particles and the dye as different
particles and, through drawings, stop-motion animation, or other modeling techniques,
illustrate how collision between particles spread the dye at a rate that depends on the
temperature.

2016 California Science Framework Chapter 5 Grades 6-8 Preferred Integrated Model Page 119 of 306
The CA Science Framework was adopted by the California State Board of Education on November 3, 2016. The CA Science Framework has not been edited for publication. © by the California Department of Education.
Students can consider the everyday phenomenon of measuring the air pressure in
bicycle tires on a cold morning and again later in the day after riding on hot pavement.
What is air pressure? To bring the phenomena into the classroom for investigation
[SEP-3], students can heat a flask topped by a balloon and watch as the air inflates the
balloon and then deflates as it cools. Repeating the process over and over again helps
convince students that the air is not escaping the system [CCC-4] as it ‘deflates,’ but
there is some change of the air inside the system. Students must then use their model
of matter as particles separated by empty space to explain how the density of the air
changes and how the particles push each other apart as they collide.
Changes in particle kinetic energy can have other dramatic effects at our
macroscopic level, notably changes in physical state. Students can describe the
differences they observe at the macroscopic level between solids, liquids, and gases.
Then, they must relate these changes to interactions between particles at the particle
level (Table 5.). Thinking about water specifically can help this process because
students the familiar experience of changing water from one state to another requires
only a change in temperature (and therefore kinetic energy of particles). The
phenomena that you cannot pull many solids apart is a good cue that there must be
some force that holds particles together in addition to the collisions that push them
apart.
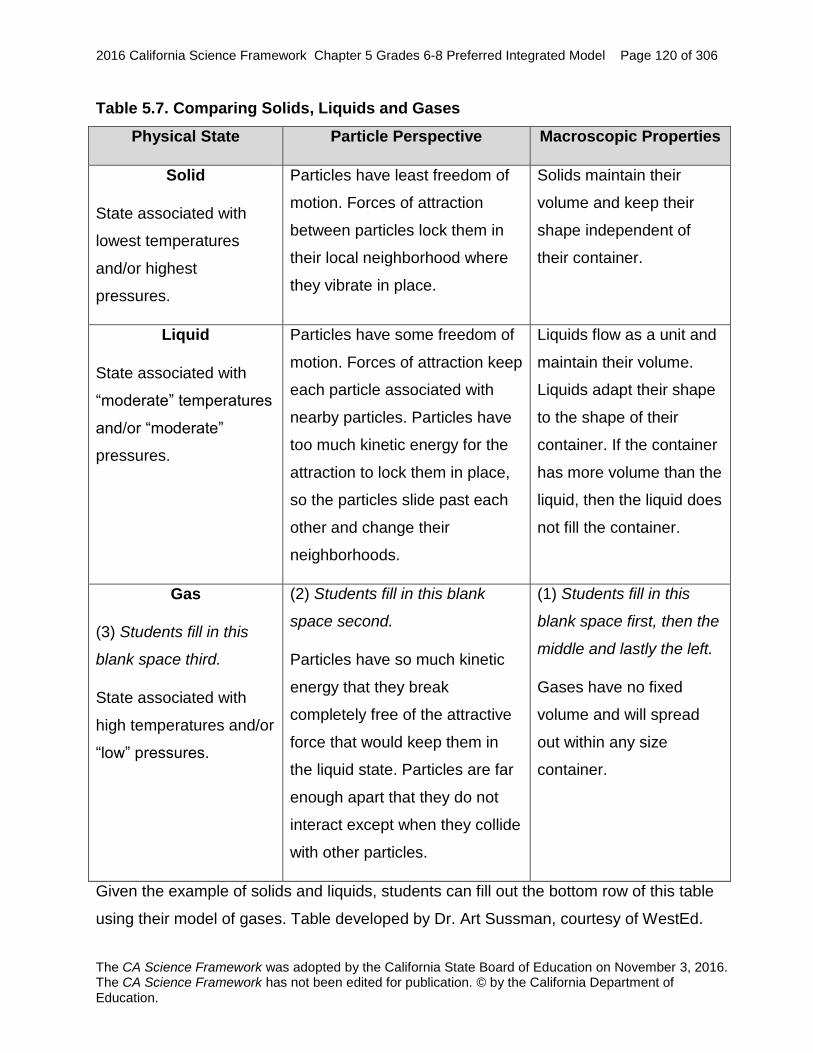
2016 California Science Framework Chapter 5 Grades 6-8 Preferred Integrated Model Page 120 of 306
The CA Science Framework was adopted by the California State Board of Education on November 3, 2016. The CA Science Framework has not been edited for publication. © by the California Department of Education.
Table 5.7. Comparing Solids, Liquids and Gases
Physical State Particle Perspective Macroscopic Properties
Solid
State associated with
lowest temperatures
and/or highest
pressures.
Particles have least freedom of
motion. Forces of attraction
between particles lock them in
their local neighborhood where
they vibrate in place.
Solids maintain their
volume and keep their
shape independent of
their container.
Liquid
State associated with
“moderate” temperatures
and/or “moderate”
pressures.
Particles have some freedom of
motion. Forces of attraction keep
each particle associated with
nearby particles. Particles have
too much kinetic energy for the
attraction to lock them in place,
so the particles slide past each
other and change their
neighborhoods.
Liquids flow as a unit and
maintain their volume.
Liquids adapt their shape
to the shape of their
container. If the container
has more volume than the
liquid, then the liquid does
not fill the container.
Gas
(3) Students fill in this
blank space third.
State associated with
high temperatures and/or
“low” pressures.
(2) Students fill in this blank
space second.
Particles have so much kinetic
energy that they break
completely free of the attractive
force that would keep them in
the liquid state. Particles are far
enough apart that they do not
interact except when they collide
with other particles.
(1) Students fill in this
blank space first, then the
middle and lastly the left.
Gases have no fixed
volume and will spread
out within any size
container.
Given the example of solids and liquids, students can fill out the bottom row of this table
using their model of gases. Table developed by Dr. Art Sussman, courtesy of WestEd.

2016 California Science Framework Chapter 5 Grades 6-8 Preferred Integrated Model Page 121 of 306
The CA Science Framework was adopted by the California State Board of Education on November 3, 2016. The CA Science Framework has not been edited for publication. © by the California Department of Education.
Students have already investigated the gas state in grade five and Integrated grade
six, so they should have the knowledge to make the claim that the empty space in the
unfilled glass actually has matter in the gas state (air consisting mostly of nitrogen gas
and oxygen gas). Students can explore interactive computer simulations that help them
visualize the accepted scientific model of molecular motion and extend their own model
so that they can explain [SEP-6] phase changes between solids, liquids, and gases,
and the transfer of energy [CCC-5] in terms of colliding molecules.
Many students hold the preconception that water is one of the only materials that
can exist in all three states of matter. This false idea arises because it is one of few
materials that change state over the range of temperatures in common, everyday
experience. Students can apply what they have learned about states of water to predict
the behavior of different substances. For example, copper is a solid at room
temperature. What does this tell us about the attraction between particles of copper
compared to particles water? Particles of helium have very weak attraction with
themselves or other particles. Students can use their model [SEP-2] of phase changes
to predict something about the relative freezing temperature of helium compared to
other gases like nitrogen, the biggest component of air (Table 5.).
Table 5.8. Physical States at Normal Atmospheric Pressure
ELEMENT GAS STATE LIQUID STATE SOLID STATE
Water Above 100°C From 0°C to 100°C Below 0°C
Copper Above 2,560°C From 1,084°C to 2,560°C Below 1,084°C
Helium Above -270°C Below -270°C Never
Nitrogen Above -196°C From -196°C to -210°C Below -210°C
Table developed by Dr. Art Sussman, courtesy of WestEd

2016 California Science Framework Chapter 5 Grades 6-8 Preferred Integrated Model Page 122 of 306
The CA Science Framework was adopted by the California State Board of Education on November 3, 2016. The CA Science Framework has not been edited for publication. © by the California Department of Education.
Opportunities for ELA/ELD Connections
As a concluding activity, students create a set of true/false text cards with statements
that summarize participle interactions that happen under different conditions and the
resulting macroscopic properties of solids, liquids and gases. Working in groups,
students exchange the cards with other students so they can use what they have
learned about states of water (see Table 5.7 Comparing Solids, Liquids, and Gases) to
discuss the statements on the cards about whether the behavior of different substances
(such as helium, nitrogen, copper) are true or false using evidence about the
atomic/molecular composition of matter.
CA CCSS ELA/Literacy Standards: RST.6–8.2; SL.6–8.1
CA ELD Standards: ELD.PI.6–8.3
For the next “everyday phenomenon,” students return to the environment diagram
that shows a snow-capped mountain. In grade six, students observed patterns that led
them to the ESS DCI that water condenses into rain drops as air masses rise and
therefore precipitation is more likely at high altitude. Why? And why is it colder at high
altitudes? Students must use their model of particles and PS DCIs to develop the
definition of air pressure in terms of particles. How does a change in pressure cause a
change in temperature. Students can investigate air pressure in the classroom by
exploring the phenomena of inflating a tire with a bicycle pump (which warms up), and
then rapidly deflating the tire and feeling the valve cool down.
Looking further at the environment diagram, what other effects can students
explain? Why are rocks hard and resist erosion? (They must be made from materials
where the attraction between them is strong). What happens when water flows over a
rock and weathers it into pieces? (The collision of water particles with the rock particles
must be strong enough to break the attraction between rock particles). How does a
stream move sediment grains? (Collisions between water particles and rock particles
push the rock downstream).

2016 California Science Framework Chapter 5 Grades 6-8 Preferred Integrated Model Page 123 of 306
The CA Science Framework was adopted by the California State Board of Education on November 3, 2016. The CA Science Framework has not been edited for publication. © by the California Department of Education.
Particles Can Be Simple Atoms or Complex Molecules
As students explored matter as particles, they noticed that not all particles behave
the same. We breathe in oxygen, but breathe out something called carbon dioxide. We
drink water and eat sugar. Each of these names is just a label to describe a material
with distinct properties. Some of these materials are made of simple particles that we
call atoms, but often two or more simple particles can combine to make much more
complicated particles called molecules. Teachers can introduce this terminology of atom
and molecule by providing physical models of these combinations (MS-PS1-1) using
interconnecting plastic toy bricks, sticky notes, or digital representations. Not only do
these models depict atoms that are chemically bonded together, but they also introduce
students to the concept of molecular shape. Molecular structure [CCC-6] is crucial in
determining the behavior and function of these molecules in living systems [CCC-4],
but also in determining the properties of water and other inorganic compounds. It should
be emphasized that explaining these applications is outside the scope of middle school
(for example, water’s polarity cannot be explained without a detailed understanding of
the internal structure [CCC-6] of the atom and chemical bonding), but this PE lays the
foundation for more advanced study. Students will build on this terminology in IS2.
Today, mass spectrometers, x-ray diffractometers, and other devices allow scientists
to take materials, crush them into a powder, and determine their composition (atoms
and molecules). If students could take objects from the environment diagram and place
them in these devices, they would find that the majority of living things are made of just
a few types of atoms, and these atoms are common in the non-living parts of the
environment as well. Teachers can simulate this process using an interactive web page
where students click on objects or using flash cards with object pictures on one side and
a simplified molecular and atomic composition of the object on the other side. Exploring
this data set, students can identify patterns [CCC-1] in the common types of atoms in
the natural environment and begin to develop models of how matter cycles [CCC-5] in
the environment. They will examine these cycles in more detail in IS2.

2016 California Science Framework Chapter 5 Grades 6-8 Preferred Integrated Model Page 124 of 306
The CA Science Framework was adopted by the California State Board of Education on November 3, 2016. The CA Science Framework has not been edited for publication. © by the California Department of Education.
Integrated Grade Seven Instructional Segment 2: Matter Cycles and Energy Flows
through Organisms and Rocks
Students apply their understanding of materials to the cycling of matter [CCC-5] in
two different systems [CCC-4], the cycle of rock material in the geosphere and the
cycling of biomass between organisms. In each case, the flow of energy [CCC-5]
within the system is intimately tied to the flow of matter.
Integrated Grade Seven – Instructional Segment 2: Matter Cycles and
Energy Flows through Organisms and Rocks
Guiding Questions:
How do rocks and minerals record the flow of energy and cycling of matter
in the Earth?
How do we get energy from our food?
How are hot objects different than cold objects? What changes when they
heat up or cool down?
Performance Expectations
Students who demonstrate understanding can:
MS-LS1-6. Construct a scientific explanation based on evidence for the
role of photosynthesis in the cycling of matter and flow of
energy into and out of organisms. [Clarification Statement:
Emphasis is on tracing movement of matter and flow of energy.]
[Assessment Boundary: Assessment does not include the
biochemical mechanisms of photosynthesis.]
MS-LS1-7. Develop a model to describe how food is rearranged through
chemical reactions forming new molecules that support
growth and/or release energy as this matter moves through
an organism. [Clarification Statement: Emphasis is on
describing that molecules are broken apart and put back together
and that in this process, energy is released.] [Assessment
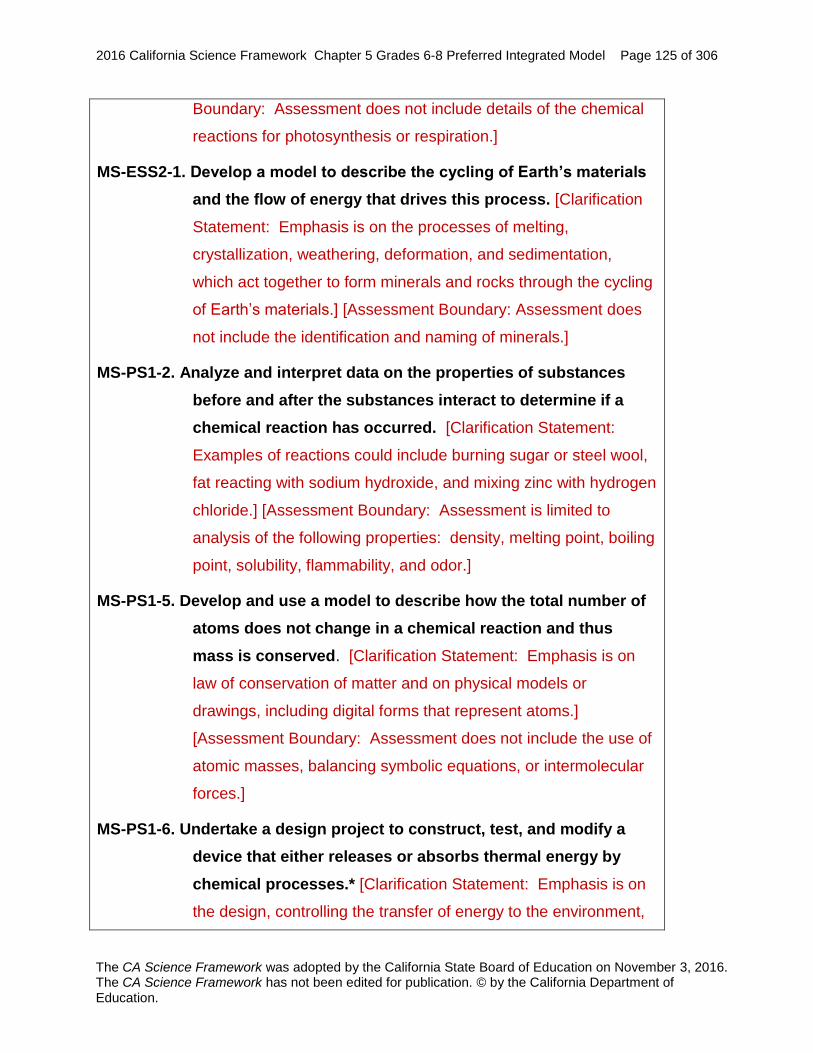
2016 California Science Framework Chapter 5 Grades 6-8 Preferred Integrated Model Page 125 of 306
The CA Science Framework was adopted by the California State Board of Education on November 3, 2016. The CA Science Framework has not been edited for publication. © by the California Department of Education.
Boundary: Assessment does not include details of the chemical
reactions for photosynthesis or respiration.]
MS-ESS2-1. Develop a model to describe the cycling of Earth’s materials
and the flow of energy that drives this process. [Clarification
Statement: Emphasis is on the processes of melting,
crystallization, weathering, deformation, and sedimentation,
which act together to form minerals and rocks through the cycling
of Earth’s materials.] [Assessment Boundary: Assessment does
not include the identification and naming of minerals.]
MS-PS1-2. Analyze and interpret data on the properties of substances
before and after the substances interact to determine if a
chemical reaction has occurred. [Clarification Statement:
Examples of reactions could include burning sugar or steel wool,
fat reacting with sodium hydroxide, and mixing zinc with hydrogen
chloride.] [Assessment Boundary: Assessment is limited to
analysis of the following properties: density, melting point, boiling
point, solubility, flammability, and odor.]
MS-PS1-5. Develop and use a model to describe how the total number of
atoms does not change in a chemical reaction and thus
mass is conserved. [Clarification Statement: Emphasis is on
law of conservation of matter and on physical models or
drawings, including digital forms that represent atoms.]
[Assessment Boundary: Assessment does not include the use of
atomic masses, balancing symbolic equations, or intermolecular
forces.]
MS-PS1-6. Undertake a design project to construct, test, and modify a
device that either releases or absorbs thermal energy by
chemical processes.* [Clarification Statement: Emphasis is on
the design, controlling the transfer of energy to the environment,
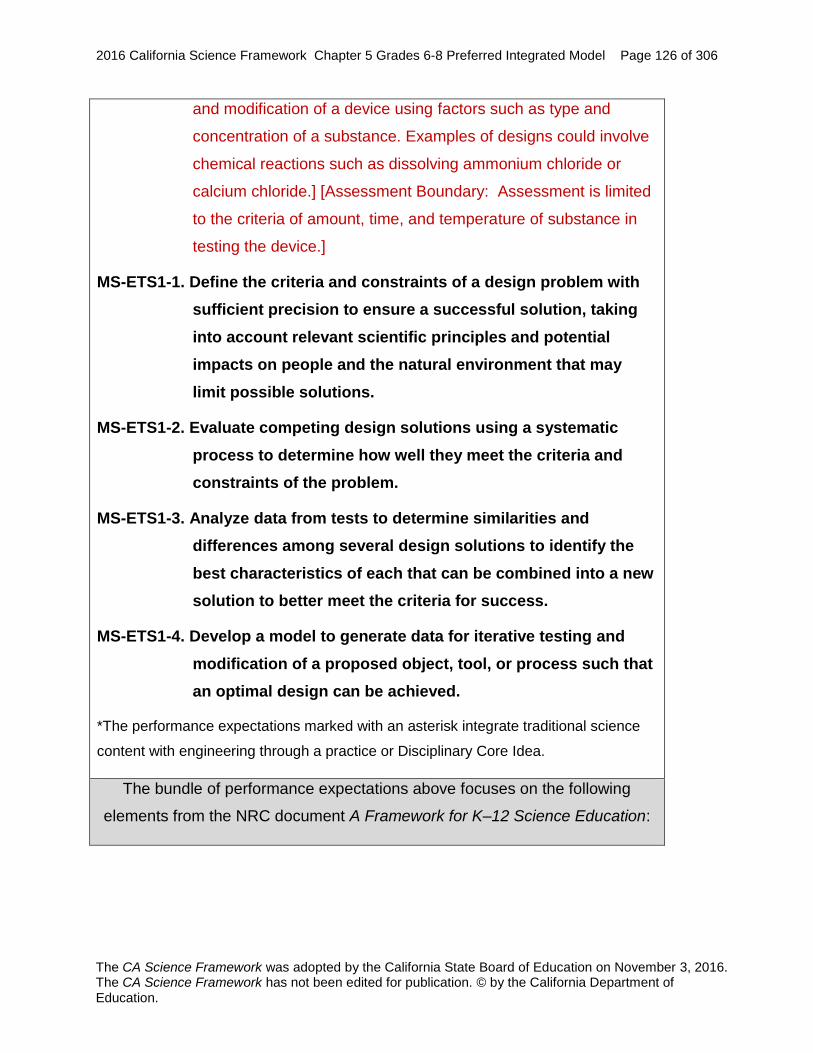
2016 California Science Framework Chapter 5 Grades 6-8 Preferred Integrated Model Page 126 of 306
The CA Science Framework was adopted by the California State Board of Education on November 3, 2016. The CA Science Framework has not been edited for publication. © by the California Department of Education.
and modification of a device using factors such as type and
concentration of a substance. Examples of designs could involve
chemical reactions such as dissolving ammonium chloride or
calcium chloride.] [Assessment Boundary: Assessment is limited
to the criteria of amount, time, and temperature of substance in
testing the device.]
MS-ETS1-1. Define the criteria and constraints of a design problem with
sufficient precision to ensure a successful solution, taking
into account relevant scientific principles and potential
impacts on people and the natural environment that may
limit possible solutions.
MS-ETS1-2. Evaluate competing design solutions using a systematic
process to determine how well they meet the criteria and
constraints of the problem.
MS-ETS1-3. Analyze data from tests to determine similarities and
differences among several design solutions to identify the
best characteristics of each that can be combined into a new
solution to better meet the criteria for success.
MS-ETS1-4. Develop a model to generate data for iterative testing and
modification of a proposed object, tool, or process such that
an optimal design can be achieved.
*The performance expectations marked with an asterisk integrate traditional science
content with engineering through a practice or Disciplinary Core Idea.
The bundle of performance expectations above focuses on the following
elements from the NRC document A Framework for K–12 Science Education:

2016 California Science Framework Chapter 5 Grades 6-8 Preferred Integrated Model Page 127 of 306
The CA Science Framework was adopted by the California State Board of Education on November 3, 2016. The CA Science Framework has not been edited for publication. © by the California Department of Education.
Highlighted Science and
Engineering Practices [SEP-1] Asking
Questions and
Defining Problems
[SEP-2] Developing
and Using Models
[SEP-3] Planning and
Carrying Out
Investigations
[SEP-6] Constructing
Explanations (for
science) and
Designing Solutions
(for engineering)
[SEP-7] Engaging in
Argument from
Evidence
[SEP-8] Obtaining,
Evaluating, and
Communicating
Information
Highlighted
Disciplinary Core Ideas
LS1.C: Organization
for Matter and Energy
Flow in Organisms
PS1.A: Structure and
Properties of Matter
PS1.B: Chemical
Reactions
ESS2.A Earth’s
Materials and Systems
ETS1.A: Defining and
Delimiting Engineering
Problems
ETS1.B: Developing
Possible Solutions
Highlighted
Crosscutting Concepts
[CCC-1] Patterns
[CCC-2] Cause and
Effect
[CCC-4] System and
System Models
[CCC-5] Energy and
Matter: Flows, Cycles,
and Conservation
[CCC-6] Structure and
Function

2016 California Science Framework Chapter 5 Grades 6-8 Preferred Integrated Model Page 128 of 306
The CA Science Framework was adopted by the California State Board of Education on November 3, 2016. The CA Science Framework has not been edited for publication. © by the California Department of Education.
ETS1.C: Optimizing the
Design Solution
Highlighted California Environmental Principles & Concepts:
Principle III Natural systems proceed through cycles that humans depend
upon, benefit from and can alter.
Principle IV The exchange of matter between natural systems and human
societies affects the long term functioning of both.
Principle V: Decisions affecting resources and natural systems are based on a
wide range of considerations and decision-making processes.
CA CCSS Math Connections: 6.EE.9, MP.2, MP.4, 6.SP.4,5, 7.EE.3, 7.SP.7
CA ELD Connections: ELD.PI.6.1,5,6 a-b, 9,10,11a
CA CCSSELA/Literacy Connections: RST.6-8.1,2,3,7, WHST.6-8.2,7,8,9,
SL.7.5
Students have been investigating the relationships between plants and animals
since kindergarten (K-LS1-1) and supported the claim that plants get the matter they
need from air and water in grade five (5-LS1-1), thus tying the biosphere to the rest of
Earth’s systems. The vignette below illustrates one approach to teaching about energy
and matter flows in living systems in the middle grades.

2016 California Science Framework Chapter 5 Grades 6-8 Preferred Integrated Model Page 129 of 306
The CA Science Framework was adopted by the California State Board of Education on November 3, 2016. The CA Science Framework has not been edited for publication. © by the California Department of Education.
Integrated Grade Seven
Vignette 5.2. Physical and Chemical Changes in Organisms
Performance Expectations
Students who demonstrate understanding can:
MS-LS1-6. Construct a scientific explanation based on evidence for the role of
photosynthesis in the cycling of matter and flow of energy into and
out of organisms. [Clarification Statement: Emphasis is on tracing
movement of matter and flow of energy.] [Assessment Boundary:
Assessment does not include the biochemical mechanisms of
photosynthesis.]
MS-LS1-7. Develop a model to describe how food is rearranged through chemical
reactions forming new molecules that support growth and/or release
energy as this matter moves through an organism. [Clarification
Statement: Emphasis is on describing that molecules are broken apart
and put back together and that in this process, energy is released.]
[Assessment Boundary: Assessment does not include details of the
chemical reactions for photosynthesis or respiration.]
MS-PS1-2. Analyze and interpret data on the properties of substances before and
after the substances interact to determine if a chemical reaction has
occurred. [Clarification Statement: Examples of reactions could include
burning sugar or steel wool, fat reacting with sodium hydroxide, and
mixing zinc with hydrogen chloride.] [Assessment Boundary: Assessment
is limited to analysis of the following properties: density, melting point,
boiling point, solubility, flammability, and odor.]
MS-PS1-5. Develop and use a model to describe how the total number of atoms
does not change in a chemical reaction and thus mass is conserved.
[Clarification Statement: Emphasis is on law of conservation of matter
and on physical models or drawings, including digital forms that represent
atoms.] [Assessment Boundary: Assessment does not include the use of

2016 California Science Framework Chapter 5 Grades 6-8 Preferred Integrated Model Page 130 of 306
The CA Science Framework was adopted by the California State Board of Education on November 3, 2016. The CA Science Framework has not been edited for publication. © by the California Department of Education.
atomic masses, balancing symbolic equations, or intermolecular forces.]
MS-PS1-6. Undertake a design project to construct, test, and modify a device that
either releases or absorbs thermal energy by chemical processes.*
[Clarification Statement: Emphasis is on the design, controlling the
transfer of energy to the environment, and modification of a device using
factors such as type and concentration of a substance. Examples of
designs could involve chemical reactions such as dissolving ammonium
chloride or calcium chloride.] [Assessment Boundary: Assessment is
limited to the criteria of amount, time, and temperature of substance in
testing the device.]
MS-ETS1-1. Define the criteria and constraints of a design problem with sufficient
precision to ensure a successful solution, taking into account
relevant scientific principles and potential impacts on people and the
natural environment that may limit possible solutions.
MS-ETS1-2. Evaluate competing design solutions using a systematic process to
determine how well they meet the criteria and constraints of the
problem.
MS-ETS1-3. Analyze data from tests to determine similarities and differences
among several design solutions to identify the best characteristics
of each that can be combined into a new solution to better meet the
criteria for success.
MS-ETS1-4. Develop a model to generate data for iterative testing and
modification of a proposed object, tool, or process such that an
optimal design can be achieved.
*The performance expectations marked with an asterisk integrate traditional science content
with engineering through a practice or Disciplinary Core Idea.
The bundle of performance expectations above focuses on the following elements from
the NRC document A Framework for K–12 Science Education:
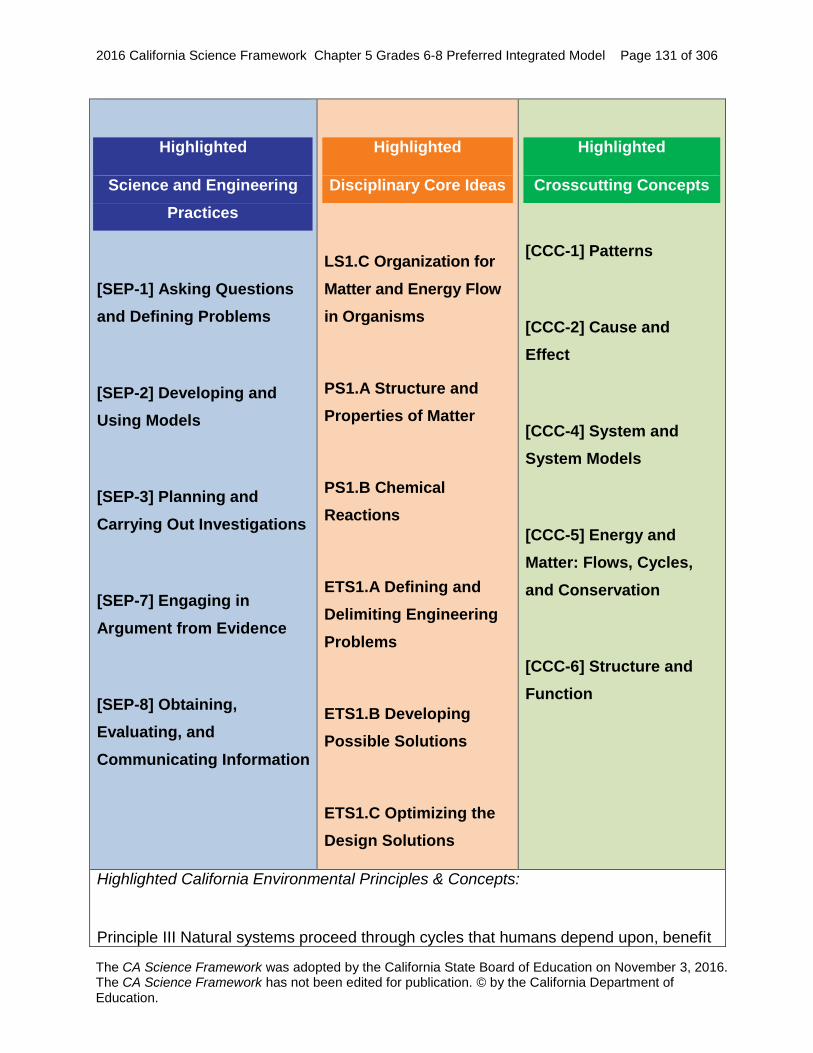
2016 California Science Framework Chapter 5 Grades 6-8 Preferred Integrated Model Page 131 of 306
The CA Science Framework was adopted by the California State Board of Education on November 3, 2016. The CA Science Framework has not been edited for publication. © by the California Department of Education.
Highlighted
Science and Engineering
Practices
[SEP-1] Asking Questions
and Defining Problems
[SEP-2] Developing and
Using Models
[SEP-3] Planning and
Carrying Out Investigations
[SEP-7] Engaging in
Argument from Evidence
[SEP-8] Obtaining,
Evaluating, and
Communicating Information
Highlighted
Disciplinary Core Ideas
LS1.C Organization for
Matter and Energy Flow
in Organisms
PS1.A Structure and
Properties of Matter
PS1.B Chemical
Reactions
ETS1.A Defining and
Delimiting Engineering
Problems
ETS1.B Developing
Possible Solutions
ETS1.C Optimizing the
Design Solutions
Highlighted
Crosscutting Concepts
[CCC-1] Patterns
[CCC-2] Cause and
Effect
[CCC-4] System and
System Models
[CCC-5] Energy and
Matter: Flows, Cycles,
and Conservation
[CCC-6] Structure and
Function
Highlighted California Environmental Principles & Concepts:
Principle III Natural systems proceed through cycles that humans depend upon, benefit

2016 California Science Framework Chapter 5 Grades 6-8 Preferred Integrated Model Page 132 of 306
The CA Science Framework was adopted by the California State Board of Education on November 3, 2016. The CA Science Framework has not been edited for publication. © by the California Department of Education.
from and can alter.
Principle IV The exchange of matter between natural systems and human societies affects the long term functioning of both.
Connections to the CA CCSSM: MP. 5
Connections to CA CCSS for ELA/Literacy: RST.6–8.7, 9; SL.7.1
Connections to CA ELD Standards: ELD.PI.6-8.1, 9
Introduction
This vignette illustrates the integration of life and physical science concepts
surrounding energy and matter flows [CCC-5] in living systems [CCC-4]. It is
designed to illustrate a large section of IS2 within the Integrated grade seven course.
Instruction spans nearly three weeks, beginning at the scale of entire ecosystems,
zooming down to the scale [CCC-3] of individual atoms and molecules, and then
returning back to the scale of individual organisms within the ecosystem.
Day 1: Classifying
changes in a natural
environment
Students identify changes
that happened over 200
years in a river
environment and ask
questions about the
similarities and differences
between these changes.
Day 2: Identifying and
Defining Chemical
Changes
Students analyze
observations of
substances before and
after they interact to
determine features
characteristic of chemical
changes.
Days 3-4: Models of
Photosynthesis
Students engage in a short
engineering design
challenge to find an
effective physical model for
atoms and molecules in
the photosynthesis
reaction.
Day 5: Energy and the
chemical reaction of
respiration
Students struggle with and
Days 6-8: “Energy Love”
Investigations
Students explore hands-on
stations with different
Day 9: Models of Energy
from Food
Students grapple with
models of the flow of

2016 California Science Framework Chapter 5 Grades 6-8 Preferred Integrated Model Page 133 of 306
The CA Science Framework was adopted by the California State Board of Education on November 3, 2016. The CA Science Framework has not been edited for publication. © by the California Department of Education.
discuss how to represent
energy using their physical
model of the respiration
reaction.
devices that use or give off
energy and try to develop
a definition of energy (a
task as difficult as defining
love). When that fails, they
resort to categorizing
different forms of energy.
energy in a chemical
system.
Days 10-13: Engineering
design challenge to
quantify energy released
Students refine the design
of a food calorimeter that
converts chemical
potential energy into
thermal energy.
Day 14: Organism
energy/matter system
diagram
Students develop a model
of the energy flow and
matter cycling at the scale
of organisms in an
ecosystem.
Day 1 – Classifying changes in a natural environment
Anchoring phenomenon: Within a river environment, a lot changes in 200 years.
Plants and animals live and grow.
In IS1, students noted the kinds of matter that exist in natural environments. They
had begun with whole class discussions focused on a river environment viewed 200
years ago (figure 5.26). To start IS2, Mr. G presented students a new illustration of the
same location today (figure 5.28). What has changed?

2016 California Science Framework Chapter 5 Grades 6-8 Preferred Integrated Model Page 134 of 306
The CA Science Framework was adopted by the California State Board of Education on November 3, 2016. The CA Science Framework has not been edited for publication. © by the California Department of Education.
Figure 5.28. River Environment
The previously viewed river environment 200 years later. Adapted from Daehler and
Folsom 2013.
Students excitedly began working in groups to compare the two diagrams. Students
listed many differences including trees that had fallen or that had grown considerably,
and the appearance of a live deer. Then they included more subtle changes such as the
disappearance of the deer carcass, erosion of rock, and widening of the river at the
base of the waterfall.
After whole class sharing and reaching a class consensus about the changes, Mr. G
distributed a short illustrated reading about the differences between a physical change
and a chemical reaction. Reading and writing individually, and then discussing in pairs,
students generated a list of scientific questions [SEP-1] they had about the changes
that had happened in the natural environment. In the subsequent whole class sharing
and discussions, questions emerged about physical and chemical changes.

2016 California Science Framework Chapter 5 Grades 6-8 Preferred Integrated Model Page 135 of 306
The CA Science Framework was adopted by the California State Board of Education on November 3, 2016. The CA Science Framework has not been edited for publication. © by the California Department of Education.
Juanita had argued, “A change can be both a physical change and a chemical
change. Why does it have to be only one of them?” Alex had taken that argument
[SEP-7] in a different direction by saying some of the changes should be classified as
“biological changes,” a third category separate from the other two. Mr. G asked the
students to think about these and other questions as they completed the homework
reading and questions about physical and chemical changes.
Day 2 – Identifying and Defining Chemical Changes
Investigative Phenomenon: When substances mix, sometimes unusual things happen
and sometimes they don’t.
When students mixed substances together in grade five, they found that sometimes
new substances formed and sometimes they did not (5-PS1-4). Mr. G set up a similar
series of investigations [SEP-3] to pinpoint specific changes in physical properties
(change in color, bubbling of a gas, or an increase in temperature) that tended to
indicate a chemical change had happened. They analyze [SEP-4] the results of their
investigations by organizing their observations and looking for patterns [CCC-1] in what
they saw, heard, smelled, or felt (MS-PS1-2). Students liked the idea that the changes
in physical properties were similar to clues in a mystery story or crime scene
investigation. The investigation included some examples that appeared to be chemical
changes (gas bubbling out of a soda can) but that were really just physical changes.
This emphasis on the word ‘just’ helped students distinguish between the two kinds of
changes.
Juanita shared a Venn diagram that she had made to answer her own previous
question about whether something could be both a physical and a chemical change.
Her diagram showed that both kinds of changes had alterations in physical properties
(the shared circle in the middle), but only chemical changes had changes in the bonding
of the atoms within molecules. The physical change circle showed water boiling with the
words “it’s all still H2O.” The chemical change circle showed a wood fire and smoke with
the words, “new substances appear.” Lorena was particularly troubled by this phrase

2016 California Science Framework Chapter 5 Grades 6-8 Preferred Integrated Model Page 136 of 306
The CA Science Framework was adopted by the California State Board of Education on November 3, 2016. The CA Science Framework has not been edited for publication. © by the California Department of Education.
and asked, “How do these substances magically appear?” Mr. G encouraged Lorena
and Juanita to repeat several of the investigations in sealed bag so that no matter can
enter or leave and watch to see if the mass changes. As they found in grade five (MS-
PS1-2), the mass remained unchanged for all the changes. “See, whatever stuff starts
in the bag stays in the bag,” gloated Lorena. Juanita recognized that her words were
misleading and erased them to read, “old substances change into new substances.” Mr.
G highlighted the new phrase to the class and asked students to work in teams to
rewrite Juanita’s idea using the terms atoms and molecules. After students share their
ideas, Mr. G introduced the new term, ‘chemical bond’ to describe how the atoms stay
together as molecules. “What exactly is a chemical bond?”, asked Pedro?
Days 3-4 – Models of Photosynthesis
Investigative Phenomenon: Trees grow using air and water.
In the next lesson, Mr. G connected the student questions about changes in atomic
connections with the chemical change that all the student groups had identified in the
river environment – the photosynthesis that had enabled the tree to grow so much. Mr.
G asked students to call out what plants need to grow. He pointed out that air and water
are both made of molecules. Within the plant, these substances change into new
substances. Mr. G rewrote the needs as chemical formulas and then wrote out the rest
of the balanced equation for photosynthesis on the board. He emphasized that the
arrow in the chemical equation represented the chemical change. He then provided
interconnecting plastic toy bricks to students and instructed them to create a model
[SEP-2] of that reaction. Each group of students had a variety of colorful toy bricks that
they could assemble in their work areas.
Marco, the reporter for one student group, described how they used a different type
of toy brick for each molecule. Most of the other student groups had used a similar type
of modeling. Marco explained how their model [SEP-2] represented carbon dioxide with
the small black brick (“just like coal”), water with the small blue brick (“just like the
ocean”), glucose with the big white brick (“just like a sugar cube”), and oxygen with the

2016 California Science Framework Chapter 5 Grades 6-8 Preferred Integrated Model Page 137 of 306
The CA Science Framework was adopted by the California State Board of Education on November 3, 2016. The CA Science Framework has not been edited for publication. © by the California Department of Education.
small red brick (“just like fire”). Kelly, another member of the same student group,
proudly added that they had used six of each type of brick except for only one white
brick so their model was just as correct as the equation that Mr. G had put on the board.
She also pointed out, “In case you did not notice it, I was making an argument based
on evidence [SEP-7].”
Juanita and Alex called everyone’s attention to their group. Alex explained that they
had tried to use models where each type of toy brick represented a different kind of
atom. Their group liked that idea because they thought it would help show how the
connections between the atoms changed during the reaction. However, when they tried
to put the glucose molecule together, “The whole thing got very messy and we argued
about whether our model [SEP-2] was really helping us understand the chemical
reaction.”
Mr. G used this discussion as an opportunity to share illustrations of models that
scientists use to represent the bonding within molecules and the shapes of common
molecules (carbon dioxide, water, glucose and oxygen). He asked teams of students to
discuss what kind of materials that they might use to represent those molecules and the
photosynthesis equation. As student presented their ideas, Mr. G emphasized that the
class was engaging in a simple engineering design problem. This prompted them to
discuss the problem in terms of the criteria and constraints. They noted one constraint
was that they could only use inexpensive materials. One significant criterion was that
there needed to be different representations for each kind of atom so they could track
the changes in bonding associated with the reaction. By the end of the class period,
students had reached a consensus on using different colored sticky notes to represent
the three different types of atoms involved (figure 5.29). Students also wanted to use a
smaller size sticky note to represent hydrogen since they knew that it was the smallest
atom.

2016 California Science Framework Chapter 5 Grades 6-8 Preferred Integrated Model Page 138 of 306
The CA Science Framework was adopted by the California State Board of Education on November 3, 2016. The CA Science Framework has not been edited for publication. © by the California Department of Education.
Figure 5.29. Classroom Model of a Glucose Molecule
A model of a glucose molecule with different colors representing carbon (C), oxygen (O)
and hydrogen (H). Provided by Dr. Art Sussman, courtesy of WestEd.
At the start of the next day, each group gathered supplies of sticky notes and began
to assemble them to model [SEP-2] photosynthesis. Most of the student groups
successfully created a model of a glucose molecule. They had also used the correct
numbers of all the molecules. They were able to use the model as evidence to explain
[SEP-6] that in the reaction none of the atoms had disappeared, and that there were
also no new atoms in the products (MS-PS1-5). The products side of their model had
exactly the same numbers and kinds of atoms as the reactants side of their model. Mr.
G reinforced their use of the term “conservation of matter” to describe this feature of
chemical reactions. Students inquired if physical changes also featured this rule of
conservation of matter. After some discussion and additional modeling, they agreed that
all changes followed this rule.
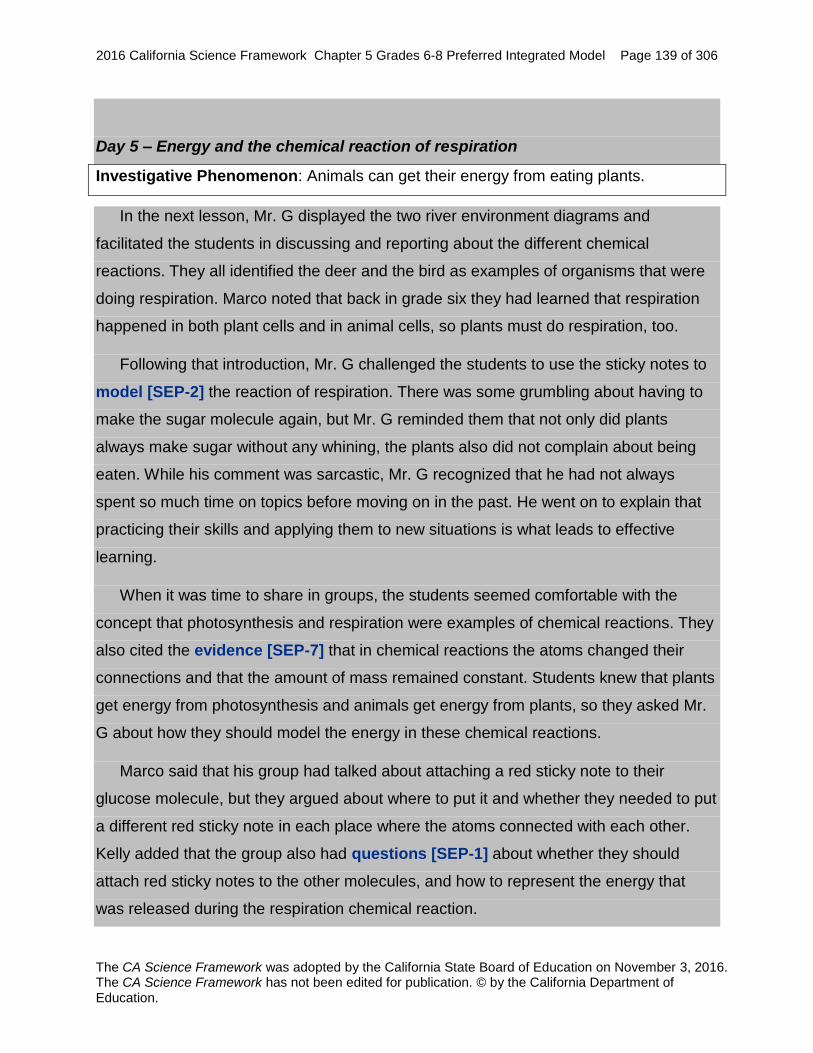
2016 California Science Framework Chapter 5 Grades 6-8 Preferred Integrated Model Page 139 of 306
The CA Science Framework was adopted by the California State Board of Education on November 3, 2016. The CA Science Framework has not been edited for publication. © by the California Department of Education.
Day 5 – Energy and the chemical reaction of respiration
Investigative Phenomenon: Animals can get their energy from eating plants.
In the next lesson, Mr. G displayed the two river environment diagrams and
facilitated the students in discussing and reporting about the different chemical
reactions. They all identified the deer and the bird as examples of organisms that were
doing respiration. Marco noted that back in grade six they had learned that respiration
happened in both plant cells and in animal cells, so plants must do respiration, too.
Following that introduction, Mr. G challenged the students to use the sticky notes to
model [SEP-2] the reaction of respiration. There was some grumbling about having to
make the sugar molecule again, but Mr. G reminded them that not only did plants
always make sugar without any whining, the plants also did not complain about being
eaten. While his comment was sarcastic, Mr. G recognized that he had not always
spent so much time on topics before moving on in the past. He went on to explain that
practicing their skills and applying them to new situations is what leads to effective
learning.
When it was time to share in groups, the students seemed comfortable with the
concept that photosynthesis and respiration were examples of chemical reactions. They
also cited the evidence [SEP-7] that in chemical reactions the atoms changed their
connections and that the amount of mass remained constant. Students knew that plants
get energy from photosynthesis and animals get energy from plants, so they asked Mr.
G about how they should model the energy in these chemical reactions.
Marco said that his group had talked about attaching a red sticky note to their
glucose molecule, but they argued about where to put it and whether they needed to put
a different red sticky note in each place where the atoms connected with each other.
Kelly added that the group also had questions [SEP-1] about whether they should
attach red sticky notes to the other molecules, and how to represent the energy that
was released during the respiration chemical reaction.

2016 California Science Framework Chapter 5 Grades 6-8 Preferred Integrated Model Page 140 of 306
The CA Science Framework was adopted by the California State Board of Education on November 3, 2016. The CA Science Framework has not been edited for publication. © by the California Department of Education.
Other students joined in with their own ideas to argue [SEP-7] whether and how to
represent energy in their models, and what was actually happening with energy in the
reaction. By the end of the class discussion, there seemed to be general agreement that
they would not use sticky notes to represent energy because “energy was like a whole
different kind of thing or idea than matter.” The students concluded that they needed to
spend more time talking and learning about energy, and specifically the changes in
energy [CCC-5] during chemical reactions.
Days 6-8 – “Energy Love” Investigations
Investigative Phenomenon: (Students investigate a range of devices that use or give
off energy)
Mr. G set up stations around the room for students to explore different forms of
energy. Each station had cryptic labels and instructions such as a ball labeled, “Drop
me,” a bowl of fresh fruit with the label “eat me,” and a radio playing music with the
label, “Dance with me.” On the board, Mr. G had written the instructions, “Describe how
each station relates to energy.” As the students circulated between the stations, they
discussed everything they knew and wondered about energy from their previous
science classes and real world experiences. Mr. G helped them develop and compare
Frayer diagrams about the concept of energy. In the end, they concluded that there was
no simple definition of energy that they could memorize and repeat back word for word
on a test question to prove that they understood the science concept of energy. Some
students seemed to find some consolation when they could not agree on a definition of
“love.” Alex summed it up by saying, “I can’t define love, but I know different kinds of
love when I see and feel them. Maybe it will be the same with energy.”
Over the next several days, Mr. G referred to the different stations and subsequent
hands-on experiences as their “energy love” investigations. Mr. G then asked the
students to categorize the investigations based on patterns [CCC-1] they noticed. After
some discussion, the class settled on two categories and developed a summary table
that listed examples of “Energy of Motion” and “Energy of Position.” With that common
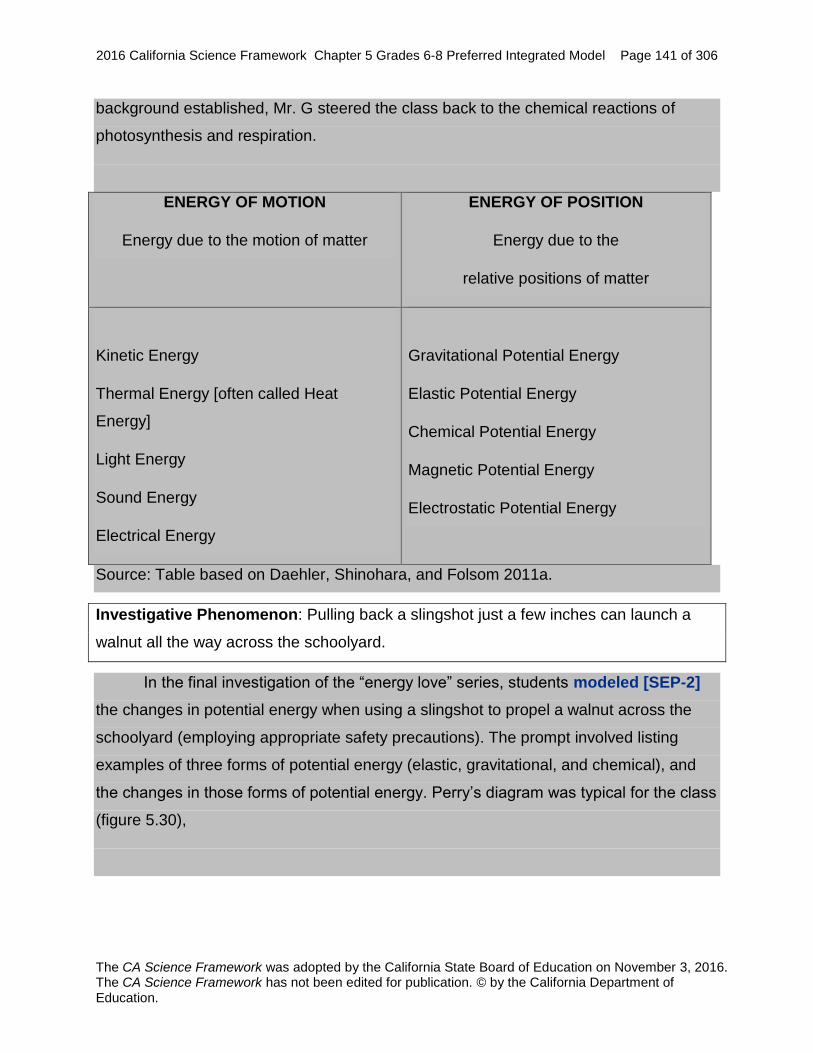
2016 California Science Framework Chapter 5 Grades 6-8 Preferred Integrated Model Page 141 of 306
The CA Science Framework was adopted by the California State Board of Education on November 3, 2016. The CA Science Framework has not been edited for publication. © by the California Department of Education.
background established, Mr. G steered the class back to the chemical reactions of
photosynthesis and respiration.
ENERGY OF MOTION
Energy due to the motion of matter
ENERGY OF POSITION
Energy due to the
relative positions of matter
Kinetic Energy
Thermal Energy [often called Heat
Energy]
Light Energy
Sound Energy
Electrical Energy
Gravitational Potential Energy
Elastic Potential Energy
Chemical Potential Energy
Magnetic Potential Energy
Electrostatic Potential Energy
Source: Table based on Daehler, Shinohara, and Folsom 2011a.
Investigative Phenomenon: Pulling back a slingshot just a few inches can launch a
walnut all the way across the schoolyard.
In the final investigation of the “energy love” series, students modeled [SEP-2]
the changes in potential energy when using a slingshot to propel a walnut across the
schoolyard (employing appropriate safety precautions). The prompt involved listing
examples of three forms of potential energy (elastic, gravitational, and chemical), and
the changes in those forms of potential energy. Perry’s diagram was typical for the class
(figure 5.30),

2016 California Science Framework Chapter 5 Grades 6-8 Preferred Integrated Model Page 142 of 306
The CA Science Framework was adopted by the California State Board of Education on November 3, 2016. The CA Science Framework has not been edited for publication. © by the California Department of Education.
Figure 5.30. Student Diagram of Changes in Potential Energy
Student diagram of changes in potential energy accompanying the propulsion of a
walnut by a slingshot. EPE was the abbreviation the class used for elastic potential
energy and GPE for gravitational potential energy. Source: Daehler, Shinohara, and
Folsom 2011a.
In debriefing the investigation, Mr. G pointed out that the assignment had specified
describing the chemical potential energy within their diagram, yet most diagrams did not
mention chemical potential at all. Perry defended his diagram by saying, “We did elastic
and gravitational, but there is no food in this diagram so we did not include chemical.”
After Marco pointed out that the walnut is food, Perry replied, “Okay, the walnut is
food and has chemical potential energy, but that energy didn’t change in the
experiment. We didn’t eat or burn the walnut.”
Talking in groups, students discussed whether there was anything else in the
diagrams that had chemical potential energy. While at first there was resistance and a
tendency to identify the chemical potential energy only with food, the group and class

2016 California Science Framework Chapter 5 Grades 6-8 Preferred Integrated Model Page 143 of 306
The CA Science Framework was adopted by the California State Board of Education on November 3, 2016. The CA Science Framework has not been edited for publication. © by the California Department of Education.
discussions eventually led to the realization that all the matter in the diagram had
chemical potential energy: air, ground, slingshot wood, and slingshot rubber band.
Day 9 – Models of Energy from Food
Everyday Phenomenon: We get hot when we exercise.
After all this “energy love,” Mr. G’s returned to the question, “How do we get energy
from our food?” and asked students to draw or write a response for their warm-up. Most
students chose to write a response, and most included the phrase, “chemical potential
energy gets converted into kinetic energy.” While they all had ‘correct’ answers, Mr. G
pointed out that most of the class used the passive voice that energy “gets converted.”
What does the converting? How does that happen? Trying to convey enthusiasm about
a new unexplained challenge, Mr. G said, “I think that “we still don’t have a good model
[SEP-2] of what causes [CCC-2] that energy conversion. If we did, more of you would
have drawn that model.” Mr. G next provided students a clue – he cited the everyday
phenomenon that people get all hot and sweaty when they exercise. Why do we get
hot? Mr. G reminded students where they left off yesterday that ALL materials have
chemical potential energy stored in their bonds. The students worked in teams to refine
their model of the changes in energy that go in in cells as food molecules get
rearranged during cellular respiration (MS-LS1-7). During whole class discussion, teams
held up molecules from their sticky note models of respiration and say that the chemical
energy in the products (water and carbon dioxide) must be smaller than the total
chemical energy of the reactants (glucose and oxygen) because energy left the system
[CCC-4] as thermal energy or kinetic energy when the atoms got rearranged into new
molecules. Mr. G then asked them if they can imagine a situation where a system would
get cooler because of a chemical reaction, and they replied that energy would have to
come into the system to make the energy of the products greater than the energy of the
starting reactants. They discussed the chemical reactions in a first aid cold pack (figure
5.31).

2016 California Science Framework Chapter 5 Grades 6-8 Preferred Integrated Model Page 144 of 306
The CA Science Framework was adopted by the California State Board of Education on November 3, 2016. The CA Science Framework has not been edited for publication. © by the California Department of Education.
Figure 5.31. Two Different Categories of Chemical Reactions
Energy Releasing Reactions Energy Absorbing Reactions
Total Energy of Reactants > Total
Energy of Products
Total Energy of Reactants < Total Energy
of Products
Comparing the total energy of reactants and of products, and relating their relative
amounts to whether a reaction releases or absorbs energy. Provided by Dr. Art
Sussman, courtesy of WestEd.
Days 10-13 – Engineering design challenge to quantify energy released
Investigative Problem: How do we capture as much of the energy as possible in a
calorimeter so that we can measure the chemical potential energy in food?
One of Mr. G’s favorite hands-on activities to do with students had been to burn
different kinds of foods to quantify and compare the amounts of thermal energy
released per gram of food item. Several years ago he had stopped using this activity as
he had concluded that while the students had enjoyed the activity, it had not reinforced
their understandings of chemical potential energy in the ways that he had wanted. After
participating in the CA NGSS professional development and planning with his middle
grade team, he decided to try this activity in a different way that emphasized
engineering design. He also wanted students to have more active roles than following

2016 California Science Framework Chapter 5 Grades 6-8 Preferred Integrated Model Page 145 of 306
The CA Science Framework was adopted by the California State Board of Education on November 3, 2016. The CA Science Framework has not been edited for publication. © by the California Department of Education.
directions, recording their results on a data sheet created by the teacher, and then
doing the calculations based on a formula provided by the teacher.
The activity began with students bringing in food labels. Sharing the food labels with
each other, the students raised questions [SEP-1] and also provided answers about
food contents, the meaning of calories, and the connections with chemical reactions and
chemical potential energy. Mr. G then shows the students a prototype calorimeter made
out of a soda can. Students will refine this device to convert the chemical potential
energy in the food to thermal energy (MS-PS1-6) that they can use to determine the
number of calories of a food sample. The calculations are advanced for his middle
school students (they complete this activity in the high school Three Course Chemistry
in the Earth System course), but Mr. G has set up an interactive spreadsheet where all
they do is enter their measurements and they get the estimate of the food’s calories
content. Mr. G wants the students to optimize this prototype so that it creates more
accurate estimates. Students brainstormed a list of major criteria [SEP-1] for their
design challenge that included safety, cost and accuracy (MS-ETS1-1). To make the
device more accurate, they need to capture as much of the energy [CCC-5] from the
food as possible. Safety concerns place constraints on the types of materials they can
use (they must be non-flammable).
The student groups had numerous opportunities to share plans with each other,
critique each other’s ideas (MS-ETS1-2), and refine their plans before getting approval
from Mr. G to proceed with the construction and testing of their devices. The class as a
whole determined the foods that would be tested, again using the same design criteria
but being especially cognizant of the issue of food allergies. Students collaboratively
worked on designing the data sheets that they would use. In addition, students had
multiple opportunities to iteratively test and improve their device subject to limitations
imposed by the teacher and the rest of the class (MS-ETS1-4). During each test,
students use the same food with a known calorie content and check to see how well
their device reproduces the known value and identify design elements of the
calorimeters that worked best (MS-ETS1-3). At the end of the design and testing,
students can use their calorimeter to measure the calorie content of other foods. Groups

2016 California Science Framework Chapter 5 Grades 6-8 Preferred Integrated Model Page 146 of 306
The CA Science Framework was adopted by the California State Board of Education on November 3, 2016. The CA Science Framework has not been edited for publication. © by the California Department of Education.
then share posters that communicate [SEP-8] their design to their peers. They include
diagrams with annotations that describe how the different structures [CCC-6] and
materials help make the device meet the design criteria.
Day 14 – Organism energy/matter system diagram
Investigative Phenomenon: Animals survive and grow by eating food.
Mr. G told the class they were going to ‘zoom out’ to cycles of matter and the
flows of energy [CCC-5] from the point of view of whole organisms. He first elicited
from the students what they knew about systems and system models [CCC-4] in
terms of drawing the boundary of a system, identifying the parts of the system, and
identifying the system’s inputs and outputs. As a whole class, they agreed on the
conventions they would use in drawing the system.
Returning to the river environment diagram, students worked in pairs and developed
a system model to illustrate the flows of matter and energy [CCC-5] into and out of
the deer and also into and out of the grass (MS-LS1-6). The class developed a
consensus diagram (figure 5.32) after students worked on their separate team
diagrams, critiqued each other’s diagrams, iteratively improved them, and then finalized
the diagram after whole class discussion.

2016 California Science Framework Chapter 5 Grades 6-8 Preferred Integrated Model Page 147 of 306
The CA Science Framework was adopted by the California State Board of Education on November 3, 2016. The CA Science Framework has not been edited for publication. © by the California Department of Education.
Figure 5.32. System Model to Illustrate Flows of Matter and Energy
Flows of energy and matter into, within and out of a model of a Deer-Grass System.
Thin red arrows represent energy and thick black arrows represent matter. CPE is
chemical potential energy. Provided by Dr. Art Sussman, courtesy of WestEd.
Vignette Debrief
In this vignette, the teacher introduced phenomena related to physical and chemical
changes via a comparison of the changes that had occurred in a river environment after
200 years. Students noticed changes to both the nonliving and living components of the
environment. The vignette focuses more on lessons that connect the physical and
chemical changes with the life science processes of photosynthesis and respiration.
Modeling the photosynthesis reaction was a major highlight that helped students
conclude that atoms rearrange in chemical reactions, mass is conserved, and energy
can be absorbed or released. In subsequent lessons within IS2, students will reach the
same conclusions regarding Earth science processes.

2016 California Science Framework Chapter 5 Grades 6-8 Preferred Integrated Model Page 148 of 306
The CA Science Framework was adopted by the California State Board of Education on November 3, 2016. The CA Science Framework has not been edited for publication. © by the California Department of Education.
This vignette illustrates the CA NGSS vision of blending SEPs, DCIs, and CCCs.
While the lesson description describes this blend, the sections below focus on relevant
aspects of each dimension in isolation, along with ties CA CCSS and the EP&Cs.
SEPs. Students focused on developing models [SEP-2] throughout this vignette,
with them spending all of Days 3-4, 8, 9, and 14 on grappling with phenomena and
trying to model them. These modeling experiences were not designed as assessments
of learning at the end. Instead, Mr. G used these modeling opportunities to motivate and
frame the learning – students recognized limitations and missing pieces in their
understanding when they built the models. For example, the “Energy Love”
investigations on Days 6-8 were included because students did not know how to
represent energy in their models because they didn’t understand enough about energy
yet. On Days 1-2, students analyzed data [SEP-4] in the sense that they looked for
patterns [CCC-1] in their qualitative observations and made categories based on those
patterns. Mr. G chose to introduce the distinctions of ‘physical v. chemical change’ by
having students ‘discover’ the categories themselves and then refining their labels to
reflect the current state of scientific vocabulary, rather than beginning with the scientific
terminology as a straight definition.
DCIs. Chemical reactions (PS2.B), the energy in chemical reactions (PS3.D), and
energy and matter flow in organisms (LS1.C) were the common thread through the
entire lesson. Students extended their understanding of matter made up of atoms and
molecules (PS1.A) through their physical modeling on Days 3-5 and 9. On days 6-8,
students grappled with the definitions of energy (PS3.A). The engineering challenge on
Days 10-13 allowed students to focus on all aspects of engineering design (ETS1) and
they even briefly addressed these core ideas on Day 3 when they tried to find the best
way to represent molecules using a physical model.
CCCs. Student models focused on the exchange of energy and matter [CCC-5]
between components of chemical systems (Days 3-5), macroscopic physical systems
(Days 6-8), a calorimeter system (Days 10-13), and a small section of an entire
ecosystem (Day 14). While students have tracked the flow of matter in elementary
school, tracking energy as it changed between various forms is the key addition to

2016 California Science Framework Chapter 5 Grades 6-8 Preferred Integrated Model Page 149 of 306
The CA Science Framework was adopted by the California State Board of Education on November 3, 2016. The CA Science Framework has not been edited for publication. © by the California Department of Education.
understanding CCC-5 at the middle school level (see the progressions in Appendix 3 of
this Framework). While systems [CCC-4] were inherent in the modeling, very little
discussion in the vignette, as written, was explicitly devoted to thinking of these
situations as system. That explicit discussion would be done as part of the classroom
discourse not captured in this write up.
EP&Cs. As written, Mr. G did not explicitly address any of the EP&Cs, though the
skills students developed discussing the cycling of matter in their modeling are crucial
for understanding EPC IV (“The exchange of matter between natural systems and
human societies affects the long-term functioning of both.”). Mr. G could easily extend
this vignette another day to fast forward into the future with another environment
diagram showing human impacts from pollution, or by tracking toxins in the Day 14
diagrams that show matter exchanged between organisms.
CA CCSS Connections to English Language Arts and Mathematics. Students
engage in structured discourse (SL.7.1) with teams throughout the vignette, including
evaluating and reviewing the ideas of their peers on Days 2, 3-4, during the engineering
design challenge on days 10-13 and again on Day 14. The students calculate the
calories in food samples using an interactive spreadsheet (MP.5).
Resources
Daehler, Kirsten, and Jennifer Folsom. 2013. Making Sense of SCIENCE: Earth
Systems. San Francisco: WestEd.
Daehler, Kirsten, Mayumi Shinohara, and Jennifer Folsom. 2011a. Making Sense of
SCIENCE: Energy. San Francisco: WestEd.

2016 California Science Framework Chapter 5 Grades 6-8 Preferred Integrated Model Page 150 of 306
The CA Science Framework was adopted by the California State Board of Education on November 3, 2016. The CA Science Framework has not been edited for publication. © by the California Department of Education.
Rock Cycles and Earth’s Energy Flows
The second half of IS2 involves applying the same physical science concepts
explored in the vignette to the cycling of Earth’s materials [CCC-5] and the flows of
energy [CCC-5] that drive these processes (MS-ESS2-1). Rocks and minerals make up
the vast majority of the planet’s mass. They provide homes for organisms, make many
of Earth’s surface landforms, and provide the basis for all of Earth’s soil. Students return
to the environment diagram of figure 5.28 and focus on the rocks. Can they notice
evidence of places where rocks are forming or changing? The class makes a list of all
the different things they can think of that can happen to rocks: eroded by the river,
erupted from a volcano, buried at the bottom of a landslide, broken up by roots, eaten
as a speck of soil on a piece of grass, dust blown by the wind, etc. Students engage in a
jigsaw where different students read a short article about a particular location on Earth
that exemplifies one transformation in the rock cycle. The articles have pictures of rocks
and the locations where they were found that highlight the evidence for the change (i.e.,
a volcanic rock has holes in it that are evidence of gas bubbles and came from a long
outcrop that heads straight downhill providing evidence that the material once flowed as
a liquid at the surface). Students then come together for a ‘rock summit’ to describe the
possible events that can befall a piece of rock.
Students write a fictional short story tracing the path of one rock through many
adventures. As an illustration for this piece, they depict the path of their imaginary rock
on a flowchart. As students compare their flowcharts, they see that no two rocks follow
the same path. This idea is critical because it counters the misconception that many
students have when they read materials about the ‘rock cycle’ – since these materials
are written on a page they have a linear flow that implies there is only one path. Next,
students work in groups to create a physical model of one rock story using crayons or
sugar cubes. Both these materials can be melted, solidified, broken apart, dissolved (for
sugar), pressed together (for crayons). Students will record the process in a video that
captures how their rock changes. They start by making a storyboard to plan the physical
processes they will depict in each scene and also their narration for that scene. In the
narration, they must emphasize where the energy [CCC-5] comes from that drives the
transformation in each scene. They discuss both the energy in the physical model as

2016 California Science Framework Chapter 5 Grades 6-8 Preferred Integrated Model Page 151 of 306
The CA Science Framework was adopted by the California State Board of Education on November 3, 2016. The CA Science Framework has not been edited for publication. © by the California Department of Education.
well as where the energy source would be in the real Earth system. If students have
uncertainty about where energy comes from in the Earth system, they return to the
jigsaw articles or the teacher can engage in whole class discussions and provide
additional information. The paragraphs below provide some of this background for
teachers, and curriculum developers can find excellent examples within California and
beyond to as case studies that exemplify and describe these processes and the
evidence for them.
Many rock changes are driven by the transfer of Earth’s internal thermal energy.
This internal thermal energy resulted from the immense heating of Earth’s interior during
its cataclysmic formation billions of years ago, the gravitational compaction of Earth in
its early history, and the energy released by radioactive decay of buried Earth materials.
Rocks cycle through melting and solidifying as the get buried where they warm up as
because they are closer to the hot interior, or rise towards the surface where they cool.
The movement of rocks upwards and downward is often related to the motions of plate
tectonics. As the plates push together, spread apart, and slide against one another, a
variety of geologic processes occur including earthquakes, volcanic activity, mountain
building, seafloor spreading, and subduction (sinking of a plate into the underlying
mantle). All of these geoscience processes change Earth’s rock – some form new rock,
and others break down existing rock.
Near the surface, rocks also form and break down by interacting with other Earth
systems – namely, the atmosphere, hydrosphere (Earth’s water including ice) and
biosphere (Earth’s life). For example, exposure to air, wind, and biological activity all
cause [CCC-2] rock to weather (change physically or chemically). Chemical weathering
by the atmosphere, hydrosphere and biosphere occurs when chemical reactions break
down the chemical bonds that hold rocks together. Physical weathering causes rocks to
physically break into smaller pieces but does not change the rock’s chemical bonds.
Energy that drives these surface processes comes from the Sun (which provides
thermal energy that drives chemical reactions and also causes the movements of wind
and water in the atmosphere and biosphere), gravity (and its constant downward pull on

2016 California Science Framework Chapter 5 Grades 6-8 Preferred Integrated Model Page 152 of 306
The CA Science Framework was adopted by the California State Board of Education on November 3, 2016. The CA Science Framework has not been edited for publication. © by the California Department of Education.
air, water, and rock), and the chemical potential energy within the biosphere (which
ultimately comes from the Sun).
After students have explored and modeled these processes, they can label them
with scientific terms. Observation and explanation of phenomena drive instruction in the
CA NGSS, not terminology. With this terminology, students can develop something like
figure 5.33, a classic rock cycle diagram with the three major rock types of igneous
(melted in Earth’s interior), sedimentary (compacted from broken pieces), and
metamorphic (rearranged by Earth’s internal pressure and thermal energy). Students
can evaluate [SEP-8] the benefits and limitations of this classic rock cycle diagram
(Table 5.).
Figure 5.33. Classic Rock Cycle Diagram
The classic rock cycle diagram summarizes the three types of rocks and a circular
pattern of movements of rock materials. Source: Daehler and Folsom 2013.

2016 California Science Framework Chapter 5 Grades 6-8 Preferred Integrated Model Page 153 of 306
The CA Science Framework was adopted by the California State Board of Education on November 3, 2016. The CA Science Framework has not been edited for publication. © by the California Department of Education.
Table 5.9. Benefits and Limitations of Classic Rock Cycle Diagram
Benefits Limitations
Good summary of key
geosphere interactions.
Does not show the many interactions the geosphere has
with other Earth systems.
Easy to read and
understand.
Does not show the timeframe for each geologic process,
implying that they have similar timeframes.
Shows how each type of
rock can become the other
types of rock.
Does not show the locations where each geologic process
takes place.
Helps dispel the incorrect
idea that rock is “steady as
a rock” and never
changes.
Suggests that rock never leaves the rock cycle. Yet rocks
often do leave the rock cycle, such as when they are
incorporated into organisms, other Earth systems, and
human-made materials.
Source: Based on Folsom and Daehler 2012.
The physical and chemical changes [CCC-7] that happen to minerals and rocks
reinforce the principle of the conservation of matter [CCC-5]. Almost three-quarters of
Earth’s crust is made of oxygen and silicon (students encountered this information at
the end of IS1 when they simulated data collection of materials in the environment
diagram of the river). Just six elements (aluminum, iron, magnesium, calcium, sodium,
and potassium) make up practically all the rest of Earth’s crust. Atoms of these eight
elements combine to form Earth’s rocks and minerals. Throughout all the physical and
chemical interactions, none of these atoms are lost or destroyed. Even as the
appearance and behavior of the rocks change [CCC-7], their overall composition
remains relatively stable [CCC-7].

2016 California Science Framework Chapter 5 Grades 6-8 Preferred Integrated Model Page 154 of 306
The CA Science Framework was adopted by the California State Board of Education on November 3, 2016. The CA Science Framework has not been edited for publication. © by the California Department of Education.
Integrated Grade Seven Instructional Segment 3: Natural Processes and Human
Activities Shape Earth’s Resources and Ecosystems
When students look out a landscape, they might see trees in some places but not
others and a gold mine on one hill but not another. In this IS, students focus on
explaining why things are located where they are, both organisms within an ecosystem
and resources and hazards on the planet. In both cases, interactions within and
between different Earth’s systems determine these distributions. Humans both depend
on these distributions and can dramatically alter them. The goal of integrating these
topics is that the questions students learn to ask about the distribution of resources on
the planet can serve as a template for understanding the relationships between
organisms in an ecosystem, and vice versa.
Integrated Grade Seven – Instructional Segment 3: Natural Processes and
Human Activities Shape Earth’s Resources and Ecosystems
Guiding Questions:
How can we use interactions between individual rocks or individual
organisms to understand systems as big as the whole geosphere or
whole ecosystem?
How can we use patterns in geosphere interactions to predict the
location of resources?
How can we use patterns in ecosystem interactions to predict how
organisms compete and share resources?
Performance Expectations
Students who demonstrate understanding can:
MS-LS2-1. Analyze and interpret data to provide evidence for the effects
of resource availability on organisms and populations of
organisms in an ecosystem. [Clarification Statement:

2016 California Science Framework Chapter 5 Grades 6-8 Preferred Integrated Model Page 155 of 306
The CA Science Framework was adopted by the California State Board of Education on November 3, 2016. The CA Science Framework has not been edited for publication. © by the California Department of Education.
Emphasis is on cause and effect relationships between resources
and growth of individual organisms and the numbers of
organisms in ecosystems during periods of abundant and scarce
resources.]
MS-LS2-2. Construct an explanation that predicts patterns of interactions
among organisms across multiple ecosystems. [Clarification
Statement: Emphasis is on predicting consistent patterns of
interactions in different ecosystems in terms of the relationships
among and between organisms and abiotic components of
ecosystems. Examples of types of interactions could include
competitive, predatory, and mutually beneficial.]
MS-LS2-3. Develop a model to describe the cycling of matter and flow of
energy among living and nonliving parts of an ecosystem.
[Clarification Statement: Emphasis is on describing the
conservation of matter and flow of energy into and out of various
ecosystems, and on defining the boundaries of the system.]
[Assessment Boundary: Assessment does not include the use of
chemical reactions to describe the processes.]
MS-ESS2-3. Analyze and interpret data on the distribution of fossils and
rocks, continental shapes, and seafloor structures to provide
evidence of the past plate motions. [Clarification Statement:
Examples of data include similarities of rock and fossil types on
different continents, the shapes of the continents (including
continental shelves), and the locations of ocean structures (such
as ridges, fracture zones, and trenches).] [Assessment Boundary:
Paleomagnetic anomalies in oceanic and continental crust are
not assessed.]
MS-ESS3-1. Construct a scientific explanation based on evidence for how
the uneven distributions of Earth’s mineral, energy, and

2016 California Science Framework Chapter 5 Grades 6-8 Preferred Integrated Model Page 156 of 306
The CA Science Framework was adopted by the California State Board of Education on November 3, 2016. The CA Science Framework has not been edited for publication. © by the California Department of Education.
groundwater resources are the result of past and current
geoscience processes. [Clarification Statement: Emphasis is
on how these resources are limited and typically non-renewable,
and how their distributions are significantly changing as a result
of removal by humans. Examples of uneven distributions of
resources as a result of past processes include but are not limited
to petroleum (locations of the burial of organic marine sediments
and subsequent geologic traps), metal ores (locations of past
volcanic and hydrothermal activity associated with subduction
zones), and soil (locations of active weathering and/or deposition
of rock).]
MS-PS1-2. Analyze and interpret data on the properties of substances
before and after the substances interact to determine if a
chemical reaction has occurred. [Clarification Statement:
Examples of reactions could include burning sugar or steel wool,
fat reacting with sodium hydroxide, and mixing zinc with hydrogen
chloride.] [Assessment Boundary: Assessment is limited to
analysis of the following properties: density, melting point, boiling
point, solubility, flammability, and odor.]
MS-PS1-3. Gather and make sense of information to describe that
synthetic materials come from natural resources and impact
society. [Clarification Statement: Emphasis is on natural
resources that undergo a chemical process to form the synthetic
material. Examples of new materials could include new medicine,
foods, and alternative fuels.] [Assessment Boundary:
Assessment is limited to qualitative information.] (Revisited from
IS1, but not assessed until IS4)
MS-PS1-5. Develop and use a model to describe how the total number of
atoms does not change in a chemical reaction and thus
mass is conserved. [Clarification Statement: Emphasis is on

2016 California Science Framework Chapter 5 Grades 6-8 Preferred Integrated Model Page 157 of 306
The CA Science Framework was adopted by the California State Board of Education on November 3, 2016. The CA Science Framework has not been edited for publication. © by the California Department of Education.
law of conservation of matter and on physical models or
drawings, including digital forms that represent atoms.]
[Assessment Boundary: Assessment does not include the use of
atomic masses, balancing symbolic equations, or intermolecular
forces.]
The bundle of performance expectations above focuses on the following
elements from the NRC document A Framework for K–12 Science Education:
Highlighted
Science and
Engineering Practices
[SEP-2] Developing
and Using Models
[SEP-4] Analyzing and
Interpreting Data
[SEP-6] Constructing
Explanations (for
science) and
Designing Solutions
(for engineering)
[SEP-8] Obtaining,
Evaluating, and
Communicating
Highlighted
Disciplinary Core Ideas
LS2.A: Interdependent
Relationships in
Ecosystems
LS2.B: Cycles of
Matter and Energy
Transfer in
Ecosystems
ESS2.B: Plate
Tectonics and Large
Scale System
Interactions
Highlighted
Crosscutting Concepts
[CCC-1] Patterns
[CCC-2] Cause and
Effect
[CCC-4] System and
System Models
[CCC-5] Energy and
Matter: Flows, Cycles,
and Conservation

2016 California Science Framework Chapter 5 Grades 6-8 Preferred Integrated Model Page 158 of 306
The CA Science Framework was adopted by the California State Board of Education on November 3, 2016. The CA Science Framework has not been edited for publication. © by the California Department of Education.
Information ESS3.A: Earth’s
Natural Resources
PS1.B: Chemical
Reactions
Highlighted California Environmental Principles & Concepts:
Principle I: The continuation and health of individual human lives and of human communities and societies depend on the health of the natural systems that provide essential goods and ecosystem services. Principle II: The long-term functioning and health of terrestrial, freshwater, coastal and marine ecosystems are influenced by their relationships with human societies.
Principle III Natural systems proceed through cycles that humans depend
upon, benefit from and can alter.
Principle IV The exchange of matter between natural systems and human
societies affects the long term functioning of both.
Principle V Decisions affecting resources and natural systems are complex and
involve many factors.
CA CCSS Math Connections: 6.EE.6,9, 6.SP.4,5, 6.RP.3,7.EE.4, MP.2,
CA ELD Connections: ELD.PI.6.1,5,6 a-b, 9,10,11a
CA CCSSELA/Literacy Connections: RST.6-8.1,2,7,9, WHST.6-8.1,2,9, SL.7.1,
SL.7.4, SL.7.5
Back in Integrated grade six, students examined a satellite view of California and
explained some of the features they saw (figure 5.4). They return to that image and look
for evidence of mountains. California has two main mountain ranges, one along the
coast and one on the east side. The anchoring phenomenon they consider is that both

2016 California Science Framework Chapter 5 Grades 6-8 Preferred Integrated Model Page 159 of 306
The CA Science Framework was adopted by the California State Board of Education on November 3, 2016. The CA Science Framework has not been edited for publication. © by the California Department of Education.
these mountain ranges run roughly parallel to the coastline. Is the fact that all three of
these features are aligned a coincidence? Students engage in a case study of a
scientist from the early 1900’s named Alfred Wegener who also began by looking at the
locations of mountain ranges and noticed some patterns [CCC-1] (MS-ESS2-3).
Students begin by reading short geologic descriptions of rocks in the Appalachian
Mountains, the Scottish Highlands, South Africa, Brazil, and a few other localities
(thrown in for contrast) based on scientific journal articles that Wegener himself read
back in the early 1900’s. Students identify that the rocks in the Appalachian mountains
have very similar features to those in the Scottish Highlands; rocks from South African
and Brazilian are also similar to one another but different from the other pair. Despite
the fact that each pair of rock formations is relatively distinct, each has a matching
partner half way around the world. Wegener asked questions [SEP-1] about what
could possibly explain the large present-day separation, so he considered the idea that
all of Earth’s continents could have been connected together millions of years ago and
subsequently moved to their current locations. He gathered substantial evidence [SEP-
7] that supported this proposed explanation [SEP-6] and he began to refer to the idea
as “continental drift.” (An English translation of Wegener’s 1912 article outlines the full
range of his evidence [Wegener 1912]). Some of this evidence came from using maps
to show how well the continents fit together, especially including the submerged
continental shelves in aligning the continents, and most obviously with South America
and Africa. Students can repeat this jig-saw puzzle activity with paper and scissors and
identify specific places where it works well and others where it does not.
Even more persuasive was evidence [SEP-7] from fossils. Students can engage in
an activity where they collect samples from around the globe and place them on a map.
They discover dozens of different species, but which species support Wegener’s claim?
Do any of them provide evidence that contradicts his claim? They might end up with a
map similar to figure 5.34 that shows continents from the Southern Hemisphere and
how they could have been joined together hundreds of millions of years ago. The
colored areas correspond to fossils whose specific geographic locations indicate not
only that these continents were joined together, but also specifically that the connection
points match those predicted by matching the outlines of the continents. The current
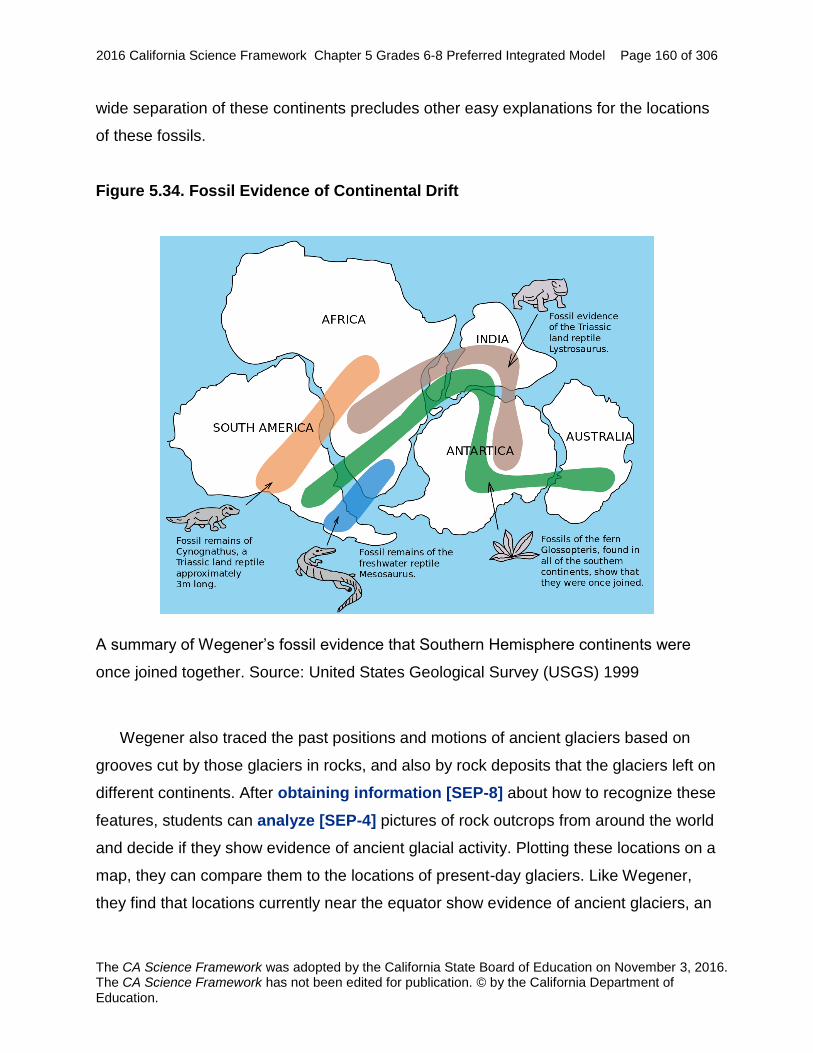
2016 California Science Framework Chapter 5 Grades 6-8 Preferred Integrated Model Page 160 of 306
The CA Science Framework was adopted by the California State Board of Education on November 3, 2016. The CA Science Framework has not been edited for publication. © by the California Department of Education.
wide separation of these continents precludes other easy explanations for the locations
of these fossils.
Figure 5.34. Fossil Evidence of Continental Drift
A summary of Wegener’s fossil evidence that Southern Hemisphere continents were
once joined together. Source: United States Geological Survey (USGS) 1999
Wegener also traced the past positions and motions of ancient glaciers based on
grooves cut by those glaciers in rocks, and also by rock deposits that the glaciers left on
different continents. After obtaining information [SEP-8] about how to recognize these
features, students can analyze [SEP-4] pictures of rock outcrops from around the world
and decide if they show evidence of ancient glacial activity. Plotting these locations on a
map, they can compare them to the locations of present-day glaciers. Like Wegener,
they find that locations currently near the equator show evidence of ancient glaciers, an

2016 California Science Framework Chapter 5 Grades 6-8 Preferred Integrated Model Page 161 of 306
The CA Science Framework was adopted by the California State Board of Education on November 3, 2016. The CA Science Framework has not been edited for publication. © by the California Department of Education.
extremely unlikely situation. If the continents moved as Wegener hypothesized, those
glaciers would have formed much closer to the South Pole.
While we often say that Wegener compiled evidence [SEP-7], it is important to note
that he built on the work of dozens of scientists of the day. At the time Wegener lived,
there was no way to determine the exact age of rocks, but geologists could reconstruct
the relative timing of events by correlating sequences of rock layers from one place to
another (MS-ESS1-4, as discussed in IS4). Even though Wegener never visited the
Andes and the Atlantic coast of South America, other geologists had written that folding
of rock layers in the Andes Mountain occurred at the same time as drifting apart of the
Atlantic Ocean. Wegener obtained and evaluated the information [SEP-8] recorded
by other scientists and then connected ideas in ways that nobody else had.
Despite the evidence [SEP-7] that he compiled, Wegener’s theory was not
accepted and was generally forgotten. While Wegener was using traditional science
practices of analyzing data [SEP-4] and constructing explanations [SEP-6] based
on evidence [SEP-7], the other geologists were viewing his claims through the lens of
the crosscutting concept of “cause and effect: mechanism and prediction [CCC-2].”
Wegener could not propose any possible mechanism that would cause continents to
plow through the ocean over great distances. In the absence of a mechanism to cause
the proposed movements of continents, the early twentieth century geologists rejected
Wegener’s claims. Middle school students focus first on analyzing [SEP-4] the
evidence [SEP-7] accumulated since Wegener’s time that provide even more definitive
evidence that there has been motion of plates (MS-ESS2-3). In high school, they will
look in more detail at some of the evidence and finally address the mechanism that
drives all this motion (HS-ESS2-1, HS-ESS2-3).
Technological developments approximately 50 years later allowed detailed mapping
of the shape of the sea floor, which revealed new information that supported Wegener’s
claims and also provided the missing mechanism. Students can investigate undersea
topography and notice patterns [CCC-1] using a program like Google Earth. They can
discover that the largest mountain ranges on the planet actually exist below the water of
the ocean. One of the most obvious of these is the Mid-Atlantic Ridge, which rises about

2016 California Science Framework Chapter 5 Grades 6-8 Preferred Integrated Model Page 162 of 306
The CA Science Framework was adopted by the California State Board of Education on November 3, 2016. The CA Science Framework has not been edited for publication. © by the California Department of Education.
3 km in height above the ocean floor and has a length of about 10,000 km running from
a few degrees south of the North Pole down almost all the way to the Antarctic Circle.
While basically continuous across a huge part of the planet, it is far from straight. By
tracing out the shape of the continental shelves on either side of the Atlantic and the
axis of the Mid-Atlantic ridge, students can notice the ridge roughly parallels the turns of
the coastlines. By measuring the distance from the center of the mountain range to the
continental shelf, students can notice that the highest point of the mountains lies half
way between the two coastlines, as if the two coasts were spreading apart from this
central point. The idea that oceans were growing in size made it easier to understand
how the continents could move away from each other.
With some ocean basins expanding, it did not make sense for the entire planet to be
growing larger, so scientists began to look at how the growth could be balanced by the
surface appearing to get smaller in other locations. Scientists had long recognized
evidence [SEP-7] for shortening on Earth because of evidence from sedimentary rock
layers. In IS2, students discussed sedimentary rocks that form in flat layers, but these
layers are often observed to be folded and curved, which could only happen by some
sort of squeezing that would push up mountains. At the time Wegener lived, the only
process that scientists could conceive of that could cause such squeezing was the
overall contraction of the Earth as it cooled after being formed long ago. If the seafloor
was known to spread at some locations, it makes sense that plates must crash together
at others. This would explain why mountain ranges formed long bands perpendicular to
the spreading directions. For example, the Andes Mountains are not oriented randomly
– they are at exactly the orientation you would expect if South America was spreading
away uniformly from the Mid-Atlantic Ridge and crashing into the Pacific Ocean on the
other side. Seafloor structures also give one more key piece of evidence [SEP-7] about
plate motions: there are very deep canyons in the ocean that parallel coastlines and
island chains in many locations. Just off the west coast of South America, students can
notice a very deep trench in the ocean floor. A physical model [SEP-2] with two foam
blocks (or even notebooks) representing plates helps illustrate why such a trench forms
where one of the plates sinks down beneath the other due to density. It is just a simple
consequence of the geometry of a bending block, with the trench forming at the

2016 California Science Framework Chapter 5 Grades 6-8 Preferred Integrated Model Page 163 of 306
The CA Science Framework was adopted by the California State Board of Education on November 3, 2016. The CA Science Framework has not been edited for publication. © by the California Department of Education.
inflection point where the block plunging downward starts to curve (figure 5.35).
Students can use maps of global topography and bathymetry to see if they notice any
patterns [CCC-1] between the location of these deep sea trenches and their
relationship to continents, mountain ranges, and islands.
Figure 5.35. Plate Motions Shape Landforms and Seafloor Features
Schematic slice through the Earth’s lithosphere showing three different plates with key
seafloor and land features caused by their motion. Diagram by M. d’Alessio
Taken together, the fit of the continental shelves, the separation of similar rocks and
fossils across vast oceans, the location of mid-ocean ridges running precisely along the
center of oceans basins, the location of deep sea trenches along the coasts of some
continents are strong evidence [SEP-7] that plates move apart at some locations,
together at others, and sliding past one another in other locations. These motions are
the driving forces for a wide range of processes that shape earth’s surface and cause
interactions with the anthrosphere.
Plate Tectonics and Earth Resources
In IS1, students obtained information [SEP-8] about how synthetic materials come
from natural resources (MS-PS1-3). Many of these resources are related to plate
tectonic processes, which means that different parts of the world have access to
different raw materials and different parts of the world are impacted differently by
resource extraction. Students must be able to explain [SEP-6] why certain mineral,
energy, and groundwater resources exist where they do on earth (MS-ESS3-1).
Students can begin by analyzing [SEP-4] maps showing the spatial distribution of

2016 California Science Framework Chapter 5 Grades 6-8 Preferred Integrated Model Page 164 of 306
The CA Science Framework was adopted by the California State Board of Education on November 3, 2016. The CA Science Framework has not been edited for publication. © by the California Department of Education.
different resources on Earth, recognizing patterns [CCC-1], and asking questions
[SEP-1] about what they see. Using computer-based mapping programs, students can
turn on and off different layers to help see how locations of different resources compare
to one another and other geologic features like plate boundaries.
Students might notice that California is home to some of the world’s largest
geothermal power plants, with production in both northern and southern California that
provide a total of six percent of the state’s electricity (with potential for even more).
Other western states also utilize geothermal resources, but there are no geothermal
power plants east of North Dakota in the US. Why? After obtaining information [SEP-
8] about geothermal power, students can construct an explanation [SEP-6] linking
their distribution to plate boundaries. Plate boundaries are often places where hotter
material rises up from Earth’s interior to near the surface. This heat can be harnessed to
generate electricity and as a source of energy [CCC-5] for heating buildings and
commercial purposes.
Copper, gold, and other precious metal resources, however, seem to be located all
over the world and not always related to plate boundaries. Why? Students obtain
information [SEP-8] about how metal ores form and develop a pictorial model [SEP-
2] showing the steps: 1) hot fluids dissolve metals from rocks deep underground; 2) hot
fluids carry the metals until conditions change and the metals solidify in concentrated
zones; 3) plate tectonic forces push the mineral deposits close to the surface where
they can be easily mined; 4) time can pass and plate boundaries can change. Plate
motions are usually involved in the first three stages, but the fourth stage means that
today’s mineral resources can be very far away from today’s plate boundaries.
Fossil fuel distribution is one the most politically important uneven distributions of
energy resources, and it is also tied to plate tectonics. The Middle East has about half of
the world’s proven reserves of crude oil and California has less than 0.2%. Why?
Petroleum and natural gas are generally associated with sedimentary rocks. These
fuels formed from soft-bodied sea organisms whose remains sank to the ocean floor,
decomposed in the relative absence of air, and were further transformed by heat and
pressure deep underground. Even areas on dry land today can be the sites of ancient

2016 California Science Framework Chapter 5 Grades 6-8 Preferred Integrated Model Page 165 of 306
The CA Science Framework was adopted by the California State Board of Education on November 3, 2016. The CA Science Framework has not been edited for publication. © by the California Department of Education.
ocean basins that have been uplifted by plate collisions. These same collisions can
deform the rock layers in ways that allow oil and gas to accumulate in concentrated
locations (where they can be easily extracted) and remain trapped there for millions of
years. Students will investigate this process in high school.
Next students can evaluate the claim [SEP-7], “without plate tectonics, we would
have no groundwater resources.” Students obtain information [SEP-8] about where
groundwater basins are located and how they form. The best groundwater basins are in
valleys where a large amount of sediment has continuously been deposited, such as the
Central Valley receiving sediment from the Sierra Nevada Mountains. Plate motions
typically determine the shapes of these basins and are the cause of mountains being
uplifted in the first place. The faster they are pushed up, the faster they erode (because
rapid uplift produces steep slopes that erode quicker). Of course, groundwater also
requires an abundant source of water. In addition to the important latitudinal controls on
precipitation discussed in grade six, mountains have a strong impact on where
precipitation occurs; moist air flowing up mountains tends to precipitate on the windward
side of the mountains leaving a rain shadow further downwind. The mountains that
“squeeze moisture out” are often recently uplifted by plate motions.
Opportunities for ELA/ELD Connections
As a summarizing activity regarding how the process of plate tectonics influences the
uneven distribution of Earth’s natural resources, students are placed in triads. Each
student explains how Earth’s mineral, energy, or groundwater resources have given
shape to some of Earth’s features. The P-E-E structure (Point, Evidence, and
Explanation) can be used by each student. In the triads, students take turns sharing out
their findings.
CA CCSS ELA/Literacy Standards: WhST.6–8.1, 7; SL.6–8.1
CA ELD Standards: ELD.PI.6–8.3

2016 California Science Framework Chapter 5 Grades 6-8 Preferred Integrated Model Page 166 of 306
The CA Science Framework was adopted by the California State Board of Education on November 3, 2016. The CA Science Framework has not been edited for publication. © by the California Department of Education.
Ecosystem Models
Water and other natural resources provide a strong link with the IS3 life science
ecosystem PEs and DCIs. In IS2, students traced the path of an individual piece of rock
matter and then came to IS3 to discover that there were global patterns [CCC-1] where
certain types of rocks experienced similar paths due to global-scale cycles. Now,
students will extend their models at the molecular and organism scale [CCC-5] from
IS2 up to ecosystems and notice patterns [CCC-1] in the way energy/matter [CCC-5]
are exchanged between components [CCC-4] of the ecosystem.
Students return to the environment diagram of figure 5.26 and develop a system
model [SEP-2] of the ecosystem it depicts. In systems models, students track the flow of
energy and matter between components. Biological systems are complex in that food
delivers both energy and matter in the same package. Biologists use the term biomass
to describe complex carbon molecules that organisms can use as building blocks to
manufacture, replace, and repair their internal structures. The biomass molecules also
have significant stored chemical potential energy that organisms can use to survive and
grow. In the example system model diagram in figure 5.36, a black arrow with a reddish
interior signifies the transfer of that coupled matter and energy through the eating of
food.
Simple black arrows represent transfers of matter that are not biomass, and that
cannot provide calories to organisms. Examples are water, carbon dioxide, and the
simple minerals that decomposers such as microorganisms release to the soil. These
black arrows include respiration of carbon dioxide out of plants and animals back into
the local environment.

2016 California Science Framework Chapter 5 Grades 6-8 Preferred Integrated Model Page 167 of 306
The CA Science Framework was adopted by the California State Board of Education on November 3, 2016. The CA Science Framework has not been edited for publication. © by the California Department of Education.
Figure 5.36. Ecosystem Cycles of Matter and Flows of Energy
A model of the flows of energy and matter into, within and out of a simplified ecosystem.
The wider arrows represent transfers of matter and energy coupled together in biomass.
Diagram by Dr. Art Sussman, courtesy of WestEd.
The red arrows in figure 5.36 identify different flows of energy [CCC-5], with the
straight arrows indicating sunlight and the red centers of the biomass arrows
representing the energy portion of food. The wavy red arrows represent “waste heat”
that escapes and leaves the system due to heat given off during respiration and other
essential chemical reactions in organisms.
A model such as figure 5.36 can become much more complex if the developer of
the model chooses to increase the kinds of flows of matter and energy [CCC-5]
and/or the number and types of organisms that are included. This complexity can pose

2016 California Science Framework Chapter 5 Grades 6-8 Preferred Integrated Model Page 168 of 306
The CA Science Framework was adopted by the California State Board of Education on November 3, 2016. The CA Science Framework has not been edited for publication. © by the California Department of Education.
a problem, but it can also provide great learning opportunities in situations where
productive academic discourse flourishes.
Students should be asking [SEP-1] themselves and their peers about which
features are important to display in the model and why? The CCC of system models
[CCC-4] teaches that, “Models are limited in that they only represent certain aspects of
the system under study.” The students get to choose what features to include, but they
need to provide evidence-based explanations [SEP-6] for why they have included
those features. A necessary part of gaining proficiency in the SEP of developing and
using models [SEP-2] involves learning to wisely choose and omit features in order so
that the model is powerful enough to predict and explain phenomena but not too
complex so as to be overwhelming or dwell on unimportant details.
Taking time to explicitly focus on the meaning of the CCCs helps students
become better scientific thinkers. Ecosystem models provide insight into why the writers
of the NGSS purposely differentiated the phrasing “cycles of energy” and “flows of
matter” in CCC-5. In figure 5.36, many of the energy arrows going into and out of the
system (flow), but the majority of the matter arrows remain within the system (cycle).
This particular model includes two black arrows to indicate that no ecosystem is a
closed system for matter. There are flows of matter, such as carbon dioxide and water
in the air, that move into and out of ecosystems. Human activities can regularly disrupt
the cycles of matter by adding pollution or taking away resources (CA EP&C IV).
With their ecosystem model in place, students can fully utilize it to identify what
happens when one section of an ecosystem changes and there is a scarcity of energy
or matter input. Students can use the model to predict which organisms will be affected
first if, for example there is a sudden decrease in sunlight or if CO2 concentrations
change in the atmosphere. Students can then analyze and interpret [SEP-4] population
data from case studies of ecosystem change (MS-LS2-1) such as the effect of a
prolonged drought on California’s forest ecosystem. How is tree survival and growth
affected and how do these changes affect other organisms throughout the ecosystem?
Students can develop new system models for each case study ecosystem. As they
compare system models for multiple ecosystems, they begin to see and describe

2016 California Science Framework Chapter 5 Grades 6-8 Preferred Integrated Model Page 169 of 306
The CA Science Framework was adopted by the California State Board of Education on November 3, 2016. The CA Science Framework has not been edited for publication. © by the California Department of Education.
patterns [CCC-1] recurring in the relationships between organisms (MS-LS2-2).
Students should be able to identify relationships common to most ecosystems such as:
1) organisms that compete for resources because they both have biomass arrows
originating from the same source; 2) predatory relationships where the biomass from
one animal goes to another; 3) Mutually beneficial relationships where arrows of energy,
mass, or other benefits point in both directions between a pair of organisms. The goal is
that students should be able to use ecosystem models to predict which organisms will
compete if resources become scarce (MS-LS2-2).

2016 California Science Framework Chapter 5 Grades 6-8 Preferred Integrated Model Page 170 of 306
The CA Science Framework was adopted by the California State Board of Education on November 3, 2016. The CA Science Framework has not been edited for publication. © by the California Department of Education.
Integrated Grade Seven Instructional Segment 4: Sustaining Biodiversity and
Ecosystem Services in a Changing World
Integrated Grade Seven – Instructional Segment 4: Sustaining
Biodiversity and Ecosystems Service in a Changing World
Guiding Questions:
What natural processes and human activities threaten biodiversity and
ecosystem services?
How can people help sustain biodiversity and ecosystem services in a
changing world?
Performance Expectations
Students who demonstrate understanding can:
MS-LS2-4. Construct an argument supported by empirical evidence that
changes to physical or biological components of an
ecosystem affect populations. [Clarification Statement:
Emphasis is on recognizing patterns in data and making
warranted inferences about changes in populations, and on
evaluating empirical evidence supporting arguments about
changes to ecosystems.]
MS-LS2-5. Evaluate competing design solutions for maintaining
biodiversity and ecosystem services.* [Clarification Statement:
Examples of ecosystem services could include water purification,
nutrient recycling, and prevention of soil erosion. Examples of
design solution constraints could include scientific, economic, and
social considerations.]
MS-ESS2-2. Construct an explanation based on evidence for how
geoscience processes have changed Earth’s surface at

2016 California Science Framework Chapter 5 Grades 6-8 Preferred Integrated Model Page 171 of 306
The CA Science Framework was adopted by the California State Board of Education on November 3, 2016. The CA Science Framework has not been edited for publication. © by the California Department of Education.
varying time and spatial scales. [Clarification Statement:
Emphasis is on how processes change Earth’s surface at time
and spatial scales that can be large (such as slow plate motions
or the uplift of large mountain ranges) or small (such as rapid
landslides or microscopic geochemical reactions), and how many
geoscience processes (such as earthquakes, volcanoes, and
meteor impacts) usually behave gradually but are punctuated by
catastrophic events. Examples of geoscience processes include
surface weathering and deposition by the movements of water,
ice, and wind. Emphasis is on geoscience processes that shape
local geographic features, where appropriate.]
MS-ESS3-2. Analyze and interpret data on natural hazards to forecast
future catastrophic events and inform the development of
technologies to mitigate their effects. [Clarification Statement:
Emphasis is on how some natural hazards, such as volcanic
eruptions and severe weather, are preceded by phenomena that
allow for reliable predictions, but others, such as earthquakes,
occur suddenly and with no notice, and thus are not yet
predictable. Examples of natural hazards can be taken from
interior processes (such as earthquakes and volcanic eruptions),
surface processes (such as mass wasting and tsunamis), or
severe weather events (such as hurricanes, tornadoes, and
floods). Examples of data can include the locations, magnitudes,
and frequencies of the natural hazards. Examples of technologies
can be global (such as satellite systems to monitor hurricanes or
forest fires) or local (such as building basements in tornado-prone
regions or reservoirs to mitigate droughts).]
MS-PS1-3. Gather and make sense of information to describe that
synthetic materials come from natural resources and impact
society. [Clarification Statement: Emphasis is on natural

2016 California Science Framework Chapter 5 Grades 6-8 Preferred Integrated Model Page 172 of 306
The CA Science Framework was adopted by the California State Board of Education on November 3, 2016. The CA Science Framework has not been edited for publication. © by the California Department of Education.
resources that undergo a chemical process to form the synthetic
material. Examples of new materials could include new medicine,
foods, and alternative fuels.] [Assessment Boundary:
Assessment is limited to qualitative information.] (Assessed after
being introduced in IS1 and IS3.)
MS-ETS1-1. Define the criteria and constraints of a design problem with
sufficient precision to ensure a successful solution, taking
into account relevant scientific principles and potential
impacts on people and the natural environment that may
limit possible solutions.
MS-ETS1-2. Evaluate competing design solutions using a systematic
process to determine how well they meet the criteria and
constraints of the problem.
*The performance expectations marked with an asterisk integrate traditional science
content with engineering through a practice or Disciplinary Core Idea.
The bundle of performance expectations above focuses on the following
elements from the NRC document A Framework for K–12 Science Education:
Highlighted
Science and
Engineering Practices
[SEP-1] Asking
Questions and
Defining Problems
[SEP-2] Developing
Highlighted
Disciplinary Core Ideas
LS2.C Ecosystem
Dynamics, Functioning
and Resilience
LS4.D Biodiversity and
Highlighted
Crosscutting Concepts
[CCC-2] Cause and
Effect
[CCC-4] System and
System Models

2016 California Science Framework Chapter 5 Grades 6-8 Preferred Integrated Model Page 173 of 306
The CA Science Framework was adopted by the California State Board of Education on November 3, 2016. The CA Science Framework has not been edited for publication. © by the California Department of Education.
and Using Models
[SEP-3] Planning and
Carrying Out
Investigations
Humans
ESS2.A Earth Materials
and Systems
ESS2.C Roles of Water
in Earth’s Surface
Processes
ESS3.A Natural
Resources
ESS3.B Natural
Hazards
PS1.B: Structure and
Properties of Matter
ETS1.A: Defining and
Delimiting Engineering
Problems
ETS1.B: Developing
Possible Solutions
[CCC-5] Energy and
Matter: Flows, Cycles,
and Conservation

2016 California Science Framework Chapter 5 Grades 6-8 Preferred Integrated Model Page 174 of 306
The CA Science Framework was adopted by the California State Board of Education on November 3, 2016. The CA Science Framework has not been edited for publication. © by the California Department of Education.
Highlighted California Environmental Principles & Concepts:
Principle I The continuation and health of individual human lives and of human
communities and societies depend on the health of the natural
systems that provide essential goods and ecosystem services.
Principle II The long-term functioning and health of terrestrial, freshwater,
coastal and marine ecosystems are influenced by their
relationships with human societies.
Principle III Natural systems proceed through cycles that humans depend
upon, benefit from and can alter.
Principle IV The exchange of matter between natural systems and human
societies affects the long term functioning of both.
Principle V Decisions affecting resources and natural systems are complex and
involve many factors.
CA CCSS Math Connections: MP.2, MP.4, 6.EE.6, 6.RP.3, 7.EE.4
CA ELD Connections: ELD.PI.6.1,5,6 a-b, 9,10,11a
CA CCSSELA/Literacy Connections: RI.7.8, RST.6-8.1,7,8, WHST.6-8.1,2,9,
SL.7.5,
Erosion is a part of everyday life in ecosystems, and plant root systems have
evolved to help keep plants stable and soil in place. Every so often, erosion events
become dramatic in the form of landslides. And even more rarely, a single event can
trigger thousands of landslides at once. That was the case in 1994 during the
Northridge Earthquake when the shaking triggered 11,000 simultaneous landslides in
the mountains of southern California (USGS 1995), each one tearing up root systems
and completely transforming both the shape of the landscape and the life on it. These
mega-landslide events are the anchoring phenomenon for this IS, and they do not just

2016 California Science Framework Chapter 5 Grades 6-8 Preferred Integrated Model Page 175 of 306
The CA Science Framework was adopted by the California State Board of Education on November 3, 2016. The CA Science Framework has not been edited for publication. © by the California Department of Education.
happen during earthquakes. Over just three days in 1982, heavy rains triggered more
than 18,000 landslides in the San Francisco Bay Area (USGS 1988) and landslides
following wildfire are a constant concern throughout the state. After students obtain
information [SEP-8] about these mega landslide events, they can ask questions
[SEP-1] about the factors that cause [CCC-2] landslides and how they affect the
environment.
Students can examine case studies of smaller landslides, rock falls, and mud flows.
While standard textbooks spend quite a bit of time discussing types of landslides, that
terminology is not the focus. Instead, the emphasis is on process. What patterns do
students recognize in the locations where landslides hit? They should be able to identify
steep slopes, weakness of material, and often (but not always) some sort of triggering
mechanism. As a preview for MS-PS2-2 in grade eight, students can review the core
idea that multiple forces act on stationary objects, and those objects start moving when
forces are no longer balanced (PS2.A, 3-PS2-1). Students can treat the block of soil or
rock as a single object (the ‘landslide mass’) and identify the forces acting on it including
gravity and some sort of friction or cohesion that keeps it in place. Students can use this
information to begin to build a pictorial model [SEP-2] of what causes [CCC-2]
landslides that will allow them to predict when and where landslides will occur. Students
can also create physical models [SEP-2] of the situation by placing blocks on ramps
and changing the angle. If they shake the ramp simulating an earthquake or add mass
to the upslope side of the block, they add to the forces driving the block downslope;
finding some way to lubricate the ramp reduces the force restraining the block. The
added mass of rainwater and the construction of a large building are real life examples
of adding mass to a slide block. Rainwater percolating into pores can ‘lubricate’
landslides, but far more common ways of reducing resisting forces are when material on
the downhill side of a landslide block gets eroded away by rivers or cut away by people
building roads or buildings. Students can use their physical model to consider general
approaches that people can use to reduce landslide hazard. What would a plant root do
to this situation? Vegetation predominantly reduces landslide hazard because roots
spread through the soil like an anchored netting, but roots also have a competing effect
where they weaken material by breaking rocks apart. In some situations, the latter may

2016 California Science Framework Chapter 5 Grades 6-8 Preferred Integrated Model Page 176 of 306
The CA Science Framework was adopted by the California State Board of Education on November 3, 2016. The CA Science Framework has not been edited for publication. © by the California Department of Education.
become more important than the former. Students have to struggle with this apparent
contradiction and add both processes into their model of landslides.
The clarification statement for MS-ESS2-2 emphasizes one of the key ESS DCIs for
middle school that geologic processes can cause change that is slow, rapid, or
combinations of both. Like all natural hazards, landslides happen infrequently, vary in
size, and are caused by specific physical conditions that allow us to forecast where they
will occur (ESS3.B). Smaller landslides are more common just like small earthquakes or
smaller storms occur more frequently than destructive earthquakes and hurricanes.
Since the magnitudes of hazards are important, students can look at landslides through
the lens of scale, proportion, and quantity [CCC-3] and ask other interesting
questions. For example, which form of erosion is more ‘important’ in a landscape, the
slow and steady wearing away of material or the sudden catastrophic movement of
large landslides? Students can analyze data [SEP-4] about the amount of material
eroded by each process from actual scientific observations (Swanson, Fredriksen, and
McCorison 1982; Pearce and Watson 1986) or computer simulations (figure 5.37).

2016 California Science Framework Chapter 5 Grades 6-8 Preferred Integrated Model Page 177 of 306
The CA Science Framework was adopted by the California State Board of Education on November 3, 2016. The CA Science Framework has not been edited for publication. © by the California Department of Education.
Figure 5.37. Landslides and Slow Processes Both Contribute to Erosion
In a computer simulation of a watershed, scientists recorded how much sediment
moved by slow and steady processes like soil creep and how much by rapid and
infrequent landslides over 8,000 years. Which process caused more erosion in this
simulation? Does the simulated watershed have hills or is it mostly flat? Source: M.
d’Alessio using simulation results of Benda and Dunne 1997.
Engineering connection: Landslide Early Warning System
With this model of landslide causes, students consider a small region, predict where the
landslide hazards are greatest, and design a warning system to minimize their damage
(MS-ESS3-2). Using computer-based map layers (such as in Google Earth) showing
slope steepness, rock strength, annual rainfall, and/or expected ground shaking in an

2016 California Science Framework Chapter 5 Grades 6-8 Preferred Integrated Model Page 178 of 306
The CA Science Framework was adopted by the California State Board of Education on November 3, 2016. The CA Science Framework has not been edited for publication. © by the California Department of Education.
earthquake, students can identify areas that are most likely to slide. They can compare
their predictions to published maps of landslide hazard for California or the locations of
actual catastrophic landslides in 1982 or 1994 (USGS 1988, 1995). Students could use
this information to design [SEP-6] a landslide warning system that works in conjunction
with the National Weather Service weather forecasts (such a system actually exists,
http://landslides.usgs.gov/hazards/warningsys.php). Students need to define the
problem [SEP-1] by figuring out what information could minimize loss of life in
landslides and how to get the information to the community (MS-ETS1-1).
Landslides cause major disruption to ecosystems. They can temporarily dam rivers,
uproot vegetation, bury habitat, and increase the sediment in rivers so much that
aquatic life ‘chokes.’ Students can examine case studies of the effects of landslides on
steelhead trout populations, including short-term concerns about the spawning habitat
of local salmon (Cornwell 2014; Ruggerone 2008) or a landslide that blocked a river for
hundreds of years and forced a major genetic shift in two populations of steelhead
(American Geophysical Union 2011; Mackey, Roering, and Lamb 2011). On the land
itself, landslides create a sudden availability of new resources in the ecosystem (such
as space, sunlight, and broken up soil). Students can predict what they think will happen
in the ecosystem and then obtain information about how the succession of vegetation
following major ecosystem disruptions like landslides, fires, or volcanic eruptions
(Ecosystem change following the 1980 Mt. St. Helens volcanic eruption is particularly
well studied). Students should use these examples as evidence to construct an
argument [SEP-7] that changes to physical or biological components of an ecosystem
affect populations of organisms within that ecosystem (MS-LS2-4).

2016 California Science Framework Chapter 5 Grades 6-8 Preferred Integrated Model Page 179 of 306
The CA Science Framework was adopted by the California State Board of Education on November 3, 2016. The CA Science Framework has not been edited for publication. © by the California Department of Education.
Human-Induced Changes to Ecosystems
Sometimes the major changes to ecosystem components are not caused by
natural hazards, but by humans who now impact the environment at the scale of the
planet as a whole. Students in Integrated grade six analyze evidence that human
activities, especially combustion of fossil fuels, have caused global temperatures to
increase over the past century. Students in Integrated grade eight explore the
impacts of increasing human populations and increasing per capita consumption of
resources.
Designing and testing solutions to these kinds of environmental challenges
require a different kind of engineering design. Students’ prior experiences with
engineering design probably focused on specific devices, such as the calorimeter
highlighted in IS2. At the middle grade level, the challenges can be at a higher level
of generality, and also more strongly connected with personal and societal values.
In challenges involving protecting biodiversity and ecosystem services (MS-LS2-5),
some of the criteria, evaluations and decisions will inevitably be strongly influenced
by ethical, economic and cultural valuations.
California’s Environmental Principles and Concepts (EP&Cs) can provide
guidance in implementing these design challenges. All five of the Environmental
Principles apply to IS4. Students can refer to these general principles and the
specific concepts associated with each principle as part of their analyses,
evaluations and argumentation. Having extensively investigated cycles of matter
[CCC-5] and ecosystem processes, students are primed to apply California’s
EP&Cs. For example, the three Concepts associated with Principle III are:
• Natural systems proceed through cycles and processes that are required for
their functioning
• Human practices depend upon and benefit from the cycles and processes
that operate within natural systems
• Human practices can alter the cycles and processes that operate within
natural systems.

2016 California Science Framework Chapter 5 Grades 6-8 Preferred Integrated Model Page 180 of 306
The CA Science Framework was adopted by the California State Board of Education on November 3, 2016. The CA Science Framework has not been edited for publication. © by the California Department of Education.
The systems [CCC-4] thinking and modeling [SEP-2] embedded within
Integrated grade seven provide a scientific framework evaluating design solutions.
The models students made of energy flow and matter cycles [CCC-5] at the
ecosystem scale apply to planetary scale problems as well with one significant
difference: some matter (e.g., carbon dioxide and water) enters and leaves an
ecosystem, but when considering the planetary scale, matter essentially does not
leave or enter. All of Earth’s ecosystems are linked with each other through their
sharing of the atmosphere and the hydrosphere. Each of the elements that is vital
for life exists on Earth in a closed loop of cyclical changes.
The environmental human impacts that students explore throughout middle
school ultimately relate to the effects of human activities on Earth’s cycles of matter,
flows of energy, and web of life. In some challenges, such as habitat destruction or
introduction of exotic species, the main direct impacts are on the local web of life.
This local web of life is also often impacted by pollution. Essentially all pollution
issues result from activities that contaminate or disrupt Earth’s natural cycles of
matter. In many cases, the pollution includes adding synthetic materials to the
natural system. Even though these materials have been produced from natural
resources and materials, humans altered them by chemical processes such that
some of them can now harm ecosystems, and in turn harm humans (CA EP&Cs I-
IV). As part of the design challenge, students should gather any relevant
information about how synthetic materials have affected the ecosystem and society
(MS-PS1-3).
In this design challenge, students need to identify a specific problem in an
ecosystem (MS-ETS1-1) that considers the relationship between people and the
natural environment. This problem may be based on a large scale investigation like
described in the snapshot below. The goal is to ‘improve’ an ecosystem by reducing
human impacts, and two measures of a healthy ecosystem are biodiversity within
the ecosystem and the richness of services the ecosystem provides to people.
Students should choose some aspect of biodiversity or ecosystem services as
measurable criteria they can track to evaluate the progress of their proposed

2016 California Science Framework Chapter 5 Grades 6-8 Preferred Integrated Model Page 181 of 306
The CA Science Framework was adopted by the California State Board of Education on November 3, 2016. The CA Science Framework has not been edited for publication. © by the California Department of Education.
solutions (MS-LS2-5). Students should be able to use a system model of their
ecosystem to evaluate the relative merits of different solutions (MS-ETS1-2).
Integrated Grade Seven Snapshot 5.5. Planning a Large Scale Investigation
Investigative problem: How can we restore a habitat so that it is less influenced by
human activities?
Motivated by an article they read about kids making a difference, Mr. R’s class
decides to plan a habitat restoration project. Mr. R explained that to be effective with
habitat restoration they needed to learn more about the ecosystems. He asked the
class, “How would we begin a scientific study of our local ecosystems so we learn
enough to work on a restoration?” Students responded that the best way to begin an
investigation was to ask scientific questions [SEP-1]. Students begin writing
questions about local ecosystems at the nature center or that they had experienced in
other ways. Soon the teams had numerous questions to share so they began posting
them on their team flipcharts. While the teams were writing their questions, Mr. R visited
and guided their discussions, as needed.
With all the questions posted, Mr. R asked the students if they noticed any patterns
[CCC-1] among the questions. Several pointed out that some of the questions seemed
to focus on the plants and animals, and others were more focused on things like the
soil, rocks, water, and other parts of the physical surroundings. Mr. R asked the
students to return to their flipcharts and put a big P next to questions that involved
physical components and a big B next those that involved the biological components of
ecosystems. Students must provide examples and reasoning [SEP-7] about how
these different components can affect [CCC-2] the population of organisms (MS-LS2-
4); their reasoning refers to models [SEP-2] of the flow of energy and cycling of
matter [CCC-5] in their ecosystem (MS-LS2-3) and geoscience processes that alter the
physical environment (MS-ESS2-2).
Returning to the students’ concerns about the effect of human activities on the local

2016 California Science Framework Chapter 5 Grades 6-8 Preferred Integrated Model Page 182 of 306
The CA Science Framework was adopted by the California State Board of Education on November 3, 2016. The CA Science Framework has not been edited for publication. © by the California Department of Education.
ecosystems, Mr. R decided to initiate a discussion related to California Environmental
Principle II: The long-term functioning and health of terrestrial, freshwater, coastal and
marine ecosystems are influenced by their relationships with human societies. He
suggested that the teams think about some additional questions that would help them
learn how human activities were affecting the functioning and health of ecosystems.
The class and Mr. R had been talking about the difference between conducting an
investigation that someone else had created compared with planning and conducting
your own investigation [SEP-3]. Students reminded Mr. R about that discussion, and
said they wanted to plan their ecosystem investigation. With student teams standing
near their charts, each team shared one or two of their questions. He mentioned that
the class would have the opportunity to vote on which questions they wanted to
investigate. Mr. R then reminded students to think about the question scaffolding
process they had learned about in their English language arts class, making sure that,
when put all together, their questions and data should help them better understand
populations and biodiversity, the physical and biological components of ecosystems,
and how ecosystems are affected by human activities.
The class continued to discuss which questions would be best and soon realized
that they would need data to compare the disturbed ecosystem they wanted to restore
with a more natural example of that same ecosystem. The students pointed out that this
process would help them plan how their restoration work might mitigate the effects of
human activities at their study sites. Following much discussion, the students selected
five questions for their class investigation, including:
What plants and animals live in the disturbed and undisturbed ecosystem study
sites?
What are the physical and biological components of the two study sites?
What natural processes and ecosystem services in the two study sites support the
ecosystems?
What natural processes and ecosystem services in the two study sites help
humans?

2016 California Science Framework Chapter 5 Grades 6-8 Preferred Integrated Model Page 183 of 306
The CA Science Framework was adopted by the California State Board of Education on November 3, 2016. The CA Science Framework has not been edited for publication. © by the California Department of Education.
What human activities are occurring in the two study sites?
Students realize that both ‘natural’ and a ‘disturbed’ ecosystems are changing, and
hope to be able to document how the rates of natural change [CCC-7] compare to the
rates of human-induced changes (ESS3.C). Mr. R shares these questions with the
volunteers at a local nature center that try to help him prepare the investigation. Mr. R
can’t make the logistics work out this year, but he puts his wheels in motion about how
to set things up for next year. Even if it never works out, Mr. R decides that the activity
of planning the investigation is very worthwhile for his students. He thinks about how to
frame the activity next year so that it feels authentic but so that the students won’t feel
disappointed if they can’t actually implement their project. His goal is to eventually get
students to propose design solutions for their habitat restoration and then evaluate the
different proposals (MS-LS2-5). Their restoration plans would require attentiveness to
the biosphere as well as the other Earth systems.

2016 California Science Framework Chapter 5 Grades 6-8 Preferred Integrated Model Page 184 of 306
The CA Science Framework was adopted by the California State Board of Education on November 3, 2016. The CA Science Framework has not been edited for publication. © by the California Department of Education.
Grade Eight – Preferred Integrated Course Model
This section is meant to be a guide for educators on how to approach the teaching of
the CA NGSS in grade eight according to the Preferred Integrated Learning Progression
model (see the introduction to this chapter for further details regarding different models
for grades six, seven and eight). It is not meant to be an exhaustive list of what can be
taught or how it should be taught.
A primary goal of this section is to provide an example of how to bundle the PEs into
integrated groups that can effectively guide instruction in four sequential IS. There is no
prescription regarding the relative amount of time to be spent on each IS. As shown in
figure 5.38, the overarching guiding concept for the entire year is, “The processes that
change Earth’s systems at different spatial scales today also caused changes in the
past.”

2016 California Science Framework Chapter 5 Grades 6-8 Preferred Integrated Model Page 185 of 306
The CA Science Framework was adopted by the California State Board of Education on November 3, 2016. The CA Science Framework has not been edited for publication. © by the California Department of Education.
Figure 5.38. Grade Eight Integrated Storyline
Guiding Concept: The processes that change Earth’s systems at different spatial scales today also caused changes in
the past.
IS
Life Science Earth & Space
Sciences Physical Science
Engineering, Technology, and Applications to
Science
1
Objects move and collide.
Source: Ninjatacoshell 2009
Living systems are affected by physical changes in the environment. Both the physical and biological changes are recorded in the fossil record.
The fossil record documents the existence, diversity, extinction, and change of life forms throughout Earth’s history.
Newton’s Laws explain the forces and motions of objects on Earth and in space. Velocity and mass determine the results of collisions between objects.
Design Criteria Evaluate Solutions Analyze data Iteratively test and modify
2
Noncontact forces influence phenomena locally and in the solar system
Source: Gemini Observatory 2008
Models explain lunar phases and eclipses of the Sun and Moon. Gravity plays the major role in determining motions with the solar system and galaxies.
Gravitational and electromagnetic fields are the basis of noncontact forces. Changing the arrangement of objects in a system affects the potential energy stored in that system.

2016 California Science Framework Chapter 5 Grades 6-8 Preferred Integrated Model Page 186 of 306
The CA Science Framework was adopted by the California State Board of Education on November 3, 2016. The CA Science Framework has not been edited for publication. © by the California Department of Education.
3
Evolution explains life’s unity and diversity. Source: Adapted from Tkgd2007 2008
Mutations in genes affect organisms’ structures and functions. Evidence from fossils, anatomy, and embryos support the theory of biological evolution. Natural selection is the main mechanism that leads to evolution of species that are adapted to their environment.
Rock layers record Earth’s history like pages in a book.
Chemical reactions make new substances. Mass is conserved in physical changes and chemical reactions.
4
Human activities help sustain biodiversity and ecosystem services in a changing world.
Source: Environmental Management 2016 Wiki 2016
Changes to environments can affect probabilities of survival and reproduction of individual organisms, which can result in significant changes to populations and species.
Annual cycles in the amount of sunlight absorbed cause Earth’s seasons. Increases in human population and per-capita consumption impact Earth’s systems.
Waves are reflected, absorbed, or transmitted through various materials. Wave-based digital technologies provide very reliable ways to encode and transmit information.
Design criteria Evaluate solutions

2016 California Science Framework Chapter 5 Grades 6-8 Preferred Integrated Model Page 187 of 306
The CA Science Framework was adopted by the California State Board of Education on November 3, 2016. The CA Science Framework has not been edited for publication. © by the California Department of Education.
A primary goal of this section is to provide an example of how to bundle the PEs into
four sequential instructional segments. There is no prescription regarding the relative
amount of time to be spent on each IS.
Integration within each IS and sequentially across the year flows most naturally with
the science concepts in Integrated Grade Eight. Integrated Grade Eight is somewhat
less amenable to complete integration, but the concept of systems and system models
plays a very strong role in connecting within and across grade eight instructional
segments.
Each grade eight IS tells a coherent story that generally includes two or more
science disciplines that meaningfully connect with each other within that IS (figure 5.38).
Earth and Space Science content provides the conceptual “glue” by separately linking
with physical science (solar system, orbital motions, and asteroid collisions) and with life
science (human impacts on biodiversity and geologic time scale via fossils in rock
strata). IS1 and IS4 also feature engineering design intimately connected with the IS
science concepts.
Perhaps the most important perspective with respect to Integrated Grade Eight is
that it serves as a capstone for the middle school grade span. The vignette in IS4
provides one example of integrating across the entire year and connecting back to
earlier grade levels. Many of the key concepts that have been flowing, cycling, and
building in complexity in the lower grades come together to explain awesome
phenomena such as the unity and diversity of Earth’s life, how humans impact and can
sustain biodiversity, and the beautiful dances within the solar system. These
phenomena are happening within a scale of existence that extends from
submicroscopic atoms to clusters of galaxies. These phenomena also occur across a
scale of time that extends from instants of collisions to billions of years of stability and
change. All this grandeur and wonder would be unknown to us without the powerful
SEPs and unifying concepts that students experience and apply in CA NGSS middle
grades science.

2016 California Science Framework Chapter 5 Grades 6-8 Preferred Integrated Model Page 188 of 306
The CA Science Framework was adopted by the California State Board of Education on November 3, 2016. The CA Science Framework has not been edited for publication. © by the California Department of Education.
Integrated Grade Eight Instructional Segment 1: Objects Move and Collide
Integrated Grade Eight – Instructional Segment 1: Objects Move and
Collide
Guiding Questions:
What are forces and how do they affect the motions of objects?
Do objects always need a force in order to keep moving?
What happens when a moving object collides with something?
How do fossils provide evidence of an ancient collision that wiped out
the dinosaurs?
Performance Expectations
Students who demonstrate understanding can:
MS-LS4-1. Analyze and interpret data for patterns in the fossil record that
document the existence, diversity, extinction, and change of
life forms throughout the history of life on Earth under the
assumption that natural laws operate today as in the past.
[Clarification Statement: Emphasis is on finding patterns of
changes in the level of complexity of anatomical structures in
organisms and the chronological order of fossil appearance in the
rock layers.] [Assessment Boundary: Assessment does not
include the names of individual species or geological eras in the
fossil record.]
MS-PS2-1. Apply Newton’s Third Law to design a solution to a problem
involving the motion of two colliding objects.* [Clarification
Statement: Examples of practical problems could include the
impact of collisions between two cars, between a car and
stationary objects, and between a meteor and a space vehicle.]
[Assessment Boundary: Assessment is limited to vertical or

2016 California Science Framework Chapter 5 Grades 6-8 Preferred Integrated Model Page 189 of 306
The CA Science Framework was adopted by the California State Board of Education on November 3, 2016. The CA Science Framework has not been edited for publication. © by the California Department of Education.
horizontal interactions in one dimension.]
MS-PS2-2. Plan an investigation to provide evidence that the change in
an object’s motion depends on the sum of the forces on the
object and the mass of the object. [Clarification Statement:
Emphasis is on balanced (Newton’s First Law) and unbalanced
forces in a system, qualitative comparisons of forces, mass and
changes in motion (Newton’s Second Law), frame of reference,
and specification of units.] [Assessment Boundary: Assessment is
limited to forces and changes in motion in one-dimension in an
inertial reference frame and to change in one variable at a time.
Assessment does not include the use of trigonometry.]
MS-PS3-1. Construct and interpret graphical displays of data to describe
the relationships of kinetic energy to the mass of an object
and to the speed of an object. [Clarification Statement:
Emphasis is on descriptive relationships between kinetic energy
and mass separately from kinetic energy and speed. Examples
could include riding a bicycle at different speeds, rolling different
sizes of rocks downhill, and getting hit by a wiffle ball versus a
tennis ball.]
MS-ETS1-1. Define the criteria and constraints of a design problem with
sufficient precision to ensure a successful solution, taking
into account relevant scientific principles and potential
impacts on people and the natural environment that may
limit possible solutions.
MS-ETS1-2. Evaluate competing design solutions using a systematic
process to determine how well they meet the criteria and
constraints of the problem.
MS-ETS1-3. Analyze data from tests to determine similarities and
differences among several design solutions to identify the

2016 California Science Framework Chapter 5 Grades 6-8 Preferred Integrated Model Page 190 of 306
The CA Science Framework was adopted by the California State Board of Education on November 3, 2016. The CA Science Framework has not been edited for publication. © by the California Department of Education.
best characteristics of each that can be combined into a new
solution to better meet the criteria for success.
MS-ETS1-4. Develop a model to generate data for iterative testing and
modification of a proposed object, tool, or process such that
an optimal design can be achieved.
*The performance expectations marked with an asterisk integrate traditional science
content with engineering through a practice or Disciplinary Core Idea.
The bundle of performance expectations above focuses on the following
elements from the NRC document A Framework for K–12 Science Education:
Highlighted
Science and
Engineering Practices
[SEP-1] Asking
Questions and
Defining Problems
[SEP-2] Developing
and Using Models
[SEP-3] Planning and
Carrying Out
Investigations
[SEP-4] Analyzing and
Highlighted
Disciplinary Core Ideas
LS4.A Evidence of
Common Ancestry and
Diversity
PS2.A Forces and
Motion
PS2.B Types of
Interactions
Highlighted
Crosscutting Concepts
[CCC-1] Patterns
[CCC-2] Cause and
Effect
[CCC-4] System and
System Models
[CCC-5] Energy and

2016 California Science Framework Chapter 5 Grades 6-8 Preferred Integrated Model Page 191 of 306
The CA Science Framework was adopted by the California State Board of Education on November 3, 2016. The CA Science Framework has not been edited for publication. © by the California Department of Education.
Interpreting Data
[SEP-6] Constructing
Explanations (for
science) and
Designing Solutions
(for engineering)
[SEP-7] Engaging in
Argument from
Evidence
[SEP-8] Obtaining,
Evaluating, and
Communicating
Information
PS3.A Definitions of
Energy
ETS1.A Defining and
Delimiting Engineering
Problems
ETS1.B Developing
Possible Solutions
ETS1.C Optimizing the
Design Solution
Matter: Flows, Cycles,
and Conservation
Highlighted California Environmental Principles & Concepts:
Principle II The long-term functioning and health of terrestrial, freshwater,
coastal and marine ecosystems are influenced by their
relationships with human societies.
Principle V Decisions affecting resources and natural systems are complex and
involve many factors.
CA CCSS Math Connections: 6.EE.2,6, 6.NS.5, 6.RP.1,2, 7.EE.3,4, 7.RP.2,
7.SP.7, 8.EE.1,2, MP.2,
CA ELD Connections: ELD.PI.6.1,5,6 a-b, 9,10,11a
CA CCSSELA/Literacy Connections: RST.6-8.1,3,7,9, WHST.6-8.7,8,9,
SL.8.5,
2016 California Science Framework Chapter 5 Grades 6-8 Preferred Integrated Model Page 192 of 306
The CA Science Framework was adopted by the California State Board of Education on November 3, 2016. The CA Science Framework has not been edited for publication. © by the California Department of Education.
Grade eight begins with a year-long mystery on planet Earth about what causes the
mass extinctions and species diversification events that happen repeatedly in Earth’s
history. At first, this phenomenon does not appear to match the title of the IS, but
understanding this phenomena requires that students understand many different
aspects of science, including the physics of impacts and collisions. Students know that
some types of organisms that lived in the past no longer live on Earth (LS4.A from
grade three), but how often does this happen and what causes these changes?
Scientists have compiled databases of every type of fossil ever discovered and how
long ago those organisms live. These databases include millions of fossils found in
layers of rock deposited at thousands of sites around the world. By summarizing the
data, scientists can create a single graph depicting a story of how life has diversified
and gone extinct over time (figure 5.39). As students analyze and interpret [SEP-4] the
graph, they notice a general trend as well as ask questions [SEP-1] about what
causes the individual ups and downs. Each sudden drop on the graph represents a
mass extinction event, so why are there so many of them and what causes [CCC-2]
them?

2016 California Science Framework Chapter 5 Grades 6-8 Preferred Integrated Model Page 193 of 306
The CA Science Framework was adopted by the California State Board of Education on November 3, 2016. The CA Science Framework has not been edited for publication. © by the California Department of Education.
Figure 5.39. Number of Types of Marine Animals from the Last 542 Million Years
The boundaries between geologic periods that scientists have agreed upon (bottom) are
often based on major extinction or diversification events when the number of genera
changes quickly. Source: M. d’Alessio with data from Rohde and Muller 2005.
Students brainstorm possible causes of extinction events. Even if students ‘know’
what caused the extinction of the dinosaurs from their prior knowledge, are all extinction
events all caused by the same process? Students are assigned to different possible
explanations and receive ‘clue cards’ with evidence that supports their assigned
mechanism and students use the evidence to construct an argument. Students must
ask questions [SEP-1] that probe and test this explanation further and then receive
additional clue cards and revise their argument accordingly. While scientists have been
weighing this evidence for decades, grade eight students can see that evidence exists

2016 California Science Framework Chapter 5 Grades 6-8 Preferred Integrated Model Page 194 of 306
The CA Science Framework was adopted by the California State Board of Education on November 3, 2016. The CA Science Framework has not been edited for publication. © by the California Department of Education.
to supports many competing ideas (figure 5.40) and leads to viable arguments that
could explain each extinction event and there is still disagreement even about the best
studied and most recent event that wiped out the dinosaurs (Keller 2011).
Figure 5.40. The Timing of Major Extinction Events and Possible Causes
Note that the time on the vertical axis is not at a uniform scale because of the data set
used to make this figure. Each bar in the extinction intensity data set corresponds to
rocks deposited during a different sub stage of geologic time. These sub stages were
decided before techniques for determining the absolute age of a rock had been
developed. At that time, scientists divided geologic time into different time periods
based on the systematic changes they observed in the layers of rocks and fossils
contained in those layers. Scientists continue to refer to these geologic time periods
even though they can now describe geologic time in absolute terms (i.e., millions of
years ago). Source: Modified from Keller 2011.
One likely mechanism that explains some mass extinctions is the impact of a large
asteroid that causes a major disruption to Earth’s climate. To motivate students and

2016 California Science Framework Chapter 5 Grades 6-8 Preferred Integrated Model Page 195 of 306
The CA Science Framework was adopted by the California State Board of Education on November 3, 2016. The CA Science Framework has not been edited for publication. © by the California Department of Education.
provide context, students can obtain information about the specific impacts of the
Chicxulub crater that might be responsible for the extinction of the dinosaurs. In addition
to introducing one of the year’s major topics (the history of life on Earth), this anchoring
phenomenon of an asteroid impact also leads into many key concepts related to forces,
motion and gravity. How does science describe and explain [SEP-6] the motions of
objects such as an asteroid or our planet? How big an asteroid would be needed to
cause an extinction? What effects would such an impact have? How can we investigate
phenomena related to motions and collisions? These questions mark the transition to a
section of the IS that focuses on PS DCIs.
Motions and collisions provide many engaging ways for learners to design
experiments [SEP-6], manipulate variables, and collect useful data [SEP-8] over the
course of a single or multiple succeeding class periods. Few topics in other science
disciplines provide this abundance of laboratory experiences that ignite enthusiasm and
quickly provide meaningful data.
Every day we push or pull many things. An object begins to move after we exert a
force on it, and then it stops moving shortly after we stop pushing or pulling it. We
conclude that forces cause temporary motions in objects. In complete contrast,
Newton’s First Law of Motion teaches that a force can cause [CCC-2] an object to
move, and that the object should keep moving at exactly the same speed until another
force slows it down, speeds it up, or causes it to change direction. As illustrated in the
snapshot below, students need to investigate [SEP-3], model [SEP-2] and analyze
observations [SEP-4] of many phenomena in order to develop an understanding of the
ways in which objects move in scientifically accurate ways, and to correctly use motion
concepts to explain the cause and effect [CCC-2] relationships that result in observed
phenomena.
Integrated Grade Eight Snapshot 5.6. Learning About Motion
After having engaged students in the ESS phenomena of an asteroid impact and
asking questions about the speed of the impactor, Ms. Z focuses on the PS DCIs about

2016 California Science Framework Chapter 5 Grades 6-8 Preferred Integrated Model Page 196 of 306
The CA Science Framework was adopted by the California State Board of Education on November 3, 2016. The CA Science Framework has not been edited for publication. © by the California Department of Education.
motion. Ms. Z’s students just finished activities where they described motion in terms of
speed. She decides to use free Forces and Motion education animations (see
https://phet.colorado.edu/en/simulation/forces-and-motion-basics) to transition from a
focus on constant velocity to acceleration.
Anchoring phenomenon: A toy car doesn’t move unless you push on it.
Sometimes, even a mundane observation can lead to great insight. She begins by
showing students a toy car and asking them to explain in words why the car is not
moving. Some students have good ideas, but many struggle to find the right words to
express the answer to this seemingly obvious question. She connects to students’
investigations from grade three with balanced forces (3-PS2-1). Using an example of a
toy car, she writes up the statement on the board, “When the total force on an object is
zero its motion does not change at that instant” (Newton’s first law). She asks students
why she emphasizes the phrase, “at that instant.”
Investigative Phenomenon: (Students explore various phenomena related to the
cases in each computer simulation).
Having established some background, she instructs the students to work individually
or with a partner to explore their assigned animation, such that one-third of the class
explores one of the three animations (Motion; Friction; Acceleration). They record in
their notebooks what they do, any conclusions they reach, and any questions the
animation raises.
In the succeeding days, class sessions focus on the animations in the order of
Motion, then Friction, and finally Acceleration. As the students present, they or Ms. Z
use the projector to manipulate the animation to support and extend what the students
recorded in their notebooks. After reviewing the three animations as a whole class, the
students collaboratively agree on specific questions or concepts to explore further within
the animations, such as analyzing data [SEP-4] about the effects [CCC-2] of mass
and velocity on acceleration. These investigations and subsequent analyses [SEP-4]
result in a consensus statement of Newton’s Second Law, “When the total force on an

2016 California Science Framework Chapter 5 Grades 6-8 Preferred Integrated Model Page 197 of 306
The CA Science Framework was adopted by the California State Board of Education on November 3, 2016. The CA Science Framework has not been edited for publication. © by the California Department of Education.
object is not zero, its motion changes with an acceleration in the direction of the total
force at that instant.”
Students are surprised that the scientific meaning of the term “acceleration” includes
speeding up, slowing down or changing direction. Some of the students enjoy telling
people that vehicles actually have three accelerators: the gas pedal, the brake and the
steering wheel.
Resources
The physical science narrative in this snapshot and IS uses materials from Daehler,
Shinohara, and Folsom 2011b.
The word “motion” in the CA NGSS implies both the object's speed and its direction
of travel. The assessment boundaries of PEs for eighth grade state that students will
only be assessed on forces that are aligned, and deal with changes in speed that occur
when the net force is aligned to the motion (i.e., only one-dimensional motion).
Speed is a ratio of distance divided by time. Students can investigate [SEP-3]
speed by conducting experiments where they measure both distance and time. Manual
measurements of time in tabletop experiments using stopwatches are prone to large
error, so there are several alternatives: students can pool multiple measurements using
collaborative online spreadsheets and take the average, use an app to calculate speed
from video clips (such as Tracker at https://www.cabrillo.edu/~dbrown/tracker/), use a
motion sensor probe, or use computer simulations.
From a mathematics point of view, speed is the ratio of two very disparate quantities
(distance such as meters and time such as seconds). Speed itself, the ratio, is also
qualitatively different from the distance component and from the time component. This
situation is typical in science where ratios are used in specific contexts to analyze
phenomena. In order for these science ratios to make sense, students need to specify
the units of measure for each component of the ratio and also of the resulting number,

2016 California Science Framework Chapter 5 Grades 6-8 Preferred Integrated Model Page 198 of 306
The CA Science Framework was adopted by the California State Board of Education on November 3, 2016. The CA Science Framework has not been edited for publication. © by the California Department of Education.
such as a speed or a density. This situation is very different from learning about ratios
as an abstract relationship of two numbers that do not have units associated with them.
Students often harbor the preconception that a moving object will naturally stop
rather than keep moving. If you kick a soccer ball, it will roll along the ground, slow
down and then stop. From a force point of view, the kick initiated the ball’s movement
and then friction, a very different force, opposed that movement. It requires a lot of
experimentation and discussion before students internalize the understanding that
without an opposing force, the ball would actually keep moving forever at the same
speed in the same direction. Even after extended investigations and discussions,
students can still retain preconceptions such as that the initiating force somehow
remains associated with the moving object and keeps propelling it. Modeling the forces
at different instants of time (before, during and after motion) can help address this kind
of preconception. Another very powerful way to deepen understanding of motion is to
provide an energy [CCC-5] perspective in addition to the force perspective.
The energy [CCC-5] perspective can help students understand why objects slow
down. The kick transferred kinetic energy from the foot to the soccer ball. If no
interactions remove kinetic energy from the soccer ball, it makes sense that the ball will
keep moving at the same speed in the same direction. The interaction with the ground
transfers some of that kinetic energy to the ground (the grass moves and also becomes
a little warmer because of being rubbed by the ball). Since the soccer ball has lost some
of its kinetic energy to the grass and the air surrounding, it naturally slows down and
eventually stops.
Students can create a diagrammatic model [SEP-2] of the flow of energy [CCC-5]
within systems [CCC-4] as shown in figure 5.41. This simple diagram of a collision is a
model because it includes components (an energy source and receiver), an
understanding of the way these objects will interact based on the laws of physics
(energy is conserved, with one object decreasing in energy that is transferred to the
other object), and it can be used to predict the behavior of the system [CCC-4] (the
object that decreases in kinetic energy slows down while the object that increases in

2016 California Science Framework Chapter 5 Grades 6-8 Preferred Integrated Model Page 199 of 306
The CA Science Framework was adopted by the California State Board of Education on November 3, 2016. The CA Science Framework has not been edited for publication. © by the California Department of Education.
kinetic energy should speed up). Students can use these types of diagrammatic models
to illustrate transfers of energy.
Figure 5.41. Energy Transfer in a Collision
Model of energy flow within a system during a collision. Diagram by M. d’Alessio.
The force of friction is an interaction in which energy [CCC-5] is transferred.
Students must plan investigations [SEP-3] to explore the effects [CCC-2] of balanced
and unbalanced forces on the motion of objects (MS-PS2-2). One such investigation
could involve measuring the velocity of model cars with different amounts of friction by
attaching sticky notes to the front and sides of the car to vary the amount of friction.
Students should notice that when they push the car, they apply a force in one direction
(figure 5.42) while friction is a force working in the opposite direction. The overall
change in motion (and therefore change in energy) depends on the total sum of these
forces. Using an energy source/receiver diagram to model the situation helps draw
attention to the fact that some of the energy must go somewhere. The car clearly
decreases in energy but that means another component of the system [CCC-4] must
increase in energy.

2016 California Science Framework Chapter 5 Grades 6-8 Preferred Integrated Model Page 200 of 306
The CA Science Framework was adopted by the California State Board of Education on November 3, 2016. The CA Science Framework has not been edited for publication. © by the California Department of Education.
Figure 5.42. Energy Transfer with Friction
Model of energy flow including friction within an experimental system of a tabletop car.
Diagram by M. d’Alessio.
With some simple analogies such as friction of hands rubbing together, students can
conclude that the energy is likely converted into thermal energy. When rubbing hands
together, both hands warm up even if one hand remains stationary during the rubbing.
This observation gives rise to two related modifications to the previous simpler energy
source/receiver diagram: (1) there can be multiple energy receivers in a system [CCC-
4] from a single energy source; and (2) an object (e.g., the car) can be both the source
and the receiver of energy if that energy converts from one form (kinetic energy) to
another form (thermal energy).
During an interaction when a force acts on an object, that object will gain kinetic
energy. How much will the object's motion change during this interaction? Students
asked similar questions [SEP-1] in fourth grade (4-PS3-3), and now they will begin to
answer them. The answer depends strongly on the target object's mass. This principle
becomes easily apparent in collisions. Students can perform investigations [SEP-3] by
colliding the same moving object with target objects of different masses that are
otherwise identical in shape (for example glass versus steel marbles of different sizes,
cars with or without fishing weights attached, etc.). In order to measure consistent

2016 California Science Framework Chapter 5 Grades 6-8 Preferred Integrated Model Page 201 of 306
The CA Science Framework was adopted by the California State Board of Education on November 3, 2016. The CA Science Framework has not been edited for publication. © by the California Department of Education.
patterns [CCC-1], students will need to plan their investigation [SEP-3] (MS-PS2-2)
such that the source object has a consistent speed (by rolling down a ramp of a fixed
distance, for example). This procedure will ensure that the initial kinetic energy is
constant and lead to a consistent force initiating the collision interaction, if all other
factors remain constant. Students can vary the mass of the target object and see how
its speed changes as a result of the impact, plotting the results to look for a consistent
pattern. This graphical representation should lead them towards a discovery of
Newton's Second Law that relates the change in an object's motion (“acceleration”) to
the force applied and the mass of the object. MS-PS2-2 does not require that students
have a mathematical understanding of acceleration. Instead this PE focuses on the
proportional [CCC-3] relationship of motion changes and force.
When the source and target objects have equal masses and collisions transfer all of
the energy [CCC-5] from source to receiver, the speed of the target object should be
similar to the speed of the source object. This phenomenon can be seen clearly in
billiards when the cue ball comes to a complete stop after hitting another ball.
Observations such as these provide evidence to make the argument [SEP-7] that as
one object loses kinetic energy during the collision, another object must gain energy,
and vice-versa (revisiting MS-PS3-5 from Integrated Grade Six).
In each trial collision so far, the amount of energy [CCC-5] transferred to the target
object has been held constant. While the amount of energy is constant, changes in the
target object’s mass can change how the energy transfer affects the object’s speed. The
motion of smaller target masses changes more (greater acceleration) than the change
in motion of larger target masses. This kind of inverse relationship (bigger mass
resulting in smaller change) can be confusing for students, so it can help to make that
aspect of Newton’s Second Law very explicit. Students can explore this idea further by
changing the kinetic energy of the source object. In that case, the relationship is direct
rather than inverse. Keeping the target object constant, groups of students can predict
and demonstrate that increasing the mass or the speed of the source object increases
the change in motion of the target object. From the energy perspective, a faster moving
or more massive source object can transfer more kinetic energy to the target object.

2016 California Science Framework Chapter 5 Grades 6-8 Preferred Integrated Model Page 202 of 306
The CA Science Framework was adopted by the California State Board of Education on November 3, 2016. The CA Science Framework has not been edited for publication. © by the California Department of Education.
From the force perspective, a faster moving or more massive source exerts a greater
force on the target object. Animation investigations can complement these tabletop
investigations very nicely, and the dual perspectives of force and energy can help
explain [SEP-6] the results of changing variables within the animations.
Engineering Connection: Collisions
MS-PS2-1 provides a capstone goal for IS1. Students design a solution [SEP-6] to a
problem involving the motion of two colliding objects. The clarification statement for the
PE offers examples of collisions between two cars, between a car and a stationary
object, or between a meteor and a space vehicle. In order for this challenge to extend
deeper into the design process, the suggestion here is to restrict the projects to
situations that students can physically model and obtain data that can be used in
iterative testing and refinement of their design solution.
The classic egg drop could be used but many of the solutions to that problem involve
slowing the falling egg before the collision. The emphasis for the PE is on applying
Newton’s Third Law that objects experience equal and opposite forces during a
collision. For example, a variation where students attach eggs to model cars and design
bumpers will follow naturally from their prior tabletop experiments. At the conclusion of
their testing and refinement, students should be able to use their models of energy
transfer [CCC-5] and kinetic energy to make an argument [SEP-7] about how their
design solution works. Bumpers tend to reduce the effects of collisions by two
processes: (1) they absorb some of the source kinetic energy so that less of it gets
transferred to kinetic energy in the target object and more of it gets converted to thermal

2016 California Science Framework Chapter 5 Grades 6-8 Preferred Integrated Model Page 203 of 306
The CA Science Framework was adopted by the California State Board of Education on November 3, 2016. The CA Science Framework has not been edited for publication. © by the California Department of Education.
energy; and (2) they make the collision last longer, so that the transfer of energy occurs
over a longer time interval.
No matter what type of collisions students investigate [SEP-3], they will need to identify
the constraints that affect their design as well as the criteria for identifying success (MS-
ETS1-1). As student teams evaluate competing design solutions (MS-ETS1-2) and
identify common features of successful models (MS-ETS1-3), they can identify and
model the physical processes that are involved, using the dual perspectives of forces
and energy transfers. Students should be able to discuss their bumper solution in terms
of energy source/receiver diagrams such as figure 5.41. Towards the end of their design
challenge, students need to explain [SEP-6] why certain choices they made actually
work, and then use their more detailed models [SEP-2] of their system to further refine
their design.
Now students return to the anchoring phenomenon of an asteroid impact and can
use models of energy transfer to explain various observations from the K-T boundary.
First, Earth’s motion appeared largely unaffected by the asteroid impact. What does this
say about the size of the asteroid relative to Earth? Small chunks, however, were
thrown into the air at high speed. Could they fly up faster than the original asteroid?
Lastly, impact sites like Chicxulub show evidence of rock that melted at the impact site,
and many of the distant deposits include solidified droplets of formerly molten rock.
Where did the energy come from to melt this rock?
The CCC of energy and matter: flows, cycles and conservation [CCC-5] is
applied in many different contexts throughout the middle school grade span. One of the
middle grade bullets used to describe this CCC states that, “the transfer of energy
drives the motion and/or cycling of matter.” In Integrated Grades Six and Seven, the
emphasis is on the role of energy transfer in driving the cycling of matter (water cycle,
rock cycle, and cycling of matter in food webs). In Integrated Grade Eight IS1, the
emphasis is on the role of energy transfer in driving the motion of matter.

2016 California Science Framework Chapter 5 Grades 6-8 Preferred Integrated Model Page 204 of 306
The CA Science Framework was adopted by the California State Board of Education on November 3, 2016. The CA Science Framework has not been edited for publication. © by the California Department of Education.
Utilizing this CCC throughout the middle grade span serves at least three
complementary purposes. As students gain experience in applying the CCC, it helps
them connect with different DCIs and understand these DCIs and the related
phenomena in greater depth. As students apply the CCC in different contexts, they get
to understand the CCC itself in greater depth (e.g., transfers of energy can drive cycles
of matter and motion of objects). Thirdly, students experience science as a unified
endeavor rather than separate and isolated topics. Ultimately all of science works
together as a unified whole system.
Now that students understand more about the physical science effects of a giant
impact, they can return to the anchoring phenomenon to consider how such an impact
would affect the biosphere. They will need to draw on their understanding of Earth’s
interacting systems from earlier grades (ESS2.A). Students also know that dinosaurs
went extinct, while other species survived and then thrived following the impact. Why?
Can we use this information about how living systems were affected to determine more
details about the physical changes to Earth’s climate following the impact? A goal of the
Preferred Integrated model is that students see how understanding one discipline can
enhance understanding in others.
To transition to the next IS, students might wonder more about these asteroids and
how they move in space. This turns their attention to the sky.
Integrated Grade Eight Instructional Segment 2: Noncontact Forces Influence
Phenomena
Many phenomena are controlled by forces that do not touch. In IS2, students explore
gravity and electromagnetism in the context of observable features of the Sun, Moon,
stars, and galaxies. After years of noticing patterns in the movement of these objects in
earlier grades, they finally develop a model that explains these celestial motions. This
model has waited until grade eight because it requires students to visualize complex
motions from multiple frames of reference (both as observers on Earth and out in
space). What makes this unit ‘integrated’ is that the motions are considered in tandem
with the gravitational forces that cause them.

2016 California Science Framework Chapter 5 Grades 6-8 Preferred Integrated Model Page 205 of 306
The CA Science Framework was adopted by the California State Board of Education on November 3, 2016. The CA Science Framework has not been edited for publication. © by the California Department of Education.
Integrated Grade Eight – Instructional Segment 2: Noncontact Forces
Influence Phenomena
Guiding Questions:
What causes the cyclical changes in the appearance of the Moon?
How can an object influence the motion of another object without
touching it?
Does Earth’s force of gravity attract other objects equally?
Performance Expectations
Students who demonstrate understanding can:
MS-ESS1-1. Develop and use a model of the Earth-Sun-Moon system to
describe the cyclic patterns of lunar phases, eclipses of the
Sun and Moon, and seasons. [Clarification Statement:
Examples of models can be physical, graphical, or conceptual.]
(Introduced, but seasons are not assessed until IS4)
MS-ESS1-2. Develop and use a model to describe the role of gravity in the
motions within galaxies and the solar system. [Clarification
Statement: Emphasis for the model is on gravity as the force that
holds together the solar system and Milky Way galaxy and
controls orbital motions within them. Examples of models can be
physical (such as the analogy of distance along a football field or
computer visualizations of elliptical orbits) or conceptual (such as
mathematical proportions relative to the size of familiar objects
such as their school or state).] [Assessment Boundary:
Assessment does not include Kepler’s Laws of orbital motion or
the apparent retrograde motion of the planets as viewed from
Earth.]

2016 California Science Framework Chapter 5 Grades 6-8 Preferred Integrated Model Page 206 of 306
The CA Science Framework was adopted by the California State Board of Education on November 3, 2016. The CA Science Framework has not been edited for publication. © by the California Department of Education.
MS-ESS1-3. Analyze and interpret data to determine scale properties of
objects in the solar system. [Clarification Statement: Emphasis
is on the analysis of data from Earth-based instruments, space-
based telescopes, and spacecraft to determine similarities and
differences among solar system objects. Examples of scale
properties include the sizes of an object’s layers (such as crust
and atmosphere), surface features (such as volcanoes), and
orbital radius. Examples of data include statistical information,
drawings and photographs, and models.] [Assessment Boundary:
Assessment does not include recalling facts about properties of
the planets and other solar system bodies.]
MS-PS2-3. Ask questions about data to determine the factors that affect
the strength of electrical and magnetic forces. [Clarification
Statement: Examples of devices that use electrical and magnetic
forces could include electromagnets, electric motors, or
generators. Examples of data could include the effect of the
number of turns of wire on the electromagnet or the effect of
increasing the number or strength of magnets on the speed of an
electric motor.] [Assessment Boundary: Assessment about
questions that require quantitative answers is limited to
proportional reasoning and algebraic thinking.]
MS-PS2-4. Construct and present arguments using evidence to support
the claim that gravitational interactions are attractive and
depend on the masses of interacting objects. [Clarification
Statement: Examples of evidence for arguments could include
data generated from simulations or digital tools; and charts
displaying mass, strength of interaction, distance from the Sun,
and orbital periods of objects within the solar system.]
[Assessment Boundary: Assessment does not include Newton’s
Law of Gravitation or Kepler’s Laws.]

2016 California Science Framework Chapter 5 Grades 6-8 Preferred Integrated Model Page 207 of 306
The CA Science Framework was adopted by the California State Board of Education on November 3, 2016. The CA Science Framework has not been edited for publication. © by the California Department of Education.
MS-PS2-5. Conduct an investigation and evaluate the experimental
design to provide evidence that fields exist between objects
exerting forces on each other even though the objects are
not in contact. [Clarification Statement: Examples of this
phenomenon could include the interactions of magnets,
electrically-charged strips of tape, and electrically-charged pith
balls. Examples of investigations could include first-hand
experiences or simulations.]
MS-PS3-2. Develop a model to describe that when the arrangement of
objects interacting at a distance changes, different amounts
of potential energy are stored in the system. [Clarification
Statement: Emphasis is on relative amounts of potential energy,
not on calculations of potential energy. Examples of objects
within systems interacting at varying distances could include: the
Earth and either a roller coaster cart at varying positions on a hill
or objects at varying heights on shelves, changing the
direction/orientation of a magnet, and a balloon with static
electrical charge being brought closer to a classmate’s hair.
Examples of models could include representations, diagrams,
pictures, and written descriptions of systems.] [Assessment
Boundary: Assessment is limited to two objects and electric,
magnetic, and gravitational interactions.]
The bundle of performance expectations above focuses on the following
elements from the NRC document A Framework for K–12 Science Education:
Highlighted
Science and
Engineering Practices
Highlighted
Disciplinary Core Ideas
Highlighted
Crosscutting Concepts

2016 California Science Framework Chapter 5 Grades 6-8 Preferred Integrated Model Page 208 of 306
The CA Science Framework was adopted by the California State Board of Education on November 3, 2016. The CA Science Framework has not been edited for publication. © by the California Department of Education.
[SEP-1] Asking
Questions and
Defining Problems
[SEP-2] Developing
and Using Models
[SEP-3] Planning and
Carrying Out
Investigations
[SEP-4] Analyzing and
Interpreting Data
[SEP-5] Using
mathematics and
Computational
Thinking
[SEP-6] Constructing
Explanations (for
science) and
Designing Solutions
(for engineering)
[SEP-7] Engaging in
Argument from
Evidence
[SEP-8] Obtaining,
ESS1.A: The Universe
and Its Stars
ESS1.B: Earth and the
Solar System
PS2.B: Types of
Interactions
[CCC-1] Patterns
[CCC-2] Cause and
Effect
[CCC-4] System and
System Models
[CCC-5] Energy and
Matter: Flows, Cycles,
and Conservation

2016 California Science Framework Chapter 5 Grades 6-8 Preferred Integrated Model Page 209 of 306
The CA Science Framework was adopted by the California State Board of Education on November 3, 2016. The CA Science Framework has not been edited for publication. © by the California Department of Education.
Evaluating, and
Communicating
Information
CA CCSS Math Connections: 6.RP.1, 6.EE.2,6, 7.RP.2, 7.EE.3,4, MP.2, MP.4,
CA ELD Connections: ELD.PI.6.1,5,6 a-b, 9,10,11a
CA CCSSELA/Literacy Connections: RST.6-8.1,3,7, WHST.6-8.1,7, SL.8.5,
One of the biggest challenges of studying non-contact forces is that it is difficult to
visualize them. How do you see the invisible? In fact, one of the challenges that
students must meet in the CA NGSS is to plan investigations [SEP-3] that provide
evidence that fields exist between objects interacting through non-contact forces (MS-
PS2-5). Nature provides demonstrations of these interactions on a massive scale as
galaxies interact (figure 5.43). As an anchoring phenomenon for this IS, students will
consider how galaxies have unique shapes, and some galaxies have long ‘tails’ or
diffuse clouds that appear to connect or interact with nearby galaxies. Students examine
images of different interacting galaxies and record patterns they see. While they can
begin to link these structures to gravity, but how does a force that draws things together
cause round, swirling shapes? Over the course of IS2, they will develop models of
attractions between different objects in the solar system and Universe and use them to
explain observations.

2016 California Science Framework Chapter 5 Grades 6-8 Preferred Integrated Model Page 210 of 306
The CA Science Framework was adopted by the California State Board of Education on November 3, 2016. The CA Science Framework has not been edited for publication. © by the California Department of Education.
Figure 5.43. Interacting Galaxies Demonstrate Attraction
Galaxy pair Ar271. Source: Gemini Observatory 2008.
In this IS, students use the concept of gravity to explain [SEP-6] motions within
solar systems and galaxies (MS-ESS1-2). Essential components of the explanation are:
(1) gravity is a force that pulls massive objects towards one another; (2) objects in the
solar system move in circular patterns around the Sun; and (3) stars in galaxies move in
circular patterns around the center of the galaxy.
Students can illustrate the forces in these circular motions with a rope (figure 5.44).
One person stands in the center and holds the rope while the other starts moving away.
Once the rope is taut, both people feel the rope tugging them together. The pull of the
rope changes the moving person’s direction, constantly pulling that person back on
course so that he or she moves only in a circular motion around the other person. A
significant limitation of this model [SEP-2] is that it gives the impression that the central
mass must rotate as part of the motion.

2016 California Science Framework Chapter 5 Grades 6-8 Preferred Integrated Model Page 211 of 306
The CA Science Framework was adopted by the California State Board of Education on November 3, 2016. The CA Science Framework has not been edited for publication. © by the California Department of Education.
Figure 5.44. Kinesthetic Model of an Orbit
Two people can use a rope to model Earth’s orbit around the sun. Diagram by M.
d’Alessio.
Isaac Newton was the first person to develop and mathematically [SEP-5] prove
the idea of gravity as the cause [CCC-2] of orbital motions in the solar system. As part
of his thinking process, Newton developed a conceptual model [SEP-2] of orbits
based on shooting cannon balls at different speeds from a very tall mountain. Gravity
always pulls the cannon ball down, but the direction of “down” changes constantly (just
like the direction of pull from the rope changes constantly as the student runs around
the circle). Online interactive simulations of Newton’s cannon can help students
visualize and enjoy Newton’s cannonball model (see http://spaceplace.nasa.gov/how-
orbits-work/en/).
One of the most Earth-shaking aspects of Newton’s theory of gravity is that he
showed that the same force that causes [CCC-2] apples to fall from trees also causes
the Moon to travel around Earth. The same science principles that explain [SEP-6]
what is happening on planet Earth can also explain what is happening throughout the
solar system and in very distant galaxies. More specifically, Newton helped us
understand that every object attracts every other object via gravity. One factor affecting
the strength of the force depends on how much mass each of the objects have, with
larger masses causing stronger pulls. Because of the huge masses of planets, stars
and galaxies, gravity plays a major role in the structures and motions observed in solar
systems and galaxies.

2016 California Science Framework Chapter 5 Grades 6-8 Preferred Integrated Model Page 212 of 306
The CA Science Framework was adopted by the California State Board of Education on November 3, 2016. The CA Science Framework has not been edited for publication. © by the California Department of Education.
Explaining Motion in the Solar System
Students develop and use models [SEP-2] of the Earth-Sun-Moon system (MS-
ESS1-1). This system involves a variety of effects caused [CCC-2] by three different
solar system objects, two different orbits, and Earth’s rotation on its axis. Associated
phenomena include Moon phases, eclipses, and the lengths of a day, a month, and a
year. In the course of their exploration, students can practice using and developing
models [SEP-2] (physical, kinesthetic using their bodies, computer-based) and directly
experience that different kinds of models inherently have advantages and limitations.
Typically in educational settings, students have been presented with established
models that resulted from decades or centuries of observations and investigations. Over
those long periods of time scientists developed, argued about and revised models to
explain observed phenomena, and they made predictions that could be tested based on
different models. In CA NGSS classrooms, the pedagogic philosophy is to have
students engage more in the SEPs involved with building models rather than simply
showing them the current consensus completed models. Instructional materials and
teachers can choose the relative amount of emphases to place on developing models
and on using established models.
Factors Controlling the Effects of Gravity
Before eighth grade, middle school students have been hearing and talking about
gravity. However, if they are asked to compare how strongly Earth pulls on a bowling
ball and on a baseball, they are very likely to say that Earth pulls equally hard on each.
Based on all our Earthly experiences of falling objects, it is very logical to think that
gravity is a special property of Earth similar to other properties like density or color. But
gravity is the property of a system [CCC-4] caused by an interaction between the
components of that system. This example provides a strong connection to IS1 where
students learned that two objects involved in a force have an “equal and opposite”
relationship. No single object exerts a force just by itself.

2016 California Science Framework Chapter 5 Grades 6-8 Preferred Integrated Model Page 213 of 306
The CA Science Framework was adopted by the California State Board of Education on November 3, 2016. The CA Science Framework has not been edited for publication. © by the California Department of Education.
Gravity also illustrates another feature of forces, a puzzling feature that even Isaac
Newton could not explain. How can an object exert a force on or with an object that it is
not even touching? Gravity is an example of a noncontact force (figure 5.45). The
Golden Gate Bridge in San Francisco and the Dodger Stadium in Los Angeles pull on
each other and also pull on every person in California. The reason we do not notice
these pulls is that they are so weak compared with the attraction towards the planet
itself. Since all mass is attracted to all other mass in the universe, it is also true that the
Sun itself pulls on every student. Why don’t students fly up in the sky towards the
hugely massive Sun?
The answer is that the strength of the gravitational force also depends on the relative
positions of the interacting objects (i.e., the distance between them). Gravity on Earth is
usually thought of as pulling objects toward the center of the planet, but there is nothing
particularly special about the mass at the center of the planet or the downward direction.
A person gets pulled by every piece of the entire planet, with the ground directly
beneath his or her feet exerting the strongest pull and the ground on the opposite side
of the planet exerting a much weaker force because of its distance away. Because
these forces are so weak, it is difficult to experiment directly with the factors that affect
gravity, but students can investigate [SEP-3] using free computer simulations that
visualize these forces with two bodies (PhET,
https://phet.colorado.edu/sims/html/gravity-force-lab/latest/gravity-force-lab_en.html).
Students can apply their knowledge of gravitational forces to simulations of much more
complex planetary systems (Test Tube Games,
http://www.testtubegames.com/gravity.html) where they get to create different size
planets and place them in different positions. They can design experiments, predict how
different configurations will end up looking, and be challenged to create their own solar
system.

2016 California Science Framework Chapter 5 Grades 6-8 Preferred Integrated Model Page 214 of 306
The CA Science Framework was adopted by the California State Board of Education on November 3, 2016. The CA Science Framework has not been edited for publication. © by the California Department of Education.
Figure 5.45. Contact Forces and Noncontact Forces
Objects can apply a force even if they are not “touching.” Source: Daehler, Shinohara,
and Folsom 2011b.
Just as students investigated the sum of forces when objects are touching in IS1
(MS-PS2-2), changes in motion are caused [CCC-2] by the sum of all forces acting on
an object. Earth is a sphere, so there is approximately the same amount of ground level
mass to the north, south, west, and east of a person, so these pulls counteract each
other. The overall gravitational effect is a downward pull towards the center of the
planet. With very special devices, scientists can precisely measure differences in the
direction and pull of gravity at different locations on Earth. For example, if an
underground aquifer is full of water or an underground volcano chamber fills with
magma, the extra mass will pull slightly harder on objects than if the aquifer were dry or
the magma chamber empty. This difference in pull can be measured using satellites
orbiting the planet that provide valuable data for monitoring water supplies and volcanic
hazards (see GRACE Watches Earth’s Water at http://www.amnh.org/explore/science-

2016 California Science Framework Chapter 5 Grades 6-8 Preferred Integrated Model Page 215 of 306
The CA Science Framework was adopted by the California State Board of Education on November 3, 2016. The CA Science Framework has not been edited for publication. © by the California Department of Education.
bulletins/earth/documentaries/grace-tracking-water-from-space/article-grace-watches-
earth-s-water).
Similarities Between Gravity and Magnetism
Figure 5.45 includes magnetism as an example of a force that acts at a distance
(noncontact forces). Static electricity is another example of a noncontact force that
students can readily investigate [SEP-3]. The modern explanation of the puzzling
phenomenon of noncontact forces is that fields exist between objects that exert
noncontact forces on each other. Students probably have ideas about force fields based
on science fiction movies. Students at middle school level are not expected to
understand the physics concept of fields, but they can begin to approach a more
scientific understanding of force fields by measuring [CCC-3] the strength of these
fields under a variety of conditions.
Opportunities for ELA/ELD Connections
Have students create a visual and explain, using evidence and scientific principles, how
an object influences the motion of another object without touching it. Ask students to list
the scientific terms they will be using. As students present, coach and encourage them
to use all the listed terms correctly.
CA CCSS ELA/Literacy Standards: WHST.6–8.7; SL.6–8.4, 5; L.6–8.6
CA ELD Standards: ELD.PI.6–8.9
Non-contact Forces and Energy
MS-PS3-2 connects these investigations [SEP-3] of fields with the concept of
potential energy. Students are expected to describe that changing the arrangement of
objects interacting at a distance causes [CCC-2] different amounts of potential energy

2016 California Science Framework Chapter 5 Grades 6-8 Preferred Integrated Model Page 216 of 306
The CA Science Framework was adopted by the California State Board of Education on November 3, 2016. The CA Science Framework has not been edited for publication. © by the California Department of Education.
to be stored in the system. During IS1 of Integrated Grade Eight, students applied
energy considerations to complement and deepen their understanding of phenomena
involving forces and motion. Without necessarily using the term gravitational potential
energy, students investigated situations that involved the back-and-forth transfers of
gravitational potential energy and kinetic energy (e.g., in the motion of a pendulum or a
roller coaster).
In Integrated grade seven students had also encountered the concept of potential
energy with respect to the chemical energy stored in molecules. In food web models of
ecosystem energy flows [CCC-5], they illustrated that this chemical potential energy
transferred to motion energy and thermal energy. Students may have created or
analyzed graphic organizers comparing forms of kinetic and potential energy, such as
Table 5..
Table 5.10. Forms of Energy
ENERGY OF MOTION
Energy due to the motion of matter
ENERGY OF POSITION
Energy due to the
relative positions of matter
Kinetic Energy
Thermal Energy [often called Heat Energy]
Light Energy
Sound Energy
Electrical Energy
Gravitational Potential Energy
Elastic Potential Energy
Chemical Potential Energy
Magnetic Potential Energy
Electrostatic Potential Energy
Source: Daehler, Shinohara, and Folsom 2011a.

2016 California Science Framework Chapter 5 Grades 6-8 Preferred Integrated Model Page 217 of 306
The CA Science Framework was adopted by the California State Board of Education on November 3, 2016. The CA Science Framework has not been edited for publication. © by the California Department of Education.
Unlike gravitational fields around stars and planets that are hard to visualize,
students can easily collect data [SEP-8] about position and orientation of iron filings
contained within clear plastic box as they move a bar magnet nearby (MS-PS2-5). They
can then predict and record the resulting patterns [CCC-1] that they observe as they
introduce different magnets and magnetic objects nearby. Students should begin to ask
questions [SEP-1] about the spatial patterns [CCC-1] that they observe (MS-PS2-3).
For example, what happens if two magnets are placed end-to-end versus side-by-side?
Does the pattern change with the addition or movements of a magnetic object? Since
iron filings tend to concentrate in areas where the magnetic force is strongest, students
can use their observations to describe the relative strength of the invisible magnetic field
at different locations. They can also relate the lines of iron filings to the spiral arms in
interacting galaxies. Both structures form because of interactions at two different scales:
the small scale attractions between individual particles cause the clustering, and the
large-scale attractions due to the broader field cause these clusters to align in
systematic shapes (galaxy shapes are further complicated by the initial movements and
rotations of the galaxies). Students can design and conduct similar investigations
[SEP-3] based on electrostatic forces of attraction and repulsion.
Magnetic fields provide a way to visualize the potential energy of magnets. Magnetic
potential energy has some similarities with gravitational potential energy where the
relative position of the objects determines the strength of the force. Because magnets
have two poles, orientation also becomes important. Changing the relative position and
orientation of magnets can store potential energy that can be converted into kinetic
energy. By analyzing data [SEP-4] from frame-by-frame video analysis of a compass
needle, students can determine the conditions that cause [CCC-2] the needle to gain
the most kinetic energy. They can use these observations to support their model [SEP-
2] that the arrangement of objects determines [CCC-2] the amount of potential energy
stored in the system [CCC-4] (figure 5.46).

2016 California Science Framework Chapter 5 Grades 6-8 Preferred Integrated Model Page 218 of 306
The CA Science Framework was adopted by the California State Board of Education on November 3, 2016. The CA Science Framework has not been edited for publication. © by the California Department of Education.
Figure 5.46. A Magnet Moving a Compass Needle
Schematic diagram and model of energy flow within a system of a magnet moving a
compass needle. Diagram by M. d’Alessio.
Students can also use iron filings to investigate [SEP-3] electromagnets and gather
evidence about the spatial patterns [CCC-1] of the magnetic fields created by
electromagnets. Students can try to create the strongest electromagnet, allowing
different groups to ask questions [SEP-1] about the factors that affect magnetic
strength such as the number or arrangement of batteries, number of turns of the coil, or
material inside the coil (MS-PS2-3).
Notice that the text and figure 5.46 describe the potential energy of the system.
Some textbooks and curricular materials may refer to “the potential energy of the
object,” but this language should be avoided. The potential energy is a property of a
system [CCC-4] based on the objects within the system and their spatial and other
relationships to each other. Keeping this systems approach helps elucidate the nature
of gravitational, electrostatic and magnetic fields.
The end of Grade Eight IS2 provides an opportunity to reflect on the progression of
major physical science concepts, particularly flows of energy [CCC-5], throughout the
integrated science middle school grade span. In grade six, students explored many
transformations of energy, especially those that involved thermal energy, such as in the
2016 California Science Framework Chapter 5 Grades 6-8 Preferred Integrated Model Page 219 of 306
The CA Science Framework was adopted by the California State Board of Education on November 3, 2016. The CA Science Framework has not been edited for publication. © by the California Department of Education.
water cycle and weather conditions. In grade seven, they modeled flows of energy into
and out of organisms and ecosystems, and experienced the concept of potential energy
in the context of chemical reactions, food chains, and food webs. In the first two grade
eight instructional segments, students again investigated [SEP-3], collected evidence
[SEP-8], made arguments [SEP-7], developed models [SEP-2], and constructed
explanations [SEP-6] involving major energy concepts. Although the CA NGSS middle
school physical science PEs and DCIs do not explicitly mention or require the Law of
Conservation of Energy, this key concept actually is implicit in many of their models and
explanations. Calling attention to this concept during or after IS1 and IS2 could help
solidify student understanding and better prepare to apply this concept as they continue
to encounter and wonder about phenomena.
Integrated Grade Eight Snapshot 5.7. Causes of Io’s Volcanism
Anchoring phenomenon: Io, a moon of Jupiter has massive volcanic eruptions.
Mr. J developed a unit around Io, one of four moons of Jupiter discovered by Galileo
using his telescope. Students benefit from far better images from satellites. They
investigate images of its surface features and snapshots of eruption plumes and
discover evidence for Io’s active volcanism. They collect and compare data [SEP-4]
about the size of volcanoes and eruptions on Io to those on Earth (MS-ESS1-3) and use
their findings to support the claim that Io is the most volcanically active body in the solar
system. Students look at thermal infrared images of Io and see how the surface is
dotted with hot regions that correspond to the volcanoes seen in visible light. Where
does all this energy [CCC-5] come from? Students read an article to obtain
information [SEP-8] about three different possible sources of heating, including energy
generated by interactions with Jupiter’s magnetic field, tidal friction caused by gravity,
and internal heat from radioactivity. All three of these mechanisms are complex, so Mr.
J worked hard to find an article that provided just the right level of detail to introduce the
ideas at the middle school level. It focuses on the idea of energy transfer without
dwelling on the complex details. After reading the article, Mr. J instructs students to
draw diagrams that model the flow of energy [CCC-5] in these systems [CCC-4].

2016 California Science Framework Chapter 5 Grades 6-8 Preferred Integrated Model Page 220 of 306
The CA Science Framework was adopted by the California State Board of Education on November 3, 2016. The CA Science Framework has not been edited for publication. © by the California Department of Education.
Over the next several days, they explore each of these possible mechanisms. The
article emphasizes that all three mechanisms cause [CCC-2] some heating of Io. In
middle school, students begin to consider processes that are influenced by multiple
causes and to ask questions [SEP-1] about the relative importance of each cause.
Investigative Phenomenon: A satellite orbiting Jupiter recorded different magnetic field
strengths as it moved to different locations around the planet at different distances
away.
The class doesn’t spend much time on internal radioactivity, which is discussed
more in high school when students have a model of the internal structure of atoms (the
article indicates that this source is small compared to the others). Magnetic heating is
an energy transfer mechanism that is more complex than even the high school level, but
middle school students are expected to explore magnetic fields in the CA NGSS. The
students analyze [SEP-4] the magnetic field strength recorded by a satellite as it
passes close to the Jupiter and ask questions [SEP-1] about the factors that affect the
strength (MS-PS2-3).
Investigative Phenomenon: The orbital period of Io is exactly half that of Europa and
one fourth of Ganymede.
The article describes how Io receives energy from constant pulling by Jupiter and its
other moons. Students use a virtual telescope simulator to examine the orbits of Io and
the other moons of Jupiter and discover that Io’s orbital period is exactly half that of
Europa and one fourth of Ganymede. Students use this evidence to support the claim
[SEP-7] that the planets interact with one another through gravity (MS-PS2-4). They
draw diagrams with arrows that indicate the direction of gravitational attraction between
the moons at different snapshots in time where they have different relative positions.
They use these models [SEP-2] to describe how the moons affect one another’s
motion (MS-ESS1-2). Students also use these diagrams to demonstrate how the
gravitational potential energy of the system changes (when the planets get closer
together, they have less potential energy; MS-PS3-2). As potential energy in a system
decreases, there must be an increase in some other form of energy (or a flow of energy

2016 California Science Framework Chapter 5 Grades 6-8 Preferred Integrated Model Page 221 of 306
The CA Science Framework was adopted by the California State Board of Education on November 3, 2016. The CA Science Framework has not been edited for publication. © by the California Department of Education.
out of the system) – in this case, the potential energy is converted to heat energy.
Investigative Phenomenon: Loki volcano erupts on a cycle that repeats about once
every 1.5 Earth years.
They end the unit by examining the eruptive history of Io’s largest volcano, Loki.
Could it provide clues about the relative importance of each heating mechanism? The
volcano alternates between high activity and low activity, and Mr. J asks them to predict
what the time interval might be for each of the mechanisms. He scaffolds the discussion
and directs students to tie their thinking to Io’s orbit around Jupiter (about 42 hours) and
its interactions with the other moons (multiples of two and four times longer). Then,
students analyze data [SEP-4] to determine the actual time interval between eruptive
peaks (Rathbun et al. 2002). They find that the cycle repeats about every 1.5 Earth
years, much longer than the cycles they were expecting. Mr. J knew that his students
would be disappointed and confused, but he intentionally chose this data set because
he wanted to highlight an authentic scientific experience for his students where they did
not find any answer at all. He draws explicitly draws attention to the importance of time
scale [CCC-3], noting that students are able to rule out certain cause and effect
mechanisms [CCC-2] because the time scale of the possible cause is radically
different than the time scale of the effect. The actual cause of the 1.5 year cycle
remains a mystery to the students!
Integrated Grade Eight Instructional Segment 3: Evolution Explains Life’s Unity
and Diversity
IS3 focuses on Earth’s extremely long geological history and the changes in Earth’s
web of life over billions of years. When Earth scientists observe Earth’s current
landforms, they are usually looking at the results of Earth processes that occurred over
millions of years and involved thousands of miles of area. These time and distance
scales [CCC-3] are too slow and too large to reproduce in a lab. Imagine trying to do a
reproducible experiment by selectively changing one variable at a time at those time
and distance scales! Instead, investigations in Earth science often begin with carefully

2016 California Science Framework Chapter 5 Grades 6-8 Preferred Integrated Model Page 222 of 306
The CA Science Framework was adopted by the California State Board of Education on November 3, 2016. The CA Science Framework has not been edited for publication. © by the California Department of Education.
observing what the Earth looks like today, and then trying to reproduce similar features
in small-scale laboratory experiments or computer simulations. Scientists can even
apply these models of Earth processes to other planets like Mars to understand their
history. On Earth, these tools have allowed scientists to recover a remarkable history of
life on Earth.
Integrated Grade Eight – Instructional Segment 3: Evolution Explains
Life’s Unity and Diversity
Guiding Questions:
What can we infer about the history of Earth and life on earth from the
clues we can uncover in rock layers and the fossil record?
What evidence supports Darwin’s theory of biological evolution?
How do evolution and natural selection explain life’s unity and diversity?
Performance Expectations
Students who demonstrate understanding can:
MS-ESS1-4. Construct a scientific explanation based on evidence from
rock strata for how the geologic time scale is used to
organize Earth’s 4.6-billion-year-old history. [Clarification
Statement: Emphasis is on how analyses of rock formations and
the fossils they contain are used to establish relative ages of
major events in Earth’s history. Examples of Earth’s major events
could range from being very recent (such as the last Ice Age or
the earliest fossils of homo sapiens) to very old (such as the
formation of Earth or the earliest evidence of life). Examples can
include the formation of mountain chains and ocean basins, the
evolution or extinction of particular living organisms, or significant
volcanic eruptions.] [Assessment Boundary: Assessment does
not include recalling the names of specific periods or epochs and
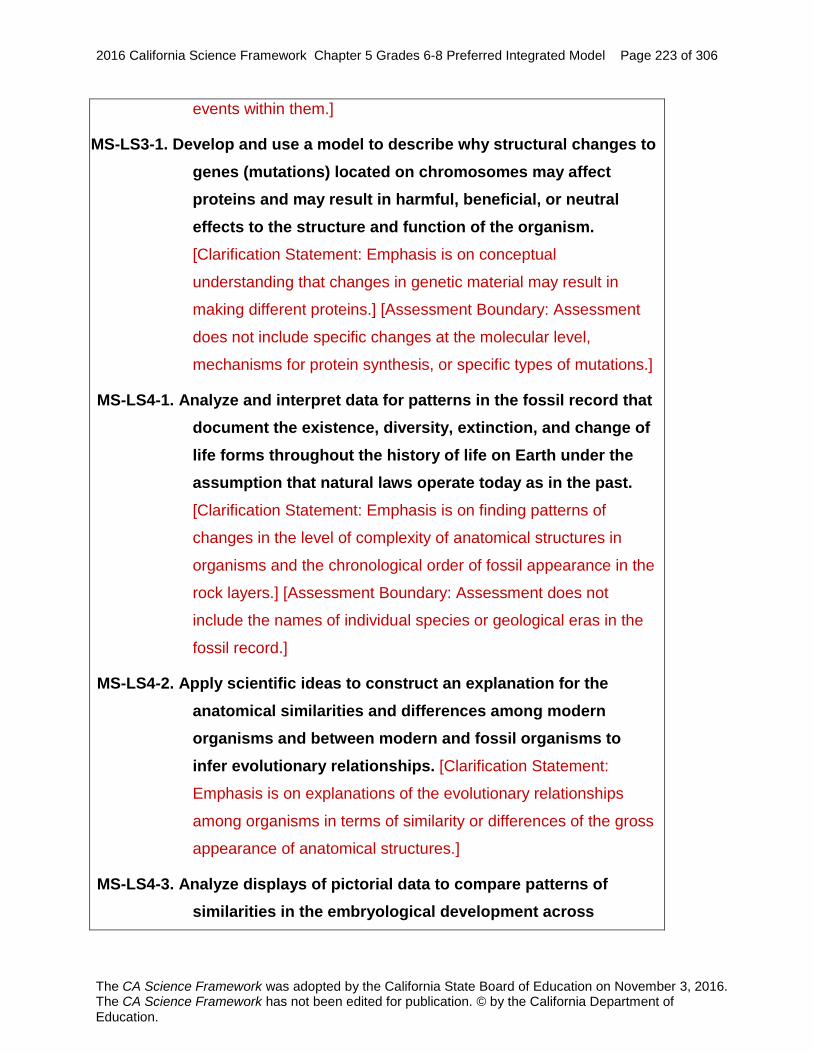
2016 California Science Framework Chapter 5 Grades 6-8 Preferred Integrated Model Page 223 of 306
The CA Science Framework was adopted by the California State Board of Education on November 3, 2016. The CA Science Framework has not been edited for publication. © by the California Department of Education.
events within them.]
MS-LS3-1. Develop and use a model to describe why structural changes to
genes (mutations) located on chromosomes may affect
proteins and may result in harmful, beneficial, or neutral
effects to the structure and function of the organism.
[Clarification Statement: Emphasis is on conceptual
understanding that changes in genetic material may result in
making different proteins.] [Assessment Boundary: Assessment
does not include specific changes at the molecular level,
mechanisms for protein synthesis, or specific types of mutations.]
MS-LS4-1. Analyze and interpret data for patterns in the fossil record that
document the existence, diversity, extinction, and change of
life forms throughout the history of life on Earth under the
assumption that natural laws operate today as in the past.
[Clarification Statement: Emphasis is on finding patterns of
changes in the level of complexity of anatomical structures in
organisms and the chronological order of fossil appearance in the
rock layers.] [Assessment Boundary: Assessment does not
include the names of individual species or geological eras in the
fossil record.]
MS-LS4-2. Apply scientific ideas to construct an explanation for the
anatomical similarities and differences among modern
organisms and between modern and fossil organisms to
infer evolutionary relationships. [Clarification Statement:
Emphasis is on explanations of the evolutionary relationships
among organisms in terms of similarity or differences of the gross
appearance of anatomical structures.]
MS-LS4-3. Analyze displays of pictorial data to compare patterns of
similarities in the embryological development across

2016 California Science Framework Chapter 5 Grades 6-8 Preferred Integrated Model Page 224 of 306
The CA Science Framework was adopted by the California State Board of Education on November 3, 2016. The CA Science Framework has not been edited for publication. © by the California Department of Education.
multiple species to identify relationships not evident in the
fully formed anatomy. [Clarification Statement: Emphasis is on
inferring general patterns of relatedness among embryos of
different organisms by comparing the macroscopic appearance of
diagrams or pictures.] [Assessment Boundary: Assessment of
comparisons is limited to gross appearance of anatomical
structures in embryological development.]
MS-LS4-4. Construct an explanation based on evidence that describes
how genetic variations of traits in a population increase
some individuals’ probability of surviving and reproducing in
a specific environment. [Clarification Statement: Emphasis is on
using simple probability statements and proportional reasoning to
construct explanations.]
MS-LS4-5. Gather and synthesize information about the technologies that
have changed the way humans influence the inheritance of
desired traits in organisms. [Clarification Statement: Emphasis
is on synthesizing information from reliable sources about the
influence of humans on genetic outcomes in artificial selection
(such as genetic modification, animal husbandry, gene therapy);
and, on the impacts these technologies have on society as well
as the technologies leading to these scientific discoveries.]
MS-LS4-6. Use mathematical representations to support explanations of
how natural selection may lead to increases and decreases
of specific traits in populations over time. [Clarification
Statement: Emphasis is on using mathematical models,
probability statements, and proportional reasoning to support
explanations of trends in changes to populations.]
*The performance expectations marked with an asterisk integrate traditional science

2016 California Science Framework Chapter 5 Grades 6-8 Preferred Integrated Model Page 225 of 306
The CA Science Framework was adopted by the California State Board of Education on November 3, 2016. The CA Science Framework has not been edited for publication. © by the California Department of Education.
content with engineering through a practice or Disciplinary Core Idea.
The bundle of performance expectations above focuses on the following
elements from the NRC document A Framework for K–12 Science Education:
Highlighted
Science and
Engineering Practices
[SEP-1] Asking
Questions and
Defining Problems
[SEP-2] Developing
and Using Models
[SEP-3] Planning and
Carrying Out
Investigations
[SEP-4] Analyzing and
Interpreting Data
[SEP-5] Using
Mathematics and
Computational
Thinking
[SEP-6] Constructing
Explanations (for
Highlighted
Disciplinary Core Ideas
ESS1.C The History of
Planet Earth
LS3.A Inheritance of
Traits
LS3.A Variation of
Traits
LS4.A Evidence of
Common Ancestry and
Diversity
LS4.B Natural
Selection
LS4.C Adaptation
Highlighted
Crosscutting Concepts
[CCC-1] Patterns
[CCC-2] Cause and
Effect
[CCC-3] Scale,
Proportion, and
Quantity
[CCC-4] System and
System Models
[CCC-6] Structure and
Function
[CCC-7] Stability and
Change

2016 California Science Framework Chapter 5 Grades 6-8 Preferred Integrated Model Page 226 of 306
The CA Science Framework was adopted by the California State Board of Education on November 3, 2016. The CA Science Framework has not been edited for publication. © by the California Department of Education.
science) and
Designing Solutions
(for engineering)
[SEP-7] Engaging in
Argument from
Evidence
[SEP-8] Obtaining,
Evaluating, and
Communicating
Information
Highlighted California Environmental Principles & Concepts:
Principle II The long-term functioning and health of terrestrial, freshwater,
coastal and marine ecosystems are influenced by their
relationships with human societies.
CA CCSS Math Connections: 6.RP.1, 6.SP.5, 6.EE.6, 7.RP.2, MP.4,
CA ELD Connections: ELD.PI.6.1,5,6 a-b, 9,10,11a
CA CCSSELA/Literacy Connections: RST.6-8.1,4,7,9, WHST.6-8.2,8,9,
SL.8.1,4,5
While the evidence that a giant impact triggered the extinction of the dinosaurs is
strong, there are a few loose ends of evidence that do not quite fit the claim. As an
anchoring phenomenon for this IS, students will consider that very few dinosaur fossils
are found in rock layers slightly below the K-T impact boundary (implying that they may
have declined before the major impact). The most compelling piece of evidence
supporting the impact claim is that the dinosaurs died out at the same time a layer
formed during a giant impact. It’s important to define what the ‘same time’ means –
layers of rock may take thousands or even hundreds of thousands of years to form.

2016 California Science Framework Chapter 5 Grades 6-8 Preferred Integrated Model Page 227 of 306
The CA Science Framework was adopted by the California State Board of Education on November 3, 2016. The CA Science Framework has not been edited for publication. © by the California Department of Education.
Scientists are not proposing that dinosaurs were instantly obliterated, but instead died
out over time in the years following the impact. There should be evidence of this die off
in the layers of rock. In one of the rock layers with the most prolific dinosaur fossils, the
Hell Creek Formation in Montana and surrounding states, dinosaur fossils are common
below the impact layer, but become sparse several meters below the impact layer. In
geologic layering, below means before. Did dinosaurs start going extinct before the
impact? Or is the scarcity just due to the fact that dinosaur fossils are rare? At this point
in grade eight, students are ready to contend with these challenges. According to the
progressions in Appendix 1 of this Framework, middle school students analyze data
[SEP-4] with a more critical eye, considering limitations and possible errors in the data
themselves. To resolve the dinosaur dilemma, students need a better understanding of
how to read the layers of rock like geologists.
While geologists use phrases like “66 million years ago,” nobody can realistically
experience how long that time span really is and the kinds of changes that can happen
over that scale [CCC-3] of time. Anchoring the unit in a perspective of geologic time
helps students conceptualize such scales. One model that educators often use to help
us get a handle on how Earth and life have changed over such an immense period of
time is to condense all of Earth’s history into an imaginary calendar year (Table 5.2).
Each day on that calendar represents about 12.5 million years. An alternative is to have
students construct a scale model of geologic time using adding machine tape that is
then hung in the classroom for the duration of the unit.

2016 California Science Framework Chapter 5 Grades 6-8 Preferred Integrated Model Page 228 of 306
The CA Science Framework was adopted by the California State Board of Education on November 3, 2016. The CA Science Framework has not been edited for publication. © by the California Department of Education.
Table 5.2. One Year Calendar Model of Geological Time Scale
EVENT ACTUAL DATE ONE YEAR
CALENDAR
Earth Formed 4,550,000,000 years
ago
January 1
First single-celled organisms 3,500,000,000 years
ago
March 24
First multicellular organisms 1,200,000,000 years
ago
September 22
First hard-shelled animals 540,000,000 years ago November 18
First land plants 425,000,000 years ago November 27
First reptiles 350,000,000 years ago December 3
First mammals 225,000,000 years ago December 13
Dinosaur extinction 66,000,000 years ago December 26
First primates 60,000,000 years ago December 27
First modern humans 200,000 years ago 11:33 pm on December
31
Source: Information from Sussman 2006.
The clarification statement for MS-ESS1-4 indicates that the emphasis of this PE is
not on the geologic timescale itself, but rather how different evolutionary and geologic
events are put into a sequence using evidence from rock strata. Students identified
patterns in rock layers and used them to interpret fossils back in grade four (4-ESS1-1).
In grade seven, students developed a model of rock cycle processes such as erosion
and sedimentation (MS-ESS2-1) that form sequences of rock layers that record fossils.
One geologic application of the CCC of stability and change [CCC-7] is that geologists
assume that processes we observe today operated the same way in the distant past. In

2016 California Science Framework Chapter 5 Grades 6-8 Preferred Integrated Model Page 229 of 306
The CA Science Framework was adopted by the California State Board of Education on November 3, 2016. The CA Science Framework has not been edited for publication. © by the California Department of Education.
other words, we can use the present as a key to interpret the past. Students must be
able to use this overarching principle to explain [SEP-6] how they can use rock layers
to determine the sequence of events in the past such as those in Table 5.2 (MS-ESS1-
4). The evidence statement for MS-ESS1-4 provides a complete list of the types of
reasoning students should be able to use in their explanation, including the ordering of
layers with the most recent material being deposited on top of older material, the
presence or absence of fossils of certain species that lived only during certain time
intervals, and the identification of layers with unique chemical or structural signatures
caused by major events such as lava flows and impacts with high iridium
concentrations. In essence, geologists use clues in the rock layers to reconstruct a
sequence of events much like a detective determines the timeline surrounding a crime.
In fact, one way to introduce these principles is through a murder mystery (USGS,
http://education.usgs.gov/lessons/schoolyard/CoolGeologyActivity.html). Students then
need to practice reconstructing sequences from simple diagrams of layers to ensure
that they have mastered the principles of relative dating.
Since dinosaur fossils are rare, the absence of dinosaur fossils in a layer is not
reliable evidence of extinction. Other organisms, however, are much more common.
Students next investigate a sequence of layers above and below the layer caused by
the impact that may have killed the dinosaurs. Students will look at layers of rocks that
formed at the bottom of the ocean, and they can tell that they are marine rocks because
they formed in continuous flat layers out of calcium-rich material and contain fossils of
microscopic organisms called foraminifera. An astonishing variety of foraminifera live in
the ocean today, each species with a different size and shape shell. Students examine
the diversity of foraminifera in each of these ancient rock layers. Using cards with
pictures of the view through a microscope of foraminifera shells extracted from a single
layer, students document the species in that layer and compare them to the next layer
upwards (figure 5.47) Which species from the lower layer survived into the next layer,
which went extinct, and which new species appeared? They analyze [SEP-4] all the
layers together from the class and create a graph showing how the number of species
changed over time. To interpret [SEP-4] their findings, students must remember that
the progression of layers represents the progression of time. A sudden decrease in the

2016 California Science Framework Chapter 5 Grades 6-8 Preferred Integrated Model Page 230 of 306
The CA Science Framework was adopted by the California State Board of Education on November 3, 2016. The CA Science Framework has not been edited for publication. © by the California Department of Education.
number of species represents a major extinction event, and students see evidence of
this extinction occurring right up to the layers immediately above and below the clay
layer from the impact.
Figure 5.47. Microscopic Views of Fossil Foraminifera from Different Rock Layers
Source: M. d’Alessio with foraminifera data from National Research Council 1995 and
image from Meléndez and Molina 2008.
Whatever the exact cause, the majority of foraminifera species went extinct at the
time of the impact, though some did survive. The number of species increases again in
layers above the impact, and many of the species that survived the impact go extinct as

2016 California Science Framework Chapter 5 Grades 6-8 Preferred Integrated Model Page 231 of 306
The CA Science Framework was adopted by the California State Board of Education on November 3, 2016. The CA Science Framework has not been edited for publication. © by the California Department of Education.
these new species appear. What traits did the species that die share and how did they
differ from the species that survived? Why did many of the species that survived
eventually die off? To fully understand these phenomena in the fossil record, the focus
of this IS shifts to LS DCIs about natural selection and their implications for evolution.
Opportunities for ELA/ELD Connections
Students read two articles that outline some of the possible climatic changes that
could have accompanied a major impact, one review by a scientist (Cowan 2000) and
one reporting the results of a scientific study in a newspaper (Netburn 2016). They
evaluate [SEP-8] the differences between the articles. How do the tones of the articles
differ? What sort of information is included in each? Students then ask questions
[SEP-1] about how these climate changes would affect populations.
ELA/Literacy Standards: R.I.8.2, 8, 9
ELD Standards: ELD.PI.8.6, 7
While it is not possible to go back in time to monitor how the impact would affect
the Earth’s systems and interactions between them, but scientists do study modern
changes to ecosystems and how they affect populations. The snapshot below illustrates
how scientists track modern changes.
Integrated Grade Eight Snapshot 5.8.
Making Sense of Natural Selection
How do climatic changes (ESS3.D) lead to the predominance of certain traits in a
population over generations? To gauge what students already know about how
environmental changes impact living things, Ms. Q starts the learning sequence with a
brief pre-assessment probe about what happens to individuals when there is such a

2016 California Science Framework Chapter 5 Grades 6-8 Preferred Integrated Model Page 232 of 306
The CA Science Framework was adopted by the California State Board of Education on November 3, 2016. The CA Science Framework has not been edited for publication. © by the California Department of Education.
dramatic change that all of the animal’s food supply dies off (Keeley, Eberle, and Tugel
2007). Will it change its diet? Hibernate for the first time ever? Die? Change in some
other way?
Anchoring phenomenon: Finches on the Galapagos Islands have different size and
shape beaks.
Ms. Q introduces the anchoring phenomenon for this sequence – images showing
differences between Galapagos finches — the same birds that intrigued Darwin during
his voyage on the HMS Beagle. She asks students to record observations of the finches
and questions they have about them. She then presents students with a page from
Darwin’s ornithological notes (where Darwin describes his confusion over the birds).
She asks students how Darwin used cause and effect [CCC-2] to frame his thinking.
What effects did he recognize and what causes was he considering?
Investigative Phenomenon: In a simulation, birds with different size beaks die off
when the climate changes and causes a change in food supply.
Over the next days, students engage in the Clipbird activity (Janulaw and
Scotchmoor 2011). In this hands-on simulation, students use the lens of cause and
effect [CCC 2] to understand how a change in the environment over time impacts the
ability of plants to reproduce (produce seeds), which in turn impacts birds’ food supply
and thus their survival. In this simulation, a mountain range separates two different
populations of birds. Each population begins with the same small variations in beak size
and similar food supply in the first two rounds of the simulations (‘seasons’). In seasons
three and four, the ‘climate’ diverges on the two sides of the mountains and the food
supply changes. Before actually acting out the simulation each season, students predict
the outcome knowing the food supply. After season four, students construct an
explanation [SEP-6], using cause and effect [CCC-2] evidence to address the
question: how does change in the climate impact each population (MS-LS4-4, MS-LS4-
6)? They write in their notebooks, share with their team, and finally revise their thinking
as appropriate and construct a single team explanation (figure 5.48).
Figure 5.48: Preliminary Student Explanation of the Clipbird Scenario

2016 California Science Framework Chapter 5 Grades 6-8 Preferred Integrated Model Page 233 of 306
The CA Science Framework was adopted by the California State Board of Education on November 3, 2016. The CA Science Framework has not been edited for publication. © by the California Department of Education.
Source: Photo provided by Jill Grace
The following day, Ms. Q asks her students to think of ways they can be more
certain or “sure” that their explanation [SEP-6] is accurate. This eventually leads to a
discussion of sample size, and Ms. Q presents the students with data from all of her
classes. She asks the students to consider ways in which the data can be displayed to
better understand it, and students agree they should combine and then graph the data.
Organizing and presenting the data [SEP-4] in a visual form (graph) helps students

2016 California Science Framework Chapter 5 Grades 6-8 Preferred Integrated Model Page 234 of 306
The CA Science Framework was adopted by the California State Board of Education on November 3, 2016. The CA Science Framework has not been edited for publication. © by the California Department of Education.
make sense of the information and enables them to discuss and work with their team to
review and revise their explanations [SEP-4] through the lens of cause and effect
[CCC-2].
How would the populations change after 100 generations or even 1,000? Ms. Q
informs the class that their simulation is based on an actual study by scientists and they
can observe the effects. She spends the next several days exploring actual data from
Grant and Grant (2014) and media resources (Howard Hughes Medical Institute 2014),
including articles that describe some of the changes that global climate change may
bring to different species in the Galapagos and beyond (ESS3.D).
Natural Selection Based on Four Science Concepts
Natural selection is a mechanism [CCC-2] that explains how species change over
time in response to changing environments. Students will need to develop a
conceptual model [SEP-2] of natural selection that connects several DCIs (figure
5.49Figure 5.49). Students observed evidence of the first three concepts in Integrated
grades six and seven: organisms have variable traits that are inherited (LS3.A, B), most
organisms produce far more offspring than survive, and individuals in a population
compete with each other for resources (LS2.A). Darwin’s contribution was to link these
ideas together and explain them: organisms that have traits that increase their success
(survival and reproduction) in the current environment are more likely to pass their traits
to their descendants than organisms that have traits that are not so well suited to the
environment (LS4.B).

2016 California Science Framework Chapter 5 Grades 6-8 Preferred Integrated Model Page 235 of 306
The CA Science Framework was adopted by the California State Board of Education on November 3, 2016. The CA Science Framework has not been edited for publication. © by the California Department of Education.
Figure 5.49. Four Key Ideas in Natural Selection
Source: Sussman 2006.
Darwin lived in England in the mid- to late 1800’s. His country led the world in
advancements of geologic ideas, provided evidence that Earth had an immensely long
history, and that changes generally happened very slowly. Darwin and his
contemporaries also assumed that natural laws that governed biology would follow the
same logic; evolution must also be very slow. We now know, however, that the rate with
which changes occur depend on generation time. The traits common in a population
shift each generation. These small-scale changes are measurable and can lead to a
small increase in the ability to survive and reproduce. Given enough time, however
(sometimes thousands of generations), these small changes can accumulate and lead
to major change and can account for the diversity we see in life today. A population that
appears stable might actually be slowly changing, and students will benefit from
explicitly considering of the CCC of stability and change [CCC-7]. By the end of

2016 California Science Framework Chapter 5 Grades 6-8 Preferred Integrated Model Page 236 of 306
The CA Science Framework was adopted by the California State Board of Education on November 3, 2016. The CA Science Framework has not been edited for publication. © by the California Department of Education.
middle school, they are expected to be able to recognize that processes can cause both
slow and rapid changes, and this understanding feeds into an even more sophisticated
view of dynamic equilibrium in high school where students will quantify feedback
mechanisms that control the rate of change. Students can provide examples from their
own life where changes occur slowly and rapidly (grass grows slowly each day until it is
suddenly cut; they make steady progress reading a book each night during the week
and then race through to the end during a reading binge one weekend). The Clipbird
snapshot provides a tangible example where during seasons one and two changes
were slow, but the sudden shift in food availability in seasons three and four (simulating
major climate change over a compressed classroom timescale) caused more rapid
population changes. Students can identify similar effects in real data sets, such as the
Geospiza fortis and use mathematical models [SEP-5] to describe these changes
(MS-LS4-6).
Linking Natural Selection and Evolution
To develop understanding about how these changes in populations can add up to
major differences between species, students need to track different examples. Darwin
used evidence [SEP-7] from artificial selection (most notably dogs and pigeons) to
support his claims about natural selection as the mechanism for evolutionary change.
Artificial selection refers to how humans have consciously selected and bred plants and
animals to have traits that humans wanted to exploit, taking advantage of naturally
occurring random variations. Doing this keeps increasing the quantity and quality of a
particular trait in a local population. In the example of dogs, exploited traits were those
that helped hunters find prey or those that helped to control the behavior of other
animals on the farm. There are numerous examples of humans artificially selecting for
traits in animals and plants. Examples include selecting for the kind of sheep that give
the best quality wool, trees that yield the biggest and sweetest fruit, crop plants that
grow quickly or are resistant to pests, and cows that provide the most milk. Tapping into
prior knowledge students have about such examples is a good entry point for students
to start thinking about artificial selection.

2016 California Science Framework Chapter 5 Grades 6-8 Preferred Integrated Model Page 237 of 306
The CA Science Framework was adopted by the California State Board of Education on November 3, 2016. The CA Science Framework has not been edited for publication. © by the California Department of Education.
Digging deeper, students could investigate a case study involving scientists
understanding of the history of modern maize (corn), which holds tremendous cultural
significance. Scientists puzzled for a long time trying to reconstruct the ancestry of
modern maize from what some claimed was the common ancestor, teosinte. Students
obtain information [SEP-8] from internet resources (e.g., Weed to Wonder:
Domestication, http://www.weedtowonder.org/domestication.html) to discover the lines
of evidence used to support the claim and to document questions they have about the
evidence. Students can then argue from evidence [SEP-7] to evaluate the strength of
the evidence to support the claim and view the Howard Hughes Medical Institute
(HHMI) Video, Popped Secret: The Mysterious Origin of Corn
(http://www.hhmi.org/biointeractive/popped-secret-mysterious-origin-corn) to compare
their research and arguments.
Students can compare and contrast the processes of artificial selection and natural
selection. By selecting for specific characteristics over many generations, humans
consciously take advantage of naturally occurring variations, and they keep increasing
the quantity and quality of a particular trait in a local dog or plant population. In artificial
selection, nature provides random variations in traits and human beings select the traits
that they want. In natural selection, nature provides both the random trait variations and
the selection mechanisms by competition in changing environments.
What Causes Variation?
Both natural selection and artificial selection require random inheritable variations in
traits. But, what exactly causes [CCC-2] these random variations in heritable traits?
Darwin and his contemporaries at the end of the nineteenth century did not know the
precise mechanism. The answers had to wait until great advances were made in biology
about 100 years after Darwin published his theory of evolution by natural selection.
In grade six, students developed a model of how sexual reproduction results in
genetic variation in offspring (MS-LS3-2), and they now extend that model to include
variation by genetic mutation and the tie between genes, proteins, and traits. Specific

2016 California Science Framework Chapter 5 Grades 6-8 Preferred Integrated Model Page 238 of 306
The CA Science Framework was adopted by the California State Board of Education on November 3, 2016. The CA Science Framework has not been edited for publication. © by the California Department of Education.
molecular details of how this happens, including the discussion of DNA and mechanism
for protein synthesis, is reserved for high school, HS-LS1-1. Students can begin with
another case study identifying patterns [CCC-1] in the bodies of arthropods (figure
5.50). Are animals with similar body types closely related? Students can group animals
based on similar body structures and lay these groups out on an evolutionary tree that
reveals something about possible sequences (i.e., which came first, and when did the
others diverge?).
Figure 5.50. Arthropod Bodies Have Similar Structures
Source: Genetic Science Learning Center, University of Utah N.d.
Some scientists make an analogy between genetic code and programming computer
code. If an organism has a specific gene sequence for creating a leg, it’s easy to
visualize how the body would create legs in different locations if the gene sequence
gets moved, or how additional legs would grow if the segment is activated multiple
times. The process is analogous to copying and pasting computer code to different
parts of a computer program. When cells can copy their genetic code (for reproduction

2016 California Science Framework Chapter 5 Grades 6-8 Preferred Integrated Model Page 239 of 306
The CA Science Framework was adopted by the California State Board of Education on November 3, 2016. The CA Science Framework has not been edited for publication. © by the California Department of Education.
or other purposes), errors can occur that cause sections to get moved or duplicated.
Students can see evidence of these mutations to the genetic code in arthropod bodies.
In fact, the specific genes for body segments that show up in arthropods can be traced
throughout all modern animals (figure 5.51). Slight variations in these body segment
genes, called “Hox genes,” provide genetic recipes for different body parts.
Figure 5.51. Animals Share Similar Genetic Code for Body Segments
Source: Genetic Science Learning Center, University of Utah N.d.
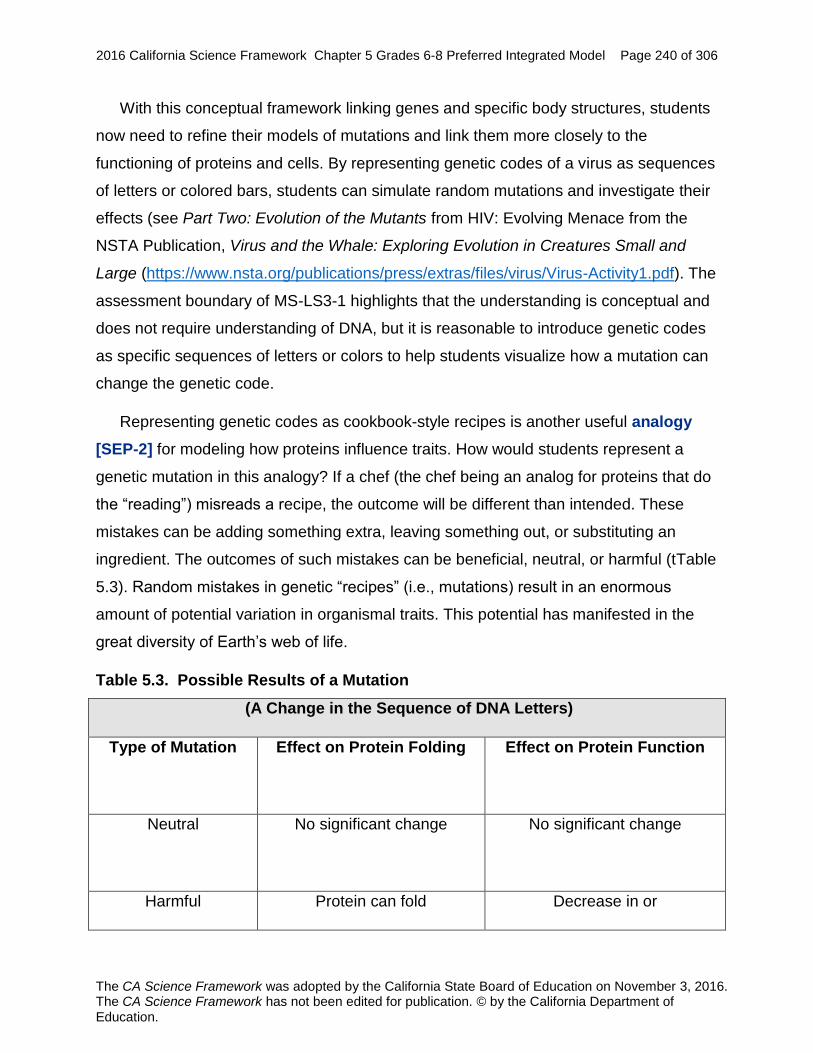
2016 California Science Framework Chapter 5 Grades 6-8 Preferred Integrated Model Page 240 of 306
The CA Science Framework was adopted by the California State Board of Education on November 3, 2016. The CA Science Framework has not been edited for publication. © by the California Department of Education.
With this conceptual framework linking genes and specific body structures, students
now need to refine their models of mutations and link them more closely to the
functioning of proteins and cells. By representing genetic codes of a virus as sequences
of letters or colored bars, students can simulate random mutations and investigate their
effects (see Part Two: Evolution of the Mutants from HIV: Evolving Menace from the
NSTA Publication, Virus and the Whale: Exploring Evolution in Creatures Small and
Large (https://www.nsta.org/publications/press/extras/files/virus/Virus-Activity1.pdf). The
assessment boundary of MS-LS3-1 highlights that the understanding is conceptual and
does not require understanding of DNA, but it is reasonable to introduce genetic codes
as specific sequences of letters or colors to help students visualize how a mutation can
change the genetic code.
Representing genetic codes as cookbook-style recipes is another useful analogy
[SEP-2] for modeling how proteins influence traits. How would students represent a
genetic mutation in this analogy? If a chef (the chef being an analog for proteins that do
the “reading”) misreads a recipe, the outcome will be different than intended. These
mistakes can be adding something extra, leaving something out, or substituting an
ingredient. The outcomes of such mistakes can be beneficial, neutral, or harmful (tTable
5.3). Random mistakes in genetic “recipes” (i.e., mutations) result in an enormous
amount of potential variation in organismal traits. This potential has manifested in the
great diversity of Earth’s web of life.
Table 5.3. Possible Results of a Mutation
(A Change in the Sequence of DNA Letters)
Type of Mutation Effect on Protein Folding Effect on Protein Function
Neutral No significant change
No significant change
Harmful Protein can fold Decrease in or

2016 California Science Framework Chapter 5 Grades 6-8 Preferred Integrated Model Page 241 of 306
The CA Science Framework was adopted by the California State Board of Education on November 3, 2016. The CA Science Framework has not been edited for publication. © by the California Department of Education.
in a different way loss of function
Beneficial Protein can fold
in a different way
Protein functions better or even
helps in a new way
Source: Dr. Art Sussman, courtesy of WestEd.
Just like artificial selection parallels natural selection, humans have developed
technology to artificially introduce mutations. Students can return to their case study of
corn and maize and obtain information [SEP-8] about how seed manufacturers have
genetically modified some maize traits by inserting the Bt gene that produces a protein
that can kill harmful insects (Gewin 2003). The applications of this genetic science to
societal challenges such as the corn example are not ‘optional sidetracks,’ but part of an
explicit performance expectation in the CA NGSS (MS-LS4-5).
Unity and Diversity of Life
An overview of Earth’s biodiversity reveals two very different but also
complementary features: unity of life and a diversity of species. With respect to unity, all
of Earth’s species share essentially the same genetic code described in the previous
section because of common ancestry. In addition to the genetic code being the same, at
the molecular level even very different organisms such as humans, sunflowers and fruit
flies have very similar molecules that perform vital life functions. Despite these
fundamental similarities, there are also key differences. The grade eight PEs focus on
these differences at the macroscopic rather than the molecular level.
With their new model of genetic mechanisms for mutation, students can now explain
the linkage between evolution and natural selection from a new light. Like the
arthropods, students can recognize patterns [CCC-1] in the structure of animal limbs
that enable humans to throw, bats and birds to fly, dolphins to swim, frogs to jump, and
lizards to run (figure 5.52). They can now explain [SEP-6] both the similarities and
differences in terms of genetic inheritance, mutations, and natural selection (MS-LS4-2).

2016 California Science Framework Chapter 5 Grades 6-8 Preferred Integrated Model Page 242 of 306
The CA Science Framework was adopted by the California State Board of Education on November 3, 2016. The CA Science Framework has not been edited for publication. © by the California Department of Education.
They can also use the similarities to construct an argument [SEP-7] that these
animals all share a common ancestor.
Figure 5.52. Comparing Limb Bone Structures in Different Animals
Anatomy reveals both the unity of basic bone structures and the diversity of organisms.
Source: Lawson 2007.
There are of course differences in the relative and absolute sizes of each bone
compared across these very different organisms. The differences make sense because
the structure [CCC-6] of the bones relates to the function [CCC-6] of the arm. In an
organism like a bat that uses its front appendage for flight, longer, lighter bones are
naturally selected. Organisms that walk on four legs must have bones sturdy enough to
support weight, while those that walk on two legs tend to have front arms that have
been naturally selected for lighter weight-bearing since they aren't supporting the body.
Further evidence that supports the evolutionary relationship of these different
organisms comes from examining how organisms develop in the embryo. For example,
the limbs and hands of bats and mice start off developing in the embryo nearly
identically but differentiate later during the embryo’s development (figure 5.53).
Students should be able to analyze pictorial data of embryos to identify patterns [CCC-
1] in the development of these organisms (MS-LS4-5).

2016 California Science Framework Chapter 5 Grades 6-8 Preferred Integrated Model Page 243 of 306
The CA Science Framework was adopted by the California State Board of Education on November 3, 2016. The CA Science Framework has not been edited for publication. © by the California Department of Education.
Figure 5.53. View of Embryo Development in Bats and Mice
(Top Row, A-F): Bat; (Bottom Row, G-L): Mouse. Source: Cretekos et al. 2008.
These and similar examples from anatomy (MS-LS4-2) and embryology (MS-LS4-3)
provide data that students can analyze [SEP-4] and use as evidence to construct
evidence-based explanations [SEP-6] based on resemblances due to shared ancestry
and differences due to the effects of natural selection in different environments (MS-
LS4-2) as well as the role of mutation (MS-LS3-1). Students can explain [SEP-6] what
caused [CCC-2] related species to look slightly different, or can use slight differences
to identify possible relationships between species.
Integrated Grade Eight Snapshot 5.9. Simulating Mutant Hands
Anchoring phenomenon: People have hands. (How did they evolve?)
Darwin himself pointed to human hands and asked questions about how they came
to be, and researchers are starting to figure things out using a combination of fossil
discoveries, embryological development, and artificial gene editing.
Investigative Phenomenon: A transitional fossil shows a fish with fins that look more

2016 California Science Framework Chapter 5 Grades 6-8 Preferred Integrated Model Page 244 of 306
The CA Science Framework was adopted by the California State Board of Education on November 3, 2016. The CA Science Framework has not been edited for publication. © by the California Department of Education.
like limbs of a land-dwelling animal.
Ms. R’s students begin by obtaining information [SEP-8] from a news story
documenting the work of scientists (Zimmer 2016). The scientists discovered a 370
million year old transitional fossil, Tiktaalik that is a fish with fins that look more like the
limbs of land-dwelling animals. How did arms and hands evolve from fins (whose
supporting rays are made from a completely different material than the rest of the fish’s
bones)? The article goes on to discuss how the same scientists used genetic
experiments on zebrafish and mice and how these helped scientists isolate the specific
genes responsible for our hands. The changes that allowed a few species of fish to
make the environmental transition from water to land opened up whole new possibilities
for life, and diversity exploded into the full range of limb functions we see today.
Investigative Phenomenon: As specific genes are copied, moved, or deleted, an
organism’s body shape can change in specific ways.
To understand the evidence better, Ms. R’s students explore an interactive simulator
of a zebrafish. The computer screen provides students a control panel where they can
copy, move, or delete different segments of the genetic code of the zebrafish. They can
also insert special genetic code from a jellyfish to track the proteins built by each gene.
After students modify a gene, they watch as the zebrafish develops. Through systematic
investigation [SEP-3], students isolate the effects of the individual genes. They try to
recreate the Tiktaalik’s arm-like fins in the engineered zebrafish.
Using the information obtained from the reading and their model of limb genetics
from the simulator, students create a poster communicating [SEP-8] the evidence that
explains how human hands slowly evolved from fish fins. Their posters include evidence
from fossils (MS-LS4-2; ESS1.C), the embryological study (MS-LS4-3), and the genetic
manipulation (MS-LS3-1).
While students engineered zebrafish embryos in the computer, the real scientists
used modern technology to manipulate real living organisms. Ms. R helps lead a
discussion with her students about the ethics of this form of scientific investigation.

2016 California Science Framework Chapter 5 Grades 6-8 Preferred Integrated Model Page 245 of 306
The CA Science Framework was adopted by the California State Board of Education on November 3, 2016. The CA Science Framework has not been edited for publication. © by the California Department of Education.
Bringing the Unit Together
The similarity of organisms at molecular and macroscopic scales is best explained
[SEP-6] by the idea that life originated as single-celled organisms that progressively
became more complex as populations adapted to living in very different environments.
Students can mark this history of life in the calendar of Earth’s geologic time scale or
the classroom scale model that they developed at the beginning of the IS (Table 5.2).
The most prevalent and easy-to-find fossils come from animals that have hard body
parts, such as bones and shells. These types of fossils first appear around 540 million
years ago.
Students can focus on the evolutionary lineage of a local species of interest (such as
the San Joaquin kit fox, the humpback whale, the California long-tailed weasel, etc.) or
just about any other organism that captures their imagination. They can obtain
information [SEP-8] about common ancestry, adaptation, and selection and then
present their findings to the class.
Such a deep dive into the mechanisms and evidence for evolution will help students
make sense of the diversity observed in the fossil record and the plausibility of larger
extinction events as well as the subsequent diversification of life. Returning to the unit
phenomenon of an unexplained mystery in the geologic record, students can recall their
comparison of fossilized foraminifera before and after the mysterious extinction event.
What traits did the animals have that survived the climate change following the impact?
Would these traits still have provided an advantage thousands of years after the
catastrophe when the environmental conditions had stabilized (or possibly returned to
their pre-impact conditions)? What factors explain the subsequent diversification of
foraminifera (and other species) in the millions of years following the impact? What
happened to the traits and genetic code for the organisms that became extinct?

2016 California Science Framework Chapter 5 Grades 6-8 Preferred Integrated Model Page 246 of 306
The CA Science Framework was adopted by the California State Board of Education on November 3, 2016. The CA Science Framework has not been edited for publication. © by the California Department of Education.
Integrated Grade Eight Instructional Segment 4: Sustaining Local and Global
Biodiversity
This IS features a very important concept related to the CA NGSS Earth and Space
Science strand: “Earth and Human Activity.” Increases in human population and in per-
capita consumption of natural resources impact Earth’s systems (MS-ESS3-4). In this
IS, students re-visit life science concepts that they explored in IS3: changes in
environmental conditions alter populations of organisms and can cause extinction (MS-
LS4-4 and MS-LS4-6). Fortunately, modern technologies, such as using digitized
signals to encode and transmit information (MS-PS4-3), can help us monitor,
understand and reduce these impacts.
Integrated Grade Eight – Instructional Segment 4:
Sustaining Local and Global Biodiversity
Guiding Questions:
What are the characteristic properties and behaviors of waves?
What human activities harm Earth’s biodiversity and what human
activities help sustain local and global biodiversity?
How does communication technology encode information and how can
digital technologies be used to help sustain biodiversity?
Performance Expectations
Students who demonstrate understanding can:
MS-PS4-1. Use mathematical representations to describe a simple model
for waves that includes how the amplitude of a wave is
related to the energy in a wave. [Clarification Statement:
Emphasis is on describing waves with both qualitative and
quantitative thinking.] [Assessment Boundary: Assessment does
not include electromagnetic waves and is limited to standard
repeating waves.]
MS-PS4-2. Develop and use a model to describe that waves are reflected,

2016 California Science Framework Chapter 5 Grades 6-8 Preferred Integrated Model Page 247 of 306
The CA Science Framework was adopted by the California State Board of Education on November 3, 2016. The CA Science Framework has not been edited for publication. © by the California Department of Education.
absorbed, or transmitted through various materials.
[Clarification Statement: Emphasis is on both light and
mechanical waves. Examples of models could include drawings,
simulations, and written descriptions.] [Assessment Boundary:
Assessment is limited to qualitative applications pertaining to light
and mechanical waves.]
MS-PS4-3. Integrate qualitative scientific and technical information to
support the claim that digitized signals are a more reliable
way to encode and transmit information than analog signals.
[Clarification Statement: Emphasis is on a basic understanding
that waves can be used for communication purposes. Examples
could include using fiber optic cable to transmit light pulses, radio
wave pulses in Wi-Fi devices, and conversion of stored binary
patterns to make sound or text on a computer screen.]
[Assessment Boundary: Assessment does not include binary
counting. Assessment does not include the specific mechanism
of any given device.]
MS-ESS1-1. Develop and use a model of the Earth-Sun-Moon system to
describe the cyclic patterns of lunar phases, eclipses of the
Sun and Moon, and seasons. [Clarification Statement:
Examples of models can be physical, graphical, or conceptual.]
MS-ESS3-4. Construct an argument supported by evidence for how
increases in human population and per-capita consumption
of natural resources impact Earth’s systems. [Clarification
Statement: Examples of evidence include grade-appropriate
databases on human populations and the rates of consumption of
food and natural resources (such as freshwater, mineral, and
energy). Examples of impacts can include changes to the
appearance, composition, and structure of Earth’s systems as
well as the rates at which they change. The consequences of
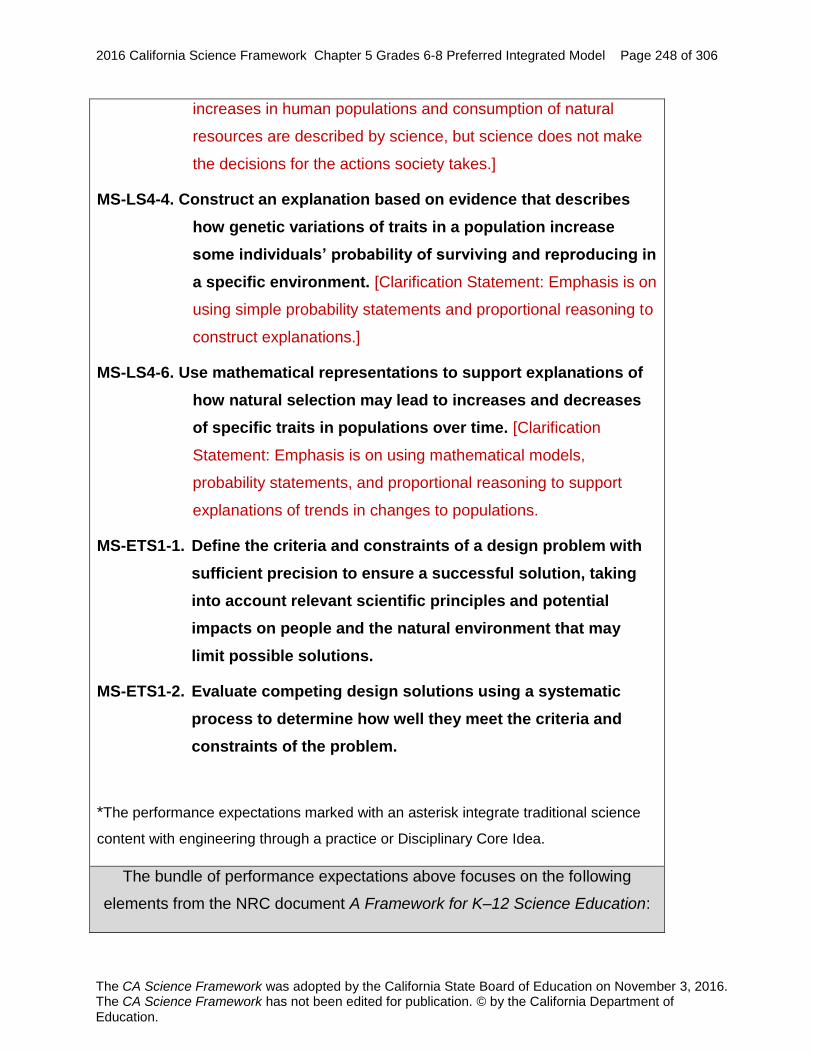
2016 California Science Framework Chapter 5 Grades 6-8 Preferred Integrated Model Page 248 of 306
The CA Science Framework was adopted by the California State Board of Education on November 3, 2016. The CA Science Framework has not been edited for publication. © by the California Department of Education.
increases in human populations and consumption of natural
resources are described by science, but science does not make
the decisions for the actions society takes.]
MS-LS4-4. Construct an explanation based on evidence that describes
how genetic variations of traits in a population increase
some individuals’ probability of surviving and reproducing in
a specific environment. [Clarification Statement: Emphasis is on
using simple probability statements and proportional reasoning to
construct explanations.]
MS-LS4-6. Use mathematical representations to support explanations of
how natural selection may lead to increases and decreases
of specific traits in populations over time. [Clarification
Statement: Emphasis is on using mathematical models,
probability statements, and proportional reasoning to support
explanations of trends in changes to populations.
MS-ETS1-1. Define the criteria and constraints of a design problem with
sufficient precision to ensure a successful solution, taking
into account relevant scientific principles and potential
impacts on people and the natural environment that may
limit possible solutions.
MS-ETS1-2. Evaluate competing design solutions using a systematic
process to determine how well they meet the criteria and
constraints of the problem.
*The performance expectations marked with an asterisk integrate traditional science
content with engineering through a practice or Disciplinary Core Idea.
The bundle of performance expectations above focuses on the following
elements from the NRC document A Framework for K–12 Science Education:

2016 California Science Framework Chapter 5 Grades 6-8 Preferred Integrated Model Page 249 of 306
The CA Science Framework was adopted by the California State Board of Education on November 3, 2016. The CA Science Framework has not been edited for publication. © by the California Department of Education.
Highlighted
Science and
Engineering Practices
[SEP-1] Asking
Questions and
Defining Problems
[SEP-2] Developing
and Using Models
[SEP-3] Planning and
Carrying Out
Investigations
[SEP-4] Analyzing and
Interpreting Data
[SEP-5] Using
Mathematics and
Computational
Thinking
[SEP-7] Engaging in
Argument from
Evidence
[SEP-8] Obtaining,
Highlighted
Disciplinary Core Ideas
PS4.A: Waves
Properties
PS4.B:
Electromagnetic
Radiation
PS4.C: Information
Technologies and
Instrumentation
ESS1.B: Earth and the
Solar System
ESS3.C: Human
Impacts on Earth
Systems
LS4.C: Adaptation
ETS1.A: Defining and
Delimiting Engineering
Highlighted
Crosscutting Concepts
[CCC-1] Patterns
[CCC-2] Cause and
Effect
[CCC-5] Energy and
Matter: Flows, Cycles,
and Conservation
[CCC-6] Structure and
Function
[CCC-7] Stability and
Change

2016 California Science Framework Chapter 5 Grades 6-8 Preferred Integrated Model Page 250 of 306
The CA Science Framework was adopted by the California State Board of Education on November 3, 2016. The CA Science Framework has not been edited for publication. © by the California Department of Education.
Evaluating, and
Communicating
Information
Problems
Highlighted California Environmental Principles & Concepts:
Principle I The continuation and health of individual human lives and of human
communities and societies depend on the health of the natural
systems that provide essential goods and ecosystem services.
Principle II The long-term functioning and health of terrestrial, freshwater,
coastal and marine ecosystems are influenced by their
relationships with human societies.
CA CCSS Math Connections: 6.RP.1,3, 6.SP.5, 6.EE.6, 7.EE.3,4, 7.RP.2,
8.F.3, MP.2, MP.4
CA ELD Connections: ELD.PI.6.1,5,6 a-b, 9,10,11a
CA CCSSELA/Literacy Connections: RST.6-8.1,9, WHST.6-8.1,2,9, SL.8.1,4,5
Students begin by watching an animation of net primary productivity, a quantity
related to the amount of photosynthesis occurring at different locations around the world
(NASA,
http://earthobservatory.nasa.gov/GlobalMaps/view.php?d1=MOD17A2_M_PSN).
Students can recognize the obvious cycles of the seasons, but they can also notice the
effects of deforestation, desertification, and climate change. For this IS, the anchoring
phenomenon is that plants go through seasonal cycles where productivity peaks in the
northern hemisphere around July and the southern hemisphere around January. During
the IS, students will explain the large seasonal signal and zoom in to design solutions
for problems causing some of the smaller scale changes. This video is remarkable not
only because of the earth system interactions captured, but also in the technology
involved in making the observations. Net primary productivity is actually a measure of
the amount of carbon dioxide released into an area. How can scientists measure the

2016 California Science Framework Chapter 5 Grades 6-8 Preferred Integrated Model Page 251 of 306
The CA Science Framework was adopted by the California State Board of Education on November 3, 2016. The CA Science Framework has not been edited for publication. © by the California Department of Education.
concentration of a gas at every point around the planet? The answer is that the carbon
dioxide gas interacts with light in certain ways so that scientists can detect the amount
of the gas in the air using a satellite with a sophisticated camera.
Students obtain information [SEP-8] about the MODIS satellite and how it
observes photosynthesis across the entire planet each month while orbiting 700 km
above the surface. The details of the sensor and the frequency of light it uses are
outside the assessment boundaries for middle school, but one of the major reasons that
DCI PS4 is so prominent in the CA NGSS is that we want our students to understand
how different wave-based technologies have completely transformed the way we do
science, communicate, and live. Before students can explain the features in the
anchoring phenomenon, they need to further develop their models of wave properties
and behavior. The vignette below uses scientific monitoring of a different life science
phenomena to introduce sound waves and other waves such as radio waves.
Integrated Grade Eight
Vignette 5.3. Waves as a Tool in Biology
Performance Expectations
Students who demonstrate understanding can:
MS-ESS3-3 Apply scientific principles to design a method for monitoring and
minimizing a human impact on the environment.* [Clarification
Statement: Examples of the design process include examining human
environmental impacts, assessing the kinds of solutions that are feasible,
and designing and evaluating solutions that could reduce that impact.
Examples of human impacts can include water usage (such as the
withdrawal of water from streams and aquifers or the construction of
dams and levees), land usage (such as urban development, agriculture,
or the removal of wetlands), and pollution (such as of the air, water, or
land).] (revisited from grade six)
MS-PS4-1. Use mathematical representations to describe a simple model for

2016 California Science Framework Chapter 5 Grades 6-8 Preferred Integrated Model Page 252 of 306
The CA Science Framework was adopted by the California State Board of Education on November 3, 2016. The CA Science Framework has not been edited for publication. © by the California Department of Education.
waves that includes how the amplitude of a wave is related to the
energy in a wave. [Clarification Statement: Emphasis is on describing
waves with both qualitative and quantitative thinking.] [Assessment
Boundary: Assessment does not include electromagnetic waves and is
limited to standard repeating waves.]
MS-PS4-2. Develop and use a model to describe that waves are reflected,
absorbed, or transmitted through various materials. [Clarification
Statement: Emphasis is on both light and mechanical waves. Examples
of models could include drawings, simulations, and written descriptions.]
[Assessment Boundary: Assessment is limited to qualitative applications
pertaining to light and mechanical waves.]
MS-ETS1-1. Define the criteria and constraints of a design problem with
sufficient precision to ensure a successful solution, taking into
account relevant scientific principles and potential impacts on
people and the natural environment that may limit possible
solutions.
*The performance expectations marked with an asterisk integrate traditional science content
with engineering through a practice or Disciplinary Core Idea.
The bundle of performance expectations above focuses on the following elements from
the NRC document A Framework for K–12 Science Education:
Highlighted
Science and Engineering
Practices
[SEP-1] Asking questions
and defining problems
Highlighted
Disciplinary Core Ideas
ESS3.C: Human Impacts
on Earth Systems
Highlighted
Crosscutting Concepts
[CCC-1] Cause and Effect

2016 California Science Framework Chapter 5 Grades 6-8 Preferred Integrated Model Page 253 of 306
The CA Science Framework was adopted by the California State Board of Education on November 3, 2016. The CA Science Framework has not been edited for publication. © by the California Department of Education.
[SEP-2] Developing and
using models
PS4.A: Wave Properties
PS4.B: Electromagnetic
Radiation
[CCC-4] Systems and
System Models
[CCC-5] Energy and
Matter
--------------------------------
Influence of Science,
Engineering, and
Technology on Society
and the Natural World
Highlighted California Environmental Principles & Concepts:
Principle II The long-term functioning and health of terrestrial, freshwater, coastal and
marine ecosystems are influenced by their relationships with human
societies.
CA CCSC Math Connections: 7.SP. 1-3, 8.SP.4
CA CCSC ELA/Literacy Connections: RI.8.2, RI.8.8, SL.8.1,4,6
CA ELD Connections: ELD.PI.8.1,2,4,6a-b,9

2016 California Science Framework Chapter 5 Grades 6-8 Preferred Integrated Model Page 254 of 306
The CA Science Framework was adopted by the California State Board of Education on November 3, 2016. The CA Science Framework has not been edited for publication. © by the California Department of Education.
Introduction
This vignette flows from IS3 where students explored the evolutionary history of
several species. Sharks are one of the most ancient vertebrate species with
approximately 400 million years of history.
Mrs. G transitions her students to the next unit on waves being mindful that she
wants to build in a strong nature of science connection to this part of the unit (Science is
a Human Endeavor: advances in technology influence the progress of science, and
Science Addresses Questions About the Natural and Material World: science
knowledge can describe consequences of actions but does not necessarily prescribe
the decisions that society takes). She decides to help her students see the application
of understanding waves in answering some of the biggest questions beach visitors,
beach city leaders, and biologists are asking today about sharks: why are we seeing so
many white sharks, Carcharodon carcharias, off the coast of California?
5E Lesson Design – This sequence is based on an iterative 5E model. See the
Instructional Strategies chapter for tips on implementing 5E lessons.
Day 1: Questioning
Claims about Shark
Encounters
Students read an article
about a string of recent
shark sightings and then
share their own tales about
sharks. They ask questions
about how they can
distinguish fact from fiction.
Day 2: Data with More
Questions than Answers
Students try to interpret a
graph of the number of
reported shark captures,
but find that many factors
influence the data set itself.
Day 3: Locating with
Sound
Students watch a video
about an autonomous
underwater vehicle that
tracks and films sharks.
They use models to
reverse-engineer how the
device locates the sharks
using sound waves.
Day 4: Obtaining Day 5–6: Light and Sound Days 7–8: What have we

2016 California Science Framework Chapter 5 Grades 6-8 Preferred Integrated Model Page 255 of 306
The CA Science Framework was adopted by the California State Board of Education on November 3, 2016. The CA Science Framework has not been edited for publication. © by the California Department of Education.
Information about Tags
Students research about
how different types of
electronic tags and
receivers that use wave
technology to collect and
transmit information to
scientists.
Students obtain information
about light and sound and
then plan an investigation
to explore the differences in
how they travel through salt
water.
learned
Students explore new
understandings from this
technology.
Days 9–10: Applying
understanding to a
different population
Students apply new
understandings and predict
possible trends in shark
populations on the East
Coast.
Days 11–12: Educating
Different Audiences
Students consider the
question, “Now that we
have better information on
white sharks, what type of
information is important for
the public to know?” to
probe thinking as to why
sharks are important and
human actions that affect
the population and create a
public service
announcement to target a
specific audience.
Day 1 – Questioning Claims about Shark Encounters (Engage)
Everyday phenomenon: Sharks have been seen at California beaches recently.
In order to pique interest and provide all students with background on a real world
phenomenon, students read a short article on recent shark sightings (Rocha 2015).

2016 California Science Framework Chapter 5 Grades 6-8 Preferred Integrated Model Page 256 of 306
The CA Science Framework was adopted by the California State Board of Education on November 3, 2016. The CA Science Framework has not been edited for publication. © by the California Department of Education.
Students excitedly share stories they have heard about white sharks, many of which are
outlandish and eventually lead to rumors about sharks attacking or eating humans. Mrs.
G simply solicits information from the students and lets the excitement in the room build.
Mrs. G then begins to direct the conversation. After everyone agrees that sometimes
people embellish stories and some things may not be true, Mrs. G asks how students
can distinguish accurate information on sharks from the fantastical stories friends and
families share. How can they tell if there are more shark encounters this year than in the
past? After several months in Mrs. G’s class, they all call out, “We need data!”
In groups, students discuss how they could build an accurate record of information
on white sharks that have visited the coast in recent history (for the past 100 years). At
the middle school level, students should be able to ask questions [SEP-1] that help
them identify evidence that can support an argument. Students struggle with this
question once they realize that Google didn’t exist 100 years ago. As she visits teams,
Mrs. G asks students to think if there was anyone who would have had consistent
access to the coast and might have documented information on sharks. Students
continue to stumble, but come up with ideas such as lifeguards or someone who lives at
the beach – but they acknowledge that they probably can’t see sharks very well from
the shore.
In one team, Minh has a different idea. She often goes to the pier to fish with her
family and sometimes catches small “sand sharks”. She explains that even her
grandfather tells stories of catching sharks when he was a small boy in Vietnam. Mrs.
G asks if Minh minds sharing with the class. As Minh begins, José’s eyes light up and
he begins frantically waving his hand. He, too, goes fishing with his uncle, who owns a
sport fishing charter boat. His uncle keeps a log of what everyone catches. When the
boat returns to the dock, they have to report what they caught on the trip, and
sometimes there is someone at the dock inspects their buckets. The class quickly
begins to realize that fisher logbooks might be a good source of information.
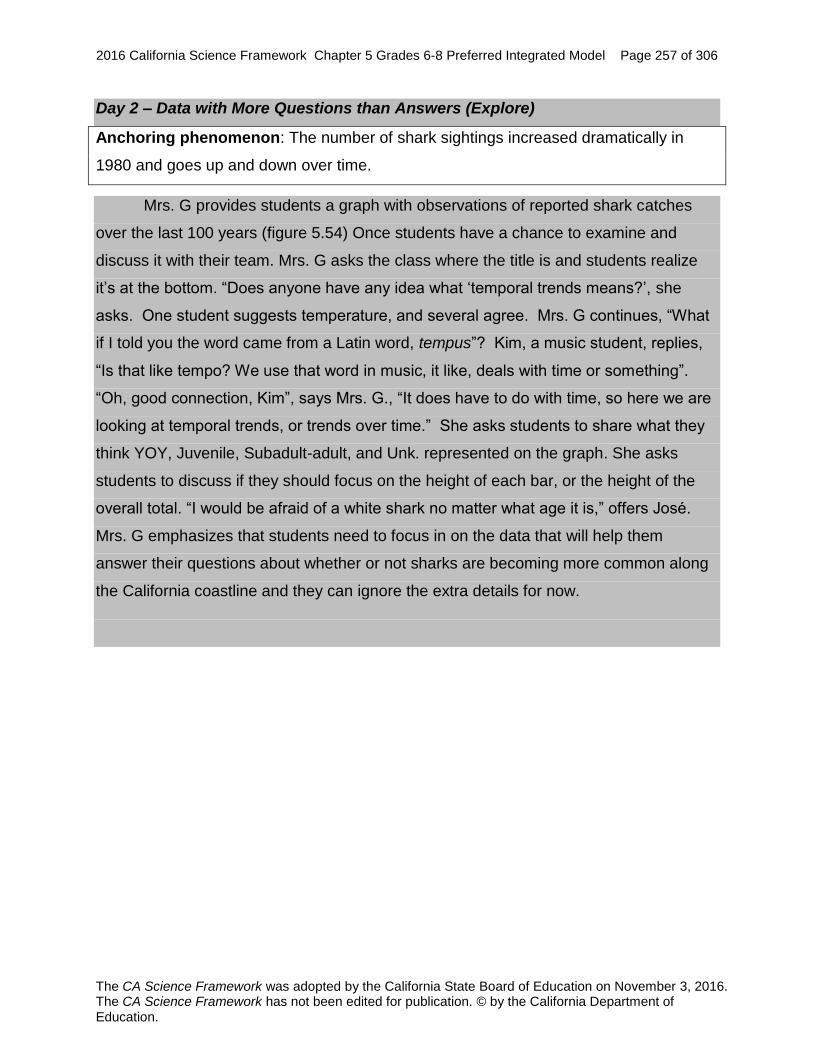
2016 California Science Framework Chapter 5 Grades 6-8 Preferred Integrated Model Page 257 of 306
The CA Science Framework was adopted by the California State Board of Education on November 3, 2016. The CA Science Framework has not been edited for publication. © by the California Department of Education.
Day 2 – Data with More Questions than Answers (Explore)
Anchoring phenomenon: The number of shark sightings increased dramatically in
1980 and goes up and down over time.
Mrs. G provides students a graph with observations of reported shark catches
over the last 100 years (figure 5.54) Once students have a chance to examine and
discuss it with their team. Mrs. G asks the class where the title is and students realize
it’s at the bottom. “Does anyone have any idea what ‘temporal trends means?’, she
asks. One student suggests temperature, and several agree. Mrs. G continues, “What
if I told you the word came from a Latin word, tempus”? Kim, a music student, replies,
“Is that like tempo? We use that word in music, it like, deals with time or something”.
“Oh, good connection, Kim”, says Mrs. G., “It does have to do with time, so here we are
looking at temporal trends, or trends over time.” She asks students to share what they
think YOY, Juvenile, Subadult-adult, and Unk. represented on the graph. She asks
students to discuss if they should focus on the height of each bar, or the height of the
overall total. “I would be afraid of a white shark no matter what age it is,” offers José.
Mrs. G emphasizes that students need to focus in on the data that will help them
answer their questions about whether or not sharks are becoming more common along
the California coastline and they can ignore the extra details for now.

2016 California Science Framework Chapter 5 Grades 6-8 Preferred Integrated Model Page 258 of 306
The CA Science Framework was adopted by the California State Board of Education on November 3, 2016. The CA Science Framework has not been edited for publication. © by the California Department of Education.
Figure 5.54. White Shark Captures in Southern California from 1935-2009
Source: Lowe et al. 2012.
Mrs. G asks students to view the data through the lens of cause and effect [CCC-
2] and record questions in their science notebooks. Using protocols they established
earlier in the year, students in each team facilitate each other in generating ideas.
Students invite each other to share an idea before any one person shares more than
one idea, and they often invite someone who is reluctant to share to be the first one to
speak. Mrs. G overhears Minh’s group. Minh restates the question for Maria, an English
Language Learner who is often reluctant to speak, “Maria, what is your question about
this?” pointing to the data in the figure, “This is effect. What happened, what cause?”
Students begin working and charting questions: Why are there so few sharks
reported before 1980? Why do the numbers of sharks reported go down in the late
1990’s – early 2000’s? Why are there so many young sharks and so few adults?
Students are then asked to narrow down to one question, and consider possible causes

2016 California Science Framework Chapter 5 Grades 6-8 Preferred Integrated Model Page 259 of 306
The CA Science Framework was adopted by the California State Board of Education on November 3, 2016. The CA Science Framework has not been edited for publication. © by the California Department of Education.
or factors that could have led to that result. Mrs. G selects one group’s chart to share
with the class because it will allow her to focus on a key issue:
Question:
• Why are there so few sharks reported before 1980?
Possible causes:
• There weren’t very many white sharks.
• People didn’t fish as much.
• Fewer people lived in California so there weren’t as many fishermen.
• There wasn’t good fishing technology before so it was harder to catch a
white shark.
• There wasn’t someone to track information and there weren’t computers
yet.
• Some people caught white sharks to sell them.
• Once people learned about sharks they were scared and they wanted to kill
sharks.
Mrs. G asks students to look at this team’s list of possible causes and divide them
into two categories: inconsistency in the data set and an actual change in the number of
sharks. Both are possible, so students need more information about their data set.
Students read an article Mrs. G adapted from a paper written by researchers at
California State University, Long Beach and the Monterey Bay Aquarium reviewing the
history of white sharks in California (Lowe et al. 2012). Each team is asked to read a
part and then report a key finding [SEP-8] on the class white board. From this,

2016 California Science Framework Chapter 5 Grades 6-8 Preferred Integrated Model Page 260 of 306
The CA Science Framework was adopted by the California State Board of Education on November 3, 2016. The CA Science Framework has not been edited for publication. © by the California Department of Education.
students comment on how messy and confusing the data can be and how there is a lot
of information they have to take into account in order to make sense of it without
misinterpreting it. For example, in some cases it might look like the white shark
population is increasing, yet at the same time the population of humans living and
playing at the coast increased, which could have resulted in increased reports. They
were shocked to learn that a movie had an impact on the data. The release of the movie
Jaws resulted in an increase in white shark reporting in the early 1980’s, as people set
out to kill white sharks. Some of this increase was due to more sharks tangled in nets
when commercial fishing as demand for human consumption and updated fishing
technology increased (EP&C II). Scientists acknowledge that relying on fishing data is
helpful because we can start to build some understanding, but it does not give them a
very clear sense of what is actually going on with respect to white shark behavior.
Day 3 – Locating with Sound (Explain)
Investigative problem: Sharks are hard to track and identify.
Mrs. G asks, “Can you think of a way we might get some more reliable data? We
can’t go back in time, but we can collect better data in the future.”
Students begin sharing ideas and Victor suggests using drones to track sharks, and
the class erupts in laughter. Mrs. G smiles and says, “Victor is on to something! Drones
work in the air, and some lifeguards have tried using a drone rather than sending a
lifeguard out on a jet ski just to see where they are. Even with a drone, however, we
can’t see the sharks if they aren’t near the surface. Can you think of something that
could work in the water”? Victor then suggests an underwater robot.
Investigative phenomenon: An underwater robot can track sharks using sound
waves.
Mrs. G shows a short video clip about the Woods Hole Oceanographic Institution’s
robotic shark tracker (underwater autonomous vehicle), REMUS (Woods Hole

2016 California Science Framework Chapter 5 Grades 6-8 Preferred Integrated Model Page 261 of 306
The CA Science Framework was adopted by the California State Board of Education on November 3, 2016. The CA Science Framework has not been edited for publication. © by the California Department of Education.
Oceanographic Institution 2014). Students record “aha moments” and questions in their
notebooks as they watch the video.
Mrs. G asks students what information about sharks they think REMUS can provide.
The excited students begin listing things like sharks are awesome, sharks can bite hard,
sharks don’t like the robot. Mrs. G asks students to turn their list of into specific
questions [SEP-1] about sharks that that they could investigate. They will return to
these questions on Day 6.
Mrs. G returns to the original question of finding and tracking sharks. It is true that
sometimes the shark came to attack the robot, but most of the time the robot goes to
seek out the sharks. The video briefly mentions that the robot has a sensor for locating
sharks based on acoustic technology (sound waves). Students are surprised that sound
can travel through water, but Mrs. G challenges them to try it out next time they are in a
swimming pool or bath tub by submerging their head and then tapping on the wall with a
metal spoon. Her students complain that they want her to prove it right now, so Mrs. G
fills up a tub of water and clinks together two metal spoons in the middle of the tub so
that students can put their ear up against the wall of the tub to hear it. Mrs. G introduces
the terminology, “sound waves are transmitted through the water” to label this
phenomenon.
Mrs. G asks students to draw a model [SEP-2] on their white board of how they
think that the robot could use sound to locate the shark. Students are pretty confused,
but Mrs. G helps prompt students to think creatively. Different groups have different
models, with some ‘listening’ for the shark with a microphone and others showing a
sonar-style device. Mrs. G tells students that the devices can only detect sharks from a
limited distance away and she has them use their model to write an explanation in their
notebook about why. She tells them that their explanation should use an energy
diagram like they learned about earlier in the year. Most students recognize that the
sound waves are a form of energy and that this energy must ‘die out’. In groups,
students discuss how to represent ‘die out’ in terms of energy and decide that the
energy must be absorbed by some other object (probably the water molecules). What
could they do to their system [CCC-4] to detect sharks from further away? Mrs. G is

2016 California Science Framework Chapter 5 Grades 6-8 Preferred Integrated Model Page 262 of 306
The CA Science Framework was adopted by the California State Board of Education on November 3, 2016. The CA Science Framework has not been edited for publication. © by the California Department of Education.
trying to get students to consider the amplitude of the sound waves and how they relate
to energy (MS-PS4-1). For a sonar system, for example, they could increase the
amplitude of the pulse they send out. Mrs. G asks students to add representations of
the sound waves to their diagram where they indicate how the amplitude changes at
different points along its path. “What would be some challenges the robot would need to
overcome in order to send out higher amplitude waves?” Students offer good ideas
about possibly disturbing the sharks or other marine wildlife with the loud noises, but
she directs them towards the idea that the robot would need to use more energy (higher
amplitude = higher energy) and would run out of batteries.
Mrs. G shows a quote from a web page that says REMUS relies on an electronic
device, a ‘transmitter tag’, attached to the shark (but her quote provides no other
details). Mrs. G asks students what they think this tag does and has them modify their
diagram to show a tag transmitting a signal that the REMUS receives. Mrs. G reminds
students how quickly cell phones run out of charge when someone talks on them
constantly and asks for students to think about how they could extend the battery life on
the tag even further. Mrs. G then shares another quote from the REMUS web page that
describes how the tags attached to the shark do not send out a constant signal, but
instead wait to receive a signal from the REMUS robot. That way, they use much less
energy in ‘standby’ mode than they would transmitting constant pulses. The sensor on
the robot records how long it takes for the sound energy to return after sending its initial
pulse, and from which direction the return pulse arrives in order to determine the sharks
distance and direction. The direction sensing works a lot like the two human ears
spaced a short distance apart (structure and function [CCC-6]; the REMUS robot
refers to this distance as an ‘ultra-short baseline’). Mrs. G has students act out the
direction sensing process by making a physical model [SEP-2] with one student
blindfolded playing the part of the robot and another playing the part of the shark. When
the robot claps, the shark claps back.
2016 California Science Framework Chapter 5 Grades 6-8 Preferred Integrated Model Page 263 of 306
The CA Science Framework was adopted by the California State Board of Education on November 3, 2016. The CA Science Framework has not been edited for publication. © by the California Department of Education.
Day 4 – Obtaining Information about Tags (Explore)
Investigative phenomenon: Some tags use radio waves to transmit information.
Now that students know that tags exist, Mrs. G tells them that these devices
attached to a shark’s fin can actually record all sorts of information and send it back to
scientists. She asks them to record ideas in their notebook about what sort of data the
tag could collect. She partners students who have mobile devices with those that don’t
to obtain information [SEP-8] about what shark tags actually measure, and suggests
they look up SPOT and PAT tags as these are commonly used on white sharks. The
students develop a list of things the tags can measure such as temperature, depth, and
light intensity. At one team, Trinh wonders aloud how this will tell them anything about
what’s going on with the shark and how we would get the information from the tag. Her
teammate, Oscar, reading from his phone, mentions that, “The SPOT tags transmit
using radio waves and so the shark would have to be at the surface to transmit to a
satellite. When it swims up to the surface, we would know where the shark is, but the
PAT tags are designed to pop off and float to the surface.” Trinh comments, “That’s
strange, why does it have to transmit at the surface? Don’t waves travel underwater?”
Day 5 – 6 Light and Sound (Explore/Explain)
Investigative phenomenon: You can hear the buzz of an electronic timer that is under
water, but a radio receiver cannot detect radio waves when it is submerged in salt
water.
Although her students have heard of radios before, the idea of thinking of these as
waves is new for them. They studied waves in grade four, but assessment was limited
to mechanical waves (4-PS4-1). For the rest of the period, Mrs. G gives the class time
to dig deeper into radio waves and sound waves and explore the phenomenon of what
happens to waves in water. She asks them to think of objects in the classroom that use
radio waves and those that use sound waves. A student thinks of a radio and grabs a
small hand-held AM/FM radio. One student questions if radio is the same as sound.
Acknowledging this, Mrs. G asks him to think of something that has sound that isn’t a

2016 California Science Framework Chapter 5 Grades 6-8 Preferred Integrated Model Page 264 of 306
The CA Science Framework was adopted by the California State Board of Education on November 3, 2016. The CA Science Framework has not been edited for publication. © by the California Department of Education.
radio. He grabs the class digital timer. Mrs. G has a large saltwater tank set-up that had
been donated to the class, already filled with a saltwater solution she made that
morning. She sets out zip-top bags and asks students to investigate [SEP-3] the
differences between radio waves and sound in water. As they work, she asks them to
record procedures, predictions of what will happen when they submerge devices, and
give a rationale for their thinking. After each team confirms everyone has their
predictions with rationale, students hold the devices in the center of the tank,
surrounded by about a foot of water on all sides. To their delight, they can no longer
hear the radio after submerging, but can hear a faint buzzer of the timer. Mrs. G has
students document the differences in how radio waves and sound waves travel through
salt water versus air in a table in their science notebooks using the terms absorbed and
transmitted.
Some of the students remember that light is a wave from grade four and wonder if it
is absorbed or transmitted in the water. After a laser safety reminder, Mrs. G
encourages students to shine a laser through the saltwater tank. They don’t notice
anything unusual, but Mrs. G tells them that there are some important effects of light
that shark taggers must consider. Mrs. G calls students back to their teams and shows
the class a photo of a researcher on a boat trying to tag a shark in the water. She asks
them to consider the challenges the researcher has in this task. Students comment that
they would be afraid to be so close to a shark and it would be hard because the boat is
moving. Mrs. G hints that there is one more challenge they might not have thought of.
She has a student from each group pick up a clear cup of water with a penny at the
bottom and bring it back to their table. She then passes out a straw to each team and
instructs the students to stand directly over the cup and quickly thrust it in to spear the
‘shark’ right on Abraham Lincoln’s eye. The students are surprised that the all miss.
Mrs. G asks them to view the straw at eye level and Victor shouts, “It’s crooked!” Mrs. G
confirms and mentions that, “what you are calling crooked scientists call refraction.”
Mrs. G then has her students use the PhET simulation, “Bending Light”
(https://phet.colorado.edu/en/simulation/bending-light) and asks students to make a
model in their notebooks of what happens when light goes from air to air, from air to
water, from air to glass. She then asks students to make three separate models [SEP-
2016 California Science Framework Chapter 5 Grades 6-8 Preferred Integrated Model Page 265 of 306
The CA Science Framework was adopted by the California State Board of Education on November 3, 2016. The CA Science Framework has not been edited for publication. © by the California Department of Education.
2] in their notebooks that predict [CCC-2] what will happen if light goes from air to an
acrylic block, from air to a wood block, and from air to an aluminum block. Once all of
the students in a team have made their predictions, they get a laser and set of blocks,
try it out, and update their models in their notebook.
Bringing students back to the challenge of tagging a shark from the surface of a
boat, she passes out an index card to each team and asks them to compose a tweet to
the @CSULBSharkLab. She promises to really tweet the best one in the class that
demonstrates an understanding of how light’s behavior makes it hard to tag sharks.
Days 7-8 Interpreting Shark Data (Explore/Explain)
Investigative phenomenon: White sharks spend lots of time near the shore where
fishing regulations prevent the use of entanglement nets.
What have scientists learned from tracking sharks? Is the shark population actually
increasing? How does this information help protect the sharks? Mrs. G designs a jigsaw
activity where teams divide up into groups of experts that obtain information [SEP-8]
to answer one the following four questions (with key highlights of what they might find in
parentheses):
As California has grown, has commercial fishing grown, too? (Fishing expanded
greatly in the 1970’s but was so successful that many fish populations crashed,
leading to increased regulations. The commercial halibut catch in California in
2015 was less than half of what it was in the 1990’s)
How do the commercial entangling nets work? (Large nets left out for as long as
several days entangle hundreds of fish at a time and sometimes catch white
sharks as well)
What laws govern commercial fishing? (In 1994, laws passed that prohibit
entangling nets in the shallow water within three miles of the coast)
What happens to a white shark when it gets caught by a fishing net? (Some die
before the net is brought back to the boat and some get released back into the
water).

2016 California Science Framework Chapter 5 Grades 6-8 Preferred Integrated Model Page 266 of 306
The CA Science Framework was adopted by the California State Board of Education on November 3, 2016. The CA Science Framework has not been edited for publication. © by the California Department of Education.
Back in their home teams, expert students teach each other about their assigned
topics. Together, students make important connections to ideas that relate to consumer
demand and certain fishing techniques impacting the food source of young great whites.
Mrs. G then passes out copies of an article from a newspaper that describes a study
conducted by a graduate student at the CSULB Shark Lab that looked at geopositioning
data from tagged juvenile white sharks (Dulaney 2013). Mrs. G carefully selects figures
from the source article (Lyons et al. 2013) and has her students analyze and interpret
[SEP-4] some of the original tracking data. They find that the young sharks spend a
surprising amount of time swimming in the shallow water where boats are prohibited
from casting nets (within 3 miles of shore). Students construct an argument from this
evidence [SEP-7] that the shark population is increasing, and that the increase is a
direct result of the laws that have created protected ‘shark nurseries.’
The tracking data also allow scientists to monitor the fate of sharks that are
accidentally caught and released (if the tracker keeps going, the shark must have
survived). Interpreting the data [SEP-4], students find that sharks have a high chance
of survival, and that the sharks are more likely to die when nets are left out for longer
periods (like 1–2 days) than when the net gets pulled in after just a few hours. They will
revisit this finding on Day 11.
Days 9-10 Applying Understanding to a Different Population (Elaborate)
Investigative phenomenon: Shark populations in Cape Cod have also changed in
recent decades.
Mrs. G tells students that as newly minted shark experts, they have been hired to
study sharks in Cape Cod, Massachusetts. They have had frequent sightings of great
white sharks in recent years, so are the same factors causing [CCC-2] a similar trend
[CCC-1] as southern California? What information would they want to know about the
Cape Cod population? Given information about abiotic factors of Cape Cod, could they
predict details about the Cape Cod population? Knowing more about the Cape Cod

2016 California Science Framework Chapter 5 Grades 6-8 Preferred Integrated Model Page 267 of 306
The CA Science Framework was adopted by the California State Board of Education on November 3, 2016. The CA Science Framework has not been edited for publication. © by the California Department of Education.
population, what type of tracking device (including details about type of wave and why)
would they design to best study them (planning an investigation [SEP-3], engaging
in argument from evidence [SEP-7])?
Days 11-12 Educating Different Audiences (Evaluate)
On the final days of the lesson sequence, Mrs. G reminds her students that there
were many misunderstanding about sharks at the beginning of their studies. She poses
a question, “Now that we have better information on white sharks, what type of
information is important for the public to know?” Students in the class have a few
moments to record their thinking in their notebooks and the class discusses. Mrs. G
asks the teams to think about what they now know and introduces them to their
challenge: to create a public service announcement to help educate different audiences
the community. Students decide which audiences would be important to target for this
message, create a storyboard to organize their message, and get to work. Groups
target the fishing industry, law makers, and the other beach visitors. Mrs. G provides a
rubric to help students focus as they work and provides check-in opportunities where
teams update her on their progress and get feedback. The students then proudly share
their PSA’s at the school’s family science night later that month.
Vignette Debrief
The overall structure of this vignette used a real-world phenomenon in life science to
motivate a technological solution using principles of physical science. In the vignette as
written, students did not get to answer all the questions introduced by the Anchoring
phenomenon because phenomena of changing shark populations and behavior are
more closely aligned with PEs in grades six (MS-LS1-4) and seven (MS-LS2-1; MS-
LS2-4). Teachers could easily extend the lesson to interpret actual data from shark
populations to resolve some of initial questions raised on Days 1–2.
2016 California Science Framework Chapter 5 Grades 6-8 Preferred Integrated Model Page 268 of 306
The CA Science Framework was adopted by the California State Board of Education on November 3, 2016. The CA Science Framework has not been edited for publication. © by the California Department of Education.
This vignette illustrates the CA NGSS vision of blending SEPs, DCIs, and CCCs.
While the lesson description describes this blend, the sections below focus on relevant
aspects of each dimension in isolation, along with ties CA CCSS and the EP&Cs.
SEPs. The students in the vignette engaged in many SEPs, thereby building a
comprehensive understanding of what it means to do science. The initial focus of the
vignette is to identify data that could help students answer a scientific question
(planning investigations [SEP-3]) and to select the appropriate technology for a
device that can provide that information (Days 1–2 and 6–7). After learning about a
puzzling phenomenon about shark populations, students ask questions [SEP-1] on
Day 2 about the shark siting data they have analyzed [SEP-4] and again on Day 3 as
they are motivated to learn about sharks. On Day 4, they develop models [SEP-2] of
how the REMUS robot transmits and receives information from the sharks. They
conduct simple investigations [SEP-3] on Days 5-6 about light, sound, and radio
waves in water. The end with a communication product [SEP-8] that presents both
their model and their investigation plan in one authentic public service announcement.
CCCs. The initial motivation for the sequence involves asking questions about
stability and change [CCC-7] on Day 2 when students examine data about shark
populations. Students eventually use the tracking data to infer the cause [CCC-2] of
these changes. In addition to this scientific problem, the vignette focuses a lot on
understanding the science and engineering aspects of the tracking devices, highlighting
how technology facilitates scientific observation as part of the Nature of Science CCC,
Influence of Science, Engineering, and Technology on Society and the Natural
World. The vignette treats shark tracking technology as a system [CCC-4] and
students trace out the flow of energy [CCC-5] (by sound and radio waves) on Days 3–
4 when students explain how REMUS and other shark tags work. The foundation box
for MS-PS4-2 attributes structure and function [CCC-6] to MS-PS4-2 because the
structure of materials determines how they will interact with light and sound, though this
CCC is not a major theme emphasized throughout the vignette.
DCIs. Shark tags send information via mechanical (sound) or electromagnetic
waves (light and radio), introducing students to basic wave properties (PS4.A). These
2016 California Science Framework Chapter 5 Grades 6-8 Preferred Integrated Model Page 269 of 306
The CA Science Framework was adopted by the California State Board of Education on November 3, 2016. The CA Science Framework has not been edited for publication. © by the California Department of Education.
waves interact with objects and the media through which they travel, being transmitted,
absorbed, or reflected (PS4.B). On Day 3, students explore the tag transmissions in
terms of energy. They identify that higher amplitude waves contain more energy
(PS4.A; MS-PS4-1) by discussing how higher amplitude signals would drain batteries
quicker because they require more energy. Students also represent how amplitude
decreases with distance as some energy gets absorbed by the water.
In helping students develop models of wave behavior, this vignette goes beyond the
assessment boundary of MS-PS4-2. That PE states that wave behavior will only be
addressed for light and mechanical waves – introducing the electromagnetic spectrum
is beyond the middle school level. Mrs. G decided that this phenomenon was
compelling and included many important aspects of the Evidence Statement for MS-
PS4-2. In Days 5-6 when students explore sound and light waves, Mrs. G specifically
avoids the discussion of the electromagnetic spectrum because the details are complex
and more appropriate for high school.
Physical science DCIs about waves are strongly tied to specific life science
questions about shark behavior. Shark tags provide data about shark behaviors that
increase their odds of survival and reproduction such as migration over large areas,
giving birth in warmer waters that influence growth rate, predatory strategies of hiding
and attacking, and cooperative hunting (LS1.B Growth and Development of Organisms).
In Integrated grade six, students constructed arguments about how such behaviors help
animals survive (MS-LS1-4), and this vignette focuses on planning an investigation
[SEP-3] using shark tags that would provide evidence for such arguments.
By confronting the environmental impact of fishing on shark populations through
monitoring (tags) and mitigation (public service announcement), students achieve MS-
ESS3-2 (revisited from grade six) and gain a better idea of human impacts on the Earth
system. This vignette’s focus on the biosphere is outside the recommendations and
intent of the clarification statement that focus on the physical aspects of Earth systems,
but since this application of the ESS principles to an LS realm is an excellent way to
revisit this grade six PE and the human impacts of ESS3.C.

2016 California Science Framework Chapter 5 Grades 6-8 Preferred Integrated Model Page 270 of 306
The CA Science Framework was adopted by the California State Board of Education on November 3, 2016. The CA Science Framework has not been edited for publication. © by the California Department of Education.
On Days 9-10, students perform some engineering design thinking where they must
select the appropriate technology (radio or sound waves) that best meets the criteria for
investigating the Cape Cod sharks (ETS1.B). In this case, students define these criteria
based on whether or not the device can transmit measurements that support the
scientific investigation (ETS1.A).
EP&Cs. Humans influence shark populations directly through fishing and
indirectly through pollution, climate change, and alterations to marine habitat (CA EP&C
II). Students discuss the effects of fishing on shark populations from Days 7-8, and then
reconsider specific actions that could minimize human impacts on Days 11-12 when
they create their final communications product.
CA CCSS Connections to English Language Arts and Mathematics. Throughout the
lesson sequence, students read informational articles to obtain information about shark
populations (RI.8.2,8). They analyze data to infer possible causes of the rise and fall of
shark populations in Southern California at various points in time (7.SP.1-3). Students
engage in structured discourse with teams, including the jigsaw activity on Days 6–7)
(SL.8.1). Students also craft a persuasive public service announcement targeting a
specific audience based on robust evidence (SL.8.4, 6).
Reference
Developed by Jill Grace
Resources
Dulaney, Josh. 2013. “CSULB Shark Lab Study: Young Great Whites Surviving Fishing
Nets.” Long Beach Press Telegram. http://www.presstelegram.com/general-
news/20130821/csulb-shark-lab-study-young-great-whites-surviving-fishing-nets
(accessed September 30, 2016).
Lowe, Christopher G., Mary E. Blasius, Erica T. Jarvis, Tom J. Mason, Gwen D.
Goodmanlowe, and John B. O’Sullivan. 2012. “Historic Fishery Interactions with
White Sharks in the Southern California Bight.” In Global Perspectives on the
Biology and Life History of the White Shark, by Michael L. Domeier. Boca Raton,
FL: CRC Press, 169–185.

2016 California Science Framework Chapter 5 Grades 6-8 Preferred Integrated Model Page 271 of 306
The CA Science Framework was adopted by the California State Board of Education on November 3, 2016. The CA Science Framework has not been edited for publication. © by the California Department of Education.
Lyons, Kady, Erica T. Jarvis, Salvador J. Jorgensen, Kevin Weng, John O’Sullivan,
Chuck Winkler, and Christopher G. Lowe. 2013. “The Degree and Result of
Gillnet Fishery Interactions with Juvenile White Sharks in Southern California
Assessed by Fishery-Independent and –Dependent Methods.” Fisheries
Research 147 (October 2013): 370–380.
Rocha, Veronica. 2015. “13 Young Great White Sharks Spotted off Huntington Beach.”
Los Angeles Times. http://www.latimes.com/local/lanow/la-me-ln-great-white-
sharks-huntington-beach-20150520-story.html (accessed September 23, 2016).
Woods Hole Oceanographic Institution. 2014. “REMUS SharkCam: The Hunter and the
Hunted.” Posted at Vimeo, https://vimeo.com/101165012 (accessed September
22, 2016).
Water Waves
Over the course of this IS, modeling activities should begin with mechanical waves
propagating in a matter medium that is visible (such as water waves), then waves that
propagate through a matter medium that is invisible (such as sound waves moving
through air), and finally wave models of light. Investigations [SEP-3] with real-world
objects can be complemented with technology. Computer or smartphone apps provide
interactive simulations of simple waves (see
http://phet.colorado.edu/en/simulations/category/physics/sound-and-waves), ripple
tanks (Falstad n.d.) or even display the waveforms of sound recorded by microphones
so that students can use their personal technology as an oscilloscope to visualize
waveforms of noises in the room.
Students investigate [SEP-3] a variety of waves they can generate and observe in
a flat-bottomed water container (ripple tank). Students observe and discuss general
wave properties that they observe including absorption, reflection, transmission of one
wave through another, and even make observations that prepare them for the high
school understanding of waves by observing how the simultaneous production of
multiple waves produces complex waveforms. Placing floating objects at the surface

2016 California Science Framework Chapter 5 Grades 6-8 Preferred Integrated Model Page 272 of 306
The CA Science Framework was adopted by the California State Board of Education on November 3, 2016. The CA Science Framework has not been edited for publication. © by the California Department of Education.
and drops of colored dye below the surface allow students to track the motion of
particles within the tank. These observations of phenomena should provoke students to
ask questions [SEP-1] about wave behaviors. Each group of students could use a
digital camera to create a short video clip of a surprising or exciting observation that
they would like to understand further. These questions can form the organizing
structure [CCC-6] for the IS, and teachers can revisit these questions and the
emerging explanations.
Waves are part of many different physical processes, but they all share some
common aspects related to shape, direction of motion, and how the motion changes
over time. By generating simple waves on a stretched rope or spring, students should
be able to describe some of these features of waves. Discussions within and among
groups can help elicit common observations about the height, speed and spacing of
waves. Similar features were probably observed in ripple tank investigations. Student
teams can then develop a model [SEP-2] of a typical wave and compare the ones they
developed with the standard diagrammatic representation of wave shape as a regularly
spaced series of peaks and valleys (figure 5.55). Students compare terms they used
with the vocabulary that is commonly used to describe the shape of a wave and how it
changes over time.
Figure 5.55. Model of a Typical Wave
Some properties that distinguish waves from each other include wavelength, amplitude,
frequency, and speed of wave movement. Diagram by M. d’Alessio

2016 California Science Framework Chapter 5 Grades 6-8 Preferred Integrated Model Page 273 of 306
The CA Science Framework was adopted by the California State Board of Education on November 3, 2016. The CA Science Framework has not been edited for publication. © by the California Department of Education.
Having become familiar with the properties of waves and developed ways to
represent and describe travelling waves, students are ready to think about and to model
waves and/or wave pulses as carriers of energy [CCC-5]. They can readily recognize
that a wave or wave pulse of water in the open ocean transmits energy (in the form of
motion of the medium): they can see the motion of the water up and down by observing
a boat bobbing at the surface (motion = kinetic energy). They can also see that more of
this up and down motion results in a higher amplitude, thus qualitatively connecting the
growth in amplitude of the wave to an increase in the energy it transmits (MS-PS4-1).
Students can make this representation quantitative by dropping different size objects
into a tank and measuring the height of waves generated (perhaps with the aid of digital
photography to allow more precise measurements of the fast-moving waves).
Students’ models [SEP-2] of wave motion, amplitude, and energy [CCC-5] can
help them explain [SEP-6] why waves break at the beach (enabling California’s famous
surfing and other beach play). Surfers know that the water in a breaking wave is moving
toward the beach (which pushes their surfboard forward), but that out beyond the
breakers, the water is not moving toward the beach! Surfers wait beyond the breakers
and bob up and down until a good wave arrives, and then they paddle forward into the
location where waves begin to break. When the water gets shallow enough, there is not
enough room for the wave to move up and down over its full amplitude, and it begins to
interact with the sand below. The wave can no longer have all its kinetic energy
continue as up and down motion, and some of the energy gets transferred into forward
motion that begins to ‘tip the wave over’ and cause it to ‘break’.
Students can investigate [SEP-3] this phenomenon in a ripple tank by introducing
a sloping bottom spanning about a third of the tank length and creating waves by
moving a flat object up and down at the other end of the tank. They can observe the
relationship between the locations where the sloped bottom begins and where waves
begin to break, and vary the slope angle to measure its effect on the waves. These
discussions and investigations are necessary since most students need help
understanding that the wave movement transfers the wave energy, but the medium of

2016 California Science Framework Chapter 5 Grades 6-8 Preferred Integrated Model Page 274 of 306
The CA Science Framework was adopted by the California State Board of Education on November 3, 2016. The CA Science Framework has not been edited for publication. © by the California Department of Education.
the wave (in this case, water) can move in a different direction than the energy flow. In a
water wave, the water moves up and down perpendicular to the energy flow. Students
can gather evidence [SEP-7] to show that the medium doesn’t move far by watching
floating corks bob up and down as waves travel across the ripple tank. Students may
cite evidence of objects washing ashore at the beach that contradicts this statement.
These objects are evidence of other processes such as ocean currents and waves
breaking (it turns out that what we call waves at the beach do not meet the standard
physical science definition of a wave – they are more complex because they interact
with the seafloor and beach itself).
Sound Waves
Sound waves introduce a different kind of wave that students can investigate
[SEP-3]. While water waves are easily recognizable as waves, students need evidence
to believe that sound transfers energy as a wave. Since students’ models of waves
include motion, they may wonder what is moving in the sound wave. Students can
readily feel the movement as sound passes through a solid. Students can also observe
the driving energy of sound by using slow-motion video clips to observe the vibrations of
speakers or by simply placing paper scraps on top of a large speaker. Students can use
these observations to develop a model [SEP-2] of sound traveling as the back and
forth motion within a solid material (figure 5.56). Students can then readily generalize
this model [SEP-2] to explain [SEP-6] how sound travels through a gas, where the
movement of air must be happening but cannot be seen.

2016 California Science Framework Chapter 5 Grades 6-8 Preferred Integrated Model Page 275 of 306
The CA Science Framework was adopted by the California State Board of Education on November 3, 2016. The CA Science Framework has not been edited for publication. © by the California Department of Education.
Figure 5.56. Model of a Sound Wave in Air
Two representations of how sound travels as a wave in air. Source: Media College n.d.
We can think of sound as a traveling wave of pressure differences in the air. The
black dots in figure 5.56 represent air molecules packed together very tightly or less
tightly. Because of [CCC-2] the vibrations in the speaker, the air varies in density in a
wave-like patterns [CCC-1]. The dots and the wave-line provide two complementary
ways to model [SEP-2] the fluctuations in the density of the air molecules. This wave
pattern of density fluctuations of air molecules causes vibrations within the ear that
result in [CCC-2] our conscious perception of sound (Integrated Grade Six MS-LS1-8).
Note that the air molecules do not travel from the source of the sound to the ear.
Students can compare similarities and differences between water waves and sound
waves. They should be able to communicate [SEP-8] using words or diagrams that
both of these wave patterns transfer energy through a medium across a distance, that
the individual particles move only a very small distance. In both cases, waves reflect or
are absorbed at various surfaces or interfaces, and two waves can pass through one
another and emerge undisturbed. In the case of a water wave, the particles move
perpendicular to the wave direction. In the case of sound wave, the particles move
parallel to the wave direction.

2016 California Science Framework Chapter 5 Grades 6-8 Preferred Integrated Model Page 276 of 306
The CA Science Framework was adopted by the California State Board of Education on November 3, 2016. The CA Science Framework has not been edited for publication. © by the California Department of Education.
A surprising phenomenon related to the transmission of energy [CCC-5] by sound
waves is the event in which a singer is able to break a glass using the sound of his/her
voice. In order to explain [SEP-6] how the glass breaks, students will model [SEP-2]
the transformation of energy and its propagation as a wave through the air to the glass.
First, they will include the vibration of the vocal cords and how that vibration is
transferred to the molecules of air. Then, they will model how that vibration travels
through space by compression and expansion of air molecule density that reaches the
glass. Finally, students’ model will represent the transfer of energy from the vibrating air
molecules to the molecules in the glass.
Light Waves
The idea that light is also a wave phenomenon can best be developed by the fact
that it shows all the behaviors of waves (reflection, absorption, transmission through a
medium such as glass, and carrying energy [CCC-5] from place to place; MS-PS4-2).
The obvious question, “what is the moving medium in a wave pattern for light?” is
difficult to answer at this grade level. In light, the ‘movement’ is actually the changing
pattern of electric and magnetic fields travelling across space or through some forms of
matter. Students know that these fields are related to energy after their investigations in
IS2, but the assessment boundaries for middle school MS-PS4-1 and MS-PS4-2
explicitly state that electromagnetic radiation (including a discussion of the
electromagnetic spectrum) is not assessed in middle school. For grade eight students,
visible light serves as a familiar form of energy and an example of how electromagnetic
radiation can transfer energy very quickly across huge distances.
Light travels in straight lines, until it encounters an object where its energy can be
absorbed, reflected back, or be transmitted through the material. Students can perform
investigations [SEP-3] to compare the different effect of mirrors and different color
paper on the path of light. Students can draw diagrams to model [SEP-2] each
situation, tracing the path of light and how energy [CCC-5] is transferred to different
objects based upon the interaction between each the light and the materials (MS-PS4-
2). In fourth grade, students already began developing a model of how light allows

2016 California Science Framework Chapter 5 Grades 6-8 Preferred Integrated Model Page 277 of 306
The CA Science Framework was adopted by the California State Board of Education on November 3, 2016. The CA Science Framework has not been edited for publication. © by the California Department of Education.
objects to be seen (4-PS4-2), and teachers should connect to that learning experience
to emphasize that reflection is crucial because we only see objects after they reflect
light back to our eyes. Eyes perceive waves with different frequencies as different
colors, and each wave’s amplitude is observed as light’s brightness.
Opportunities for ELA/ELD Connections
During the instructional segment, have students develop a sequenced set of illustrations
with accompanying content vocabulary to convey their understanding of waves.
Students can use concept maps, word webs, or graphic organizers (e.g., Frayer Model)
to identify corresponding types, examples and non-examples, definitions, illustrations of
a concept, or essential (or non-essential) characteristics. These strategies help all
learners develop effective vocabulary-learning strategies as they acquire content
knowledge.
CA CCSS ELA/Literacy Standards: RST.6–8.4; L.6–8.4
CA ELD Standards: ELD.PI.6–8.6
A Model of Seasons
Knowing that light is energy that travels in straight lines, students can develop a
model [SEP-2] of how differences in the distribution of energy flow [CCC-5] cause
seasons. Students combine models of Earth’s climate from grade six with models of the
Earth-Sun system from IS1. We know that Earth is tilted a fixed amount of 23.5° relative
to the plane of its orbit (figure 5.57) because one star in the sky barely ever moves as
the Earth rotates each night – the North Star. Students will hopefully ask, “Why is
Earth’s rotation axis tilted?” and teachers can turn this around and ask them to ask
more specific questions [SEP-1] through the lens of individual CCCs: What could
cause [CCC-2] the Earth to tilt (impact, gravitational attraction, etc…)? Do other planets
follow exhibit a similar tilt establishing a solar-system wide pattern [CCC-1]? Is the tilt

2016 California Science Framework Chapter 5 Grades 6-8 Preferred Integrated Model Page 278 of 306
The CA Science Framework was adopted by the California State Board of Education on November 3, 2016. The CA Science Framework has not been edited for publication. © by the California Department of Education.
stable, or does it change [CCC-7] – and does the timing of this change give clues to the
cause of the tilt in the first place?
Figure 5.57. Earth-Sun System Scale
A scale illustration of the Earth-Sun system (top). The Sun is 5 pixels wide and the
Earth is 1075 pixels away, but is only 0.05 pixels wide, which is too small to display. At
this scale, it is easier to recognize that rays of sunlight arrive at Earth as parallel rays at
all latitudes (bottom). Diagram by M. d’Alessio.
Students can make these connections using a physical model where their own body
represents the motion of the planet (Space Science Institute, Kinesthetic Astronomy at
http://www.spacescience.org/education/extra/kinesthetic_astronomy/). They tilt their
body towards or away from the Sun at the same 23.5° tilt as the Earth and move around
Earth’s orbit, making sure that their tilt axis always points towards the North Star. As
they move from one side of the Sun to the other, they see how the angle of the Sun’s
rays changes [CCC-7] in the different hemispheres: in the northern hemisphere
summer, the tilt brings the angle of the Sun’s rays closer to 90° while it makes the angle
smaller in the southern hemisphere. Computer simulations allow students another way
to visualize these changes (NOAA, Seasons and Ecliptic Simulator,
https://www.climate.gov/teaching/resources/seasons-and-ecliptic-simulator).

2016 California Science Framework Chapter 5 Grades 6-8 Preferred Integrated Model Page 279 of 306
The CA Science Framework was adopted by the California State Board of Education on November 3, 2016. The CA Science Framework has not been edited for publication. © by the California Department of Education.
Learning a scientifically accurate model for the seasons is often impeded by
students’ incoming preconceptions (documented vividly in the short documentary
Private Universe, Harvard-Smithsonian Center for Astrophysics, at
http://www.learner.org/resources/series28.html?pop=yes&pid=9 and in review articles at
http://dx.doi.org/10.3847/AER2010035). Most notably, students often incorrectly believe
that the Earth is closer to the Sun in summer and farther in winter. In this example
course sequence, seasons are deliberately placed in a separate IS from the discussion
of orbits in order to increase the association between seasons and Sun angle instead of
reinforcing an incorrect connection between seasons and orbital distance. Nonetheless,
many students will still harbor this preconception and it must be addressed. Interactive
3-D simulations have been shown to help students confront this preconception2. In
these virtual worlds, students view the Sun-Moon-Earth system [CCC-4] from various
viewpoints and control different aspects, including rotation and revolution rates, and
inclination of Earth’s spin axis. The story of seasons is mostly a story of light and energy
absorption. Emphasis should be placed on the intensity and duration that sunlight
shines on a particular patch of Earth’s surface. Because Earth’s tilt causes the Sun to
appear to travel across the sky along a different path during summer versus winter, the
Sun shines for longer days (causing longer duration sunlight) and from higher angles in
the sky (causing more sunlight appear more intense in a given patch of the surface).
Together, these give rise to warmer summers and cooler winters.
Students return to the anchoring phenomenon and explain [SEP-6] the dramatic
seasonal shifts in primary productivity in the two hemispheres during a year. By using
simple computer applets, they can determine the total amount of solar energy per
square meter that different cities receive during each month of the year. They use these
quantitative [CCC-3] data as evidence to support their explanation [SEP-6] of why the
primary productivity remains high year round near the equator. They continue to ask
questions [SEP-1] about some of the specific features they observe in the movie,
2 Something similar to this simulation is located here: http://astro.unl.edu/naap/motion1/animations/seasons_ecliptic.html, but it is described in Bakas and Mikropoulos 2003

2016 California Science Framework Chapter 5 Grades 6-8 Preferred Integrated Model Page 280 of 306
The CA Science Framework was adopted by the California State Board of Education on November 3, 2016. The CA Science Framework has not been edited for publication. © by the California Department of Education.
many of which remain unanswered but could inspire further investigation in the
capstone project at the end of the IS.
Integrated Grade Eight Snapshot 5.9. School Solar Energy Project
Anchor Problem: How much energy will solar panels on our school rooftop provide?
Mr. S invites a rooftop solar panel installer to visit his classes. In the days before her
visit, the students prepare a list of questions [SEP-1] about the factors that affect the
amount of energy the panels can generate. When she arrives, she gives a short
presentation about solar energy and then goes onto the roof to make measurements.
The installer emphasizes the importance of the angle of the Sun and that buildings with
a flat roof like the school need a special platform that tilts the solar panels towards the
Sun. A few days later, the solar installer sends the results from computer calculations to
Mr. S with graphs of the amount of energy the panels will collect at different times
during the year based on the position of the Sun and nearby trees that shade the panels
(EP&C III). Students draw models [SEP-2] of light traveling in straight lines from the
Sun to the rooftop (PS4.B), indicating how trees will absorb the solar energy when the
Sun is in some positions but not in others based on its predictable movement
throughout the day and year (ESS1.A). In essence, students are repeating the
investigations of shadows from grade one (1-ESS1-1) with a more sophisticated level of
understanding.
Investigative Phenomenon: Solar panels produce different amounts of energy at
different times of year.
The class works to interpret [SEP-4] the graphs so that they can explain [SEP-6]
the systematic variations during the year (ESS1.A) using their models [SEP-2] of the
Earth-Sun system (MS-ESS1-1) and the paths of light (PS4.B) from the Sun to the Earth
(MS-PS4-2). They draw models [SEP-2] that illustrate how the angle of the Sun’s rays
affects the amount of energy converted to electricity much like this angle affects Earth’s
temperature throughout the seasons and at different latitudes (MS-ESS2-6). Their

2016 California Science Framework Chapter 5 Grades 6-8 Preferred Integrated Model Page 281 of 306
The CA Science Framework was adopted by the California State Board of Education on November 3, 2016. The CA Science Framework has not been edited for publication. © by the California Department of Education.
models also show how trees absorb light energy when the Sun is in some positions but
not in others based on its predictable movement throughout the day and year. In
essence, students are repeating their investigations of shadows from grade one (1-PS4-
3; 1-ESS1-1) with a more sophisticated level of understanding.
Mr. S has arranged for the students to present the information to the local school
board that makes decisions about how money is spent (EP&C V). Different groups set
to work on an executive summary, a presentation, and a poster that communicate
[SEP-8] the report’s findings. Through a peer review and feedback process, the class
revises each product and selects a team of students to make the formal presentation.
The school board votes unanimously to allocate funds to install solar panels and the
students track the installation progress. The following year, the students analyze the
actual energy production from their panels from day to day and month to month to
recognize the patterns [CCC-1] in solar energy input.
Waves Can Encode and Transmit Information
How exactly does the MODIS satellite detect the amount of CO2 in the air and
transmit this information back to Earth? After having researched water waves, sound,
light and electromagnetic radiations (EM), students can be challenged to summarize the
characteristics of each of these with respect to:
• wavelength/frequency;
• amplitude; and
• wave speed.
The students work in groups, share their drafts across groups, critique each other based
on evidence, and compare finished drafts with respect to advantages and
disadvantages. Table 5.4 illustrates one kind of summary.

2016 California Science Framework Chapter 5 Grades 6-8 Preferred Integrated Model Page 282 of 306
The CA Science Framework was adopted by the California State Board of Education on November 3, 2016. The CA Science Framework has not been edited for publication. © by the California Department of Education.
Table 5.4. Characteristics of Waves
Type of Wave Wavelength/Frequency
Associated With
Amplitude
Associated With
Water wave Physical distance between
top of water waves
Height of the
physical wave
Sound wave Pitch of the sound Loudness of
the sound
Light wave Color of the light
Brightness of
the light
All EM Waves Type of EM wave (x-ray,
UV, light, IR, microwave)
Intensity of that EM
wave
Table by Dr. Art Sussman, courtesy of WestEd.
A different summary might highlight other features of waves: 1) Waves are repeating
quantities; 2) Waves interact with materials by being transmitted, absorbed, or reflected;
3) Waves can transfer energy [CCC-5] over long distances without long-distance
movement of matter; and 4) Waves can be used to encode and transmit information.
Once students recognize that light and sound are waves, they can communicate
[SEP-8] that even in the absence of modern technologies, each of us is constantly
interacting with invisible waves of energy. All the information and experiences that we
get through sight or hearing comes to us as waves that our senses and nervous
systems enable us to detect and experience. A string-and-tin-can “telephone” or a
stringed instrument can provide a quick and very direct experience that waves can
communicate information.
Students can research and report on how early technological devices captured
sounds, images and other information in very mechanical ways. For examples, clocks

2016 California Science Framework Chapter 5 Grades 6-8 Preferred Integrated Model Page 283 of 306
The CA Science Framework was adopted by the California State Board of Education on November 3, 2016. The CA Science Framework has not been edited for publication. © by the California Department of Education.
had an inside pendulum whose movements resulted in the hour and minute hands
going round and round. Thomas Edison captured words and music by using a needle to
convert the waves of air vibrations into bumps and valleys that he engraved into wax or
tin. Then a needle on a sound player could respond to the engraved bumps and valleys,
and create vibrations that he amplified back into the original sound. Photographers
reproduced images by capturing and focusing light on material embedded with
chemicals that reacted to the presence of light.
Students can compare the advantages and disadvantages of the earliest
mechanisms of transmitting information to the beginning ages of radio to today’s
wireless cell phones and tablets. Historical examples of encoded information in wave
pulses (e.g., drum or smoke signals, the invention of Morse code and early telegraph
systems) can be helpful to develop both the idea of information in a waveform and the
idea of encoding information. Finding out about and understanding the difference
between an AM and an FM radio signal may serve as an activity. Students should be
able to model [SEP-2] the conversions starting with the vocal chords of a singer in a
studio to sound waves to electromagnetic radio waves being transmitted through
antennas or wires to a radio device that converts those electromagnetic waves back to
vibrations in a mechanical speaker eventually resulting in a person hearing the song in
the comfort of her home.
Today’s advanced technologies such as cell phones and tablets use digital means to
encode and transmit sound and images. Students are probably aware that pictures they
see on a screen are encoded in pixels. Each pixel is a very tiny colored dot that is so
close to its neighbors that the viewer sees what looks like a sharp, perfectly smooth
image. A typical medium-quality photo on a screen may consist of 400 vertical rows of
pixels, and each row may have 300 pixels located horizontally next to each other (a total
of 120,000 pixels).
Figure 5.58 shows a wave line that corresponds to the color of 300 pixels in one
horizontal line of a photo. The height of that line at any point specifies the color intensity
at a point along the line. The horizontal position specifies where that point is horizontally
located on the line. The rectangular boxes sample the average value of the color at

2016 California Science Framework Chapter 5 Grades 6-8 Preferred Integrated Model Page 284 of 306
The CA Science Framework was adopted by the California State Board of Education on November 3, 2016. The CA Science Framework has not been edited for publication. © by the California Department of Education.
thirteen different locations, and summarize the color at each of those thirteen locations
as a number. Specifying the color of only 16 pixels along a horizontal line would result in
a very fuzzy image. For a medium-quality photo image, the wave would be averaged at
300 different locations to obtain 300 numbers that specify the color of each pixel on that
horizontal line. That process would be repeated vertically 400 times to have a specific
color designation for each of the 120,000 pixels that make up a beautiful screen image.
Figure 5.58. Digitizing a Screen Picture
The features of an electromagnetic wave can be converted into numbers that change
over a spatial location. These numbers can then be converted into computer-friendly
digital formats so a very clear image can be displayed on a screen. Diagram by M.
d’Alessio and A. Sussman
When an image or a sound has been entirely represented by numbers, we say that it
has been digitized. Computers store data as a sequence of zeros and ones. The zeros
and ones are called digits, which is why the files of information are called digital files.
These digital files can hold an incredible amount of information in a very small space.
For example, one tablet can store in its memory a large number of books, audio CDs
and even movie files. In addition, each of these digital files can be copied, edited
(changed), and transmitted.

2016 California Science Framework Chapter 5 Grades 6-8 Preferred Integrated Model Page 285 of 306
The CA Science Framework was adopted by the California State Board of Education on November 3, 2016. The CA Science Framework has not been edited for publication. © by the California Department of Education.
Digital technologies enable people today to obtain and manipulate information in
previously unimaginable ways. Students should be able to evaluate the claim [SEP-7]
that digitized signals offer significant advantages with respect to encoding and
transmitting information (MS-PS4-3). In the vignette that concludes the middle school
progression, student groups engage with a design challenge focused on sustaining
Earth’s systems in which they use and evaluate information [SEP-8] at least one
digital technology in researching their challenge and designing their solution [SEP-6].
Integrated Grade Eight Vignette 5.4. Student Capstone Projects
Performance Expectations
MS-ESS3-4. Construct an argument supported by evidence for how increases in
human population and per-capita consumption of natural resources
impact Earth’s systems. [Clarification Statement: Examples of evidence
include grade-appropriate databases on human populations and the rates
of consumption of food and natural resources (such as freshwater,
mineral, and energy). Examples of impacts can include changes to the
appearance, composition, and structure of Earth’s systems as well as the
rates at which they change. The consequences of increases in human
populations and consumption of natural resources are described by
science, but science does not make the decisions for the actions society
takes.] (Revisited from grade six)
MS-PS4-3. Integrate qualitative scientific and technical information to support the
claim that digitized signals are a more reliable way to encode and
transmit information than analog signals. [Clarification Statement:
Emphasis is on a basic understanding that waves can be used for
communication purposes. Examples could include using fiber optic cable
to transmit light pulses, radio wave pulses in Wi-Fi devices, and
conversion of stored binary patterns to make sound or text on a computer

2016 California Science Framework Chapter 5 Grades 6-8 Preferred Integrated Model Page 286 of 306
The CA Science Framework was adopted by the California State Board of Education on November 3, 2016. The CA Science Framework has not been edited for publication. © by the California Department of Education.
screen.] [Assessment Boundary: Assessment does not include binary
counting. Assessment does not include the specific mechanism of any
given device.]
MS-LS4-4. Construct an explanation based on evidence that describes how
genetic variations of traits in a population increase some individuals’
probability of surviving and reproducing in a specific environment.
[Clarification Statement: Emphasis is on using simple probability
statements and proportional reasoning to construct explanations.]
MS-ETS1-1 Define the criteria and constraints of a design problem with sufficient
precision to ensure a successful solution, taking into account
relevant scientific principles and potential impacts on people and the
natural environment that may limit possible solutions.
MS-ETS1-2 Evaluate competing design solutions using a systematic process to
determine how well they meet the criteria and constraints of a
problem.
Highlighted
Science and Engineering
Practices
[SEP-2] Developing and
Using Models
[SEP-4] Analyzing and
Interpreting Data
[SEP-6] Constructing
Highlighted
Disciplinary Core Ideas
ESS3.C Human Impacts
on Earth Systems
PS4.C Information
Technologies and
Instrumentation
Highlighted
Crosscutting Concepts
[CCC-1] Patterns
[CCC-2] Cause and Effect

2016 California Science Framework Chapter 5 Grades 6-8 Preferred Integrated Model Page 287 of 306
The CA Science Framework was adopted by the California State Board of Education on November 3, 2016. The CA Science Framework has not been edited for publication. © by the California Department of Education.
Explanations (for
science) and Designing
Solutions (for
engineering)
[SEP-7] Engaging in
Argument from Evidence
[SEP-8] Obtaining,
Evaluating, and
Communicating
Information
LS4.B Natural Selection
ETS1.A Defining and
Delimiting Engineering
Problems
Highlighted California Environmental Principles & Concepts:
Principle I The continuation and health of individual human lives and of human
communities and societies depend on the health of the natural systems that
provide essential goods and ecosystem services.
Principle II The long-term functioning and health of terrestrial, freshwater, coastal and
marine ecosystems are influenced by their relationships with human
societies.
Principle III Natural systems proceed through cycles that humans depend upon, benefit
from and can alter.
Principle IV The exchange of matter between natural systems and human societies
affects the long term functioning of both.
Principle V Decisions affecting resources and natural systems are complex and involve
many factors.

2016 California Science Framework Chapter 5 Grades 6-8 Preferred Integrated Model Page 288 of 306
The CA Science Framework was adopted by the California State Board of Education on November 3, 2016. The CA Science Framework has not been edited for publication. © by the California Department of Education.
Connections to the CA CCSSM: 8.SP.2,4
Connections to CA CCSS for ELA/Literacy: RST.6–8.1, 2, 7, 9; RI.8.3; SL.8.1, 4, 6;
WHST.6-8.2,7-9
Connection to CA ELD Standards: ELD.PI.6-8.1, 9
Introduction
By the end of grade eight, students can approach new phenomena, recognize how
different parts of the Earth system are interacting in the situation, draw on DCIs from all
disciplines of science and engineering to explain the mechanisms driving these
interactions, and design solutions to problems that they identify and constrain. This
capstone project puts them to work at using all their understanding from grades K–8.
Day 1: Analyzing Per
Capita Consumption
Students calculate per
capita consumption of
different countries, develop
and critique different ways
of communicating these
data, and ask questions
about trends they see.
Day 2: Introducing
Capstone Projects
Ms. D provides the
background about the
capstone project and
students read and discuss
five environmental case
studies.
Day 3: Focus on
Solutions
Students read about five
case studies of
communities that have
developed solutions to
environmental problems.
Students brainstorm ideas
for their capstone projects.

2016 California Science Framework Chapter 5 Grades 6-8 Preferred Integrated Model Page 289 of 306
The CA Science Framework was adopted by the California State Board of Education on November 3, 2016. The CA Science Framework has not been edited for publication. © by the California Department of Education.
Days 4–8: Collaborative
Work Sessions
Teams work collaboratively
and the teacher helps focus
and guide students.
Day 9: Project
Presentations
Students prepare final
presentations for a school
science night.
Day 10: Synthesis
Students from different
project groups combine
together to identify common
elements in the projects
and identify how the
projects relate to the
EP&Cs.
Day 1 – Analyzing Per Capita Consumption
Anchoring phenomenon: Different countries consume radically different amounts of
energy per capita.
How many people live on Planet Earth? Where in the world do they live? Ms. D
facilitates the discussions and appropriately guides them towards information about
specific countries (e.g., the United States, China, Mexico) and also about parts of the
world (e.g., Africa, Pacific Islands, Europe). She charts their comments, and then asks
students if they have any ideas about which areas consume the most resources and
why. After a while, students conclude that for each country or continental area, they
should probably get quantitative [CCC-3] data about total consumption and per-capita
consumption.
Ms. D provides each group of students with information about world populations
(available at: Data from the Population Reference Bureau report accessed at
http://www.prb.org/pdf13/2013-population-data-sheet_eng.pdf) and about consumption
of natural resources in the year 2013. In both cases, the datasets include information at
the country level (e.g., Brazil) and at a regional level (e.g., South America). The
consumption data are reported as the number of millions of metric tons of carbon
dioxide emitted from the consumption of energy resources (see Data from the U.S.
Energy Information Administration accessed at

2016 California Science Framework Chapter 5 Grades 6-8 Preferred Integrated Model Page 290 of 306
The CA Science Framework was adopted by the California State Board of Education on November 3, 2016. The CA Science Framework has not been edited for publication. © by the California Department of Education.
http://www.eia.gov/cfapps/ipdbproject/IEDIndex3.cfm?tid=90&pid=44&aid=8). Since the
total amount of data from the sources is somewhat overwhelming and also not 100
percent consistent with respect to country/region designations, Ms. D had compiled the
data to cover seven distinct regions, and had highlighted within each region significant
representative countries.
Student groups analyze the data [SEP-4] that Ms. D had provided, calculating
[SEP-5] per-capita consumption as the ratio of the emissions and population and then
develop a poster to communicate [SEP-8] the differences to their classmates. Some
student groups choose color-coding maps to compare per-capita consumption. Other
groups superimpose on global maps pictorial ways to represent total consumption by a
country or region. This representation helps them compare geographic size with
consumption total. A less visually-oriented group creates a summary table (table 5.14).
Table 5.14. Per-Capita Consumption
Region
(An example
country)
Population
in 2013
Total CO2 Emitted
in 2013
Per-Capita
Emission of CO2
number of people tons tons/person/year
Africa 1,100 million 1,268 million 1
(Nigeria) (174 million) (96 million) (0.5)
Asia 4,302 million 18,909 million 4
(China) (1,357 million) (10,246 million) (8)
East Europe 295 million 2,713 million 9
(Russia) (144 million) (1,789 million) (12)
West Europe 190 million 1,466 million 8

2016 California Science Framework Chapter 5 Grades 6-8 Preferred Integrated Model Page 291 of 306
The CA Science Framework was adopted by the California State Board of Education on November 3, 2016. The CA Science Framework has not been edited for publication. © by the California Department of Education.
(Germany) (81 million) (759 million) (9)
South America 401 million 1,188 million 3
(Brazil) (196 million) (502 million) (3)
Middle East 251 million 1,716 million 7
(Saudi Arabia) (30 million) (543 million) (18)
North America 352 million 5,660 million 16
(USA) (316 million) (5,184 million) (16)
Table by Dr. Art Sussman, courtesy of WestEd with data from the Population Reference
Bureau 2013 and Population Reference Bureau 2016
The whole class then does a gallery walk where they examine each of the posters
and listen to the group’s presentation about their chart. The students discuss the
benefits and disadvantages of each representation of the data. Students ask questions,
and write down notes about specific pieces of the data that they notice in each
representation. After the gallery walk and while the charts are still visible, the whole
class discusses the most important patterns [CCC-1] of per-capita consumption, and
Ms. D invites students to propose evidence-based claims [SEP-7]. Some students
notice a pattern [CCC-1] that some small countries, particularly in the Middle East,
have the highest levels of per capita emission. For example, Kuwait had a per-capita
emission rate of 37 tons of CO2 per person per year. They make a claim that this
extremely high rate results from Kuwait’s large role as a producer, refiner and exporter
of fossil fuel resources, and cite as evidence [SEP-7] correlations with other countries
that produce and export large amounts of fossil fuels.
Throughout the year, Ms. D has posters along her wall with illustrations of
California’s Environmental Principles and she asks students to refer to them now. She
asks her students which EP&Cs might apply to the data set they analyzed. One student
suggests EP&C II (The long-term functioning and health of terrestrial, freshwater,

2016 California Science Framework Chapter 5 Grades 6-8 Preferred Integrated Model Page 292 of 306
The CA Science Framework was adopted by the California State Board of Education on November 3, 2016. The CA Science Framework has not been edited for publication. © by the California Department of Education.
coastal and marine ecosystems are influenced by their relationships with human
societies). She facilitates a brief class discussion about the concepts associated with
that principle. Several students observe that their data seemed to support the idea that
the growth of human populations is directly related to the amount of resources humans
consume (EP&C II, concept a).
Day 2 – Introducing Capstone Projects
Motivated by these observations about human consumption and questions about the
possible impacts this consumption has on the rest of Earth’s systems, Ms. D introduces
student group projects that will conclude their immersion in middle school science.
Student teams will choose a specific human activity that has an environmental impact
and explore it using all three dimensions of the CA NGSS as they experienced them
throughout all three middle school grades. She organizes her expectations around the
SEPs:
• obtain and evaluate information [SEP-8] about a specific phenomenon in
which human activities are impacting one or more Earth systems;
• analyze data [SEP-4] related to the impacts on Earth systems, and identify
how they demonstrate the California EP&Cs;
• construct explanations and design solutions [SEP-6] related to those
human activities and impacts;
• analyze design solutions [SEP-4] with respect to their criteria and constraints
associated with successful implementation;
• model [SEP-2] how digital technologies can assist with gathering data,
implementing solutions, and/or communicating results;
• argue using evidence [SEP-7] to evaluate and refine their solutions; and
• communicate the scientific and/or technical information [SEP-8] related to
their project and their proposed solution.

2016 California Science Framework Chapter 5 Grades 6-8 Preferred Integrated Model Page 293 of 306
The CA Science Framework was adopted by the California State Board of Education on November 3, 2016. The CA Science Framework has not been edited for publication. © by the California Department of Education.
To help establish a shared background within and across the student groups, Ms. D
provides five different illustrated readings that she had made based on the Living Planet
Report 2014 from the World Wildlife Fund (World Wildlife Fund 2014). Students work in
teams of two to initially process the information in one of the readings and then combine
into larger groups focused on that reading. These groups then make presentations to
the whole class, followed by discussions about the individual topics and how those
topics connect with each other around the theme of human impacts on Earth systems.
The five readings focus on cause and effect [CCC-2] and stability and change [CCC-
7] as they relate to:
• an overall decline in biodiversity of 52 percent between 1970 and 2010 resulting
from habitat modification, over-exploitation, pollution and invasive species;
• the ways that climate change can magnify the negative impacts on biodiversity;
• how humans currently converting more nitrogen from the atmosphere into
“reactive forms” than all terrestrial processes combined;
• the claim that humanity’s demand for natural resources currently exceeds the
capacity of land and sea areas to regenerate those resources; and
• analyzing data [SEP-4] comparing the “Ecological Footprints” of high-income
countries and low-income countries.
Day 3 – Focus on Solutions
Ms. D transitions to a focus on solutions by sharing seven brief readings from the
Living Planet Report 2014. Each reading describes positive strategies that a specific
community has implemented to preserve natural resources, produce better, and
consume more wisely. While they were evaluate information [SEP-8] in these
readings in teams and as a whole class, students begin to brainstorming potential
solutions related to the impacts in the first set of readings. Student facilitators help
summarize and display notes on these potential solutions.

2016 California Science Framework Chapter 5 Grades 6-8 Preferred Integrated Model Page 294 of 306
The CA Science Framework was adopted by the California State Board of Education on November 3, 2016. The CA Science Framework has not been edited for publication. © by the California Department of Education.
Students then start meeting in groups to develop projects. Groups share their initial
ideas with each other and with the teacher. These ideas and the partnering of students
are in flux for a while until they solidify into specific project teams. Four teams focus on
climate change but have different geographical contexts (the Arctic, Pacific Atolls, and
two in California). Another team focuses on protecting the California freshwater shrimp,
an endangered species living in a stream near the school, while another team focuses
on reducing the school’s energy consumption. After Ms. D approves the request of
students to broaden the topics to include other concepts they had covered in grade
eight, two groups choose asteroid impact deflection to protect the planet, and a third
group chooses genetic engineering as a general way to increase food supplies.
Days 4-8 – Collaborative Work Sessions
The schedule for the work on student projects include designated dates when
groups share their current status with each other. This sharing greatly broadens the
learning from the projects about the topics as well as expanding the feedback to the
student groups. During these sessions, each group focuses on reporting about their
project through the lens of one or two CCCs. The CCCs help guide student thinking and
lead them to ask specific types of questions (see Chapter 1 of this Framework for
examples).
Day 9 – Poster Presentations
At the end of the projects, student groups across the different grade eight classes
present posters of their projects at a school science evening program.
Some highlights from the projects include public outreach and monitoring water quality
in a local stream to help protect the California freshwater shrimp. Students share that
this organism was an example of the four main HIPPO (Habitat loss, Invasive species,
Pollution, Population growth, Overexploitation) categories of activities that threaten
biodiversity. People have altered its habitat by building dams, and also overharvesting
timber and gravel along the stream banks. In addition, people have stocked streams

2016 California Science Framework Chapter 5 Grades 6-8 Preferred Integrated Model Page 295 of 306
The CA Science Framework was adopted by the California State Board of Education on November 3, 2016. The CA Science Framework has not been edited for publication. © by the California Department of Education.
with invasive nonnative fish species and polluted the water. The students propose plans
to increase public awareness related to stream overharvesting and pollutions practices,
and identify constraints that need to be addressed in reducing these practices. (CA
EP&C II; See the EEI unit “Extinction: Past and Present”
http://californiaeei.org/framework/sci/Extinction for more information and a lesson on
HIPPO).
The genetic engineering group make an analogy between genetic code with the
encoding involved in digital files. They claim that genetic code is neither analog nor
digital, but instead was uniquely biological and provide the evidence that the language
of DNA includes four “digits” instead of just the two options in the binary codes of digital
communication. In addition, they provide evidence for claims [SEP-7] that genetic
engineering of food crops does not significantly endanger personal health (e.g., cancer)
but a key design constraint in genetic engineering is that solutions must not endanger
the health of ecosystems (CA EP&C V).
The school energy group visits a school in a different district that has been
recognized as a “green school”. They analyze and compare energy consumption
data [SEP-4] from their school and the “green school”, and make recommendations
based on those analyses. In addition, they share information [SEP-8] about digital
tools that schools use to monitor and reduce energy consumption by improving the
efficiency of lighting and heating. The team identifies specific reduction goals as their
criteria for success as well as detailed plans to achieve those goals. They identify a
constraint that energy budgets and decisions are made at the district level rather than
the school level. (California Environmental Principle V)
One of the asteroid impact teams change projects. They had remembered that the
HHMI BioInteractive website about the impact crater had included remote digital data
that had originally identified the crater in the Yucatan. While checking other links, they
discover that the HHMI BioInteractive website includes conservation efforts at the
Gorongosa National Park in Mozambique
(http://www.hhmi.org/biointeractive/gorongosa-national-park). The students explain that
this park provides a case study in ecology and conservation science. They are
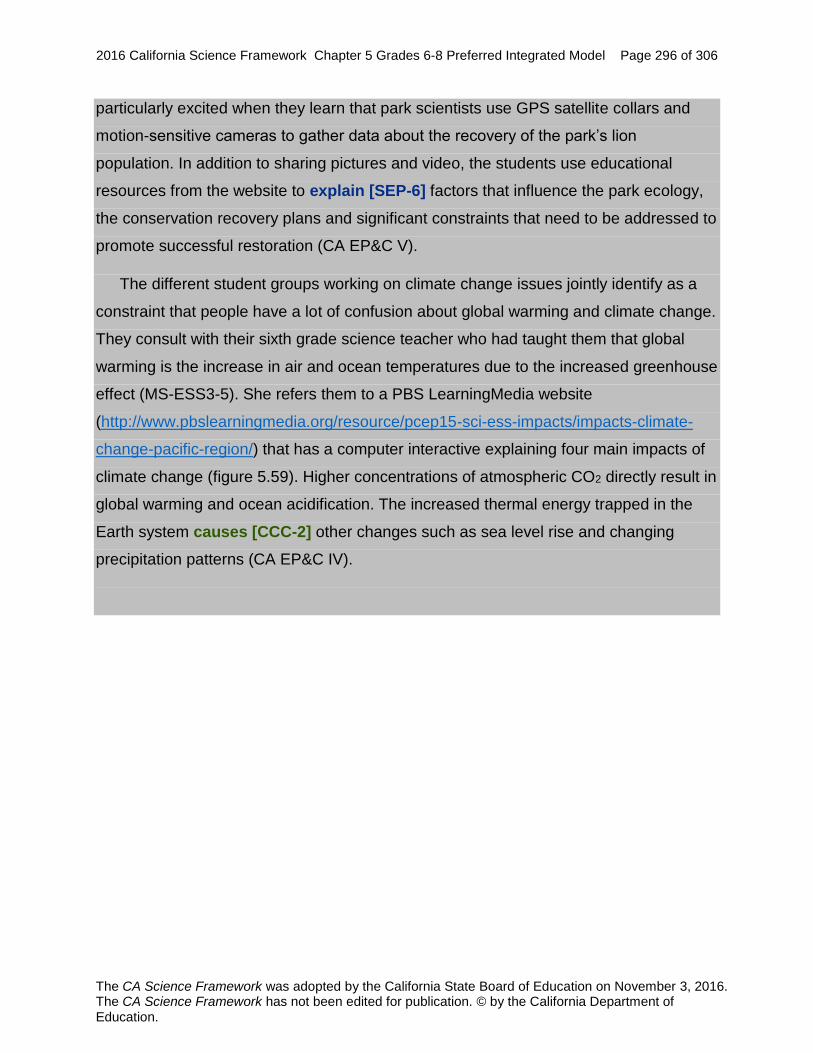
2016 California Science Framework Chapter 5 Grades 6-8 Preferred Integrated Model Page 296 of 306
The CA Science Framework was adopted by the California State Board of Education on November 3, 2016. The CA Science Framework has not been edited for publication. © by the California Department of Education.
particularly excited when they learn that park scientists use GPS satellite collars and
motion-sensitive cameras to gather data about the recovery of the park’s lion
population. In addition to sharing pictures and video, the students use educational
resources from the website to explain [SEP-6] factors that influence the park ecology,
the conservation recovery plans and significant constraints that need to be addressed to
promote successful restoration (CA EP&C V).
The different student groups working on climate change issues jointly identify as a
constraint that people have a lot of confusion about global warming and climate change.
They consult with their sixth grade science teacher who had taught them that global
warming is the increase in air and ocean temperatures due to the increased greenhouse
effect (MS-ESS3-5). She refers them to a PBS LearningMedia website
(http://www.pbslearningmedia.org/resource/pcep15-sci-ess-impacts/impacts-climate-
change-pacific-region/) that has a computer interactive explaining four main impacts of
climate change (figure 5.59). Higher concentrations of atmospheric CO2 directly result in
global warming and ocean acidification. The increased thermal energy trapped in the
Earth system causes [CCC-2] other changes such as sea level rise and changing
precipitation patterns (CA EP&C IV).
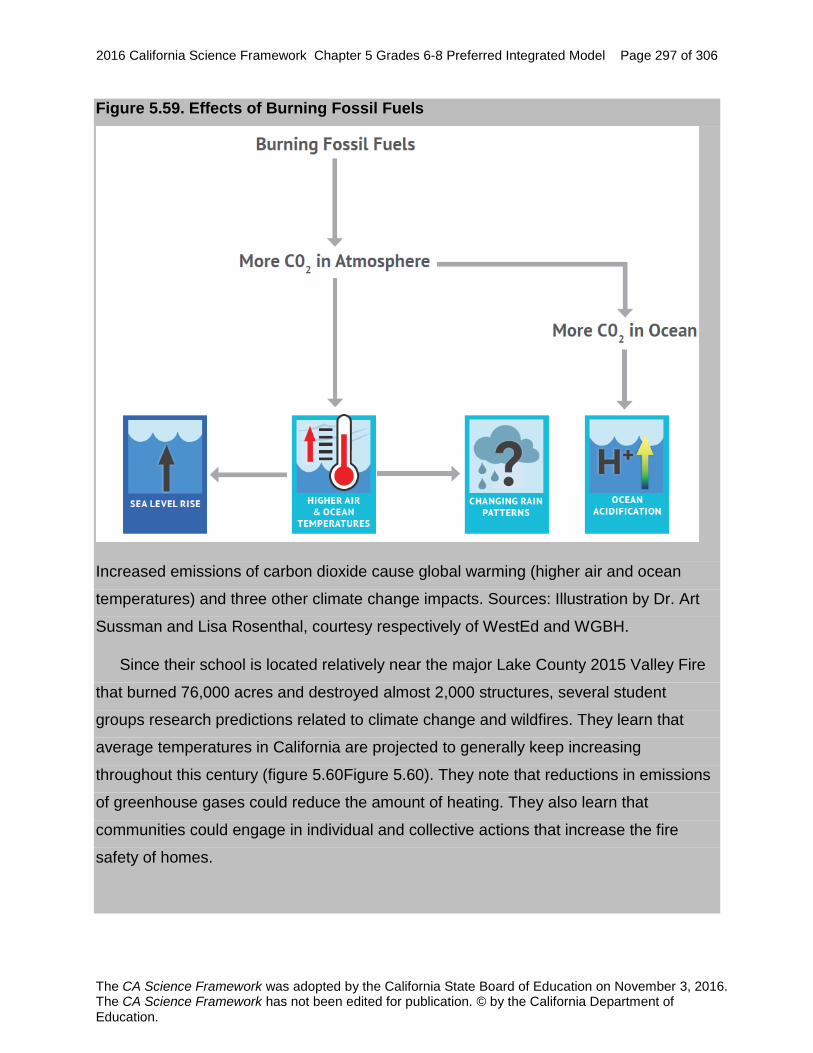
2016 California Science Framework Chapter 5 Grades 6-8 Preferred Integrated Model Page 297 of 306
The CA Science Framework was adopted by the California State Board of Education on November 3, 2016. The CA Science Framework has not been edited for publication. © by the California Department of Education.
Figure 5.59. Effects of Burning Fossil Fuels
Increased emissions of carbon dioxide cause global warming (higher air and ocean
temperatures) and three other climate change impacts. Sources: Illustration by Dr. Art
Sussman and Lisa Rosenthal, courtesy respectively of WestEd and WGBH.
Since their school is located relatively near the major Lake County 2015 Valley Fire
that burned 76,000 acres and destroyed almost 2,000 structures, several student
groups research predictions related to climate change and wildfires. They learn that
average temperatures in California are projected to generally keep increasing
throughout this century (figure 5.60Figure 5.60). They note that reductions in emissions
of greenhouse gases could reduce the amount of heating. They also learn that
communities could engage in individual and collective actions that increase the fire
safety of homes.

2016 California Science Framework Chapter 5 Grades 6-8 Preferred Integrated Model Page 298 of 306
The CA Science Framework was adopted by the California State Board of Education on November 3, 2016. The CA Science Framework has not been edited for publication. © by the California Department of Education.
Figure 5.60. Projected Changes to California’s Average Temperature
Projected increases in statewide annual temperatures during this century. Source:
Moser, Ekstrom, and Franco 2012.
The Pacific Atoll climate change group report about the Marshall Islands, which had
been a territory of the United States. They share information about its geography, and
using digital tools to video conference with a school on the island of Majuro. The group
explains that the approximately 60,000 Marshall Islanders were severely threatened by
sea level rise. The highest natural points on the islands are generally just 3 meters (10
feet) above sea level. During the period the schools communicate with each other, a
King Tide causes serious flooding in the area of the Majuro School. The group
presentation includes explanations [SEP-6] of how climate change causes [CCC-2]
sea levels to rise, and how scientists remotely measure sea level around the globe via
satellites equipped with digital tools. Their engineering design challenge focuses on
ways communities can protect beaches and homes from rising sea levels. Like the other
student groups, they want to learn more about ways to reduce the amount of climate

2016 California Science Framework Chapter 5 Grades 6-8 Preferred Integrated Model Page 299 of 306
The CA Science Framework was adopted by the California State Board of Education on November 3, 2016. The CA Science Framework has not been edited for publication. © by the California Department of Education.
change caused by human activities. (EEI Curriculum unit “The Greenhouse Effect on
Natural Systems” http://californiaeei.org/framework/sci/Greenhouse provide additional
resource materials on climate change and greenhouse gases.)
Day 10 – Synthesis
In each of the three middle school grades, students learned about the EP&Cs that
had been adopted by the California State Board of Education. For the final lesson
related to the student projects, students form groups that consist of students who had
worked on at least three of the different projects. Each of these new groups then
discuss what they had done or heard about that relates to each of the EP&Cs. Students
then share their ideas in a whole class discussion. They are surprised how many of
them identify Principle V as something they had seen but not really understood until
they had to think about engineering criteria and constraints related to reducing their
specific environmental impact. They conclude that decisions affecting resources and
natural systems are definitely based on a wide range of considerations and decision-
making processes.
Vignette Debrief
This vignette illustrates the CA NGSS vision of blending SEPs, DCIs, and CCCs.
While the lesson description describes this blend, the sections below focus on relevant
aspects of each dimension in isolation, along with ties CA CCSS and the EP&Cs:
SEPs. Scientists typically use all SEPs to fully understand a new phenomena,
though they may focus on one practice at a time during the course of a project. Typical
educational settings mirror this focus by isolating certain tasks to focus on building
specific skills. In a capstone project where students confront an entirely new
phenomena and have the time to fully pursue it, students should fully employ all SEPs.
For this reason, Ms. D explicitly organizes her project criteria around all the SEPs.
DCIs. The vignette integrated major concepts in Earth Science (Human Impacts
and Earth systems), Physical Science (Information Technologies and Instrumentation),
Life Science (Natural Selection), and Engineering Design (Defining and Delimiting
Engineering Problems). Different project groups focused on problems that were more

2016 California Science Framework Chapter 5 Grades 6-8 Preferred Integrated Model Page 300 of 306
The CA Science Framework was adopted by the California State Board of Education on November 3, 2016. The CA Science Framework has not been edited for publication. © by the California Department of Education.
closely related to DCIs in one or two disciplines, though the project criteria required that
students consider human impacts (ESS3), include digital technology (PS4.C),
engineering design (ETS).
CCCs. The CCC’s are a series of big, overarching issues that scientists consider
when they approach a new phenomenon. Since the students will be engaging in a very
big science and engineering problem that is new to them, the CCCs provide a critical
scaffold. Presentations during the collaborative work sessions on Days 4-8 focus on
viewing the projects through individual CCCs.
CA CCSS ELA, Math, and CA ELD. The capstone projects and surrounding
structure in the vignette are heavily focused on gathering and synthesizing information
from informational texts about environmental problems (RST.6–8.1, 2, 7, 9; RI.8.3;).
Student groups analyze data, calculating the per-capita consumption as the ratio of the
emissions and population. They look for patterns in the data and make evidence-based
claims about what they observe (8.SP.2,4). The entire project is structured to promote
student discourse in small groups and in formal presentations (SL.8.1, 4, 6). Students
then create written and visual communications products that summarize their process
and findings (WHST.6-8.2,7-9)
EP&Cs. By the end of grade eight, students are able to focus on much broader
issues than they did back in kindergarten. The entire capstone project is designed to
draw together all of the EP&Cs. Even though this framing is intentional, Ms. D still
devotes specific time on Day 1 and again on Day 10 to identifying which EP&Cs apply
to the situations.
Vignette Resources
Moser, Susanne, Julia Ekstrom, and Guido Franco. 2012. Our Changing Climate 2012.
Sacramento: California Climate Change Center.
World Wildlife Fund. 2014. Living Planet Report 2014. Gland, Switzerland. WWF
International.

2016 California Science Framework Chapter 5 Grades 6-8 Preferred Integrated Model Page 301 of 306
The CA Science Framework was adopted by the California State Board of Education on November 3, 2016. The CA Science Framework has not been edited for publication. © by the California Department of Education.
References
Achieve. 2010. International Science Benchmarking Report: Taking the Lead in Science
Education: Forging Next-Generation Science Standards. Washington, D.C.: Achieve.
American Geophysical Union. 2011. “New Paper on Landslide-Dams and Genetic
Change in Fish.” http://blogs.agu.org/landslideblog/2011/11/15/new-paper-on-landslide-dams-and-genetic-change-in-fish/ (accessed September 30, 2016).
Bakas, Christos, and Tassos A. Mikropoulos. 2003. “Design of Virtual Environments for
the Comprehension of Planetary Phenomena Based on Students' Ideas.” International Journal of Science Education 25 (8).
Beccario, Cameron. 2016. Earth. https://earth.nullschool.net/ (accessed September 6,
2016). Benda, Lee, and Thomas Dunne. 1997. "Sediment Routing by Debris Flow." Erosion
and Sedimentation in the Pacific Rim (Proceedings of the Corvallis Symposium, August 1987). IAHS-AISH publication 165: 213–223.
California Department of Water Resources. 2015. California Data Exchange Center.
http://cdec.water.ca.gov/cdecstation/ (accessed October 26, 2016).
Callaham, Robert Z. 1962. “Chapter 20: Geographic Variability in Growth of Forest Trees.” In Tree Growth, edited by Theodore T. Kozlowski. New York: Ronald Press Company: 311–325. http://www.treesearch.fs.fed.us/pubs/32866 (accessed September 13, 2016).
Cambridge College Primary Science. 2017.
https://cambridgecollegeprimaryscience.wikispaces.com/ Chau, Kevin. 2016. “A Search Gone Cold.” SQ Online (2015-16).
https://sqonline.ucsd.edu/2016/05/a-search-gone-cold/ Climate Charts. 2007. Average Annual Temperature. http://www.climate-
charts.com/World-Climate-Maps.html#temperature (accessed July 28, 2016). Cornwell, Paige. 2014. "State, Tribal Officials Keep Watch on Mudslide’s Effect on
Fish." The Seattle Times. http://www.seattletimes.com/seattle-news/state-tribal-officials-keep-watch-on-mudslidersquos-effect-on-fish/ (accessed September 30, 2016).
Cowan, Richard. 2000. “Tracking the Course of Evolution: The K-T Extinction.” In
History of Life, by Richard Cowan. Boston: Blackwell Science.

2016 California Science Framework Chapter 5 Grades 6-8 Preferred Integrated Model Page 302 of 306
The CA Science Framework was adopted by the California State Board of Education on November 3, 2016. The CA Science Framework has not been edited for publication. © by the California Department of Education.
Cretekos, Chris J., Ying Wang, Eric D. Green, NISC Comparative Sequencing Program,
James F. Martin, John J. Rasweiler IV, and Richard R. Behringer. 2008. “Regulatory Divergence Modifies Limb Length between Mammals.” Genes and Development 22 (2): 141–151.
Daehler, Kirsten, Mayumi Shinohara, and Jennifer Folsom. 2011a. Making Sense of
SCIENCE: Energy. San Francisco: WestEd. ———. 2011b. Making Sense of SCIENCE: Force and Motion. San Francisco: WestEd. Daehler, Kirsten, and Jennifer Folsom. 2015. Making Sense of SCIENCE: Genes and
Traits. San Francisco: WestEd. ———. 2013. Making Sense of SCIENCE: Earth Systems. San Francisco: WestEd. Darling-Hammond, Linda. 2000. “Teacher Quality and Student Achievement: A Review
of State Policy Evidence.” Education Policy Analysis Archives 8 (1). Environmental Management 2016 Wiki. 2016. https://y9-environmental-management-
sg.wikispaces.com/ Exploratorium Teacher Institute. 2016. Science Snacks: Gas Model.
https://www.exploratorium.edu/snacks/gas-model
Falstad, Paul. N.d. Virtual Ripple Tank. http://www.falstad.com/ripple/ (accessed
September 6, 2016). Folsom, Jennifer, and Kirsten Daehler. 2012. Making Sense of SCIENCE: Land and
Water. San Francisco: WestEd. Gemini Observatory. 2008. Twin Galaxies in a Gravitational Embrace.
http://www.gemini.edu/twinspiral (accessed September 19, 2016). Genetic Science Learning Center, University of Utah. N.d. Homeotic Genes and Body
Patterns. http://learn.genetics.utah.edu/content/basics/hoxgenes/ (accessed October 21, 2016).
Geology Cafe. 2012. Precipitation and Relief Map of California.
http://geologycafe.com/california/maps/california_precipitation&relief1.htm (accessed October 20, 2016).
Gewin, Virginia. 2003. "Genetically Modified Corn—Environmental Benefits and Risks."
PLoS Biology 1 (1): e8.

2016 California Science Framework Chapter 5 Grades 6-8 Preferred Integrated Model Page 303 of 306
The CA Science Framework was adopted by the California State Board of Education on November 3, 2016. The CA Science Framework has not been edited for publication. © by the California Department of Education.
Grant, Peter R., and B. Rosemary Grant. 2014. 40 Years of Evolution: Darwin's Finches on Daphne Major Island. Princeton: Princeton University Press.
Howard Hughes Medical Institute. 2014. The Origin of Species: The Beak of the Finch.
http://www.hhmi.org/biointeractive/origin-species-beak-finch (accessed February 8, 2017).
InquireBotany. N.d. “Can You See the Difference between Wind Pollinated and Insect
Pollinated Flowers?” http://www.inquirebotany.org/uploads/files/lesson%20plan_wind%20and%20insect%20pollination(NBGB).pdf (accessed September 13, 2016).
Intergovernmental Panel on Climate Change (IPCC). 2014. Climate Change 2014:
Impacts, Adaptation, and Vulnerability: Working Group II Contribution to the Fifth Assessment Report of the Intergovernmental Panel on Climate Change. New York: Cambridge University Press.
Janulaw, Al, and Judy Scotchmoor. 2011. UCMP Lessons: Clipbirds.
http://www.ucmp.berkeley.edu/education/lessons/clipbirds/ (accessed October 24, 2016).
Keeley, Page, Francis Eberle, and Joyce Tugel. 2007. Uncovering Student Ideas in
Science: Vol. 2, 25 More Formative Assessment Probes. Arlington, VA: NSTA Press.
Keller, Gerta. 2011. "The Cretaceous–Tertiary Mass Extinction: Theories and
Controversies." SEPM Special Publication 100: 7–22. Klausmeyer, Kirk, and Katherine Fitzgerald. 2012. Where Does California’s Water
Come From? Land Conservation and the Watersheds that Supply California’s Drinking Water. A Science for Conservation Technical Brief. An unpublished report of The Nature Conservancy. San Francisco, CA.
Lawson, Ruth. 2007. “Anatomy and Physiology of Animals Various Vertebrate Limbs.”
Posted at Wikimedia Commons, https://commons.wikimedia.org/wiki/File:Anatomy_and_physiology_of_animals_Various_vertebrate_limbs.jpg (accessed September 7, 2016).
Lim, Elliot. 2008. “Age of Oceanic Lithosphere.” Posted at Wikimedia Commons,
https://commons.wikimedia.org/wiki/File:2008_age_of_ocean_plates.png Mackey, Benjamin H., Joshua J. Roering, and Michael P. Lamb. 2011. “Landslide-
Dammed Paleolake Perturbs Marine Sedimentation and Drives Genetic Change in Anadromous Fish.” Proceedings of the National Academy of Sciences of the United States of America 108 (47): 18905–18909. http://www.pnas.org/content/108/47/18905 (accessed October 20, 2016).

2016 California Science Framework Chapter 5 Grades 6-8 Preferred Integrated Model Page 304 of 306
The CA Science Framework was adopted by the California State Board of Education on November 3, 2016. The CA Science Framework has not been edited for publication. © by the California Department of Education.
Media College. N.d. Sound Waves. http://www.mediacollege.com/audio/01/sound-
waves.html (accessed July 26, 2016).
Meléndez, A. and Molina, E. 2008. “The Cretaceous-Tertiary (KT) Boundary.” In
Contextos Geológicos Españoles, edited by Angel García-Cortés, José Agueda Villar, Jaime Palacio Suarez-Valgrande, and Carlos I Salvador Gonzalez. Madrid: Publicaciones del Instituto Geológico y Minero de España, 107–113. http://wzar.unizar.es/perso/emolina/pdf/MelendezMolina2008chapter9IGME.pdf (accessed September 14, 2016).
Meyer, Walter H. 1938. “Yield of Even-Aged Stands of Ponderosa Pine.” U.S.
Department of Agriculture Technical Bulletin 630. http://www.fire.ca.gov/resource_mgt/downloads/forestry/yield_tables/YieldTableEvenagedPonderosaPineMeyer.pdf (accessed September 13, 2016).
NASA. 2008. Chapter 4. Angle of Light Rays and Surface Distribution: A Structured-
Inquiry Activity. https://www.nasa.gov/centers/langley/pdf/245895main_MeteorologyTeacherRes-Ch4.r3.pdf (accessed September 7, 2016).
———. 2014. All Dry on the Western Front.
http://earthobservatory.nasa.gov/IOTD/view.php?id=82910 (accessed September 12, 2016).
———. 2016. GISS Surface Temperature Analysis (GISTEMP).
http://data.giss.nasa.gov/gistemp/ (accessed September 7, 2016). NASA/Goddard Space Flight Center. 2008. “Blue Marble (Planet Earth).” Posted at
Flickr by woodleywonderworks, https://www.flickr.com/photos/wwworks/2222523486/
National Research Council. 1995. Effects of Past Global Change on Life. Washington,
D.C.: National Academies Press. Netburn, Donna. 2016. “Dinosaurs were in Decline Long before the Chicxulub Asteroid
Finished Them off.” http://www.latimes.com/science/sciencenow/la-sci-sn-dinosaur-decline-before-asteroid-20160418-story.html (accessed February 8, 2017).
NGSS Lead States. 2013. Appendix F – Science and Engineering Practices in the
NGSS. http://www.nextgenscience.org/sites/default/files/Appendix%20F%20%20Science%20and%20Engineering%20Practices%20in%20the%20NGSS%20-%20FINAL%20060513.pdf (accessed October 20, 2016).
2016 California Science Framework Chapter 5 Grades 6-8 Preferred Integrated Model Page 305 of 306
The CA Science Framework was adopted by the California State Board of Education on November 3, 2016. The CA Science Framework has not been edited for publication. © by the California Department of Education.
Ninjatacoshell. 2009. “Keichousaurus Hui Fossil.” Posted at Wikimedia Commons, https://commons.wikimedia.org/wiki/File:Keichousaurus_hui_fossil.JPG
Pearce, Andrew J., and Alex John Watson. 1986. "Effects of Earthquake-Induced
Landslides on Sediment Budget and Transport over a 50-yr Period." Geology 14 (1): 52–55.
Pittsburgh City Photographer. 1917. 15 Years of Typhoid.
http://historicpittsburgh.org/islandora/object/pitt%3A715.174433.CP (accessed September 7, 2016).
Population Reference Bureau. 2013. World Population Data Sheet.
http://www.prb.org/pdf13/2013-population-data-sheet_eng.pdf (accessed January 4, 2017).
———. 2016. World Population Data Sheet. http://www.prb.org/pdf16/prb-wpds2016-
web-2016.pdf (accessed January 4, 2017). Rathbun, J.A., J.R. Spencer, A.G. Davies, R.R. Howell, and Lionel Wilson. 2002. “Loki,
Io: A Periodic Volcano.” Geophysical Research Letters 29. (10): 84-1–84-4. Rohde, Robert A., and Richard A. Muller. 2005. "Cycles in Fossil Diversity." Nature 434
(7030): 208–210. Roth, Mitchel. 1997. “Cholera, Community, and Public Health in Gold Rush Sacramento
and San Francisco”. Pacific Historical Review 66 (4): 527–551. Ruggerone, Gregory. 2008. "Evaluation of Salmon and Steelhead Migration after a
Landslide on the Sultan River. Phase I: Fish Passage Assessment.” Prepared for Snohomish County Public Utility District 1.
Sadler, Philip, Gerhard Sonnert, Harold P. Coyle, Nancy Cook-Smith, Jaimie L. Miller.
2013. “The Influence of Teachers’ Knowledge on Student Learning in Middle School Physical Science Classrooms.” American Educational Research Journal. 50 (5): 1020–1049.
Sherriff, Robert. 2015. “Middle School Madness Part 2: Integrated Science versus
Coordinated Science.” California Classroom Science 28: 10/11. Summey, Barbara. N.d. The Hadley Effect. Southwest Climate Network. From the
NASA Goddard Visualization Analysis Lab. http://www.southwestclimatechange.org/figures/hadley_cells
Sussman, Art. 2000. Dr. Art’s Guide to Planet Earth. White River Junction, VT: Chelsea
Green Publishing Company.

2016 California Science Framework Chapter 5 Grades 6-8 Preferred Integrated Model Page 306 of 306
The CA Science Framework was adopted by the California State Board of Education on November 3, 2016. The CA Science Framework has not been edited for publication. © by the California Department of Education.
———. 2006. Dr. Art’s Guide to Science. San Francisco: Jossey-Bass. Swanson, F.J., R.L. Fredriksen, and F.M. McCorison. 1982. "Material Transfer in a
Western Oregon Forested Watershed." In Analysis of Coniferous Forest Ecosystems in the Western United States, by Robert L. Edmonds. Stroudsburg, Pa: Hutchinson Ross Publishing Company, 233–266.
Thebiologyprimer. 2015. “Relationship between Latitude vs. Temperature and
Precipitation.” Posted at Wikimedia Commons, https://commons.wikimedia.org/wiki/File:Relationship_between_latitude_vs._temperature_and_precipitation.png (accessed September 13, 2016).
Tkgd2007. 2008. “Human Evolution.” Posted at Wikimedia Commons,
https://commons.wikimedia.org/wiki/File:Human_evolution.svg United States Geological Survey (USGS). 1988. “Landslides, Floods, and Marine
Effects of the Storm of January 3-5, 1982, in the San Francisco Bay Region, California.” USGS Professional Paper 1434.
———. 1995. Inventory of Landslides Triggered by the 1994 Northridge, California
Earthquake. USGS Open File Report 95-213. http://pubs.usgs.gov/of/1995/ofr-95-0213/ (accessed September 29, 2016).
———. 1999. Snider-Pellegrini Wegener Fossil Map.
http://pubs.usgs.gov/gip/dynamic/continents.html (accessed October 20, 2016). University of Wisconsin. 2010. UW Extension AG Weather. http://agwx.soils.wisc.edu/ U.S. Energy Information Administration. 2012. International Energy Statistics.
http://www.eia.gov/cfapps/ipdbproject/IEDIndex3.cfm?tid=90&pid=44&aid=8 (accessed October 20, 2016).
Viégas, Fernanda, and Martin Wattenberg. 2016. Wind Map. http://hint.fm/wind/
(accessed September 6, 2016). Wegener, Alfred. 1912. “The Origins of Continents.” Translated by Roland von Huene.
International Journal of Earth Sciences 91: S4–S17. Zimmer, Carl. 2016. “From Fins into Hands: Scientists Discover a Deep Evolutionary
Link.” https://www.nytimes.com/2016/08/18/science/from-fins-into-hands-scientists-discover-a-deep-evolutionary-link.html?_r=1 (accessed February 8, 2017).