chapter 5 population ecology. counting individuals what constitutes an individual organism?
TRANSCRIPT
Chapter 5
Population Ecology
Counting individuals What constitutes an individual organism?

Variations on the individual Unitary organisms - one zygote per
embryo produces one organism
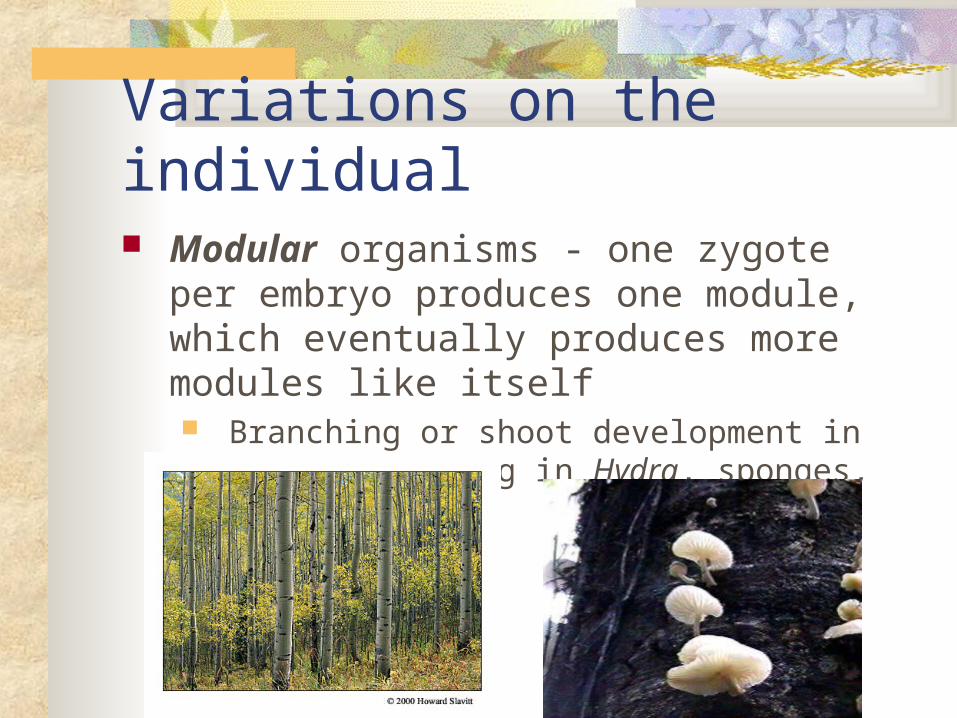
Variations on the individual Modular organisms - one zygote per embryo
produces one module, which eventually produces more modules like itself Branching or shoot development in plants, budding
in Hydra, sponges, fungi

How to count individuals in a population Some organisms - possible to easily count
all individuals Others must be subsampled and estimated
Plants and some animals - quadrat Soil, water dwellers - volume Animals - mark and recapture

Mark and recapture Random sample Release Try to recapture
Theory - marked individuals will remix within population; proportion marked in next sample represents proportion in entire population

Mark and recapture example
Population size (N)#marked on Day 1
= Total catch on Day 2# of recaptures
N = (# marked on Day 1) x (Total catch on Day 2)# of recaptures

Gilmore Creek Brown Trout200 m stream reach = 840 m2 area4.2 m average stream width
Day 1: 169 trout captured, marked, releasedDay 2: 178 trout captured
80 marked (recaptures), 98 unmarked
N = (# marked ) x (total catch Day 2)# of recaptures
N = 169 x 178 = 377 trout 377 trout/840 m2 = 80 0.45 trout m2
Life cycles Patterns of birth, death, growth are dictated
by an organism’s life cycle 5 main types of life cycles

Life cycle types Annual Overlapping iteroparity Overlapping semelparity Continuous semelparity Continuous iteroparity

Semelparous Individual organism has single
reproductive event during its life, then dies Invests large amount of energy in
reproduction

Iteroparous Individual may have many reproductive
events during season or life Invests lesser proportion of resources in
reproduction

Annuals 12 months or less to complete life cycle Discreet, non-overlapping generations May or may not overwinter as non-seed/egg May be either semelparous or iteroparous Annual may be a misnomer for some plants with
seeds that do not always germinate the year after being produced Seeds may lie dormant in seed bank for several years
before germinating
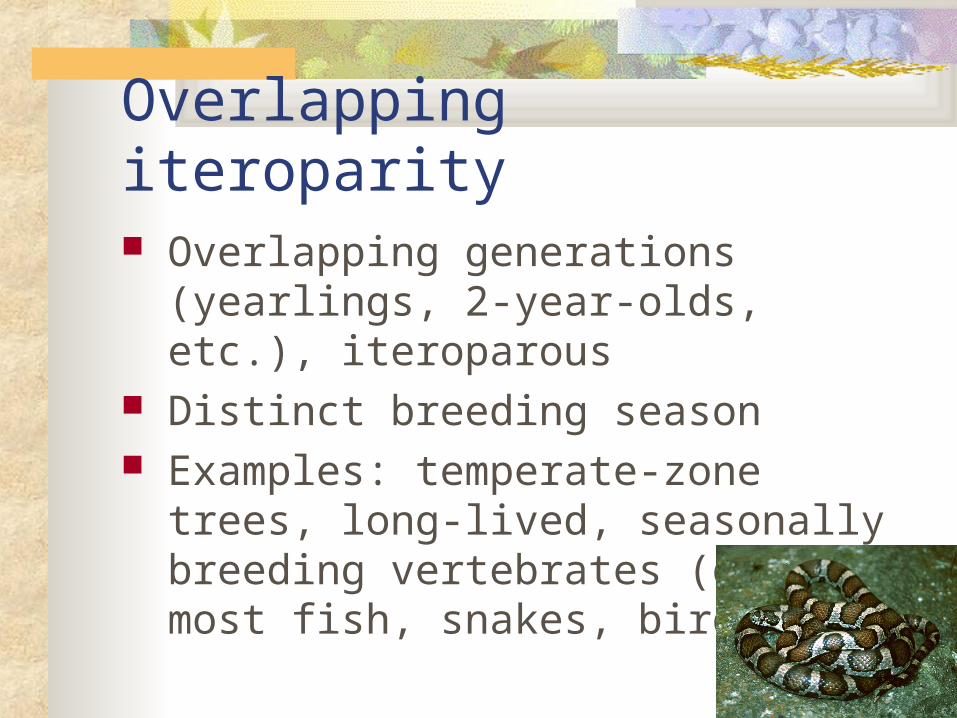
Overlapping iteroparity Overlapping generations (yearlings, 2-
year-olds, etc.), iteroparous Distinct breeding season Examples: temperate-zone trees, long-
lived, seasonally breeding vertebrates (deer, most fish, snakes, birds)
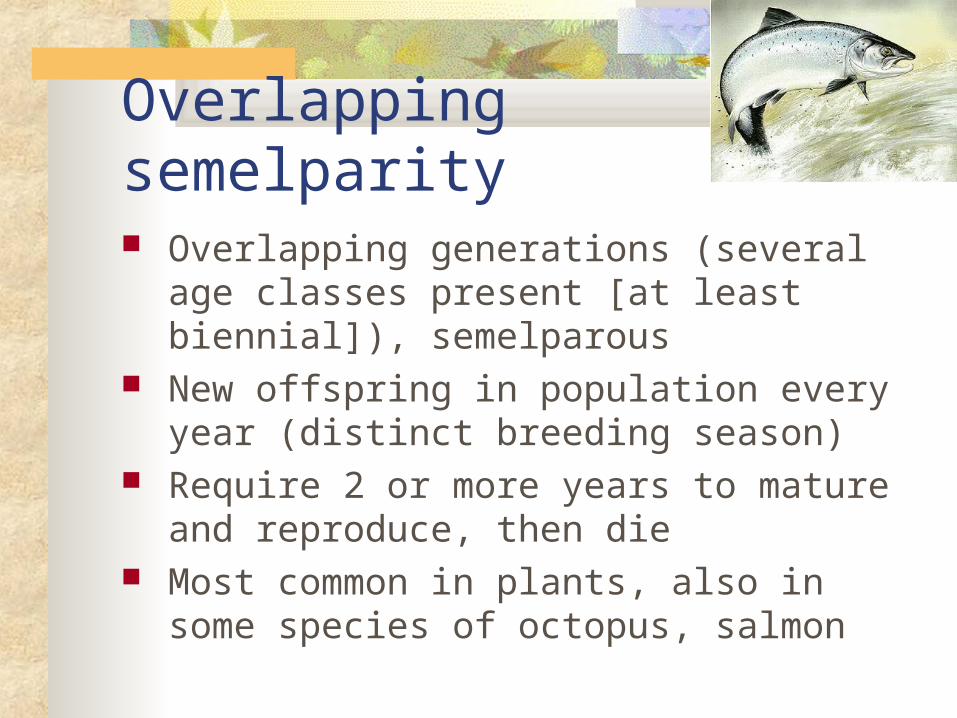
Overlapping semelparity Overlapping generations (several age classes
present [at least biennial]), semelparous New offspring in population every year (distinct
breeding season) Require 2 or more years to mature and reproduce,
then die Most common in plants, also in some species of
octopus, salmon

Continuous semelparity No distinct breeding season because of
favorable environmental conditions Many overlapping ages continually
growing, reproducing, dying Example: some animals in tropical oceans
Continuous iteroparity No distinct breeding season Many overlapping ages Example: humans
Life tables Used to follow changes in births, deaths,
growth of population through time Of differing complexity and usefulness
depending on life cycle of organism being examined Easiest for annuals, more difficult for other
types

Life table variables x life stage or age classax total number of individuals observed at each stage or classlx proportion of original number of individuals surviving to the next stage or class; survivorshipdx proportion of original number of individuals dying during each stage or class; mortalityqx mortality rate for each stage or classkx "killing power;" Fx total fecundity, or reproductive output of entire population, for each stage or classmx individual fecundity, or mean reproductive output, for each stage or classlxmx number of offspring produced per original individual during each stage or class; product of survival and reproductionR0 basic reproductive rate
Cohort life table
Group of individuals “born” within same short time interval is followed from birth through death of last survivor

Grasshoppers - a cohort life table
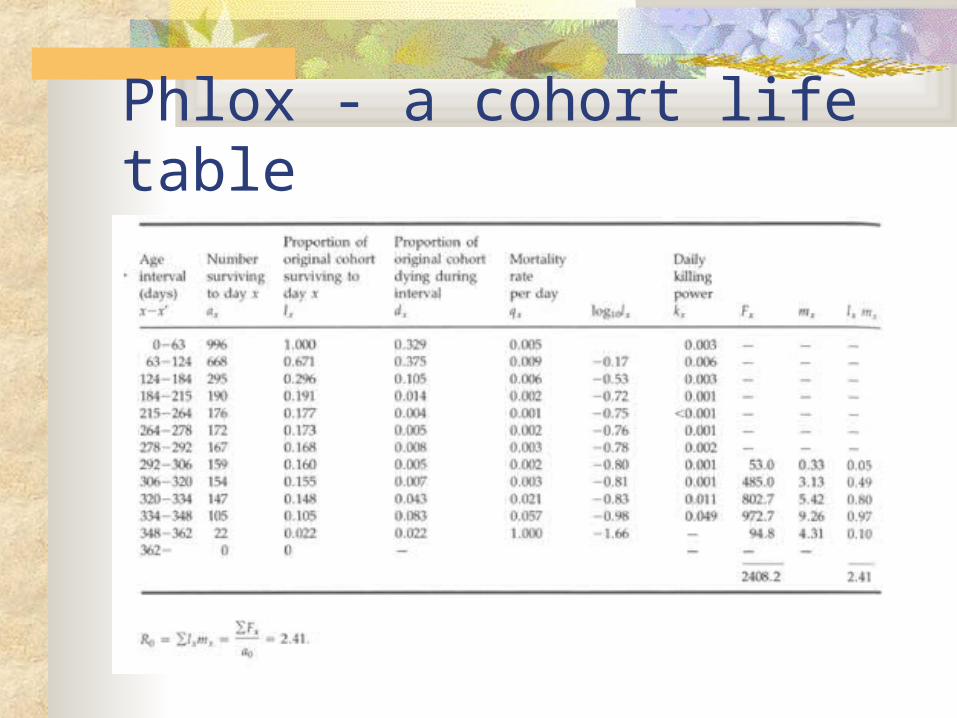
Phlox - a cohort life table
Static life tables Life tables more difficult to construct for
longer-lived organisms, and those with many overlapping generations
Difficult to follow single cohort throughout entire life (many years)
Static life table is produced - snapshot in time

Static life tables Need information on total population size
and its age structure at some point in time Can get messy if older age classes have
more individuals than younger age classes Different mortality, recruitment
May need to smooth data to get things to work
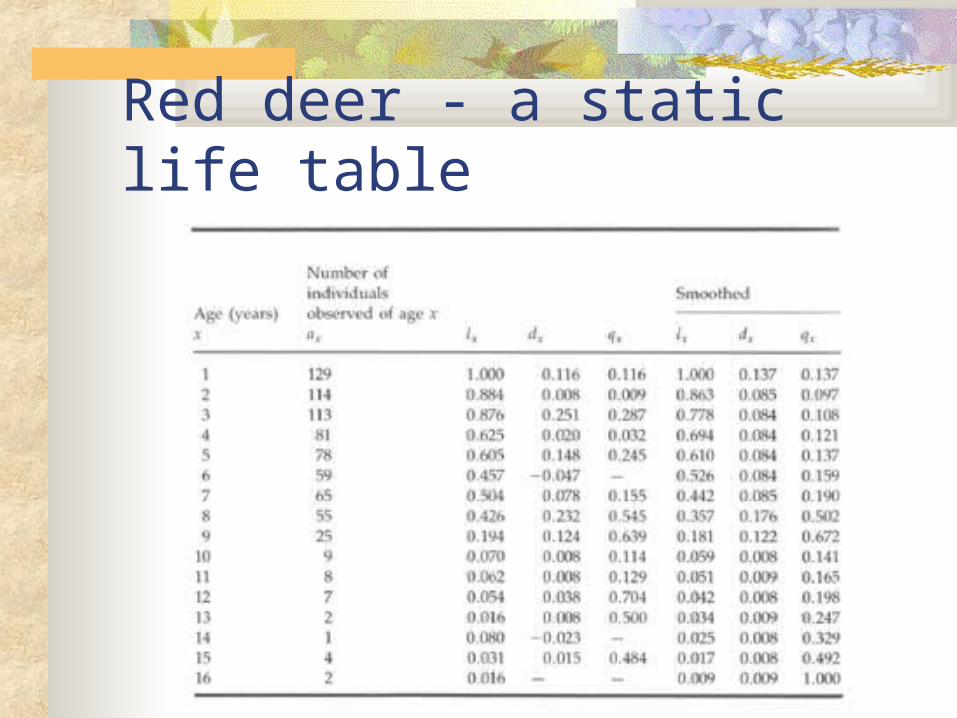
Red deer - a static life table

Survivorship Curves Depict what
proportion of population remains alive at various points in life
3 basic patterns displayed by living things
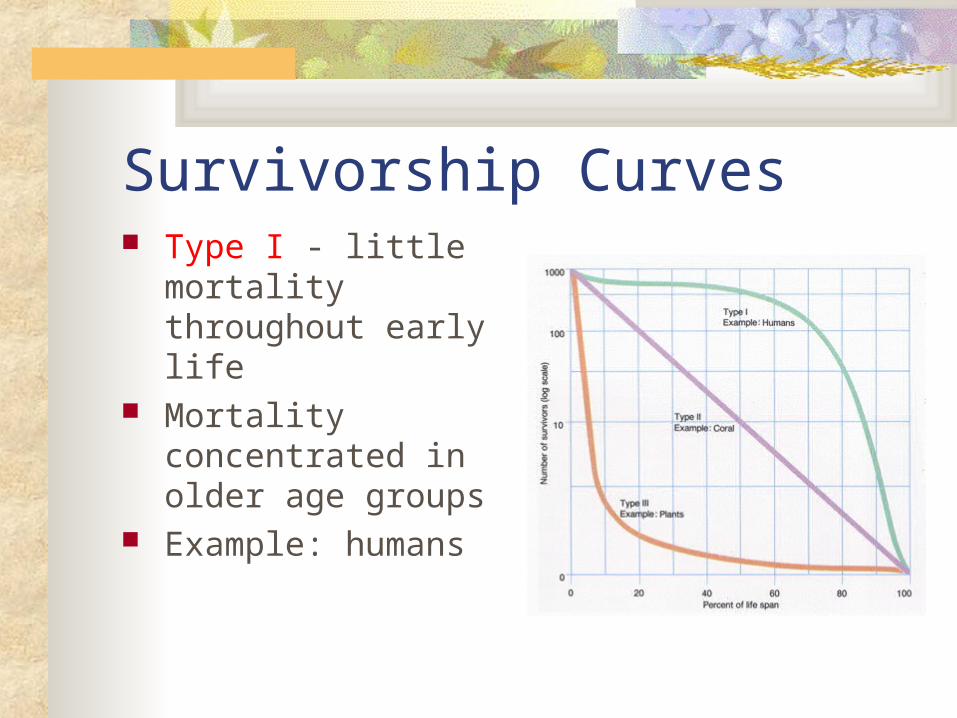
Survivorship Curves Type I - little
mortality throughout early life
Mortality concentrated in older age groups
Example: humans
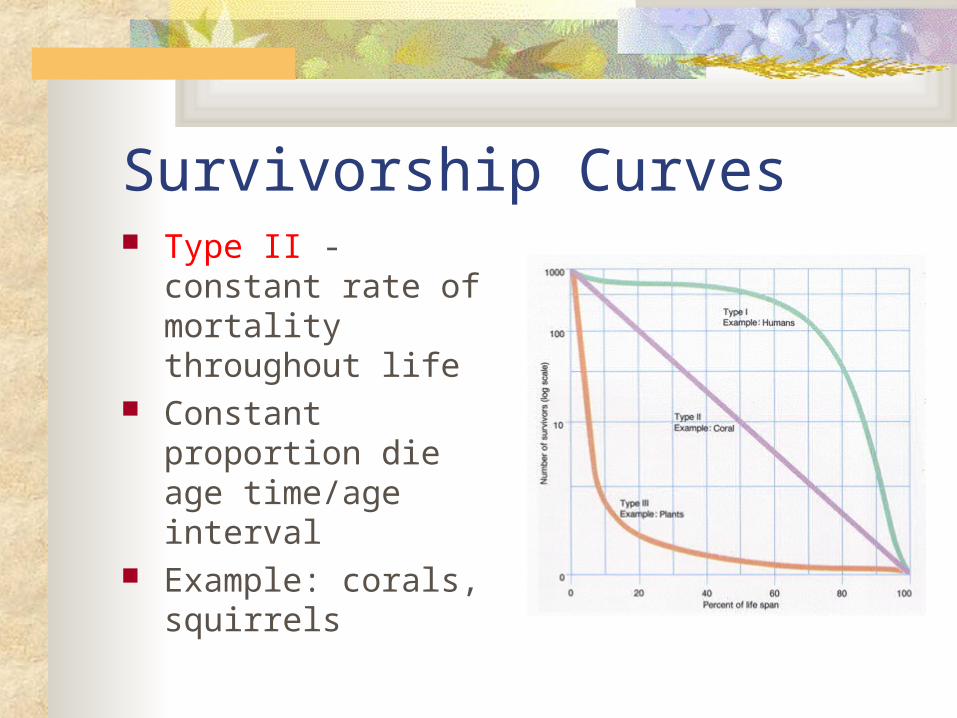
Survivorship Curves Type II - constant rate
of mortality throughout life
Constant proportion die age time/age interval
Example: corals, squirrels

Survivorship Curves Type III - high early
mortality Survivors have little
mortality until old age Example: plants,
fishes
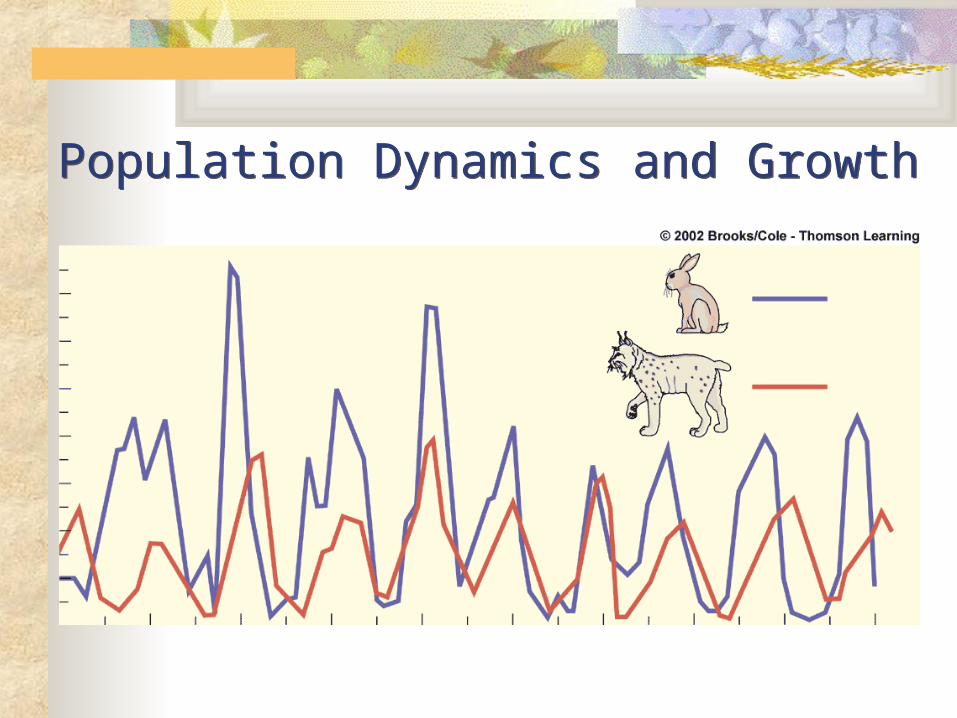
Population Dynamics and GrowthPopulation Dynamics and Growth

Exponential Growth
Time (t)
Po
pu
lati
on
siz
e (N
)
-ideal habitat-maximum reproduction-unlimited resources
Increase oftenfollowed bycrash

2,000
1,500
Nu
mb
er o
f re
ind
eer
1910 1920 1930 1940 1950
Year
1,000
500
Reindeer on an Alaskan island

5,000
4,000
3,000
2,000
1,000
500
Nu
mb
er o
f m
oo
se
100
90
80
70
60
50
40
30
20
10
01900 1910 1930 1950 1970 1990 2000
1999Year
Nu
mb
er of w
olves
Moose population
Wolf population
Moose and wolves on Isle Royale
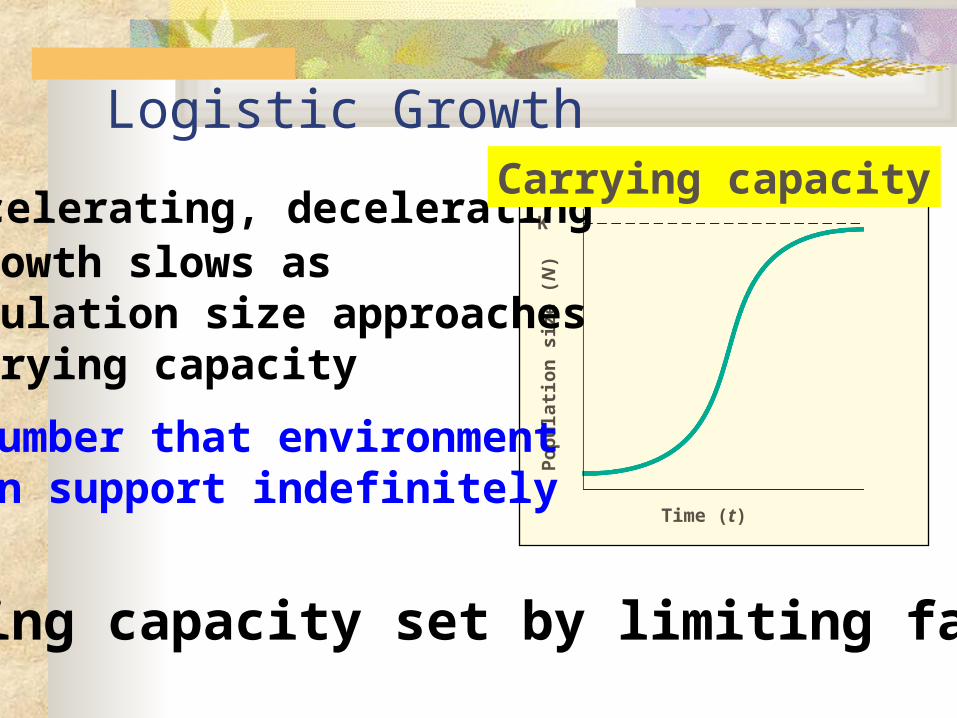
Logistic Growth
Time (t)
Po
pu
lati
on
siz
e (N
)
K-accelerating, deceleratingCarrying capacity
-growth slows aspopulation size approachescarrying capacity
-number that environmentcan support indefinitely
Carrying capacity set by limiting factor
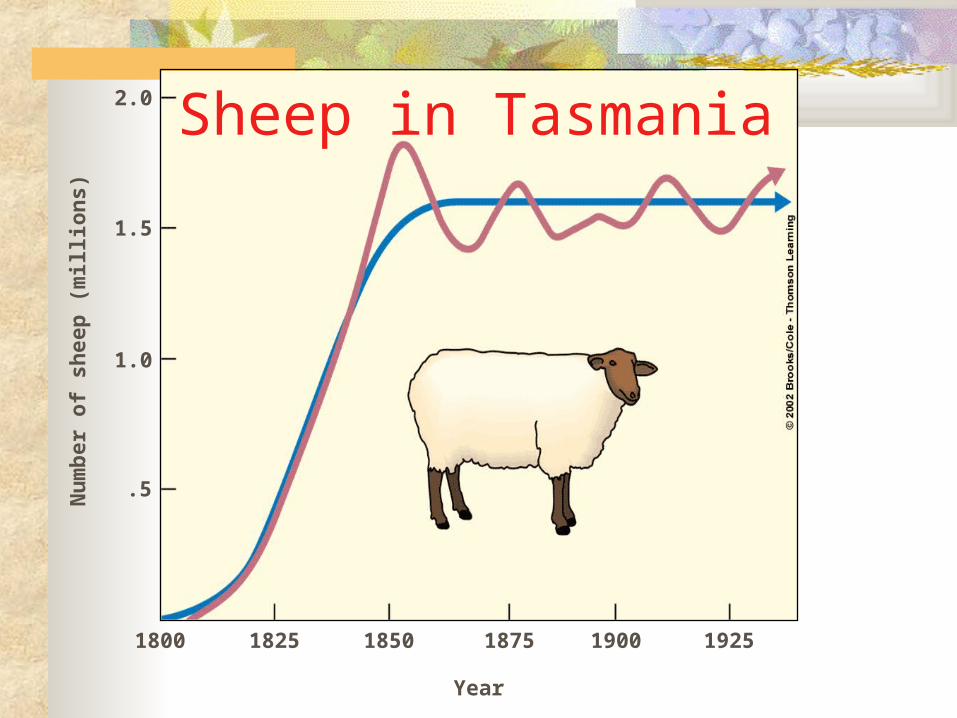
2.0
1.5
1.0
.5
Nu
mb
er o
f sh
eep
(m
illio
ns)
1800 1825 1850 1875 1900 1925
Year
Sheep in Tasmania
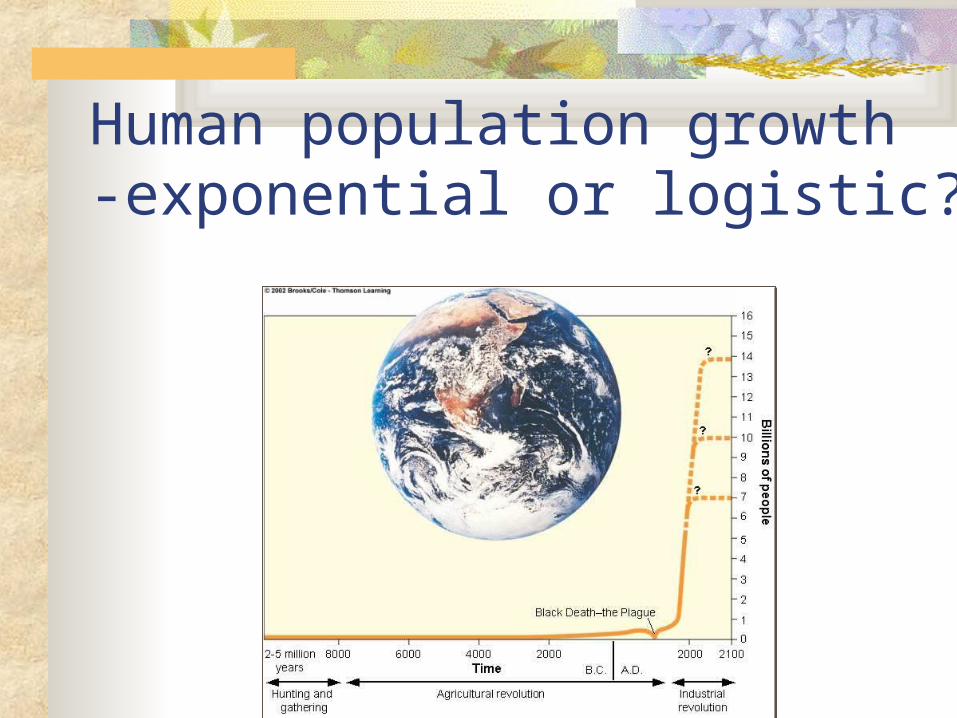
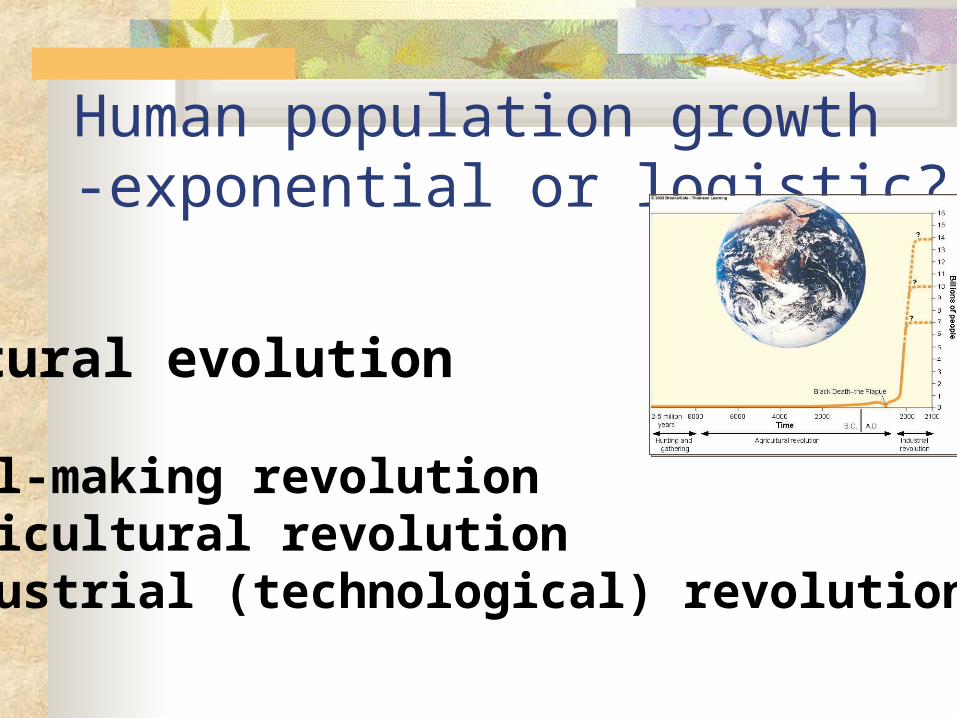
Human population growth-exponential or logistic?
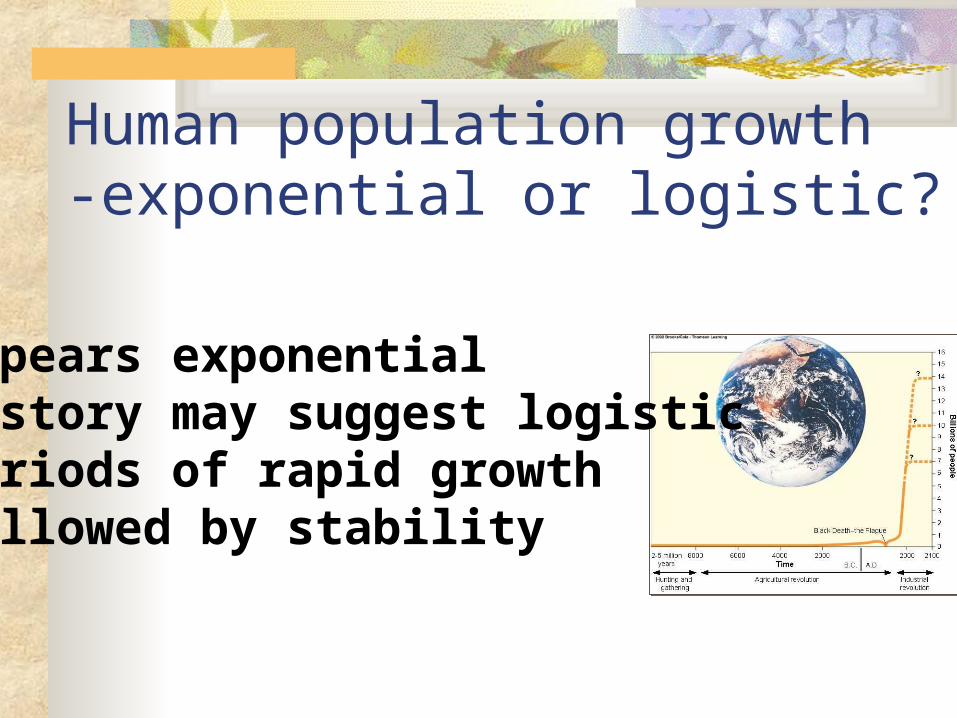
Human population growth-exponential or logistic?
-appears exponential-history may suggest logistic-periods of rapid growth followed by stability
Human population growth-exponential or logistic?
Cultural evolution
-tool-making revolution-agricultural revolution-industrial (technological) revolution
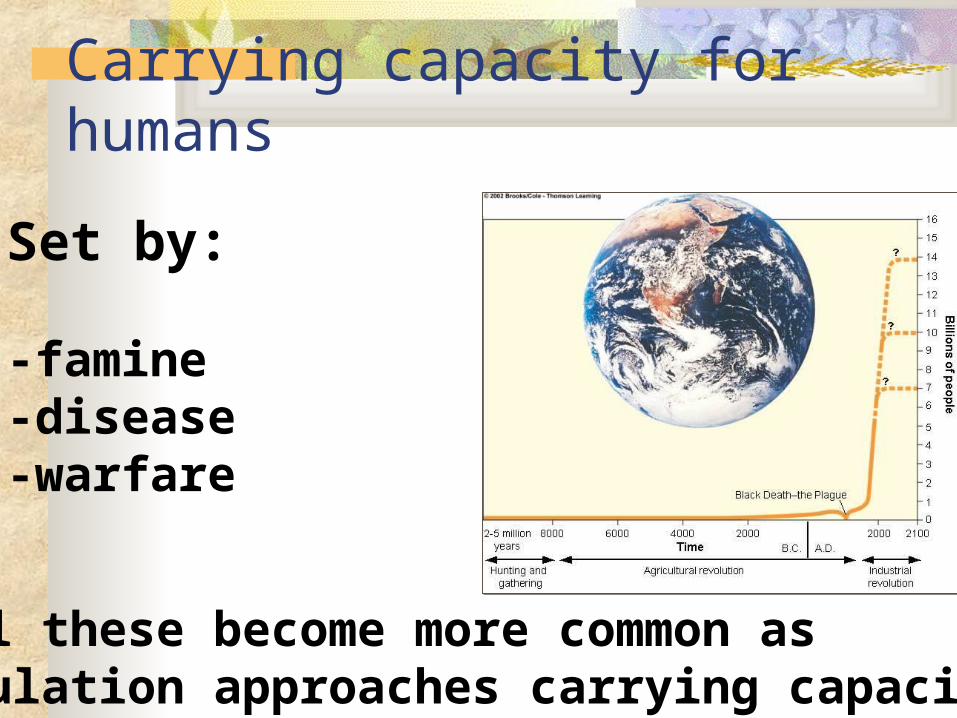
Carrying capacity for humans
Set by:
-famine-disease-warfare
Will these become more common aspopulation approaches carrying capacity?
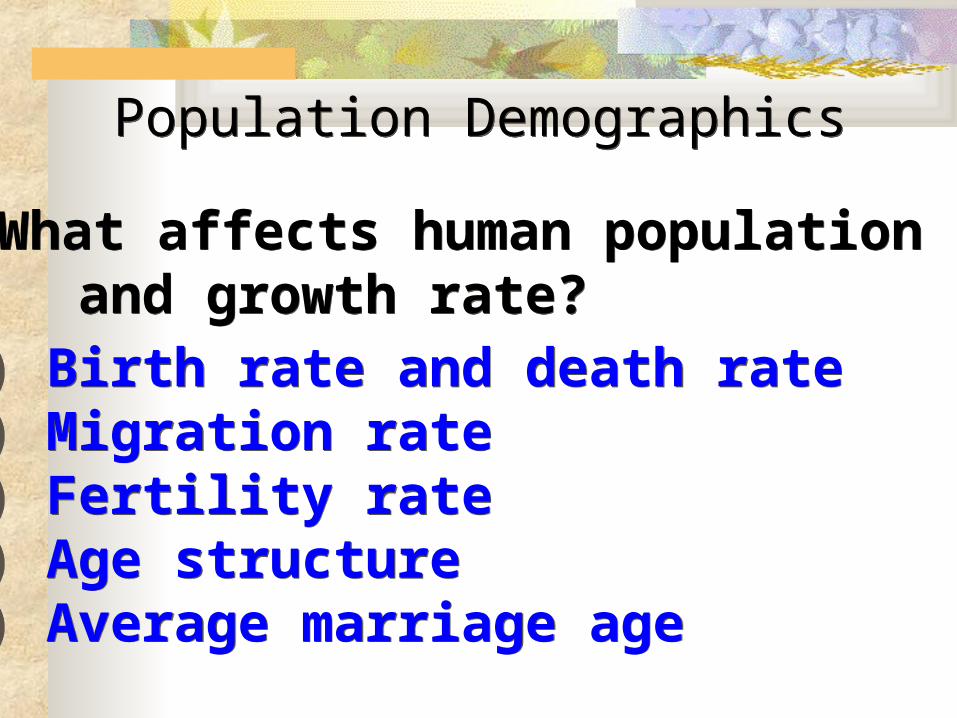
Population DemographicsPopulation Demographics
What affects human population size and growth rate?
What affects human population size and growth rate?
1) Birth rate and death rate2) Migration rate3) Fertility rate4) Age structure5) Average marriage age
1) Birth rate and death rate2) Migration rate3) Fertility rate4) Age structure5) Average marriage age
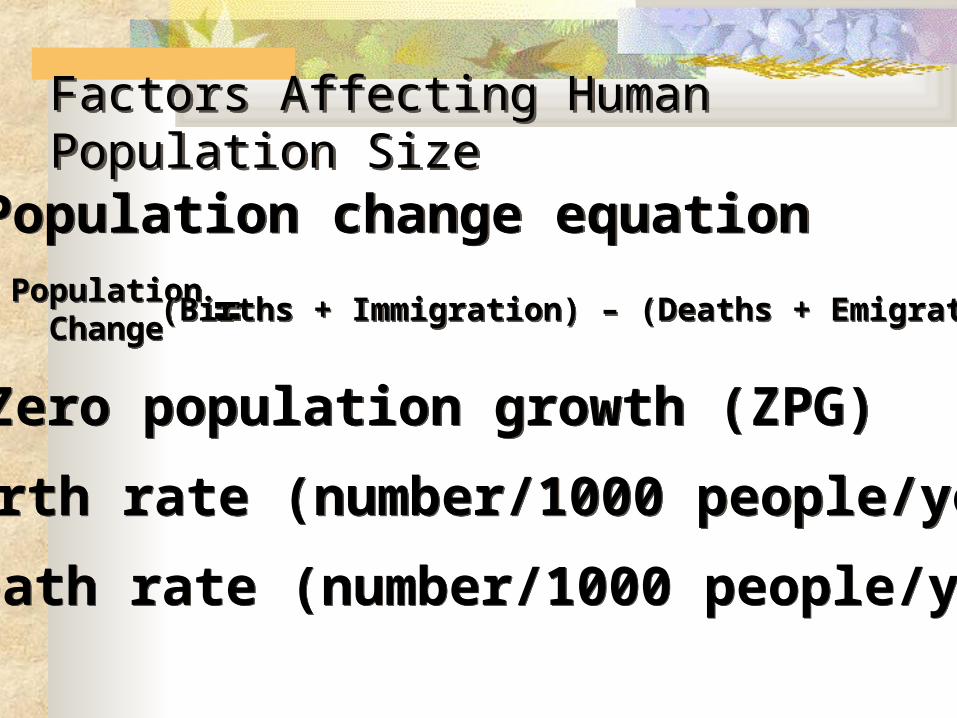
Factors Affecting Human Population SizeFactors Affecting Human Population Size
Population change equationPopulation change equation
Zero population growth (ZPG)Zero population growth (ZPG)
Birth rate (number/1000 people/year)Birth rate (number/1000 people/year)
Death rate (number/1000 people/year)Death rate (number/1000 people/year)
PopulationChange
PopulationChange == (Births + Immigration) – (Deaths + Emigration)(Births + Immigration) – (Deaths + Emigration)
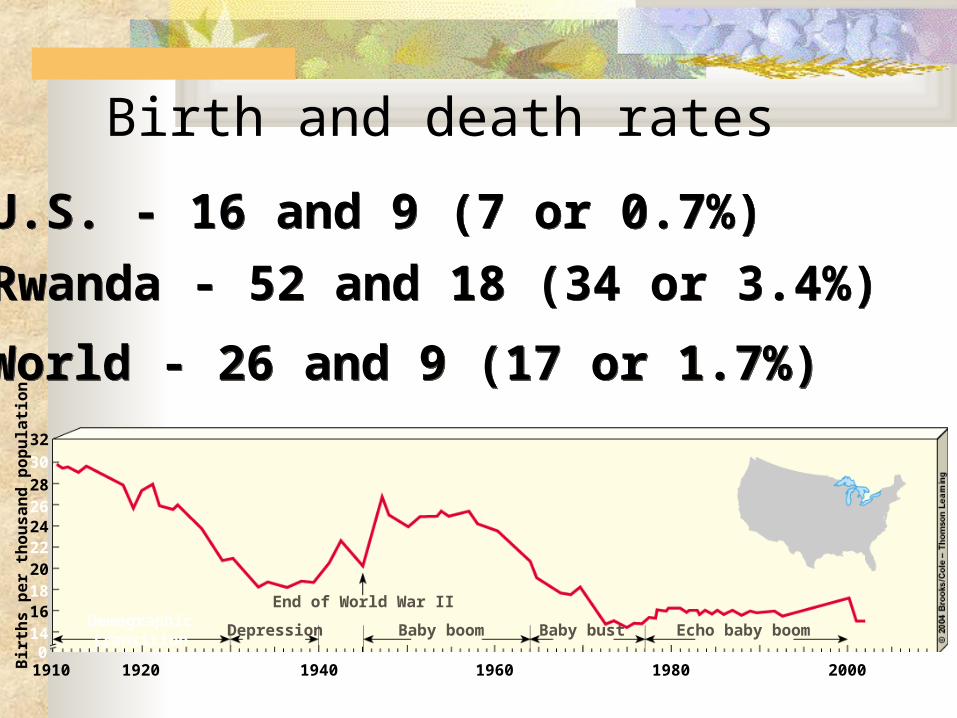
Birth and death rates
U.S. - 16 and 9 (7 or 0.7%) U.S. - 16 and 9 (7 or 0.7%) Rwanda - 52 and 18 (34 or 3.4%) Rwanda - 52 and 18 (34 or 3.4%)
32
30
28262422201816140
Bir
ths
pe
r th
ou
sa
nd
po
pu
lati
on
1910 1920 1930 1940 1950 1960 1970 1980 1990 2000 2010
Year
Demographictransition
Depression
End of World War II
Baby boom Baby bust Echo baby boom
World - 26 and 9 (17 or 1.7%) World - 26 and 9 (17 or 1.7%)
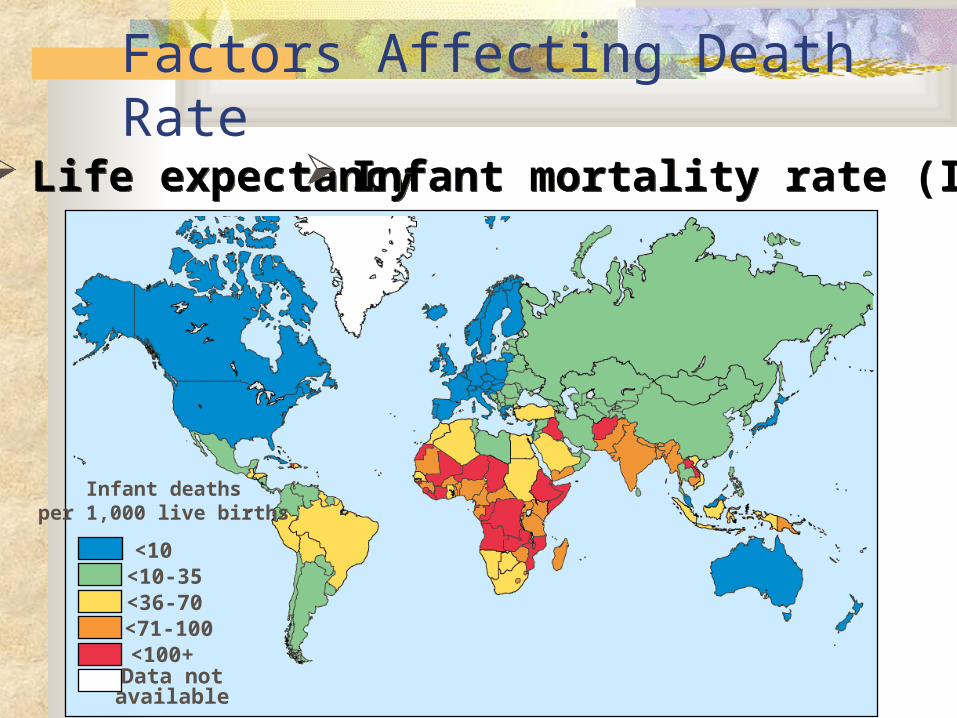
Infant deathsper 1,000 live births
<10<10-35<36-70<71-100<100+Data notavailable
Factors Affecting Death Rate Life expectancy Life expectancy Infant mortality rate (IMR) Infant mortality rate (IMR)
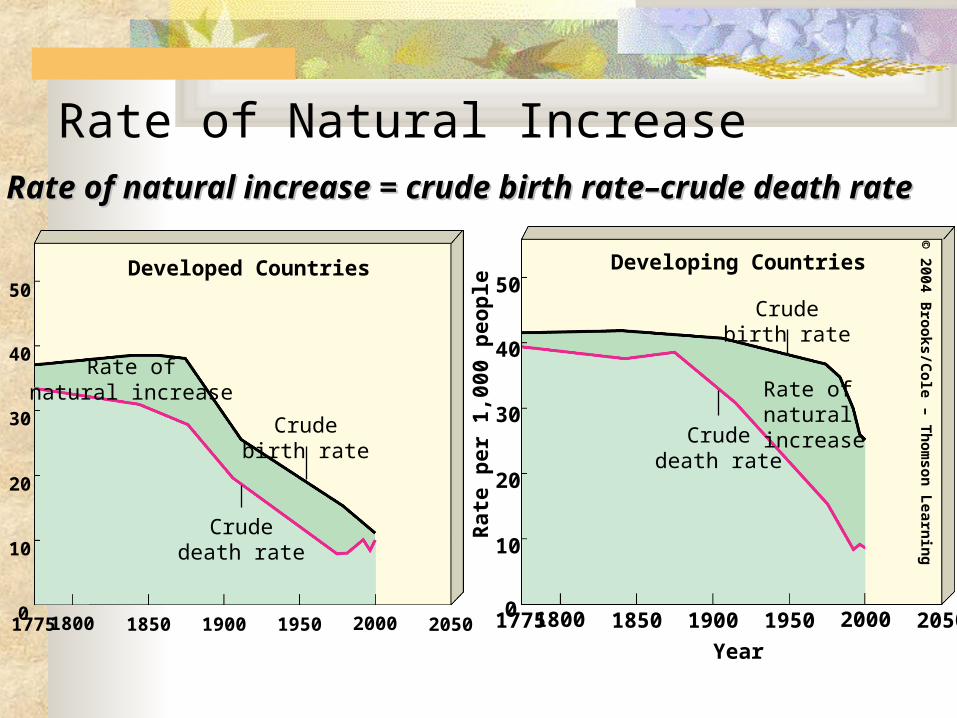
Rate of Natural Increase
Developed Countries50
40
30
20
10
017751800 1850 1900 1950 2000 2050
Rate ofnatural increase
Crudebirth rate
Crudedeath rate
Rate of natural increase = crude birth rateRate of natural increase = crude birth rate––crude death rate crude death rate
Developing Countries50
40
30
20
10
017751800 1850 1900 1950 2000 2050
Rat
e p
er 1
,000
peo
ple Crude
birth rate
Rate ofnaturalincreaseCrude
death rate
Year
© 2004 B
roo
ks/Co
le – Th
om
son
Learn
ing
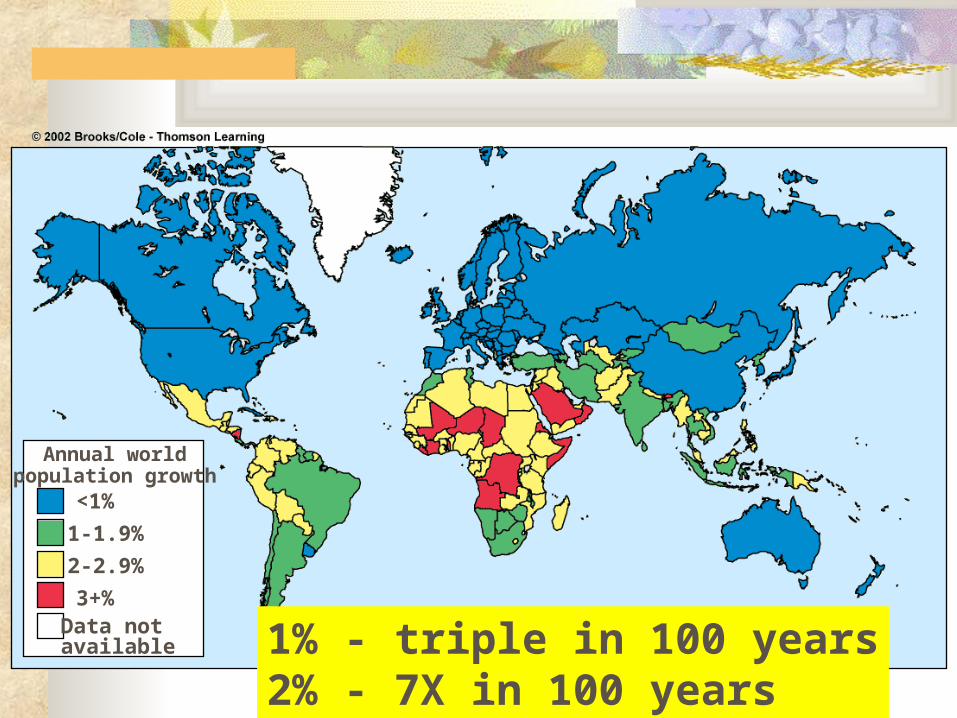
Natural Rate of Increase
<1%
1-1.9%
2-2.9%
3+%Data notavailable
Annual worldpopulation growth
1% - triple in 100 years2% - 7X in 100 years

Migration RatesMigration Rates
Affect regional populations Affect regional populations
e.g., United States e.g., United States
Net gain of 4/1000 people/year Net gain of 4/1000 people/year
Add to 7 from BR - DR = 11 (1.1%) Add to 7 from BR - DR = 11 (1.1%)

Fertility RatesFertility RatesAverage number of children born to a woman during her childbearing years (ages 15-44)
Average number of children born to a woman during her childbearing years (ages 15-44)
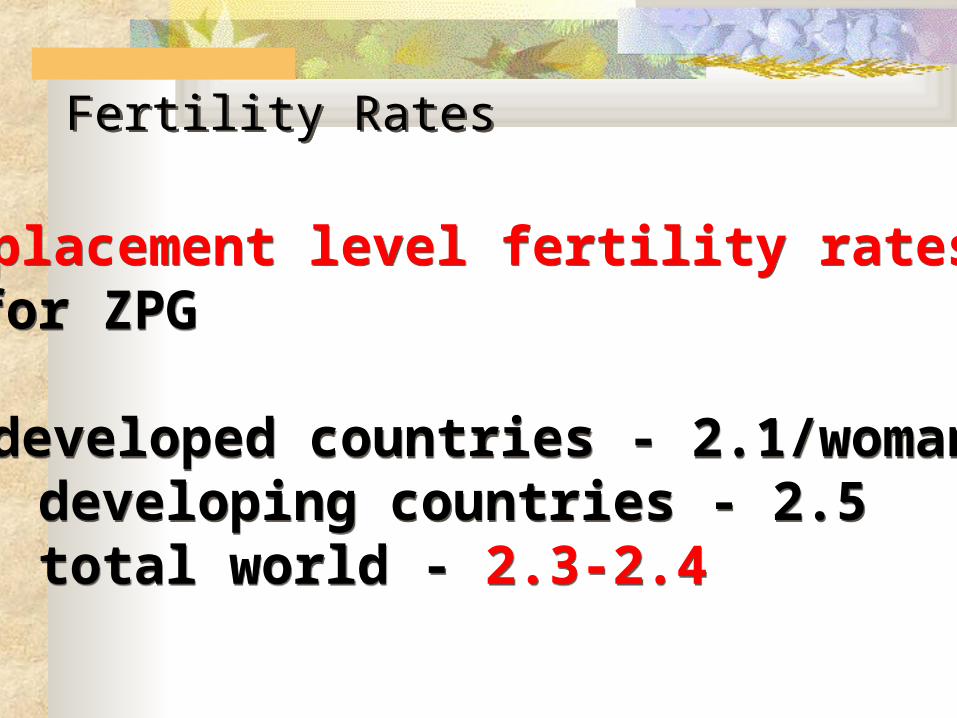
Replacement level fertility rates for ZPG
Replacement level fertility rates for ZPG
Total fertility ratesTotal fertility rates
Fertility RatesFertility Rates
Replacement level fertility rates for ZPG
- developed countries - 2.1/woman - developing countries - 2.5 - total world - 2.3-2.4
Replacement level fertility rates for ZPG
- developed countries - 2.1/woman - developing countries - 2.5 - total world - 2.3-2.4
Fertility RatesFertility Rates
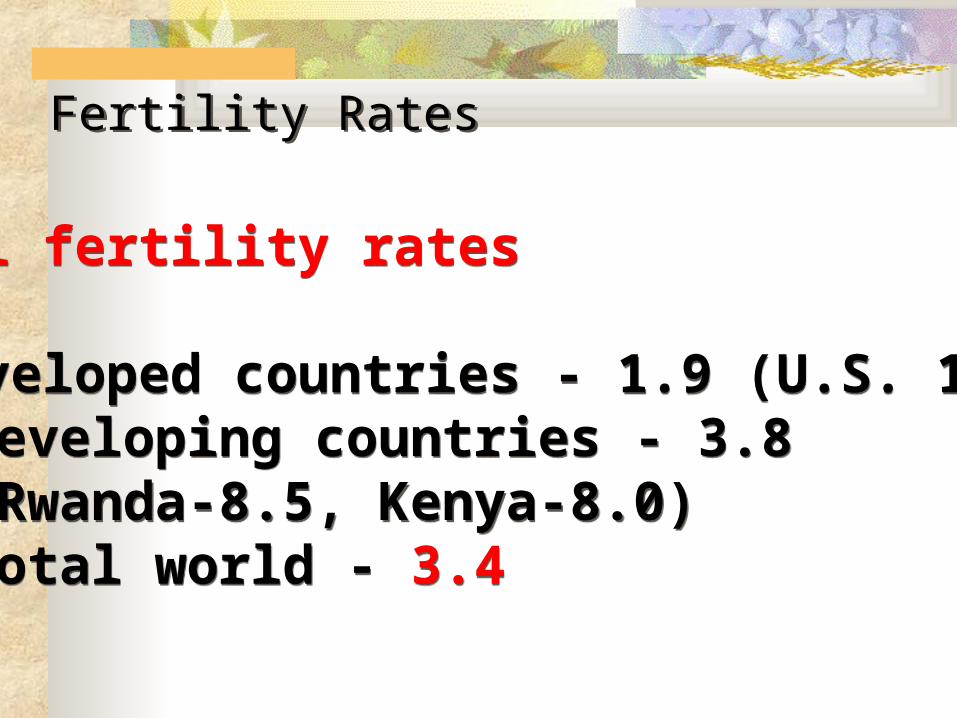
Total fertility rates
- developed countries - 1.9 (U.S. 1.8) - developing countries - 3.8 (Rwanda-8.5, Kenya-8.0) - total world - 3.4
Total fertility rates
- developed countries - 1.9 (U.S. 1.8) - developing countries - 3.8 (Rwanda-8.5, Kenya-8.0) - total world - 3.4

Births per woman
< 2
2-2.9
3-3.9
4-4.9
5+
NoData
Fertility Rates

Fertility RatesFertility Rates
Time lag to ZPG
- about 3 generations (~70 years) required to achieve ZPG once replacement level fertility rates are reached
Time lag to ZPG
- about 3 generations (~70 years) required to achieve ZPG once replacement level fertility rates are reached
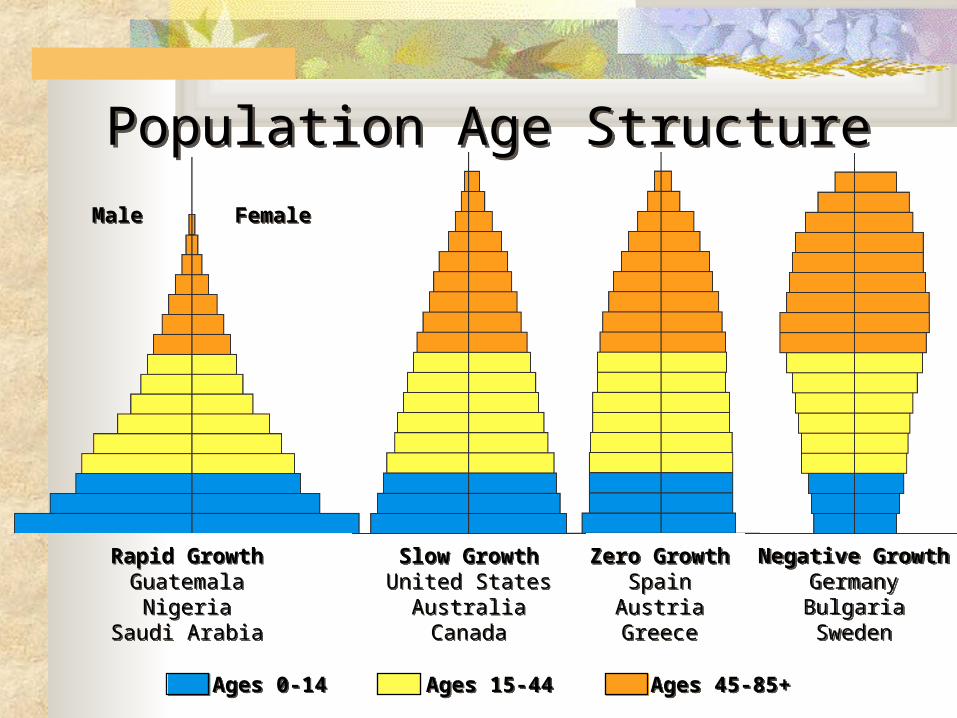
Ages 0-14Ages 0-14 Ages 15-44Ages 15-44 Ages 45-85+Ages 45-85+
Rapid GrowthGuatemala
NigeriaSaudi Arabia
Rapid GrowthGuatemala
NigeriaSaudi Arabia
Slow GrowthUnited States
AustraliaCanada
Slow GrowthUnited States
AustraliaCanada
MaleMale FemaleFemale
Zero GrowthSpainAustriaGreece
Zero GrowthSpainAustriaGreece
Negative GrowthGermanyBulgariaSweden
Negative GrowthGermanyBulgariaSweden
Population Age StructurePopulation Age Structure

Average Marriage AgeAverage Marriage Age
or age at birth of first childor age at birth of first child
Higher marriage age leads to reduced reproductive period, which leads to lower fertility rates
Higher marriage age leads to reduced reproductive period, which leads to lower fertility rates

Average Marriage AgeAverage Marriage Age
Current U.S. marriage age - 24 (F)Current U.S. marriage age - 24 (F)
Reduces 30-year reproductive period (15-44) to 21-year reproductive period (24-44)
- 30% reduction
Reduces 30-year reproductive period (15-44) to 21-year reproductive period (24-44)
- 30% reduction
Reduces 15-year prime reproductive period (15-29) to a 6-year prime reproductive period (24-29) - 60% reduction
Reduces 15-year prime reproductive period (15-29) to a 6-year prime reproductive period (24-29) - 60% reduction
Expectation: >25 needed to affect fertility rate Expectation: >25 needed to affect fertility rate

Current Needs for Large FamiliesCurrent Needs for Large Families
Increased incomeIncreased income
High infant mortalityHigh infant mortality
Support for elderlySupport for elderly
Few opportunities for women outside the home
Few opportunities for women outside the home
Family planning unavailableFamily planning unavailable

r strategistUnstable environment,
density independent
K strategistStable environment,
density dependent
Small size of organism Large size of organism
Low energy for reproduction High energy for reproduction
Many offspring produced Few offspring produced
Early maturity Late maturity (often after parental care)
Short life expectancy Long life expectancy
Reproduces once Reproduces more than once
Type III survivorship curve Type I or II survivorship curve
Life History Strategies