chapter 5 inland wetland mineral soils - ipcc · chapter 5: inland wetland mineral soils ......
TRANSCRIPT

Chapter 5: Inland Wetland Mineral Soils
2013 Supplement to the 2006 IPCC Guidelines for National Greenhouse Gas Inventories: Wetlands 5.1
CHAPTER 5
INLAND WETLAND MINERAL SOILS

Chapter 5: Inland Wetlands Mineral Soils
5.2 2013 Supplement to the 2006 IPCC Guidelines for National Greenhouse Gas Inventories: Wetlands
Coordinating Lead Authors
Kimberly P. Wickland (USA) and Alex V. Krusche (Brazil)
Lead Authors
Randall K. Kolka (USA), Ayaka W. Kishimoto-Mo (Japan), Rodney A. Chimner (USA) and
Yusuf Serengil (Turkey)
Contributing Authors
Stephen Ogle (USA) and Nalin Srivastava (IPCC TFI TSU)
Review Editors
Irineu Junior Bianchini (Brazil) and Michelle Garneau (Canada)

Chapter 5: Inland Wetland Mineral Soils
2013 Supplement to the 2006 IPCC Guidelines for National Greenhouse Gas Inventories: Wetlands 5.3
Contents
5 Inland Wetland Mineral Soils ............................................................................................................................... 5
5.1 Introduction .................................................................................................................................. 5
5.2 Land remaining in a land-use category ........................................................................................ 8
5.2.1 CO2 emissions and removals....................................................................................................... 9
5.2.1.1 Biomass and dead organic matter ............................................................................................... 9
5.2.1.2 Soil carbon ................................................................................................................................ 10
5.2.2 CH4 emissions from managed lands with IWMS ...................................................................... 17
5.2.2.1 Choice of method ...................................................................................................................... 17
5.2.2.2 Choice of emission factors ........................................................................................................ 18
5.2.2.3 Choice of activity data .............................................................................................................. 18
5.2.2.4 Uncertainty assessment ............................................................................................................. 19
5.3 Land converted to a new land-use category ............................................................................... 19
5.3.1 CO2 emissions and removals..................................................................................................... 19
5.3.1.1 Biomass and dead organic matter ............................................................................................. 19
5.3.1.2 Soil carbon ................................................................................................................................ 20
5.3.2 CH4 emissions ........................................................................................................................... 21
5.3.2.1 Choice of method and emission factors .................................................................................... 21
5.3.2.2 Choice of activity data .............................................................................................................. 21
5.3.2.3 Uncertainty assessment ............................................................................................................. 21
5.4 Completeness, reporting and documentation ............................................................................. 21
5.4.1 Completeness ............................................................................................................................ 21
5.4.2 Reporting and Documentation .................................................................................................. 21
Annex 5A.1 Estimation of default stock change factors for long-term cultivated Cropland and rewetting with Inland Wetland Mineral Soil carbon emissions/removals .................................................. 23
Annex 5A.2 Estimation of CH4 emission factors for managed lands with Inland Wetland Mineral Soils, or dry mineral soils, where the water table has been raised ........................................................... 24
Appendix 5a.1 Future methodological development .......................................................................................... 29
References ............................................................................................................................................................. 30

Chapter 5: Inland Wetlands Mineral Soils
5.4 2013 Supplement to the 2006 IPCC Guidelines for National Greenhouse Gas Inventories: Wetlands
Equations
Equation 5.1 Annual CH4 emissions from rewetted and created wetlands on managed lands
with IWMS......................................................................................................................... 17
Tables
Table 5.1 Updated and new guidance provided in Chapter 5 ............................................................... 6
Table 5.2 Default reference soil organic carbon stocks (SOCREF) for Wetland Mineral Soilsa under
native vegetation (0-30 cm depth). ..................................................................................... 12
Table 5.3 Relative stock change factors for land-use (FLU) for long term cultivation on Cropland
with IWMS over 20 years) and rewetting of cropland with IWMS (over 20 years and 40
years) .................................................................................................................................. 13
Table 5.4 Default emission factors for CH4 from managed lands with IWMS where water table level
has been raised ................................................................................................................... 18
Table 5A.1.1 Studies used for the derivation of default SOC stock change factors................................ 23
Table 5A.2.1 CH4 emissions from restored and created wetlands with IWMS where water table level
has been raised, and natural wetlands, used to derive default value for EFCH4 ................. 24
Table 5A.2.2 CH4 emissions from temperate, created/rewetted wetlands and natural wetlands with
IWMS ................................................................................................................................. 27
Table 5A.2.3 CH4 emissions from temperate, rewetted, created and natural wetlands with IWMS,
stratified by period of inundation ....................................................................................... 28
Boxes
Box 5.1 Distribution of Wetland Mineral Soils ................................................................................ 7
Box 5.2 Management activities on Inland Wetland Mineral Soils .................................................... 8
Box 5.3 Example Calculations for SOC Stocks in Long-term Cultivated Croplands with Inland
Wetland Mineral Soils, and Rewetting of Long-Term Cultivated Croplands with Inland
Wetland Mineral Soils………………… ............................................................................ 16

Chapter 5: Inland Wetland Mineral Soils
2013 Supplement to the 2006 IPCC Guidelines for National Greenhouse Gas Inventories: Wetlands 5.5
5 INLAND WETLAND MINERAL SOILS
5.1 INTRODUCTION
This chapter provides supplementary guidance for estimating and reporting greenhouse gas (GHG) emissions
and removals from managed lands with Inland Wetland Mineral Soils (IWMS) for all land-use categories (see
Chapter 1 and decision tree in Chapter 1 in this supplement for what is specifically covered in this chapter in
relationship to other chapters in this supplement). Information on Tier 1 default methods for Wetland Mineral
Soil (WMS) is found in Table 2.3, Chapter 2, Volume 4 of the 2006 IPCC Guidelines for National Greenhouse
Gas Inventories (2006 IPCC Guidelines). This chapter covers “inland” managed lands with WMS; coastal lands
with WMS are addressed in Chapter 4 (Coastal Wetlands) of this supplement. The distinction between “inland”
and “coastal” zones is defined in Chapter 4. Constructed wetlands with IWMS are addressed in Chapter 6
(Constructed Wetlands for Wastewater Treatment) of this supplement.
Mineral soils are described as all soils that are not classified as organic soils in Annex 3A.5, Chapter 3, Volume
4 of the 2006 IPCC Guidelines. The 2006 IPCC Guidelines provide a default mineral soil classification for
categorizing mineral soil types, based on the USDA taxonomy (Soil Survey Staff, 1999) in Figure 3A.5.3, and
based on the World Reference Base for Soil Resources Classification (FAO, 1998) in Figure 3A.5.4, where both
classifications produce the same default IPCC soil types for Tier 1 methods. Under these soil classification
schemes, Wetland Soils (e.g. Wetland Mineral Soils) are classified as Aquic soil (USDA) or Gleysols (World
Reference Base), and are described as having restricted drainage, leading to periodic flooding and anaerobic
conditions (Table 2.3, Chapter 2, Volume 4, 2006 IPCC Guidelines). They can occur in any of the six land-use
categories (Forest Land, Grassland, Cropland, Wetlands, Settlements and Other Land) depending upon the
national land-use classification system. Emissions and removals from areas of managed land with IWMS should
be reported in the land-use category under which they are classified, according to Volume 4 of the 2006 IPCC
Guidelines. Note that a change in management practice may, or may not be accompanied by land-use conversion.
For higher tier methods, countries may use country-specific national classification systems as long as they are
transparently documented.
For the purposes of this supplement, IWMS comprise those that have formed under restricted drainage, and may
or may not be artificially drained due to management activities. Guidance provided in this chapter applies to: (i)
artificial drainage, defined here as the removal of free water from soils having aquic conditions to the extent that
water table levels are changed significantly in connection with specific types of land use (adapted from Soil
Survey Staff, 1999); (ii) IWMS that have been artificially drained and subsequently allowed to re-wet (hereafter
called “rewetting”); and (iii) the artificial inundation of mineral soils for the purposes of “wetland creation.”
There is no guidance provided for other IWMS such as saline IWMS (See Box 5.1 of this Chapter), or reservoirs.
Guidance on methane (CH4) emissions from rice cultivation on IWMS is given in Chapter 5, Volume 4 of the
2006 IPCC Guidelines. Guidance on carbon stock changes in Land Converted to Flooded Land1 with IWMS is
given in Chapter 7, Volume 4 of the 2006 IPCC Guidelines2. This supplement does not update this guidance.
This chapter supplements guidance and methodologies provided in the 2006 IPCC Guidelines for emissions and
removals of carbon dioxide (CO2), and emissions of CH4, and provides additional information to be used in the
application of the methodologies. Review of the current literature suggests there is insufficient data to provide
robust emission factors and methodology to update the guidance on nitrous oxide (N2O) emissions from IWMS
provided in Chapter 11, Volume 4 of the 2006 IPCC Guidelines at this time (see Appendix 5A of this chapter for
additional discussion). This chapter should be read in conjunction with Volume 4 of the 2006 IPCC Guidelines.
This chapter updates the 2006 IPCC Guidelines for:
default reference Soil Organic Carbon stocks (SOCREF) for IWMS under all climate regions (referring to
Table 2.3, Chapter 2, Volume 4 of the 2006 IPCC Guidelines), to be used for Tier 1 methods in all six land-
use categories; and
default Soil Organic Carbon (SOC) stock change factor (FLU) for long-term cultivation of Cropland with
IWMS.
This chapter gives new guidance not contained in the 2006 IPCC Guidelines by:
1 In the 2006 IPCC Guidelines, Flooded Lands are defined as water bodies where human activities have caused changes in
the amount of surface area covered by water, typically through water level regulation.
2 Appendices 2 and 3 of Volume 4 of the 2006 IPCC Guidelines contain information on CO2 emissions from Land Converted
to Permanently Flooded Land and CH4 emissions from Flooded Land as a basis for future methodological development.
Chapter 5: Inland Wetlands Mineral Soils
5.6 2013 Supplement to the 2006 IPCC Guidelines for National Greenhouse Gas Inventories: Wetlands
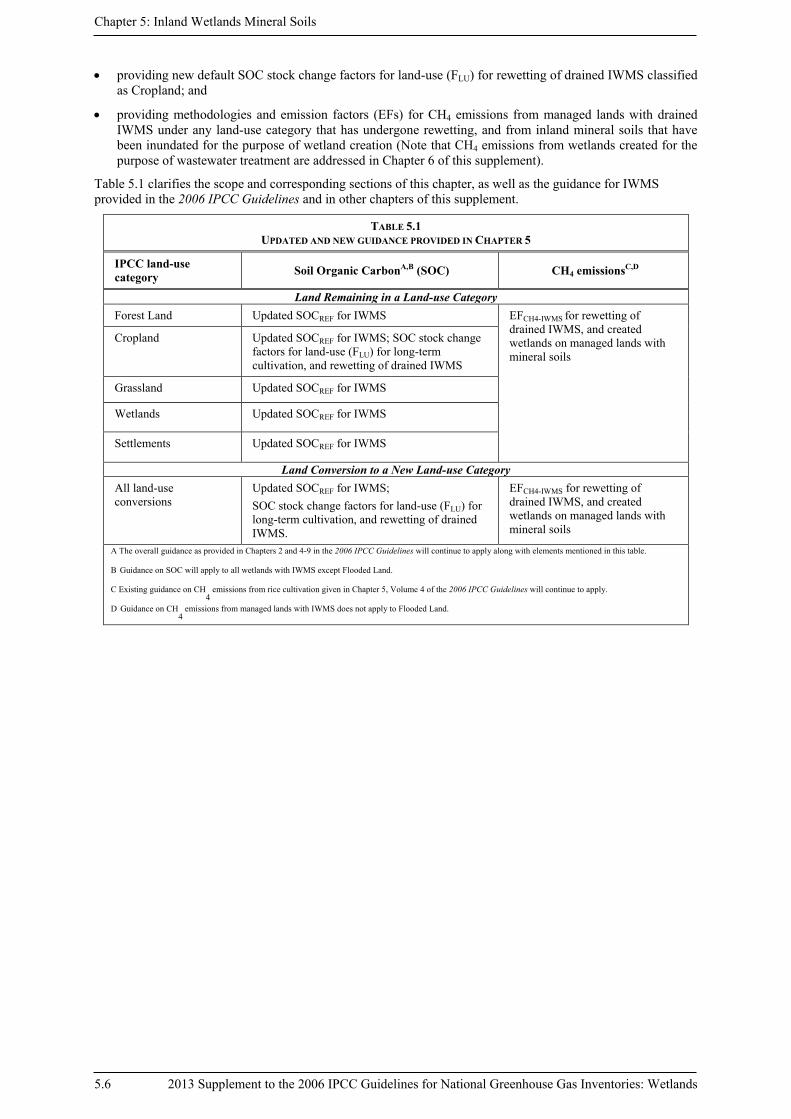
providing new default SOC stock change factors for land-use (FLU) for rewetting of drained IWMS classified
as Cropland; and
providing methodologies and emission factors (EFs) for CH4 emissions from managed lands with drained
IWMS under any land-use category that has undergone rewetting, and from inland mineral soils that have
been inundated for the purpose of wetland creation (Note that CH4 emissions from wetlands created for the
purpose of wastewater treatment are addressed in Chapter 6 of this supplement).
Table 5.1 clarifies the scope and corresponding sections of this chapter, as well as the guidance for IWMS
provided in the 2006 IPCC Guidelines and in other chapters of this supplement.
TABLE 5.1
UPDATED AND NEW GUIDANCE PROVIDED IN CHAPTER 5
IPCC land-use
category Soil Organic Carbon
A,B (SOC) CH4 emissions
C,D
Land Remaining in a Land-use Category
Forest Land Updated SOCREF for IWMS EFCH4-IWMS for rewetting of
drained IWMS, and created
wetlands on managed lands with
mineral soils
Cropland Updated SOCREF for IWMS; SOC stock change
factors for land-use (FLU) for long-term
cultivation, and rewetting of drained IWMS
Grassland Updated SOCREF for IWMS
Wetlands Updated SOCREF for IWMS
Settlements Updated SOCREF for IWMS
Land Conversion to a New Land-use Category
All land-use
conversions
Updated SOCREF for IWMS;
SOC stock change factors for land-use (FLU) for
long-term cultivation, and rewetting of drained
IWMS.
EFCH4-IWMS for rewetting of
drained IWMS, and created
wetlands on managed lands with
mineral soils
A The overall guidance as provided in Chapters 2 and 4-9 in the 2006 IPCC Guidelines will continue to apply along with elements mentioned in this table.
B Guidance on SOC will apply to all wetlands with IWMS except Flooded Land.
C Existing guidance on CH4
emissions from rice cultivation given in Chapter 5, Volume 4 of the 2006 IPCC Guidelines will continue to apply. D Guidance on CH
4 emissions from managed lands with IWMS does not apply to Flooded Land.

Chapter 5: Inland Wetland Mineral Soils
2013 Supplement to the 2006 IPCC Guidelines for National Greenhouse Gas Inventories: Wetlands 5.7
BOX 5.1
DISTRIBUTION OF WETLAND MINERAL SOILS
WMS, including both coastal and inland WMS, are estimated to cover ~5.3% of the world’s land
surface, or 7.26 x 10⁶ km2 (Batjes, 2010a). The distribution of the world’s WMS across climate
regions are as follows: boreal (moist plus dry): 2.07%; tropical moist: 0.67%; cool temperate
moist: 0.63%; tropical wet: 0.61%; polar (moist plus dry): 0.60%; and warm temperate moist:
0.23% (Batjes, 2010a). Climate regions having less than 0.20% WMS include cool and warm
temperate dry, tropical dry, and tropical montane (See Figures 3A.5.1 and 3A.5.2, Chapter 3,
Volume 4 of the 2006 IPCC Guidelines for climate zone definitions). Figure 5.1 shows the global
distribution of gleysols (WMS), based on the World Reference Base for Soil Resources (WRB)
and the FAO/UNESCO soil map of the world. IWMS are found in a variety of landscape settings,
including basins, channels, flats, slopes, and highlands (Semeniuk and Semeniuk, 1995). It is
common to find IWMS adjacent to flowing waters and lake and pond margins (riparian wetlands).
Lands containing IWMS are often classified by predominant vegetation community, and can
include trees, woody shrubs, emergent and non-emergent vascular plants, and/or bare ground.
Distribution of Gleysols (Wetland Mineral Soils; source: http://www.isric.org).
One specific type of land containing IWMS, saline IWMS, is not covered in this chapter. Saline
IWMS are generally defined as having salinity >5000 mg L-1 when wet (Shaw and Bryant, 2011).
Also known as playas, pans, salt lakes, brackish wetlands, salinas, and sabkhas, these lands are
important parts of arid landscapes across the globe (Shaw and Bryant, 2011). In a recent review of
the literature characterizing known information on pans, playas and salt lakes, the carbon stocks
and CO2, CH4 and N2O fluxes were not discussed (Shaw and Bryant, 2011). A broader review of
the literature on lands containing saline IWMS indicates that only two studies have assessed soil
carbon in saline IWMS (Bai et al., 2007; Rodriguez-Murillo et al., 2011), and no studies have yet
measured GHG emissions and removals from saline IWMS. At present, the lack of data on saline
IWMS prevents the determination of their default carbon stock changes or GHG emission factors.
Countries are therefore encouraged to seek country-specific data in order to estimate changes in
carbon pools in, and emissions and removals from, managed saline IWMS.
Dominant Associated Inclusions Miscellaneous lands FAO-GIS, February 1998
Chapter 5: Inland Wetlands Mineral Soils
5.8 2013 Supplement to the 2006 IPCC Guidelines for National Greenhouse Gas Inventories: Wetlands
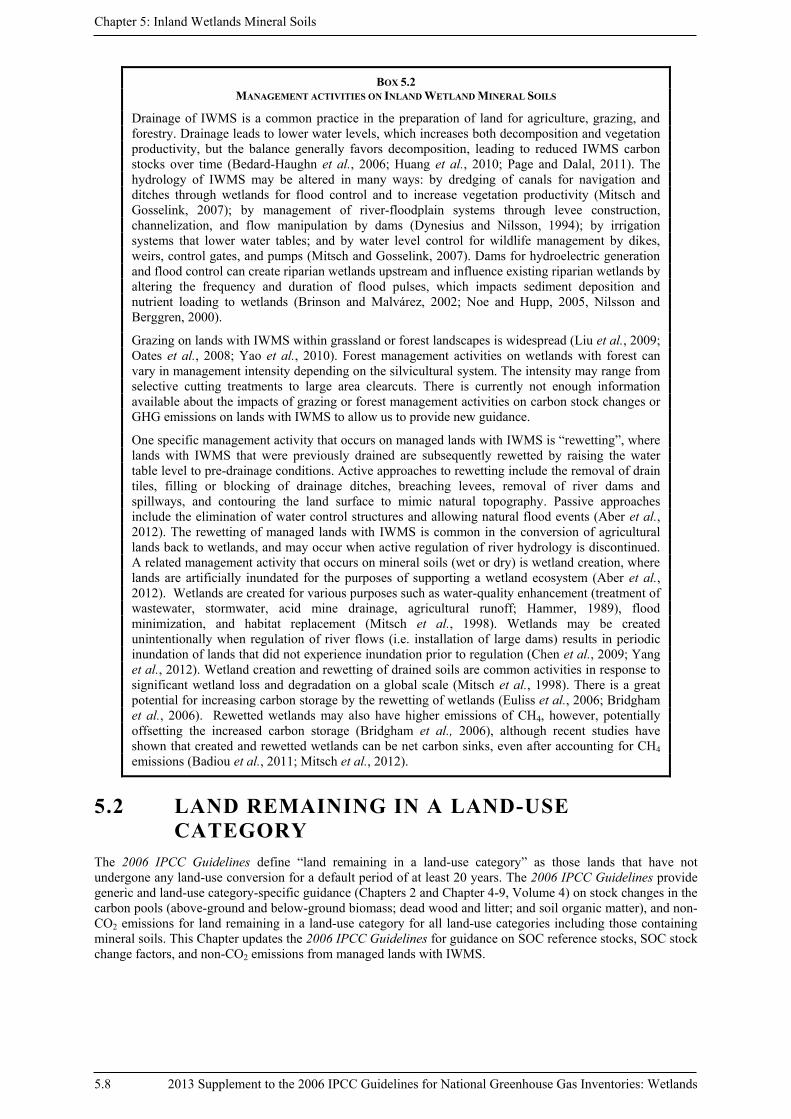
BOX 5.2
MANAGEMENT ACTIVITIES ON INLAND WETLAND MINERAL SOILS
Drainage of IWMS is a common practice in the preparation of land for agriculture, grazing, and
forestry. Drainage leads to lower water levels, which increases both decomposition and vegetation
productivity, but the balance generally favors decomposition, leading to reduced IWMS carbon
stocks over time (Bedard-Haughn et al., 2006; Huang et al., 2010; Page and Dalal, 2011). The
hydrology of IWMS may be altered in many ways: by dredging of canals for navigation and
ditches through wetlands for flood control and to increase vegetation productivity (Mitsch and
Gosselink, 2007); by management of river-floodplain systems through levee construction,
channelization, and flow manipulation by dams (Dynesius and Nilsson, 1994); by irrigation
systems that lower water tables; and by water level control for wildlife management by dikes,
weirs, control gates, and pumps (Mitsch and Gosselink, 2007). Dams for hydroelectric generation
and flood control can create riparian wetlands upstream and influence existing riparian wetlands by
altering the frequency and duration of flood pulses, which impacts sediment deposition and
nutrient loading to wetlands (Brinson and Malvárez, 2002; Noe and Hupp, 2005, Nilsson and
Berggren, 2000).
Grazing on lands with IWMS within grassland or forest landscapes is widespread (Liu et al., 2009;
Oates et al., 2008; Yao et al., 2010). Forest management activities on wetlands with forest can
vary in management intensity depending on the silvicultural system. The intensity may range from
selective cutting treatments to large area clearcuts. There is currently not enough information
available about the impacts of grazing or forest management activities on carbon stock changes or
GHG emissions on lands with IWMS to allow us to provide new guidance.
One specific management activity that occurs on managed lands with IWMS is “rewetting”, where
lands with IWMS that were previously drained are subsequently rewetted by raising the water
table level to pre-drainage conditions. Active approaches to rewetting include the removal of drain
tiles, filling or blocking of drainage ditches, breaching levees, removal of river dams and
spillways, and contouring the land surface to mimic natural topography. Passive approaches
include the elimination of water control structures and allowing natural flood events (Aber et al.,
2012). The rewetting of managed lands with IWMS is common in the conversion of agricultural
lands back to wetlands, and may occur when active regulation of river hydrology is discontinued.
A related management activity that occurs on mineral soils (wet or dry) is wetland creation, where
lands are artificially inundated for the purposes of supporting a wetland ecosystem (Aber et al.,
2012). Wetlands are created for various purposes such as water-quality enhancement (treatment of
wastewater, stormwater, acid mine drainage, agricultural runoff; Hammer, 1989), flood
minimization, and habitat replacement (Mitsch et al., 1998). Wetlands may be created
unintentionally when regulation of river flows (i.e. installation of large dams) results in periodic
inundation of lands that did not experience inundation prior to regulation (Chen et al., 2009; Yang
et al., 2012). Wetland creation and rewetting of drained soils are common activities in response to
significant wetland loss and degradation on a global scale (Mitsch et al., 1998). There is a great
potential for increasing carbon storage by the rewetting of wetlands (Euliss et al., 2006; Bridgham
et al., 2006). Rewetted wetlands may also have higher emissions of CH4, however, potentially
offsetting the increased carbon storage (Bridgham et al., 2006), although recent studies have
shown that created and rewetted wetlands can be net carbon sinks, even after accounting for CH4
emissions (Badiou et al., 2011; Mitsch et al., 2012).
5.2 LAND REMAINING IN A LAND-USE
CATEGORY
The 2006 IPCC Guidelines define “land remaining in a land-use category” as those lands that have not
undergone any land-use conversion for a default period of at least 20 years. The 2006 IPCC Guidelines provide
generic and land-use category-specific guidance (Chapters 2 and Chapter 4-9, Volume 4) on stock changes in the
carbon pools (above-ground and below-ground biomass; dead wood and litter; and soil organic matter), and non-
CO2 emissions for land remaining in a land-use category for all land-use categories including those containing
mineral soils. This Chapter updates the 2006 IPCC Guidelines for guidance on SOC reference stocks, SOC stock
change factors, and non-CO2 emissions from managed lands with IWMS.

Chapter 5: Inland Wetland Mineral Soils
2013 Supplement to the 2006 IPCC Guidelines for National Greenhouse Gas Inventories: Wetlands 5.9
5.2.1 CO2 emissions and removals
As explained in Chapter 2, Volume 4 of the 2006 IPCC Guidelines, CO2 emissions and removals from managed
lands are estimated on the basis of changes in the carbon stocks in the carbon pools: biomass (above and below-
ground biomass), dead organic matter (dead wood and litter) and soil organic carbon. The set of general
equations to estimate the annual carbon stock changes of carbon pools for land remaining in a land-use category
are given in Chapter 2, Volume 4 of the 2006 IPCC Guidelines, and also apply to managed lands with IWMS.
Figure 1.2 in Chapter 1, Volume 4 of the 2006 IPCC Guidelines shows a decision tree for the identification of
appropriate methodological tiers for land remaining in a land-use category.
5.2.1.1 BIOMASS AND DEAD ORGANIC MATTER
Guidance for changes in the carbon pools in biomass (above-ground, below-ground) and dead organic matter
(dead wood, litter) is provided in the 2006 IPCC Guidelines, and remains unchanged for land remaining in a
land-use category for managed lands with IWMS in this supplement. For managed lands with IWMS classified
as land remaining in a land-use category in Forest Land, Cropland, Grassland, Settlements, or Other Land, the
changes in biomass and dead organic matter are to be determined using the guidance provided in the
corresponding chapters (Chapters 4-9) in Volume 4 of the 2006 IPCC Guidelines.
CHOICE OF METHOD AND EMISSION/REMOVAL FACTORS
As explained in the 2006 IPCC Guidelines, inventories can be developed using Tier 1, 2 and 3 methods. The
decision trees have been provided in the 2006 IPCC Guidelines to guide the selection of the appropriate
methodological tier for the estimation of changes in carbon stocks of biomass and dead organic matter (Fig. 2.2
and Fig. 2.3, Chapter 2, Volume 4). The Tier 1 methods use the default emission factors along with parameters
relating to biomass and dead organic matter provided for specific land-use categories. These will also apply to
managed lands with IWMS in any of the land-use categories. For lower Tier methods it may be assumed that
wetland vegetation does not have substantially different biomass carbon densities than upland vegetation (e.g.
Bridgham et al., 2006). However, if country-specific data is available, it is good practice to use that data to
estimate biomass carbon densities. There is currently no robust scientific information to support development of
emission factors for biomass and dead organic matter for specific management activities, such as drainage of
lands with IWMS, rewetting of drained IWMS, or wetland creation. If there are reliable data for rates of biomass
and/or dead organic matter change upon drainage or rewetting/wetland creation, then country-specific estimates
may be derived using a Tier 2 method.
CHOICE OF ACTIVITY DATA
For Tier 1 methods, activity data consist of areas of managed lands with IWMS in land remaining in a land-use
category stratified by land-use category, climate region, soil type, and management practices. The total areas
should be determined according to the Approaches outlined in Chapter 3 of the 2006 IPCC Guidelines, and
should be consistent with those reported under other sections of the inventory. Stratification of land-use
categories according to climate region, based on default or country-specific classifications can be accomplished
by overlays of land-use onto climate and soil maps. A global GIS database that shows the spatial distribution of
generalized soil classes used for IPCC Tier 1 is available for download and use at http://isirc.org/data/ipcc-
default-soil-classes-derived-harmonized-world-soil-data-base-ver-11. The database is derived from the
Harmonized World Soil Data Base and FAO soil classifications, and includes the seven default IPCC soils
classes, including Wetland Soils (termed “Wetland Soils” in the 2006 IPCC Guidelines, and “Wetland Mineral
Soils” in this Supplement) (Batjes, 2010b). This dataset may be used at national and wider scales where more
detailed soil information is lacking. Although no organisation catalogues changes in area as a result of rewetting
or wetland creation either nationally or globally, local activity data for wetlands with rewetted IWMS may be
obtained from agricultural, forestry, or natural resources agencies, non-governmental conservation organisations,
or other government sources. In addition, organisations such as the Society for Ecological Restoration
(http://www.ser.org), the Global Restoration Network (http://www.globalrestorationnetwork.org), Wetlands
International (http://www.wetlands.org), and the Ramsar Convention on Wetlands (http://www.ramsar.org) may
be sources of information for rewetting and/or wetland creation projects.
Higher Tier methods may use activity data suitably stratified by criteria such as vegetation type and/or water
table level and hydroperiod (e.g. continuously inundated vs. intermittently inundated).

Chapter 5: Inland Wetlands Mineral Soils
5.10 2013 Supplement to the 2006 IPCC Guidelines for National Greenhouse Gas Inventories: Wetlands
UNCERTAINTY ASSESSMENT
Sources of uncertainty for the changes in biomass and dead organic matter in managed lands with IWMS vary
depending on the specific land-use category. In general, uncertainty can arise from: 1) uncertainties in the
mapping of lands, land-use classification and/or management activity data; and 2) uncertainties in carbon gain
and loss, carbon stocks, and other parameters used for the estimation of carbon stock changes in biomass and
dead organic matter, such as biomass expansion factors. Specific recommendations on how to reduce
uncertainties are included in the appropriate land-use category chapter in the 2006 IPCC Guidelines under which
managed lands with IWMS are classified.
5.2.1.2 SOIL CARBON
Soil carbon stocks in managed IWMS are primarily influenced by drainage and other management practices in
Cropland, Forest Land, and Grassland (including long-term cultivation, drainage to improve production, and
grazing), and rewetting after removal from active cropping and restoration of natural hydrologic conditions (e.g.
removal of drainage tiles, plugging of drainage ditches, or similar activities). Other management practices that
can significantly change IWMS soil carbon stocks include harvesting in forests that are prone to paludification
(Lavoie et al., 2005), and the management of river-floodplain systems through the construction of dams, levees,
and river channelization which can disconnect floodplains from hydrologic interaction with rivers (Poff et al.,
1997), thus reducing sediment deposition rates in floodplains (Hupp, 1992; Kleiss, 1996). Only a small number
of studies, however, have quantified the impacts of hydrologic alteration on soil carbon accumulation rates in
IWMS in floodplains (Noe and Hupp, 2005; Cabezas et al., 2009). Therefore, it is not possible to develop robust
emission factors relating to the impacts of hydrologic alteration on soil carbon stocks of IWMS in floodplains at
this time. Similarly, very little information is available on the impacts of other common management practices,
such as grazing, on IWMS soil carbon stocks. Therefore, guidance provided in this chapter is largely based upon
and updates the guidance provided in the 2006 IPCC Guidelines.
General information about mineral soil classification is provided in Chapters 2 and 3, Volume 4 of the 2006
IPCC Guidelines. The generic methodological guidance for estimation of changes in the carbon stocks in the
SOC pool in mineral soils is provided in Section 2.3.3, Chapter 2, Volume 4 of the 2006 IPCC Guidelines and
should be used along with the land-use category specific methodological guidance provided in Chapters 4 to 9,
Volume 4 of the 2006 IPCC Guidelines. This supplement updates the guidance on IWMS provided in the 2006
IPCC Guidelines with regard to the following:
Table 5.2 provides updated default SOCREF values for IWMS (e.g. wetland soils), for use in any land-use
category; and
Table 5.3 provides an updated stock change factor for land-use (FLU) associated with long-term cultivation
of Cropland with IWMS, and a new stock change factor for land-use (FLU) for rewetting of drained IWMS in
Cropland.
To account for changes in IWMS SOC stocks associated with changes in relevant management practices on land
remaining in a land-use category, countries need, at a minimum, estimates of the area of managed land with
IWMS in a land remaining in land-use category that is affected by changes in relevant management practices at
the beginning and end of the inventory time period. Two assumptions are made for mineral soils (see details in
Section 2.3.3.1, Chapter 2, Volume 4 of the 2006 IPCC Guidelines): (i) Over time, SOC reaches a spatially-
averaged, stable value that is specific to the soil, climate, land-use and management practices; and (ii) SOC stock
changes during the transition to a new equilibrium SOC occurs in a linear fashion. If land-use and management
data are limited, aggregate data, such as FAO statistics on land-use (http://www.fao.org/home/en/), can be used
as a starting point, along with expert knowledge about the approximate distribution of land management systems.
Managed land with IWMS must be stratified according to climate regions, which can either be based on default
or country-specific classifications. This can be accomplished with overlays of land-use onto suitable climate and
soil maps.
CHOICE OF METHOD
Inventories can be developed using a Tier 1, 2, or 3 approach, with each successive tier requiring more detail and
resources than the previous one. A decision tree is provided for mineral soils in the 2006 IPCC Guidelines
(Figure 2.4, Section 2.3.3.1, Chapter 2, Volume 4) to assist inventory compilers with selection of the appropriate
tier for their soil carbon inventory.

Chapter 5: Inland Wetland Mineral Soils
2013 Supplement to the 2006 IPCC Guidelines for National Greenhouse Gas Inventories: Wetlands 5.11
Tier 1
The Tier 1 estimation method for mineral soils in land remaining in a land-use category, including IWMS, is
based on changes in SOC stocks over a finite transition period following such changes in management that
impact the SOC. Equation 2.25, Chapter 2, Volume 4 of the 2006 IPCC Guidelines (∆Cmineral=(SOC0-SOC(0-T))/D;
see the 2006 IPCC Guidelines for full equation) is used to estimate change in SOC stocks in mineral soils by
subtracting the SOC stock in the last year of an inventory time period (SOC0) from the C stock at the beginning
of the inventory time period (SOC(0 –T)) and dividing by the time dependence of the stock change factors (D).
SOC stocks are estimated for the beginning and the end of the inventory time period using default reference
carbon stocks (SOCREF) (Table 5.2) and default stock change factors (FLU, FMG, FI), based on the land use (LU),
the management regime (MG) and the input of organic matter (I) at the time of the inventory. In practice,
country-specific data on land use and management must be obtained and classified into appropriate land
management systems, and then stratified by IPCC climate region and soil type. The Tier 1 assumptions for
carbon stock changes in mineral soils in land remaining in a land-use category for specific land-use categories
will also apply to managed lands with IWMS in those land-use categories.
Tier 2
For Tier 2, the same basic equations are used as in Tier 1 (Equation 2.25 in Chapter 2, Volume 4 of the 2006
IPCC Guidelines), but country-specific information is incorporated to improve the accuracy of the stock change
factors, reference SOC stocks, climate regions, soil types, and/or land management classification systems.
Tier 3
Tier 3 approaches may use empirical, process-based or other types of models as the basis for estimating annual
carbon stock changes. Examples include the Century ecosystem model (Parton et al., 1987, 1994, 1998; Ogle et
al., 2010), and the Wetland-DNDC model (Zhang et al., 2002). Estimates from models are computed using
equations that estimate the net change in soil carbon. Key criteria in selecting an appropriate model include its
capability to represent all of the relevant management practices/systems for the land-use category; model inputs
(i.e. driving variables) that are compatible with the availability of country-wide input data; and verification
against experimental, monitoring or other measurement data (e.g. Ogle et al.,2010).
A Tier 3 approach may also be developed using a measurement-based approach in which a monitoring network
is sampled periodically to estimate SOC stock changes. A much higher density of benchmark sites will likely be
needed than with models to adequately represent the combination of land use and management systems, climate,
and soil types. Additional guidance is provided in Section 2.3.3.1 of Chapter 2 of this supplement.
CHOICE OF EMISSION FACTORS
Tier 1
Table 5.2 gives updated default reference SOC stocks (SOCREF) for IWMS3. Inventory compilers should use the
stock change factors provided in the appropriate chapters for the six land-use categories (Chapters 4-9) in
Volume 4 of the 2006 IPCC Guidelines in conjunction with the data in Table 5.2 for Tier 1 methods.
3 These values are given under “wetland soils” in Table 2.3, Chapter 2, Volume 4 of the 2006 IPCC Guidelines.

Chapter 5: Inland Wetlands Mineral Soils
5.12 2013 Supplement to the 2006 IPCC Guidelines for National Greenhouse Gas Inventories: Wetlands
TABLE 5.2
DEFAULT REFERENCE SOIL ORGANIC CARBON STOCKS (SOCREF) FOR WETLAND MINERAL SOILSA
UNDER NATIVE
VEGETATION (0-30 CM DEPTH).
Climate region tonnes C ha-1
Standard
deviation
Error (95%
confidence
intervalB)
Number of sites
Boreal 116 94 ±99 6
Cold temperate, dry 87C n/aD n/aD n/aD
Cold temperate, moist 128 55 ±17 42
Warm temperate, dry 74 45 ±13 49
Warm temperate, moist 135 101 ±39 28
Tropical, dry 22 11 ±4 32
Tropical, moist 68 45 ±12 55
Tropical, wet 49 27 ±9 33
Tropical, montane 82 73 ±46 12
A Batjes (2011) presents revised estimates (means, standard deviations) of the 2006 IPCC Guidelines SOC stocks for wetland mineral soils (gleysols) under natural
vegetation based on an expanded version of the ISRIC-WISE database (Batjes, 2009) which contains 1.6 times the number of soil profiles compared to the databases
used in the 2006 IPCC Guidelines SOC stocks estimate.
B The 95% confidence interval is calculated from the mean, standard deviation, and the critical values of t distribution according to the degrees of freedom.
C No revised estimate was presented in Batjes (2011); values are from Table 2.3, Chapter 2, Volume 4 of the 2006 IPCC Guidelines .
D ”n/a” indicates that information is not available.
The updated SOCREF values for WMS presented in Table 5.2 for WMS should be used for calculating SOC stock
changes in IWMS when soils are classified as Wetland Soils, for land remaining in a land-use category in the
following sections of the 2006 IPCC Guidelines:
Forest Land (Chapter 4): Section 4.2.3, Tier 1;
Cropland (Chapter 5): Section 5.2.3, Tier 1; and
Grassland (Chapter 6): Section 6.2.3, Tier 1.
Default stock change factors for land-use (FLU), input (FI), and management (FMG) that apply to managed land on
IWMS in the Cropland Remaining Cropland land-use category are presented in Table 5.5, Chapter 5, Volume 4
of the 2006 IPCC Guidelines. Similarly, default stock change factors for land-use (FLU), input (FI), and
management (FMG) that apply to managed land with IWMS in the Grassland Remaining Grassland land-use
category are presented in Table 6.2, Chapter 6, Volume 4 of the 2006 IPCC Guidelines.
Table 5.3 in this supplement provides an updated Tier 1 default stock change factor for land-use (FLU) that
should be applied to Cropland with IWMS under “long-term cultivation.” Note that the updated factor applies
only to long-term cultivated land use in the temperate or boreal dry and moist climate regions. All other default
stock change factors in the 2006 IPCC Guidelines are unchanged. The updated value is similar to those values in
Table 5.5 of Chapter 5 of Volume 4 of the 2006 IPCC Guidelines for temperate/boreal moist climate but lower
than the temperate/boreal dry climate values. Consequently, this update should reduce uncertainties associated
with estimating soil carbon stock changes for IWMS in dry climates. The method and studies used to derive the
updated default stock change factor are provided in Annex 5A.1. The default time period for stock changes (D)
is 20 years, and management practices are assumed to influence stocks up to 30 cm depth, although greater
depths can also be affected. As a result, for Tier 1 and 2 methods, SOC stocks for mineral soils are computed to a
default depth of 30 cm. Greater soil depth may be selected and used at Tier 2, if data are available.
A new default stock change factor for land-use (FLU) following rewetting of Cropland with IWMS is also
provided in Table 5.3, for a Tier 1 approach. This factor applies to Cropland with IWMS where natural
hydrology has been restored, and where crop production may or may not continue. Note that the factor applies to
all climate regions, with the caveat that this value is likely to be more representative of rewetting activities in
temperate and boreal climates, as it is derived from studies limited to these regions (see Annex 5A.1 for method
and studies). The default time period for stock changes (D) is 20 years, however additional C gain from restoring
natural hydrology continues for a further 20 years and will reach the reference SOC stock level (SOCREF values
in Table 5.2) after 40 years. It is also important to note that the long-term cultivation factor is used for areas that

Chapter 5: Inland Wetland Mineral Soils
2013 Supplement to the 2006 IPCC Guidelines for National Greenhouse Gas Inventories: Wetlands 5.13
have been drained and are cultivated for crop production. If the high water table is restored, i.e. in the case of
rewetted Cropland, then FLU for rewetting should be used for two sets of 20 year periods (i.e. 0–20 and 21–40
years).
TABLE 5.3
RELATIVE STOCK CHANGE FACTORS FOR LAND-USE (FLU) FOR LONG TERM CULTIVATION ON CROPLAND WITH IWMS (OVER
20 YEARS) AND REWETTING OF CROPLAND WITH IWMS (OVER 20 YEARS AND 40 YEARS)
Factor value type Management Temperature
regime
Moisture
regime Default Error
A Description
Land-use (FLU) Long-term
cultivatedB
Temperate/
Boreal
Dry and
moist 0.71 41%
Represents
Cropland with
IWMS that has
been continuously
managed for > 20
years, for
predominantly
annual crops.
Land-use (FLU)
Rewetting
(Years 1–20) Boreal,
temperate,
and tropical
Dry and
moist
0.80 10%
Represents
cropland with
IWMS that has
undergone
rewetting
(restoration of
natural hydrology)
and may or may
not be under active
crop production.
Rewetting
(Years 21–40) 1.0 N/A
A ± two standard deviations, expressed as a percentage of the mean.
B The long-term cultivation factor is used for areas that have been drained and are cultivated for crop production. In the case of rewetted Cropland, stock change factors for
land-use (FLU
) for rewetting are used for two sets of 20-year periods (i.e. 0–20 and 21–40 years since rewetting).
The following are the key considerations in the application of the new stock change factors to Cropland with
IWMS subject to long-term cultivation and rewetting (Table 5.3) for land remaining in a land-use category:
The stock change factors for SOC in mineral soils provided for Forest Land, Cropland, Grassland, and
Settlements in the 2006 IPCC Guidelines are applicable to all managed lands with IWMS, classified as land
remaining in a land-use category under any of the land-use categories.
The new stock change factors for long-term cultivation and rewetting of Cropland with IWMS provided in
this supplement (Table 5.3) should be applied to Cropland Remaining Cropland with IWMS, taking account
of the following:
(i) The new stock change factor for land-use (FLU) for Cropland with IWMS under long-term cultivation
in this supplement should be used in place of the existing stock change factor for Cropland under long-
term cultivation for all mineral soil types provided in Table 5.5, Chapter 5, Volume 4 in the 2006
IPCC Guidelines.
(ii) The stock change factors for land-use (FLU) for Cropland with IWMS subject to rewetting should be
used for Cropland Remaining Cropland according to the following:
o For Cropland with IWMS subject to rewetting, for the first 20 years following the initial year of
rewetting, the final SOC stock i.e. SOC stocks in the last year of an inventory time period (SOC0)
is determined using FLU = 0.80, along with the other stock change factors for management and
input. The stock change factors used for estimating the initial SOC stocks (SOC(0-T)) will
correspond to the Cropland land use (long-term cultivated, perennial, etc.) and management and
input regimes prior to rewetting.
o For the next set of 20 years (i.e. 21–40 years since the initial year of rewetting), FLU = 1 should be
used to estimate the final SOC stock (SOC0) along with appropriate stock change factors for
management and input. The stock change factors for estimating the initial stocks (SOC (0-T)) will
correspond to the rewetted Cropland land-use (FLU = 0.8) and management and input regimes at 20
years following rewetting.

Chapter 5: Inland Wetlands Mineral Soils
5.14 2013 Supplement to the 2006 IPCC Guidelines for National Greenhouse Gas Inventories: Wetlands
o For the period longer than 40 years following the initial year of rewetting, FLU will remain 1. The
changes in SOC stocks as a result of changes in management/input regimes in Cropland with
IWMS may be estimated using appropriate stock change factors from Table 5.2, Chapter 5,
Volume 4 in the 2006 IPCC Guidelines.
Box 5.3 shows an example calculation using the stock change factors for land use (FLU) for Cropland with
IWMS under long-term cultivation, and for Cropland with IWMS subject to rewetting.
Tier 2
A Tier 2 approach involves the estimation of country-specific stock change factors. It is good practice to derive
values for a higher resolution classification of management and climate if there are significant differences in the
stock change factors among more disaggregated categories based on an empirical analysis. Reference SOC
stocks can also be derived from country-specific data in a Tier 2 approach. Additional guidance is provided in
Section 2.3.3.1, Chapter 2, Volume 4 of the 2006 IPCC Guidelines.
Tier 3
In a Tier 3 approach, constant stock change rate factors per se are less likely to be estimated in favour of variable
rates that more accurately capture land use and management effects. See Section 2.3.3.1, Chapter 2, Volume 4 of
the 2006 IPCC Guidelines for further discussion.
CHOICE OF ACTIVITY DATA
At a minimum, activity data consist of areas of managed lands with IWMS remaining in a land-use category
stratified by land-use category, climate region, soil type, and management practices. In addition, the areas of
Cropland with IWMS subject to rewetting need to be stratified by time since rewetting (0–20 or 21–40 years
since rewetting) for the correct application of stock change factors. If the compiler does not have sufficient
information to disaggregate areas of rewetted Cropland with IWMS by the time since conversion, all rewetted
Cropland with IWMS areas can be assumed to be within 0–20 years of rewetting, and thus FLU = 0.8 could be
applied to the entire rewetted Cropland with IWMS. Total areas should be determined according to the
approaches outlined in Chapter 3, Volume 4 of the 2006 IPCC Guidelines, and should be consistent with those
reported under other sections of the inventory. Stratification of land-use categories according to climate region,
based on default or country-specific classifications, can be accomplished with overlays of land use on climate
and soil maps. In the case of using methods such as models, and/or data as proxies for estimation, clear and
complete documentation is encouraged for transparency.
Tier 1
The Tier 1 approach requires area of managed land on IWMS for each land-use category stratified by climate
region and soil type. As an initial approach, available land cover/land-use maps, either country-specific or based
on global datasets such as IGBP_DIS (http://daac.ornl.gov), can be joined with soil and climate maps (country-
specific, or global maps such as ISRIC, http://www.isric.org, or FAO, http://www.fao.org/home/en). A global
GIS database that shows the spatial distribution of generalized soil classes used for IPCC Tier 1 is available for
download and use at http://isirc.org/data/ipcc-default-soil-classes-derived-harmonized-world-soil-data-base-ver-
11. The database is derived from the Harmonized World Soil Database and FAO soil classifications, and
includes the seven default IPCC soils classes, including Wetland Soils (termed “Wetland Soils” in the 2006
IPCC Guidelines, and “Wetland Mineral Soils” in this supplement) (Batjes, 2010b). This dataset may be used at
national and broader scales where more detailed soil information is lacking.
Classification systems for activity data for a Tier 1 inventory are provided in the respective land-use chapters of
the 2006 IPCC Guidelines. Land-use activity data and management activity data specific to the respective land-
use category are typically required for a Tier 1 approach. Although no organisation catalogues changes in area as
a result of rewetted or created wetlands either nationally or globally, local activity data for rewetting of managed
lands with IWMS or the creation of wetlands may be obtained from agricultural, forestry, or natural resources
agencies, non-governmental conservation organisations, or other government sources. In addition, organisations
such as the Society for Ecological Restoration (http://www.ser.org), the Global Restoration Network
(http://www.globalrestorationnetwork.org), Wetlands International (http://www.wetlands.org), and the Ramsar
Convention on Wetlands (http://www.ramsar.org) may be sources of information for rewetting and wetland
creation projects.
Tier 2
Tier 2 approaches are likely to involve a more detailed stratification of management systems, under the
respective land-use category, than Tier 1 approaches if sufficient data are available. This may include further
divisions of management practices and finer stratification of climate regions. At Tier 2, a higher spatial
resolution of activity data is required and may be obtained by disaggregating global data into country-specific
categories or by collecting country-specific activity data.

Chapter 5: Inland Wetland Mineral Soils
2013 Supplement to the 2006 IPCC Guidelines for National Greenhouse Gas Inventories: Wetlands 5.15
Tier 3
Tier 3 approaches may include the use of empirical, process-based or other types of models and/or direct
measurement-based inventories. In this case more detailed data on climate, soils, and management practices are
needed, as compared to Tier 1 and 2 methods. The exact requirements will be dependent on the model or
measurement design. Examples of model input data include activity data on cropland management practices
(crop type, tillage practices, fertilizer and organic amendments), as well as climate, soil, biomass, and water table
position (Ogle et al., 2010; Zhang et al., 2002).
CALCULATION STEPS FOR TIER 1
The steps for estimating SOC0, SOC (0-T) and net soil organic carbon stock change per hectare for managed land
with IWMS for land remaining in a land-use category are as follows:
Step 1: Organize data into time series according to the years in which activity data were collected.
Step 2: Classify land into the appropriate management system in accordance with its respective land-use
category.
Step 3: Determine areas of managed land with IWMS under each land-use category for lands remaining in that
land-use category, disaggregated according to climate region at the beginning of the first inventory time period.
The first year of the inventory time period will depend on the time step of the activity data (0-T; e.g. 5, 10, or 20
years ago).
Step 4: Assign a native reference SOC stock value (SOCREF) for IWMS from Table 5.2, based on climate region.
Step 5: Assign a land-use factor (FLU), management factor (FMG), and organic matter input factor (FI) based on
the management classification for the respective land-use category (Step 2). Values for FLU, FMG, and FI are
provided in the respective chapters relating to land-use categories; an updated value for long-term cultivation FLU
is given in Table 5.3 for IWMS in Cropland.
Step 6: Multiply the appropriate stock change factors (FLU, FMG, FI) by SOCREF to estimate an ‘initial’ SOC stock
(SOC(0-T)) for the inventory time period.
Step 7: Estimate the final SOC stock (SOC0) by repeating Steps 1 to 5 using the same SOCREF, but with land
use, management, and input factors that represent conditions for the managed land in the last (year 0) inventory
year.
Step 8: Estimate the average annual change in SOC stocks for managed land on IWMS remaining in a land-use
category (ΔCMineral) by subtracting the SOC(0-T) from SOC0 and then dividing by the time dependence of the stock
change factors (D) which is 20 years for default factors. If an inventory time period is greater than 20 years, then
divide by the difference in the initial and final year of the time period.
Step 9: Repeat steps 2 to 8 if there are additional inventory time periods.

Chapter 5: Inland Wetlands Mineral Soils
5.16 2013 Supplement to the 2006 IPCC Guidelines for National Greenhouse Gas Inventories: Wetlands
BOX 5.3
EXAMPLE CALCULATIONS FOR SOC STOCKS IN LONG-TERM CULTIVATED CROPLAND WITH IWMS, AND
REWETTING OF LONG-TERM CULTIVATED CROPLAND WITH IWMS
Assume an area with a cold temperate, dry climate. A crop is newly cultivated on an IWMS. For
the first 20 years after the initiation of cultivation, the SOC will decrease linearly by 71% (see 0.71
as default value in Table 5.3) down to a depth of 30 cm. From Table 5.2, it can be seen that the
reference SOC for this climate region is 87 tonnes C ha-1. After 20 years of cultivation, the amount
of SOC will be 61.8 tonnes C ha-1 (87 tonnes C ha-1 x 0.71 = 61.8 tonnes C ha-1), which represents
a loss of 25.2 tonnes C ha-1 over the 20 years, or 1.26 tonnes C ha-1 yr-1. After 20 years, it is
assumed that the SOC is stable at 61.8 tonnes C ha-1.
If we take this same soil and rewet it following drainage for crop production, the SOC will be 80%
of the reference condition after 20 years, or 69.6 tonnes C ha-1 (87 tonnes C ha-1 x 0.80 = 69.6
tonnes C ha-1). The increase from 61.8 tonnes C ha-1 (from calculation above) is 7.8 tonnes C ha-1
or 0.39 tonnes C ha-1 yr-1 for the first 20 years. From year 21–40, the SOC will increase an
additional 20% (1.0–0.8 from Table 5.3) so that at year 40 the SOC is at the reference level of 87
tonnes C ha-1 (Table 5.2). In the Tier 1 method, the SOC is assumed to accrue linearly from years
21–40. The difference between the SOC at year 20 (69.6 tonnes C ha-1) and year 40 (87.0 tonnes
C ha-1) is 17.4 tonnes C ha-1, thus the annual accrual rate is 0.87 tonnes C ha-1 yr-1 between years
21 and 40.
UNCERTAINTY ASSESSMENT
Three broad sources of uncertainty exist in soil C inventories: 1) uncertainties in land use and management
activity, and environmental data; 2) uncertainties in reference soil carbon stocks if using a Tier 1 or 2 approach,
or initial conditions if using a Tier 3 approach; and 3) uncertainties in the stock change/emission factors for Tier
1 or 2 approaches, model structure/parameter error for Tier 3 model-based approaches, or measurement
error/sampling variability associated with Tier 3 measurement-based inventories. In general, precision of an
inventory is increased and confidence ranges are smaller with more sampling to estimate values for the three
broad sources of uncertainty, while reducing bias (i.e. improve accuracy) is more likely to occur as a result of
development of a higher tier inventory that incorporates country-specific information. An additional source of
uncertainty arises from the difficulty in accurately mapping wetlands for the purposes of classification under soil
or vegetation types and different management activities, for example; this has been an issue since inventory
methods were first developed (Cowardin, 1982), and still continues even with advances in technology and
remote sensing techniques (Arnesen et al., 2013). As mapping techniques tend to rely on vegetation and soils
information, defining the area of IWMS is especially difficult because their vegetation range from marsh to
forested systems, and soils range from near organic to near non-wetland mineral. Moreover, the extent of areas
subject to water table variation and flooding may increase or decrease frequently, depending on interannual
climate variability and management activities. However, given no dramatic changes in hydrology, wetland soil
and vegetation properties will remain consistent over time, even with interannual climate variability, and mapped
areas should remain relatively unchanged.
For Tier 1, uncertainties are provided alongside the reference SOC stocks in Table 5.2, and stock change factors
in the respective land-use category chapters in the 2006 IPCC Guidelines and Table 5.3 for the updated FLU.
Uncertainties in land-use and management data will need to be addressed by the inventory compiler, and
combined with uncertainties for the default factors and reference SOC stocks using an appropriate method, such
as simple error propagation equations. If using aggregate land-use area statistics for activity data (e.g. FAO data),
the inventory compiler may need to apply a default level of uncertainty for the land area estimates (±50%). It is
good practice to apply country-specific uncertainty estimates to country-specific area estimates rather than use a
default level. Default reference SOC stocks and stock change factors for mineral soils can have inherently high
uncertainties when applied to specific countries. The defaults represent globally averaged values of land-use and
management impacts or reference SOC stocks that may deviate from region-specific values (Powers et al., 2004;
Ogle et al., 2006). Bias can be reduced by deriving country-specific factors using a Tier 2 method or by
developing a Tier 3 country-specific estimation system. The underlying basis for higher Tier approaches will be
experiments or soil carbon monitoring data in the country or neighbouring regions that address the effect of land
use and management on soil carbon and/or can be used to evaluate model predictions of soil carbon change (e.g.
Ogle et al., 2010). Further reduction in bias can be obtained by accounting for significant within-country
differences in land-use and management impacts, such as variation among climate regions and/or soil types, even

Chapter 5: Inland Wetland Mineral Soils
2013 Supplement to the 2006 IPCC Guidelines for National Greenhouse Gas Inventories: Wetlands 5.17
at the expense of reduced precision in the factor estimates (Ogle et al., 2006). Bias is considered more
problematic for reporting stock changes because it is not necessarily captured in the uncertainty range (i.e. the
true stock change may be outside of the reported uncertainty range if there is significant bias in the factors).
Uncertainties in land-use activity statistics may be reduced through a better national system, such as developing
or extending a ground-based survey with additional sample locations and/or incorporating remote sensing to
provide additional coverage. It is good practice to design a classification that captures the majority of land-use
and management activities with a sufficient sample size to minimize uncertainty at the national scale.
5.2.2 CH4 emissions from managed lands with IWMS
Management activities that alter the water table level on lands containing IWMS can impact CH4 emissions from
those areas. Two common management activities that involve raising water table levels include the rewetting of
previously drained IWMS, and the creation of wetlands on wet or dry mineral soils. Both rewetting and wetland
creation are often undertaken as conservation efforts for habitat and wildlife. Studies have shown that raising
water table levels on managed lands with IWMS, through rewetting and/or wetland creation, can increase CH4
emissions (Pennock et al., 2010; Badiou et al., 2011; Nahlik and Mitsch, 2010; Herbst et al., 2011; Yang et al.,
2012). Here we provide guidance for estimating CH4 emissions as a result of raising the water table level on
managed lands with IWMS; drainage and lowering water tables typically results in lower or negligible CH4
emissions (Morse et al., 2012). In a modeling study of global CH4 emissions, Spahni et al. (2011) suggest that
IWMS that are not inundated, but have soil moisture content above a critical threshold, can still be a net CH4
source. Due to the lack of studies, however, we are unable to develop guidance for CH4 emissions from drained
IWMS at this time.
Although our current understanding of the processes involved in CH4 production and emission is improving, it
remains difficult to estimate CH4 emissions with a high degree of confidence due mainly to the large spatial
variability, as well as to seasonal and interannual variability in the controlling factors such as water level and
temperature. Studies show high spatial variability in CH4 emissions across large areas that have similar climate,
vegetation, and topography, and within small areas that have microscale variations in topography (Ding et al.,
2003; Saarnio et al., 2009). In addition, there are very few studies into CH4 emissions from rewetted or created
wetlands on managed lands with IWMS in Europe (Saarnio et al., 2009), tropical regions (Mitsch et al., 2010),
and certain regions of North America. Therefore, the default emission factors we present will necessarily have
large uncertainties. Due to the relative lack of data on rewetted and created wetlands with IWMS, we have
included studies of CH4 emissions from natural wetlands on IWMS in the development of default emission
factors (see Annex 5A.2 for further details).
5.2.2.1 CHOICE OF METHOD
Tier 1
CH4 emissions from managed lands on IWMS, or dry mineral soils, where management activities have resulted
in the water table being raised to, or above, the land surface are estimated using a simple emission factor
approach (Equation 5.1), stratified by climate region. The default methodology considers boreal, temperate, and
tropical climate regions.
EQUATION 5.1
ANNUAL CH4 EMISSIONS FROM REWETTED AND CREATED WETLANDS ON MANAGED LANDS WITH
IWMS
c
cIWMSCHIWMSIWMS EFACH )(44
Where:
CH4-IWMS = Annual CH4 emissions from managed lands on IWMS where management activities have
raised the water table level to or above the land surface, kg CH4 yr-1
AIWMS, c = Total area of managed lands with mineral soil where the water table level has
been raised in climate region c, ha
EFCH4-IWMS, c = Emission factor from managed lands with mineral soil where water table level has
been raised in climate region c, kg CH4 ha-1 yr-1

Chapter 5: Inland Wetlands Mineral Soils
5.18 2013 Supplement to the 2006 IPCC Guidelines for National Greenhouse Gas Inventories: Wetlands
The area of managed lands with IWMS, or dry mineral soil, where water table level has been raised, should be
stratified by climate region (boreal, temperate, or tropical), and the appropriate emission factor applied.
Tier 2
The Tier 2 approach uses country-specific emission factors based on information on important parameters such
as water table level and hydroperiod. It is good practice when developing and using country-specific emission
factors to consider the water table position and its relationship to CH4 emissions. Annual CH4 emissions from
IWMS are generally larger when the water table is continuously at or above the land surface, rather than
intermittently at or below the land surface (Annex 5A.2). Seasonal and interannual changes in water table
position, and duration above the land surface, are determined by multiple variables including fluctuations in
water source such as river discharge in the case of riparian wetlands, as well as evapotranspiration and
precipitation.
Tier 3
A Tier 3 approach involves a detailed consideration of the dominant drivers of CH4 emission from IWMS,
including but not limited to: water table position; seasonal changes in inundation; temperature of soils;
importance of CH4 ebullition; and vegetation community dynamics. CH4 ebullition is a poorly quantified
component of CH4 emission from inundated soils, but has been shown to be a significant contributor to annual
CH4 emission in some systems (Wilson et al., 1989). Vegetation can have important implications for CH4
emissions, by facilitating transport from inundated soils to the atmosphere, and by providing a substrate for CH4
production. Possible methods to determine the importance of these drivers to CH4 emissions, and thus to reduce
uncertainty in emission factors, include detailed field studies of CH4 emission and/or the use of models specific
to carbon cycling in wet soils, such as the Wetland-DNDC model (Zhang et al., 2002;
http://www.globaldndc.net).
5.2.2.2 CHOICE OF EMISSION FACTORS
Tier 1
The default emission factors for IWMS (EFCH4-IWMS), stratified by climate region, are provided in Table 5.4. The
Tier 1 emission factors do not distinguish between continuous and intermittent inundation, as they were derived
from studies covering a range of inundation durations, therefore capturing a degree of variability in CH4
emissions (Annex 5A.2). The uncertainties in the EFs can be reduced by using country-specific EFs that
incorporate information on water table position and period of inundation at higher Tier levels.
TABLE 5.4
DEFAULT EMISSION FACTORS FOR CH4 FROM MANAGED LANDS WITH IWMS WHERE WATER TABLE
LEVEL HAS BEEN RAISED
Climate Region EFCH4-IWMS
(kg CH4 ha-1
yr-1
) 95% Confidence Interval
A
Number of
Studies
Boreal 76 ±76B 1C
Temperate 235 ±108 21
Tropical 900 ±456 18
AThe 95% confidence interval is calculated from the mean, standard deviation, and the critical values of the t distribution, according to the
degrees of freedom. These are not expressed as a percentage of the mean.
B Bridgham et al. (2006)
C This study (Bridgham et al., 2006) is a synthesis of numerous studies; see publication for details.
5.2.2.3 CHOICE OF ACTIVITY DATA
The Tier 1 method requires data on areas of managed lands with IWMS where the water table level has been
raised, for instance as in rewetting or wetland creation, stratified by climate region. Although no organisation
catalogues changes in area as a result of rewetting or wetland creation, either nationally or globally, local activity
data for rewetting of managed lands with IWMS or the creation of wetlands may be obtained from agricultural,
forestry, or natural resources agencies, non-governmental conservation organisations, or other government
sources. In addition, organisations such as the Society for Ecological Restoration (http://www.ser.org), the
Global Restoration Network (http://www.globalrestorationnetwork.org), Wetlands International

Chapter 5: Inland Wetland Mineral Soils
2013 Supplement to the 2006 IPCC Guidelines for National Greenhouse Gas Inventories: Wetlands 5.19
(http://www.wetlands.org), and the Ramsar Convention on Wetlands (http://www.ramsar.org) may be used as
sources of information for rewetting and/or wetland creation projects. In addition to the above, Tier 2 and Tier 3
methods generally require the areas of managed lands with IWMS stratified by annual average water table level,
and the seasonal and/or interannual changes in inundation. For the development of country-specific emission
factors and models, areas may be further stratified by vegetation community composition, vegetation biomass,
soil temperature, and previous land-use. The use of Synthetic Aperture Radar (SAR) on the Japanese Satellite
JERS, for example, can improve the accuracy of the quantification of inundated areas, by overcoming the bias
caused by clouds in more common satellite imagery on the visible spectrum (e.g. Landsat images). Also, higher
resolution satellite images (e.g. QuickBird) can reduce uncertainties in land-use and vegetation classifications.
5.2.2.4 UNCERTAINTY ASSESSMENT
Estimates of uncertainty for EFCH4-IWMS, as ± 95% Confidence Interval, are provided in Table 5.4 for each
climate region. Major sources of uncertainty in these values are the small number of studies on which the
estimates are based, and the combination of studies with different inundation periods (continuously-inundated
and intermittently-inundated). The development of country-specific emission factors will aid in reducing
uncertainty.
5.3 LAND CONVERTED TO A NEW LAND-USE
CATEGORY
The 2006 IPCC Guidelines define land converted to a new land-use category as lands that have been converted
in the last 20 years as a default period. The 2006 IPCC Guidelines provide generic and land-use category-
specific guidance (Chapters 2, Chapters 4-9, Volume 4) for estimating carbon stock changes in the carbon pools
and non-CO2 emissions from managed land on mineral soils for land converted to a new land-use category for all
land-use categories. This chapter updates the guidance provided in the 2006 IPCC Guidelines on changes in
SOC stocks and non-CO2 emissions from managed lands with IWMS that have been classified as land converted
to a new land-use category in all six land-use categories.
5.3.1 CO2 emissions and removals
The set of general equations used to estimate the annual carbon stock changes of carbon pools in land remaining
in a land-use category for managed lands with IWMS are given in Chapter 2, Volume 4 of the 2006 IPCC
Guidelines, and these will also apply to managed lands with IWMS for land converted to a new land-use
category.
Figure 1.3, Chapter 1, Volume 4 of the 2006 IPCC Guidelines presents a decision tree for the identification of
appropriate methodological Tier for the inventory of land converted to a new land-use category.
5.3.1.1 BIOMASS AND DEAD ORGANIC MATTER
The guidance provided in Section 5.2.1.1 also applies to lands converted to a new land-use category for managed
lands with IWMS. The guidance in sections pertaining to land converted to a new land-use category in the 2006
IPCC Guidelines should be used.
CHOICE OF METHOD AND EMISSION/REMOVAL FACTORS
The guidance provided in Section 5.2.1.1 also applies to lands converted to a new land-use category for managed
lands with IWMS. The guidance in sections pertaining to land converted to a new land-use category in the 2006
IPCC Guidelines should be used.
CHOICE OF ACTIVITY DATA
The activity data consist of areas of managed lands with IWMS in land converted to a new land-use category,
stratified by land-use category, climate region, soil type, and management practices, at a minimum. The
guidance provided in Section 5.2.1.1 also applies to lands converted to a new land-use category for managed
lands with IWMS. The guidance in sections pertaining to land converted to a new land-use category in the 2006
IPCC Guidelines should be used.

Chapter 5: Inland Wetlands Mineral Soils
5.20 2013 Supplement to the 2006 IPCC Guidelines for National Greenhouse Gas Inventories: Wetlands
UNCERTAINTY
The guidance provided in Section 5.2.1.1 also applies to lands converted to a new land-use category for managed
lands with IWMS. The guidance in sections pertaining to land converted to a new land-use category in the 2006
IPCC Guidelines should be used.
5.3.1.2 SOIL CARBON
Conversion of land on IWMS to other land uses can result in an increase in SOC stocks (e.g. in Forest Land; see
Chapter 4, Volume 4 of the 2006 IPCC Guidelines) or a decrease in SOC stocks (e.g. in Cropland; see Chapter 5,
Volume 4 of the 2006 IPCC Guidelines). In general, the guidance provided in Section 5.2.1.2 also applies to land
converted to a new land-use category for managed lands with IWMS. However, there are specific applications of
the new SOC stock change factors for rewetting, depending on the specific land-use conversion (see Choice of
Emission/Removal Factors below for details). The guidance in sections pertaining to land converted to a new
land-use category in the 2006 IPCC Guidelines should be used.
CHOICE OF METHOD
The guidance provided in Section 5.2.1.2 also applies to land converted to a new land-use category for managed
lands with IWMS. The guidance in sections pertaining to land converted to a new land-use category in the 2006
IPCC Guidelines should be used.
CHOICE OF EMISSION/REMOVAL FACTORS
The guidance provided in Section 5.2.1.2 also applies to all land converted to a new land-use category for
managed lands with IWMS in any land-use category, including the updated SOCREF for IWMS (Table 5.2) and
the updated and new stock change factors (FLU, Table 5.3). The following are the key considerations in the
application of stock change factors for managed lands with IWMS:
The stock change factors for SOC stock changes in mineral soils provided for Forest, Cropland, Grassland,
and Settlements in the 2006 IPCC Guidelines are applicable for all land-use conversions (both to and from),
involving managed lands with IWMS classified under any of the land-use categories.
The new stock change factors for long-term cultivation and rewetting of Cropland with IWMS provided in
this supplement (Table 5.3) can be applied to land-use conversions involving Cropland taking account of the
following:
(i) The new stock change factor for land-use (FLU) for Cropland with IWMS under long-term
cultivation provided in this supplement should be used in place of the existing stock change factor
for Cropland under long-term cultivation for all mineral soil types provided in Table 5.5, Chapter 5,
Volume 4 of the 2006 IPCC Guidelines.
(ii) The stock change factors for land-use (FLU) for Cropland with IWMS subject to rewetting can be
used for land-use conversions involving Cropland in the following ways:
o For land-use conversion to Cropland with IWMS subject to rewetting, the final SOC stock (SOC0)
is determined using FLU = 0.80 for a period of 0–20 years following the first year of rewetting,
along with the relevant stock change factors corresponding to the management and input regimes
after land-use conversion. The stock change factors used for estimating the initial SOC stocks
(SOC(0-T)) should correspond to the land use, management and input regimes before the land-use
conversion.
o For Cropland with IWMS subject to rewetting undergoing land-use conversion to any other land-
use category, FLU = 1 should be used for a period of 21–40 years, or more than 40 years since the
first year of rewetting activity respectively, along with relevant stock change factors corresponding
to the management and input regime before conversion. The stock change factors for land-use,
management and input for the new land-use category (e.g. Forest Land or Grassland) should be
used to determine the final SOC stock (SOC0) along with relevant stock change factors
corresponding to the management and input regimes following the land-use conversion.
o The guidance in sections pertaining to land converted to a new land-use category in the 2006 IPCC
Guidelines should also be used.
CHOICE OF ACTIVITY DATA
The activity data consist of areas of managed lands with IWMS in land converted to a new land-use category
stratified by land-use category, climate region, soil type, management practices, and time since conversion, at a
minimum. The area of Cropland with IWMS subject to rewetting need to be stratified by the time since rewetting

Chapter 5: Inland Wetland Mineral Soils
2013 Supplement to the 2006 IPCC Guidelines for National Greenhouse Gas Inventories: Wetlands 5.21
(0–20 or 21–40 years since rewetting) for the correct application of stock change factors. If the compiler does not
have sufficient information to disaggregate the areas of rewetted Cropland with IWMS by the time since
conversion, all the areas of rewetted Cropland with IWMS can be assumed to be within 0–20 years of rewetting,
and therefore FLU = 0.8 may be applied to the entire rewetted Cropland with IWMS. The guidance provided in
Section 5.2.1.2 also applies to land converted to a new land-use category for managed lands with IWMS.
UNCERTAINTY
The guidance provided in Section 5.2.1.2 also applies to land converted to a new land-use category for managed
lands with IWMS where the water table has been raised. The guidance in sections pertaining to land converted to
a new land-use category in the 2006 IPCC Guidelines should also be used.
5.3.2 CH4 emissions
The guidance provided in Section 5.2.2 also applies to land converted to a new land-use category for managed
lands with IWMS.
5.3.2.1 CHOICE OF METHOD AND EMISSION FACTORS
The guidance provided in Section 5.2.2 also applies to land converted to a new land-use category for managed
lands with IWMS.
5.3.2.2 CHOICE OF ACTIVITY DATA
The activity data consist of areas of managed lands with IWMS in land converted to a new land-use category,
stratified by land-use category, climate region, soil type, and management practices, at a minimum. The
guidance provided in Section 5.2.2 also applies to land converted to a new land-use category for managed lands
with IWMS.
5.3.2.3 UNCERTAINTY ASSESSMENT
The guidance provided in Section 5.2.2 also applies to land converted to a new land-use category for managed
lands with IWMS.
5.4 COMPLETENESS, REPORTING AND
DOCUMENTATION
5.4.1 Completeness
It is good practice to disaggregate the types of managed lands with IWMS according to national circumstances
and employ country-specific emission factors if possible. It is suggested that flooded lands (including reservoirs),
peatlands, and coastal wetlands, are clearly excluded from land with IWMS, and that this separation is applied
consistently throughout the reporting period.
Where guidance not provided for IWMS in this Chapter for some lands, some climates, some carbon pools, and
some GHGs, it is the result of a lack of relevant data that allow the development of emission factors. Countries
are encouraged to develop new research and accounting practices to fill gaps to better account for changes in
carbon stocks and GHG emissions and removals from drained wetlands, rewetted wetlands, or created wetlands
on lands with IWMS.
General guidance on consistency in time-series is given in Chapter 7 of this supplement. The classification of
land, criteria for using activity data and emission factors and inventory methods should also be consistent with
the generic methodologies described in Volume 4 of the 2006 IPCC Guidelines and in this supplement. Chapter
6, Volume 1 of the 2006 IPCC Guidelines and Chapter 7 of this supplement provide general guidance on the
issues concerning Quality Assurance and Quality Control (QA/QC).
5.4.2 Reporting and Documentation
General guidance on reporting and documentation is given in Chapter 8, Volume 1 of the 2006 IPCC Guidelines.
Section 7.4.4, Chapter 7, Volume 4 of the 2006 IPCC Guidelines states the following with regard to reporting
and documentation.

Chapter 5: Inland Wetlands Mineral Soils
5.22 2013 Supplement to the 2006 IPCC Guidelines for National Greenhouse Gas Inventories: Wetlands
EMISSION FACTORS
The scientific basis for new country-specific emission factors, parameters and models should be fully described
and documented. This includes defining the input parameters and describing the process by which the emission
factors, parameters, and models were derived, as well as describing sources of uncertainties.
ACTIVITY DATA
Sources of all activity data used in the calculations including data sources, databases and soil map references,
should be recorded, as well as communications with industry subject to any confidentiality considerations. This
documentation should include the frequency of data collection and estimation, estimates of accuracy and
precision, and reasons for any significant changes in emission levels.
TREND ANALYSIS
Any significant fluctuations in emissions between years should be explained. A distinction should be made
between changes in activity levels and changes in emission factors, parameters and methods from year to year,
and the reasons for these changes documented. If different emission factors, parameters and methods are used for
different years, then the reasons for this should be explained and documented.

Chapter 5: Inland Wetland Mineral Soils
2013 Supplement to the 2006 IPCC Guidelines for National Greenhouse Gas Inventories: Wetlands 5.23
Annex 5A.1 Estimation of default stock change factors for long-
term cultivated Cropland and rewetting with
Inland Wetland Mineral Soil carbon
emissions/removals
Default stock change factors that were computed using a dataset of experimental results for land use are provided
in Table 5.3. The land-use factor for long-term cultivation represents the loss of SOC that occurs after 20 years
of continuous cultivation. The rewetting factor represents the effect of the restoration of natural hydrology of
cultivated cropland with IWMS (such as through the removal of drainage tiles, or plugging of drainage ditches),
which may or may not have continued crop production. The influence of this change on IWMS SOC stocks may
continue up to 40 years. Experimental data (citations listed below, and provided in the list of references) were
analysed in linear mixed-effects models, accounting for both fixed and random effects (Ogle et al., 2005). Fixed
effects included depth and the number of years since a management change. For depth, data were not aggregated
but included SOC stocks measured for each depth increment (e.g. 0–5 cm, 5–10 cm, and 10–30 cm) as a separate
point in the dataset. Similarly, time series data were not aggregated, despite those measurements being made on
the same plots. Consequently, random effects were used to account for the dependencies in times-series data and
among data points representing different depths from the same study. If significant, a country-level random
effect was used to assess an additional uncertainty associated with applying a global default value to a specific
country. This is included in the default uncertainties. The long-term cultivation factor represents the average loss
of SOC at 20 years or longer time period following cultivation of IWMS. Users of the Tier 1 method can
approximate the annual change in SOC storage by dividing the inventory estimate by 20. The rewetting factor
represents the average net gain in SOC after rewetting of cultivated cropland, 20 and 40 years after the first year
of rewetting. Variance was calculated for each of the factor values, and can be used with simple error
propagation methods, or to construct probability distribution functions with a normal density.
TABLE 5A.1.1
STUDIES USED FOR THE DERIVATION OF DEFAULT SOC STOCK CHANGE FACTORS
Study Location
Stock Change Factor (LC
= Long-term cultivation;
R = Rewetting)
Badiou et al., 2011 Saskatchewan, Alberta, Manitoba, Canada LC, R
Ballantine et al., 2009 New York, USA R
Bedard-Haughn et al., 2006 Saskatchewan, Canada LC
Besasie et al., 2012 Wisconsin, USA LC, R
David et al., 2009 Illinois, USA LC
Euliss et al., 2006 North Dakota, South Dakota, Minnesota,
Montana, Iowa, USA
LC, R
Gleason et al., 2009 North Dakota, USA R
Huang et al., 2010 Sanjiang Plain, China LC
Hunter et al., 2008 Louisiana, USA LC, R
Jacinthe et al., 2001 Ohio, USA LC
Lu et al., 2007 Lake Taihu, China LC, R
Meyer et al., 2008 Nebraska, USA LC, R
Morse et al., 2012 North Carolina, USA LC
Norton et al., 2011 California, USA LC
van Wesemael et al., 2010 Belgium LC
Wang et al., 2012 Sanjiang Plain, China LC, R

Chapter 5: Inland Wetlands Mineral Soils
5.24 2013 Supplement to the 2006 IPCC Guidelines for National Greenhouse Gas Inventories: Wetlands
Annex 5A.2 Estimation of CH4 emission factors for managed
lands with Inland Wetland Mineral Soils, or dry
mineral soils, where the water table has been raised
The Tier 1 default emission factors in Table 5.4 were derived from the published studies listed in Table 5A.2.1.
The number of studies of CH4 emissions from rewetted IWMS as a result of rewetting of drained IWMS, and
from wetted mineral soils as a result of wetland creation, is very limited. They are also restricted to temperate
climate regions. Thus, studies of CH4 emission from natural IWMS were included to derive emission factors
from boreal and tropical regions, and to supplement the number of studies in temperate region. Studies varied in
their reporting of emissions: some reported annual fluxes, while others reported seasonal fluxes or mean daily
fluxes. In the case of seasonal or daily flux reporting, an annual flux was estimated by assuming that no
emissions occurred during cold seasons and/or by applying mean daily fluxes to part or all of the annual period
depending on the climate region and/or specific recommendations made by the study authors.
TABLE 5A.2.1
CH4 EMISSIONS FROM RESTORED AND CREATED WETLANDS WITH IWMS WHERE WATER TABLE LEVEL HAS BEEN RAISED, AND NATURAL
WETLANDS, USED TO DERIVE DEFAULT VALUE FOR EFCH4
Climate
region
Wetland
type Location
Annual
period of
inundation
CH4 emission
(kg CH4 ha-1
yr-1
)
CH4 Flux
measurement
method
CH4 Flux
reported Reference
Boreal Natural
wetlands Canada Unspecified 76 Chamber, EC Annual
Bridgham
et al.,
2006
Temperate
Restored
wetlands,
previous use
Cropland Canada Intermittent 49 Chamber Mean daily
Badiou et
al., 2011
Temperate
Restored
wetlands,
previous use
Cropland Canada Intermittent 349 Chamber
Annual
(modified for
diurnal variation
as stated in
study)
Pennock et
al., 2010
Temperate
Restored
wetlands,
previous use
Cropland North Dakota, USA Intermittent 142 Chamber Mean daily
Gleason et
al., 2009
Temperate
Restored
wetlands,
previous use
Cropland
North Carolina,
USA Intermittent 7 Chamber Annual
Morse et
al., 2012
Temperate
Restored
wetland,
previous use
Cropland Denmark Intermittent 110 EC
Annual (minus
emissions from
cattle on-site as
stated in study)
Herbst et
al., 2011
Temperate
Created
wetlands,
riparian China Intermittent 13 Chamber
Annual
(diffusive and
ebullitive fluxes
combined)
Yang et
al., 2012
Temperate
Created
wetlands Ohio, USA Continuous 402 Chamber
Annual
(mean of two
different years
from same site)
Nahlik and
Mitsch,
2010;
Altor and
Mitsch,
2008
Temperate
Natural
wetland,
marsh Nebraska, USA Continuous 800 EC Annual
Kim et al.,
1999

Chapter 5: Inland Wetland Mineral Soils
2013 Supplement to the 2006 IPCC Guidelines for National Greenhouse Gas Inventories: Wetlands 5.25
TABLE 5A.2.1(CONTINUED)
CH4 EMISSIONS FROM RESTORED AND CREATED WETLANDS WITH IWMS WHERE WATER TABLE LEVEL HAS BEEN RAISED, AND NATURAL
WETLANDS, USED TO DERIVE DEFAULT VALUE FOR EFCH4
Climate
region
Wetland
type Location
Annual
period of
inundation
CH4 emission
(kg CH4 ha-1
yr-1
)
CH4 Flux
measurement
method
CH4 Flux
reported Reference
Temperate
Natural
wetlands,
marshes
Sanjiang Plain, NE
China Continuous 468 Chamber Annual
Ding and
Cai, 2007
Temperate
Natural
wetlands,
Carex
marshes
Sanjiang Plain, NE
China Continuous 434 Chamber
Annual
(as reported in
Ding and Cai,
2007)
Song et
al., 2003
Temperate
Natural
wetland,
riparian Ohio, USA Continuous 758 Chamber Annual
Nahlik and
Mitsch,
2010
Temperate
Natural
wetlands,
Deyeuixa
marshes
Sanjiang Plain, NE
China Intermittent 289 Chamber
Annual
(as reported in
Ding and Cai,
2007)
Song et
al., 2003
Temperate
Natural
wetlands,
riparian Georgia, USA Intermittent 226 Chamber Annual
Pulliam,
1993
Temperate
Natural
wetlands,
marshes
Sanjiang Plain, NE
China Intermittent 225 Chamber Annual
Huang et
al., 2010
Temperate
Natural
wetlands,
marsh
Sanjiang Plain, NE
China Intermittent 58 Chamber Annual
Song et
al., 2009
Temperate
Natural
wetlands,
shrub swamp
Sanjiang Plain, NE
China Intermittent 3 Chamber Annual
Song et
al., 2009
Temperate
Natural
wetlands,
swamps Global Intermittent 113 Chamber Mean daily
Bartlett
and
Harriss,
1993
Temperate
Natural
wetlands,
marshes Global Intermittent 105 Chamber Mean daily
Bartlett
and
Harriss,
1993
Temperate
Natural
wetlands,
floodplains Global Intermittent 72 Chamber Mean daily
Bartlett
and
Harriss,
1993
Temperate
Natural
wetlands Continental USA unspecified 76 Chamber, EC Annual
Bridgham
et al.,
2006
Tropical
Natural
wetlands,
rainforest
swamp Costa Rica Continuous 2930 Chamber Annual
Nahlik and
Mitsch,
2011
Tropical
Natural
wetlands,
alluvial
marsh Costa Rica Intermittent 3500 Chamber Annual
Nahlik and
Mitsch,
2011
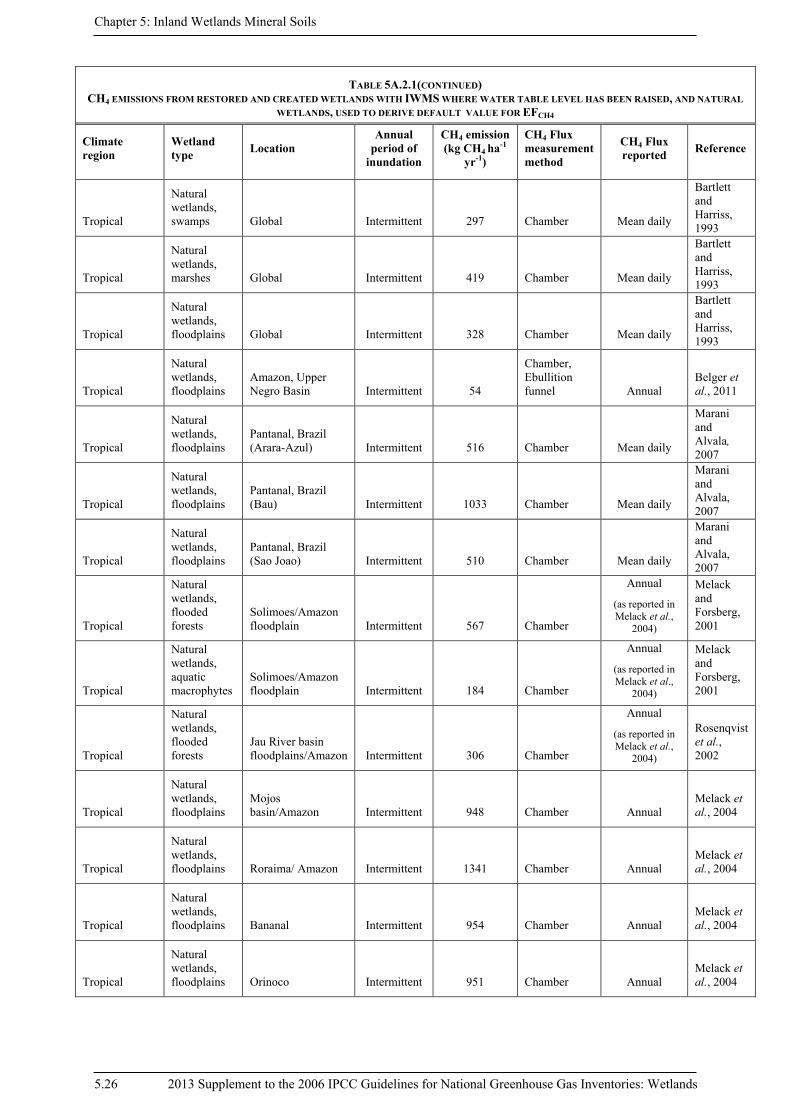
Chapter 5: Inland Wetlands Mineral Soils
5.26 2013 Supplement to the 2006 IPCC Guidelines for National Greenhouse Gas Inventories: Wetlands
TABLE 5A.2.1(CONTINUED)
CH4 EMISSIONS FROM RESTORED AND CREATED WETLANDS WITH IWMS WHERE WATER TABLE LEVEL HAS BEEN RAISED, AND NATURAL
WETLANDS, USED TO DERIVE DEFAULT VALUE FOR EFCH4
Climate
region
Wetland
type Location
Annual
period of
inundation
CH4 emission
(kg CH4 ha-1
yr-1
)
CH4 Flux
measurement
method
CH4 Flux
reported Reference
Tropical
Natural
wetlands,
swamps Global Intermittent 297 Chamber Mean daily
Bartlett
and
Harriss,
1993
Tropical
Natural
wetlands,
marshes Global Intermittent 419 Chamber Mean daily
Bartlett
and
Harriss,
1993
Tropical
Natural
wetlands,
floodplains Global Intermittent 328 Chamber Mean daily
Bartlett
and
Harriss,
1993
Tropical
Natural
wetlands,
floodplains
Amazon, Upper
Negro Basin Intermittent 54
Chamber,
Ebullition
funnel Annual
Belger et
al., 2011
Tropical
Natural
wetlands,
floodplains
Pantanal, Brazil
(Arara-Azul) Intermittent 516 Chamber Mean daily
Marani
and
Alvala,
2007
Tropical
Natural
wetlands,
floodplains
Pantanal, Brazil
(Bau) Intermittent 1033 Chamber Mean daily
Marani
and
Alvala,
2007
Tropical
Natural
wetlands,
floodplains
Pantanal, Brazil
(Sao Joao) Intermittent 510 Chamber Mean daily
Marani
and
Alvala,
2007
Tropical
Natural
wetlands,
flooded
forests
Solimoes/Amazon
floodplain Intermittent 567 Chamber
Annual
(as reported in
Melack et al.,
2004)
Melack
and
Forsberg,
2001
Tropical
Natural
wetlands,
aquatic
macrophytes
Solimoes/Amazon
floodplain Intermittent 184 Chamber
Annual
(as reported in
Melack et al.,
2004)
Melack
and
Forsberg,
2001
Tropical
Natural
wetlands,
flooded
forests
Jau River basin
floodplains/Amazon Intermittent 306 Chamber
Annual
(as reported in
Melack et al.,
2004)
Rosenqvist
et al.,
2002
Tropical
Natural
wetlands,
floodplains
Mojos
basin/Amazon Intermittent 948 Chamber Annual
Melack et
al., 2004
Tropical
Natural
wetlands,
floodplains Roraima/ Amazon Intermittent 1341 Chamber Annual
Melack et
al., 2004
Tropical
Natural
wetlands,
floodplains Bananal Intermittent 954 Chamber Annual
Melack et
al., 2004
Tropical
Natural
wetlands,
floodplains Orinoco Intermittent 951 Chamber Annual
Melack et
al., 2004
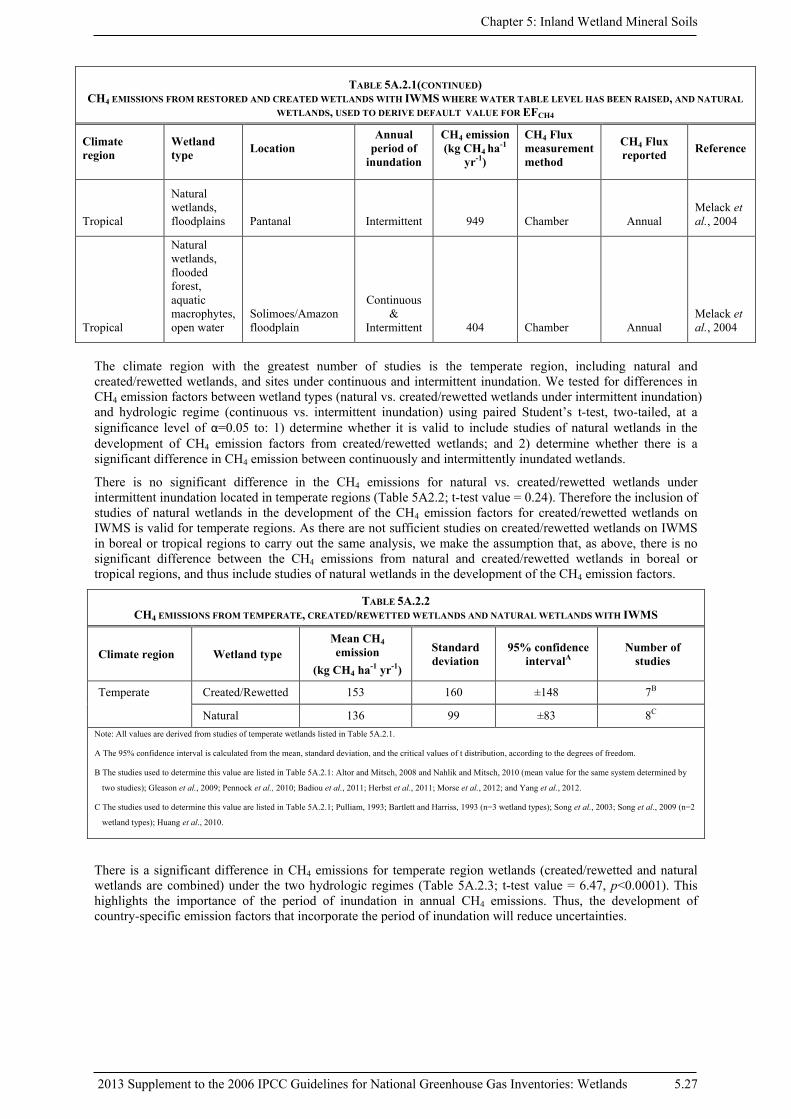
Chapter 5: Inland Wetland Mineral Soils
2013 Supplement to the 2006 IPCC Guidelines for National Greenhouse Gas Inventories: Wetlands 5.27
TABLE 5A.2.1(CONTINUED)
CH4 EMISSIONS FROM RESTORED AND CREATED WETLANDS WITH IWMS WHERE WATER TABLE LEVEL HAS BEEN RAISED, AND NATURAL
WETLANDS, USED TO DERIVE DEFAULT VALUE FOR EFCH4
Climate
region
Wetland
type Location
Annual
period of
inundation
CH4 emission
(kg CH4 ha-1
yr-1
)
CH4 Flux
measurement
method
CH4 Flux
reported Reference
Tropical
Natural
wetlands,
floodplains Pantanal Intermittent 949 Chamber Annual
Melack et
al., 2004
Tropical
Natural
wetlands,
flooded
forest,
aquatic
macrophytes,
open water
Solimoes/Amazon
floodplain
Continuous
&
Intermittent 404 Chamber Annual
Melack et
al., 2004
The climate region with the greatest number of studies is the temperate region, including natural and
created/rewetted wetlands, and sites under continuous and intermittent inundation. We tested for differences in
CH4 emission factors between wetland types (natural vs. created/rewetted wetlands under intermittent inundation)
and hydrologic regime (continuous vs. intermittent inundation) using paired Student’s t-test, two-tailed, at a
significance level of α=0.05 to: 1) determine whether it is valid to include studies of natural wetlands in the
development of CH4 emission factors from created/rewetted wetlands; and 2) determine whether there is a
significant difference in CH4 emission between continuously and intermittently inundated wetlands.
There is no significant difference in the CH4 emissions for natural vs. created/rewetted wetlands under
intermittent inundation located in temperate regions (Table 5A2.2; t-test value = 0.24). Therefore the inclusion of
studies of natural wetlands in the development of the CH4 emission factors for created/rewetted wetlands on
IWMS is valid for temperate regions. As there are not sufficient studies on created/rewetted wetlands on IWMS
in boreal or tropical regions to carry out the same analysis, we make the assumption that, as above, there is no
significant difference between the CH4 emissions from natural and created/rewetted wetlands in boreal or
tropical regions, and thus include studies of natural wetlands in the development of the CH4 emission factors.
TABLE 5A.2.2
CH4 EMISSIONS FROM TEMPERATE, CREATED/REWETTED WETLANDS AND NATURAL WETLANDS WITH IWMS
Climate region Wetland type
Mean CH4
emission
(kg CH4 ha-1
yr-1
)
Standard
deviation
95% confidence
intervalA
Number of
studies
Temperate Created/Rewetted 153 160 ±148 7B
Natural 136 99 ±83 8C
Note: All values are derived from studies of temperate wetlands listed in Table 5A.2.1.
A The 95% confidence interval is calculated from the mean, standard deviation, and the critical values of t distribution, according to the degrees of freedom.
B The studies used to determine this value are listed in Table 5A.2.1: Altor and Mitsch, 2008 and Nahlik and Mitsch, 2010 (mean value for the same system determined by
two studies); Gleason et al., 2009; Pennock et al., 2010; Badiou et al., 2011; Herbst et al., 2011; Morse et al., 2012; and Yang et al., 2012.
C The studies used to determine this value are listed in Table 5A.2.1; Pulliam, 1993; Bartlett and Harriss, 1993 (n=3 wetland types); Song et al., 2003; Song et al., 2009 (n=2
wetland types); Huang et al., 2010.
There is a significant difference in CH4 emissions for temperate region wetlands (created/rewetted and natural
wetlands are combined) under the two hydrologic regimes (Table 5A.2.3; t-test value = 6.47, p<0.0001). This
highlights the importance of the period of inundation in annual CH4 emissions. Thus, the development of
country-specific emission factors that incorporate the period of inundation will reduce uncertainties.

Chapter 5: Inland Wetlands Mineral Soils
5.28 2013 Supplement to the 2006 IPCC Guidelines for National Greenhouse Gas Inventories: Wetlands
TABLE 5A.2.3
CH4 EMISSIONS FROM TEMPERATE, REWETTED, CREATED AND NATURAL WETLANDS WITH IWMS, STRATIFIED BY PERIOD OF
INUNDATION
Climate region
Annual
period of
inundation
Mean CH4 emission
(kg CH4 ha-1
yr-1
)
Standard
deviation
95% confidence
intervalA
Number
of studies
Temperate Continuous 572 191 ±125 5B
Intermittent 126 108 ±75 14C
Note: All values are derived from studies of temperate wetlands listed in Table 5A.2.1.
A The 95% confidence interval is calculated from the mean, standard deviation, and the critical values of the t distribution, according to the degrees of freedom.
B The studies used to determine this value are listed in Table 5A2.1; Kim et al., 1999; Song et al., 2003 (Carex marshes); Ding and Cai, 2007; Altor and Mitsch, 2008;
Nahlik and Mitsch, 2010.
C The studies used to determine this value are listed in Table 5A2.1; Pulliam, 1993; Bartlett and Harriss, 1993 (n=3 wetland types); Song et al., 2003 (Deyeuxia marshes);
Song et al., 2009 (n=2 wetland types); Huang et al., 2010; Badiou et al., 2011; Pennock et al., 2010; Gleason et al., 2009; Morse et al., 2012; Herbst et al., 2011; Yang et
al., 2012.

Chapter 5: Inland Wetland Mineral Soils
2013 Supplement to the 2006 IPCC Guidelines for National Greenhouse Gas Inventories: Wetlands 5.29
Appendix 5a.1 Future methodological development
Lands with IWMS occupy significant areas in some countries and are important carbon stock compartments;
conversion of this land to other uses and management practices can potentially affect these stocks. However, at
the time of preparation of this supplement, except for changes in SOC stocks and CH4 emissions in
rewetted/created wetlands on lands with IWMS, and changes in SOC stocks as a result of long-term cultivation
and rewetting on Croplands with IWMS, little information was available to provide emission factors specific to
different land uses and management practices, or to derive emission factors for N2O.
Particular effort should be made to differentiate between multiple uses on lands with IWMS (e.g. wetland forest
and wetland grasslands) for future methodological improvements. A good example of the methodological
approach necessary for this task can be found in the United States Fish and Wildlife Service Report to the
Congress (Dahl, 2011). This document describes how wetland inventories have been made in the United States
and, although not providing figures for SOC stock changes, gives reference for future work to obtain such data
with the National Wetland Condition Assessment (NWCA), with methods described in detail at
www.epa.gov/wetlands/survey. Another example of a methodological approach for assessing carbon stocks and
GHG fluxes at a national level is found in a United States Geological Survey Scientific Investigations Report
(Zhu et al., 2010). This document describes SOC stock changes and GHG emissions from managed and
unmanaged lands and it may serve as a useful example for a national-level carbon assessment. Surveys that
quantify the areas of land on IWMS under different land use and management practices, in conjunction with
carbon pool quantification, allow the future application of the general equations for carbon stock changes that are
described in the 2006 IPCC Guidelines.
Other databases are available that contain flux information (mainly CO2 measured with the eddy covariance
technique) at the ecosystem level, including IWMS (e.g. www.ghg-europe.eu, fluxnet.ornl.gov,
ameriflux.ornl.gov, www.tern-supersites.net.au and fluxnet.ccrp.ec.gc.ca).
New research is needed to fill a number of gaps for IWMS. Additional studies are needed to evaluate the effects
of IWMS land-use conversion on SOC stock changes following conversion to Grassland, Forest Land,
Settlements and Other Land. Moreover, new research is needed to understand the effect of IWMS conversion on
other carbon stocks (biomass, dead organic matter) as well as CH4 and N2O fluxes. Although we were able to
develop guidance for CH4 fluxes from IWMS for some climate regions, specific guidance for climate and region
combinations would improve our estimates of CH4 fluxes. New research assessing N2O fluxes following
conversion of IWMS to other land-uses, especially Cropland, would add considerably to our ability to assess
GHG impacts and develop Tier 2 methods for GHG fluxes. N2O emissions from IWMS are typically very low,
unless there is a significant input of organic or inorganic nitrogen from runoff. Such inputs typically result from
anthropogenic activities such as agricultural fertilizer application (Hefting et al., 2006; Phillips and Beeri, 2008;
DeSimone et al., 2010), or Grassland management (Chen et al., 2011; Oates et al., 2008; Liebig et al., 2012;
Jackson et al., 2006; Holst et al., 2007; Walker et al., 2002). A review of the current literature suggests there is
insufficient data to provide robust emission factors and methodology to estimate N2O emissions from IWMS at
this time. We suggest that N2O emissions should be more thoroughly addressed in future updates to this
guidance, as research on this topic progresses. For future methodological improvement of N2O emission factors,
it is important to avoid double-counting N2O emissions already accounted for properly according to Chapter 11,
Volume 4 of the 2006 IPCC Guidelines.
Fully functional models that consider the influence of changes in hydrology on carbon cycling and GHG fluxes
cannot be developed or tested until more databases are available for IWMS. Process-based models such as
Wetland-DNDC (Zhang et al., 2002) have substantial capabilities but have not been tested or calibrated across
IWMS. Future model testing and development on IWMS could lead to development of Tier 3 approaches for
IWMS.

Chapter 5: Inland Wetlands Mineral Soils
5.30 2013 Supplement to the 2006 IPCC Guidelines for National Greenhouse Gas Inventories: Wetlands
References
Aber, J. S., Pavri, F. & Aber, S. W. Environmental Cycles and Feedback. In: Wetland environments: A Global
Perspective: John Wiley & Sons, Ltd.
Altor, A. E. & Mitsch, W. J. (2008) Methane and carbon dioxide dynamics in wetland mesocosms: Effects of
hydrology and soils. Ecological Applications 18(5): 1307-1320.
Arnesen, A. (2013) Monitoring flood extent in the lower Amazon River floodplain using ALOS/PALSAR
ScanSAR images. Remote Sensing of the Environment 130: 51-61.
Badiou, P., McDougal, R., Pennock, D. & Clark, B. (2011) Greenhouse gas emissions and carbon sequestration
potential in restored wetlands of the Canadian prairie pothole region. Wetlands Ecology and Management
19(3): 237-256.
Bai, J., Cui, B., Deng, W., Yang, Z., Wang, Q. & Ding, Q. (2007) Soil organic carbon contents of two natural
inland saline-alkaline wetlands in northeastern China. Journal of Soil and Water Conservation 62: 447-
452.
Ballantine, K. & Schneider, R. (2009) Fifty-five years of soil development in restored freshwater depressional
wetlands. Ecological Applications 19(6): 1467-1480.
Bartlett, K. B. & Harriss, R. C. (1993) Review and assessment of methane emissions from wetlands.
Chemosphere 26(1-4): 261-320.
Batjes, N. H. (2009) Harmonized soil profile data for applications at global and continental scales: updates to the
WISE database. Soil Use and Management 25(2): 124-127.
Batjes, N. H. (2010a) A global framework for soil organic carbon stocks under native vegetation for use with the
simple assessment option of the Carbon Benefits Project system. In: p. 72. Wageningen: Carbon Benefits
Project (CBP) and ISRIC World Soil Information.
Batjes, N. H. (2010b) IPCC default soil classes derived from the Harmonized World Soil Data Base (Ver. 1.1).
In: Report 2009/02b, Carbon Benefits Project (CBP) and ISRIC – World Soil Information, Wageningen
(with dataset). http://www.isirc.org/isric/Webdocs/Docs/ISIRC_Report_2009_02.pdf.
Batjes, N. H. (2011) Soil organic carbon stocks under native vegetation - Revised estimates for use with the
simple assessment option of the Carbon Benefits Project system. Agriculture Ecosystems & Environment
142(3-4): 365-373.
Bedard-Haughn, A., Jongbloed, F., Akkennan, J., Uijl, A., de Jong, E., Yates, T. & Pennock, D. (2006) The
effects of erosional and management history on soil organic carbon stores in ephemeral wetlands of
hummocky agricultural landscapes. Geoderma 135: 296-306.
Belger, L., Forsberg, B. R. & Melack, J. M. (2011) Carbon dioxide and methane emissions from interfluvial
wetlands in the upper Negro River basin, Brazil. Biogeochemistry 105(1-3): 171-183.
Besasie, N. J. & Buckley, M. E. (2012) Carbon Sequestration Potential at Central Wisconsin Wetland Reserve
Program Sites. Soil Science Society of America Journal 76(5): 1904-1910.
Bridgham, S., Megonigal, J., Keller, J., Bliss, N. & Trettin, C. (2006) The carbon balance of North American
wetlands. Wetlands 26(4): 889-916.
Brinson, M. & Malvarez, A. (2002) Temperate freshwater wetlands: types, status, and threats. Environmental
Conservation 29(2): 115-133.
Cabezas, A., Comin, F. A., Begueria, S. & Trabucchi, M. (2009) Hydrologic and landscape changes in the
Middle Ebro River (NE Spain): implications for restoration and management. Hydrology and Earth
System Sciences 13(2): 273-284.
Chen, H., Wang, M., Wu, N., Wang, Y., Zhu, D., Gao, Y. & Peng, C. (2011) Nitrous oxide fluxes from the
littoral zone of a lake on the Qinghai-Tibetan Plateau. Environmental monitoring and assessment 182:
545-553.
Chen, H., Wu, N., Gao, Y. H., Wang, Y. F., Luo, P. & Tian, J. Q. (2009) Spatial variations on methane
emissions from Zoige alpine wetlands of Southwest China. Science of the Total Environment 407(3):
1097-1104.
Cowardin, L. (1982) Some conceptual and schematic problems in wetland classification and inventory. Wildlife
Society Bulletin 10(1): 57-60.

Chapter 5: Inland Wetland Mineral Soils
2013 Supplement to the 2006 IPCC Guidelines for National Greenhouse Gas Inventories: Wetlands 5.31
Dahl, T. (2011) Status and Trends of Wetlands on the Conterminous United States 2004 to 2009. In: ed. U. S.
Department of Interior, U.S. Fish and Wildlife Service. Report to the Congress. 107 pgs.
David, M. B., McLsaac, G. F., Darmody, R. G. & Omonode, R. A. (2009) Long-Term Changes in Mollisol
Organic Carbon and Nitrogen. Journal of Environmental Quality 38(1): 200-211.
DeSimone, J., Macrae, M. & Bourbonniere, R. (2010) Spatial variability in surface N2O fluxes across a riparian
zone and relationships with soil environmental conditions and nutrient supply. Agriculture Ecosystems &
Environment 138(1-2): 1-9.
Ding, W. X. & Cai, Z. C. (2007) Methane emission from natural wetlands in China: Summary of years 1995-
2004 studies. Pedosphere 17(4): 475-486.
Ding, W. X., Cai, Z. C., Tsuruta, H. & Li, X. P. (2003) Key factors affecting spatial variation of methane
emissions from freshwater marshes. Chemosphere 51(3): 167-173.
Dynesius, M. & Nilsson, C. (1994) Fragmentation and flow regulation of river systems in the northern 3rd of the
world. Science 266(5186): 753-762.
Euliss, N. H., Gleason, R. A., Olness, A., McDougal, R. L., Murkin, H. R., Robarts, R. D., Bourbonniere, R. A.
& Warner, B. G. (2006) North American prairie wetlands are important nonforested land-based carbon
storage sites. Science of the Total Environment 361(1-3): 179-188.
FAO. World reference base for soil resources. World Soil Resources Report 84.
Gleason, R. A., Tangen, B. A., Browne, B. A. & Euliss, N. H., Jr. (2009) Greenhouse gas flux from cropland and
restored wetlands in the Prairie Pothole Region. Soil Biology & Biochemistry 41(12): 2501-2507.
Hammer, D. A. (1989) Constructed wetland for wastewater treatment – municipal, industrial and agricultural.
Chelsea, Michigan, USA: Lewis Publishers,.
Hefting, M., Bobbink, R. & Janssens, M. (2006) Spatial variation in denitrification and N2O emission in relation
to nitrate removal efficiency in a n-stressed riparian buffer zone. Ecosystems 9(4): 550-563.
Herbst, M., Friborg, T., Ringgaard, R. & Soegaard, H. (2011) Interpreting the variations in atmospheric methane
fluxes observed above a restored wetland. Agricultural and Forest Meteorology 151(7): 841-853.
Holst, J., Liu, C., Yao, Z., Bruggemann, N., Zheng, X., Han, X. & Butterbach-Bahl, K. (2007) Importance of
point sources on regional nitrous oxide fluxes in semi-arid steppe of Inner Mongolia, China. Plant and
Soil 296(1-2): 209-226.
Huang, Y., Sun, W., Zhang, W., Yu, Y., Su, Y. & Song, C. (2010) Marshland conversion to cropland in
northeast China from 1950 to 2000 reduced the greenhouse effect. Global Change Biology 16(2): 680-695.
Hunter, R. G., Faulkner, S. P. & Gibson, K. A. (2008) The importance of hydrology in restoration of bottomland
hardwood wetland functions. Wetlands 28(3): 605-615.
Hupp, C. R. (1992) Riparian vegetation recovery patterns following stream channelization: a geomorphic
perspective. Ecology 73(4): 1209-1226.
IPCC. (2006) IPCC Guidelines for National Greenhouse Gas Inventories. Japan: IGES.
Jacinthe, P. A., Lal, R. & Kimble, J. M. (2001) Organic carbon storage and dynamics in croplands and terrestrial
deposits as influenced by subsurface tile drainage. Soil Science 166(5): 322-335.
Jackson, R., Allen-Diaz, B., Oates, L. & Tate, K. (2006) Spring-water nitrate increased with removal of livestock
grazing in a california oak savanna. Ecosystems 9(2): 254-267.
Kim, J., Verma, S. B. & Billesbach, D. P. (1999) Seasonal variation in methane emission from a temperate
Phragmites-dominated marsh: effect of growth stage and plant-mediated transport. Global Change
Biology 5(4): 433-440.
Kleiss, B. A. (1996) Sediment Retention in a Bottomland Hardwood Wetland in Eastern Arkansas. Wetlands
16(3): 321-333.
Lavoie, M., Pare, D. & Bergeron, Y. (2005) Impact of global change and forest management on carbon
sequestration in northern forested peatlands. Env. Rev. 13(4): 199-240.
Liebig, M., Dong, X., Mclain, J. & Dell, C. (212) Greenhouse gas flux from managed grasslands in the U.S. In:
Managing agricultural greenhouse gases: Coordinated agricultural research through GRACEnet do
address our changing climate, eds. M. Liebig, A. Franzluebbers & R. Follet, pp. 183-202. San Diego, CA:
Academic Press.

Chapter 5: Inland Wetlands Mineral Soils
5.32 2013 Supplement to the 2006 IPCC Guidelines for National Greenhouse Gas Inventories: Wetlands
Liu, C., Hoist, J., Yao, Z., Bruggemann, N., Butterbach-Bahl, K., Han, S., Han, X., Tas, B., Susenbeth, A. &
Zheng, X. (2009) Growing season methane budget of an Inner Mongolian steppe. Atmospheric
Environment 43(19): 3086-3095.
Lu, J. W., Wang, H. J., Wang, W. D. & Yin, C. Q. (2007) Vegetation and soil properties in restored wetlands
near Lake Taihu, China. Hydrobiologia 581: 151-159.
Marani, L. & Alvala, P. C. (2007) Methane emissions from lakes and floodplains in Pantanal, Brazil.
Atmospheric Environment 41(8): 1627-1633.
Melack, J. M. & Forsberg, B. (2001) Biogeochemistry of Amazon floodplain lakes and associated wetlands. In:
The Biogeochemistry of the Amazon Basin and its Role in a Changing World, eds. M. E. McClain, R. L.
Victoria & J. E. Richey, pp. 235-276. Oxford University Press.
Melack, J. M., Hess, L. L., Gastil, M., Forsberg, B. R., Hamilton, S. K., Lima, I. B. T. & Novo, E. (2004)
Regionalization of methane emissions in the Amazon Basin with microwave remote sensing. Global
Change Biology 10(5): 530-544.
Meyer, C. K., Baer, S. G. & Whiles, M. R. (2008) Ecosystem recovery across a chronosequence of restored
wetlands in the platte river valley. Ecosystems 11(2): 193-208.
Mitsch, W. J. & Gosselink, J. G. (2007) Wetlands. John Wiley & Sons, New York. 572 p.
Mitsch, W. J., Nahlik, A., Wolski, P., Bernal, B., Zhang, L. & Ramberg, L. (2010) Tropical wetlands: seasonal
hydrologic pulsing, carbon sequestration, and methane emissions. Wetlands Ecology and Management
18(5): 573-586.
Mitsch, W. J., Wu, X., Nairn, R. W., Weihe, P. E., Wang, N., Deal, R. & Boucher, C. E. (1998) Creating and
restoring wetlands: A whole-ecosystem experiment in self-design. BioScience 48(12): 1019-1030.
Mitsch, W. J., Zhang, L., Stefanik, K. C., Nahlik, A. M., Anderson, C. J., Bernal, B., Hernandez, M. & Song, K.
(2012) Creating Wetlands: Primary Succession, Water Quality Changes, and Self-Design over 15 Years.
Bioscience 62(3): 237-250.
Morse, J. L., Ardon, M. & Bernhardt, E. S. (2012) Greenhouse gas fluxes in southeastern U.S. coastal plain
wetlands under contrasting land uses. Ecological Applications 22(1): 264-280.
Nahlik, A. (2011) Methane emissions from tropical freshwater wetlands located in different climatic zones of
Costa Rica. Global Change Biology 17: 1321-1334.
Nahlik, A. M. & Mitsch, W. J. (2010) Methane Emissions From Created Riverine Wetlands. Wetlands 30(4):
783-793.
Nilsson, C. & Berggren, K. (2000) Alterations of riparian ecosystems caused by river regulation. Bioscience
50(9): 783-792.
Noe, G. & Hupp, C. (2005) Carbon, nitrogen, and phosphorus accumulation in floodplains of Atlantic Coastal
Plain rivers, USA. Ecological Applications 15(4): 1178-1190.
Norton, J. B., Jungst, L. J., Norton, U., Olsen, H. R., Tate, K. W. & Horwath, W. R. (2011) Soil Carbon and
Nitrogen Storage in Upper Montane Riparian Meadows. Ecosystems 14(8): 1217-1231.
Oates, L. G., Jackson, A. R. D. & Allen-Diaz, B. (2008) Grazing removal decreases the magnitude of methane
and the variability of nitrous oxide emissions from spring-fed wetlands of a California oak savanna.
Wetlands Ecology and Management 16: 395-404.
Ogle, S. (2005) Agricultural management impacts on soil organic matter storage under moist and dry climatic
conditions of temperate and tropical regions. Biogeochemistry 72(1): 87-121.
Ogle, S. M., Breidt, F. J., Easter, M., Williams, S., Killian, K. & Paustian, K. (2010) Scale and uncertainty in
modeled soil organic carbon stock changes for US croplands using a process-based model. Global
Change Biology 16(2): 810-822.
Ogle, S. M., Breidt, F. J. & Paustian, K. (2006) Bias and variance in model results associated with spatial scaling
of measurements for parameterization in regional assessments. Global Change Biology 12(3): 516-523.
Page, K. & Dalal, R. (2011) Contribution of natural and drained wetland systems to carbon stocks, CO2, N2O,
and CH4 fluxes: an Australian perspective. Soil Research 49(5): 377-388.
Parton, W. J., Hartman, M., Ojima, D. & Schimel, D. (1998) Daycent and Its Land Surface Submodel:
Description and Testing. Global and Planetary Change 19(1-4): 35-48.

Chapter 5: Inland Wetland Mineral Soils
2013 Supplement to the 2006 IPCC Guidelines for National Greenhouse Gas Inventories: Wetlands 5.33
Parton, W. J., Ojima, D. S. & Schimel, D. S. (1994) Environmental-Change in Grasslands - Assessment Using
Models. Climatic Change 28(1-2): 111-141.
Parton, W. J., Schimel, D. S., Cole, C. V. & Ojima, D. S. (1987) Analysis of factors controlling soil organic
matter levels in Great Plains grasslands. Soil Science Society of America Journal 51: 1173-1179.
Pennock, D., Yates, T., Bedard-Haughn, A., Phipps, K., Farrell, R. & McDougal, R. (2010) Landscape controls
on N2O and CH4 emissions from freshwater mineral soil wetlands of the Canadian Prairie Pothole region.
Geoderma 155(3-4): 308-319.
Phillips, R. & Beeri, O. (2008) The role of hydropedologic vegetation zones in greenhouse gas emissions for
agricultural wetland landscapes. Catena 72(3): 386-394.
Poff, N. L., Allan, J. D., Bain, M. B., Karr, J. R., Prestegaard, K. L., Richter, B. D., Sparks, R. E. & Stromberg, J.
C. (1997) The natural flow regime. Bioscience 47(11): 769-784.
Powers, J. S., Read, J. M., Denslow, J. S. & Guzman, S. M. (2004) Estimating soil carbon fluxes following land-
cover change: a test of some critical assumptions for a region in Costa Rica. Global Change Biology 10(2):
170-181.
Pulliam, W. M. (1993) Carbon dioxide and methane exports from a southeastern floodplain swamp. Ecological
Monographs 63(1): 29-53.
Rodriguez-Murillo, J. C., Almendros, G. & Knicker, H. (2011) Wetland soil organic matter composition in a
Mediterranean semiarid wetland (Las Tablas de Daimiel, Central Spain): Insight into different carbon
sequestration pathways. Organic Geochemistry 42(7): 762-773.
Rosenqvist, A., Forsberg, B. R., Pimentel, T., Rauste, Y. A. & Richey, J. E. (2002) The use of spaceborne radar
data to model inundation patterns and trace gas emissions in the central Amazon floodplain. International
Journal of Remote Sensing 23(7): 1303-1328.
Saarnio, S., Winiwarter, W. & Leitao, J. (2009) Methane release from wetlands and watercourses in Europe.
Atmospheric Environment 43(7): 1421-1429.
Semeniuk, C. & Semeniuk, V. (1995) A geomorphic approach to global classification for inland wetlands.
Vegetatio 118(1-2): 103-124.
Shaw, P. A. & Bryant, R. G. (2011) Chapter 15: Pans, Playas and Salt Lakes. In: Arid Zone Geomorphology:
Process, Form and Change in Drylands, Third Edition, ed. D. S. G. Thomas, pp. 373-401. New York,
NY: John Wiley and Sons, Ltd.
Song, C., Xu, X., Tian, H. & Wang, Y. (2009) Ecosystem-atmosphere exchange of CH4 and N2O and ecosystem
respiration in wetlands in the Sanjiang Plain, Northeastern China. Global Change Biology 15(3): 692-705.
Song, C. C., Yan, B. X., Wang, Y. S., Wang, Y. Y., Lou, Y. J. & Zhao, Z. C. (2003) Fluxes of carbon dioxide
and methane from swamp and impact factors in Sanjiang Plain, China. Chinese Science Bulletin 48(24):
2749-2753.
Spahni, R., Wania, R., Neef, L., van Weele, M., Pison, I., Bousquet, P., Frankenberg, C., Foster, P. N., Joos, F.,
Prentice, I. C. & van Velthoven, P. (2011) Constraining global methane emissions and uptake by
ecosystems. Biogeosciences 8(6): 1643-1665.
Staff, S. S. Soil taxonomy: A basic system of soil classification for making and interpreting soil surveys. 2nd
edition.Natural Resources Conservation Service. U.S. Department of Agriculture Handbook 436.
van Wesemael, B., Paustian, K., Meersmans, J., Goidts, E., Barancikova, G. & Easter, M. (2010) Agricultural
management explains historic changes in regional soil carbon stocks. Proceedings of the National
Academy of Sciences of the United States of America 107(33): 14926-14930.
Walker, J., Geron, C., Vose, J. & Swank, W. (2002) Nitrogen trace gas emissions from a riparian ecosystem in
southern Appalachia. Chemosphere 49(10): 1389-1398.
Wang, Y., Liu, J. S., Wang, J. D. & Sun, C. Y. (2012) Effects of Wetland Reclamation on Soil Nutrient Losses
and Reserves in Sanjiang Plain, Northeast China. Journal of Integrative Agriculture 11(3): 512-520.
Wilson, J. O., Crill, P. M., Bartlett, K. B., Sebacher, D. I., Harriss, R. C. & Sass, R. L. (1989) Seasonal variation
of methane emissions from a temperate swamp. Biogeochemistry 8(1): 55-71.
Yang, L., Lu, F., Wang, X. K., Duan, X. N., Song, W. Z., Sun, B. F., Chen, S., Zhang, Q. Q., Hou, P. Q., Zheng,
F. X., Zhang, Y., Zhou, X. P., Zhou, Y. J. & Ouyang, Z. Y. (2012) Surface methane emissions from
different land use types during various water levels in three major drawdown areas of the Three Gorges
Reservoir. Journal of Geophysical Research-Atmospheres 117.

Chapter 5: Inland Wetlands Mineral Soils
5.34 2013 Supplement to the 2006 IPCC Guidelines for National Greenhouse Gas Inventories: Wetlands
Yao, Z. (2010) Spatial variability of N2O, CH4 and CO2 fluxes within the Xilin River catchment of Inner
Mongolia, China: a soil core study. Plant and Soil 331: 341-359.
Zhang, Y., Li, C. S., Trettin, C. C., Li, H. & Sun, G. (2002) An integrated model of soil, hydrology, and
vegetation for carbon dynamics in wetland ecosystems. Global Biogeochemical Cycles 16(4).
Zhu, Z. (2010) A method for assessing carbon stocks, carbon sequestration, and greenhousegas fluxex in
ecosystems of the United States under present conditions and future scenarios. In: U.S. Geological Survey
Scientific Investigations Report, p. 190.