chapter – 5 inclusion complexation of sulfadimethoxine...
TRANSCRIPT

CHAPTER ndash 5
Inclusion complexation of sulfadimethoxine sulfamerazine and
sulfapyridine with α- and β-cyclodextrinslowast
In this chapter the spectral properties of sulfadimethoxine (4-amino-N-(26-
dimethoxypyrimidin-4-yl) benzenesulfonamide SDMO) sulfamerazine (4-amino-N-(4-
methylpyrimidin-2-yl) benzenesulfonamide SMRZ) and sulfapyridine (4-amino-N-pyridin-
2-ylbenzenesulfonamide SFP) molecules in α-CD β-CD and different solvents have been
investigated using absorption fluorescence and time-resolved fluorescence methods The
formation of solid inclusion complexes of the drugs with α-CD and β-CD were characterized
by SEM TEM FTIR DSC XRD and 1H NMR techniques PM3 method was also applied
to study the inclusion process of the drugs within CD cavity and the minimum energy
structures of drugCD complexes were proposed The chemical structures of SDMO SMRZ
and SFP are given below
Chemical structures of (a) SDMO (b) SMRZ and (c) SFP
51 Effect of CDs with sulfonamides
Table 51 depicts the absorption and fluorescence maxima of SDMO SMRZ and
SFP recorded in different concentrations of α-CD and β-CD at pH ~7 The absorption and
fluorescence spectra of the above drug molecules in the presence and absence of CDs are
lowast Journal of Molecular Structure ndash 1054-1055 (2013) 215 Journal of Carbohydrate Polymers ndash 101 (2014) 828
(a) (b)
(c)
HH22NN SS
OO
OO
NNHHNN
NN
OO
OO
HH22NN SS
OO
OO
NNHHNN
NN
HH22NN SS
OO
OO
NNHHNN
131
shown in Figs 51-54 SDMO gives a structureless broad absorption band at 268 nm
whereas two absorption bands (at 268 and 243 nm) are obtained for SMRZ in aqueous
solution However in the spectrum of SFP in water three absorption bands are found at 310
nm (πrarrπ transition of the double bond) 261 nm (πrarrπ transition of the aniline group)
and 243 nm (πrarrπ transition of the aromatic ring) With increasing concentrations of β-CD
the absorption maxima of the above drugs are red shifted (about ~8 nm) with gradual
decrease in the molar extinction coefficient whereas the absorbance increased at the same
wavelength in the α-CD The decrease or increase in the absorbance is due to the
encapsulation of the above sulfa drugs into the CD cavity and it is attributed to the detergent
action of CDs [87-93] Further when recorded after 24 hours no significant change was
observed in the absorbance indicating that these sulfonamides do not decompose in the CDs
solution The above behaviour is attributed to the enhanced dissolution of the sulfonamide
molecules through the hydrophobic interaction between the guest and non-polar cavity of
the CD These results suggest that sulfonamides are entrapped into the CD cavity to form the
stable inclusion complex Moreover the red shift observed in β-CD reveals that the
pyrimidine nitrogen atom interacts with β-CD hydroxyl groups because it is well known
that CDs are good hydrogen donors [1-3] Additionally in all the cases a clear isosbestic
point was observed in the absorption spectra In general the existence of an isosbestic point in
the absorption spectra is an indication of the formation of well defined 11 complex [87-93]
Figs 53 and 54 display the typical fluorescence spectra of SDMO SMRZ and SFP
in aqueous solution as a function of α-CD and β-CD concentrations Both SDMO and
SMRZ drugs exhibit dual fluorescence with the maximum excitation wavelength of 270 nm
Likewise SFP emits two emission peaks at 348 and 434 nm with a shoulder at 372 nm when
excited at 310 nm It has been shown in our earlier studies [88] that sulfonamide derivatives
undergo normal as well as highly Stokes shifted fluorescence The normal fluorescence
takes place from locally excited (LE) state while twisted intramolecular charge transfer
(TICT) is responsible for highly Stokes shifted fluorescence The PM3 calculations have
suggested that the large stabilization of excited singlet state of the above sulfa drugs with
twisted conformation occurring at the amide SndashN bond between the electron donor group
(aniline ring) and the electron acceptor group (heterocyclic ring) In water the intensity of
LE band is greater than TICT band However on addition of CDs both the LE and TICT
intensities are equally increased With an increase in the β-CD concentration a regular red
shift is observed in the TICT band (434 nm to 445 nm) in all the drugs
132
Table 51
133
Fig 51 Absorption spectra of SDMO SMRZ and SFP in different concentrations of α-CD (M) (1) 0 (2) 0001 (3) 0002 (4) 0004 (5) 0006 (6) 0008 and (7) 001 Inset Fig Plot of absorbance vs concentration of α-CD
Abs
orba
nce
Wavelength (nm)
080
040
0 200 290 380
[α-CD] times 10-3 M
073
075
077
0 5 10 15
Abs
268 nm
1
7
SMRZ
Abs
orba
nce
Wavelength (nm)
150
075
0 200 275 350
SDMO
1
7 [α-CD] times 10-3 M
066
072
078
0 5 10 15
Abs
268 nm
Abs
orba
nce
Wavelength (nm)
080
040
0 200 300 400
Abs
[α-CD] times 10-3 M
027 028 029
0 4 8 12
040
310 nm
SFP
1
7
134
Fig 52 Absorption spectra of SDMO SMRZ and SFP in different concentrations of β-CD (M) (1) 0 (2) 0001 (3) 0002 (4) 0004 (5) 0006 (6) 0008 and (7) 001 Inset Fig Plot of absorbance vs concentration of β-CD
Abs
orba
nce
Wavelength (nm)
150
075
0 200 275 350
7
1
SDMO
[β-CD] times 10-3 M
047
061
075
0 5 10 15
Abs 268 nm
Abs
orba
nce
Wavelength (nm)
100
050
0 200 275 350
SMRZ
7
1 [β-CD] times 10-3 M
068
072
076
0 5 10 15
Abs 268 nm
Abs
orba
nce
Wavelength (nm)
080
040
0 200 300 400
SFP
Abs
[β-CD] times 10-3 M
027 031 035
0 4 8 12
039 310 nm
7
1
7
1
135
Fig 53 Fluorescence spectra of SDMO SMRZ and SFP in different concentrations of α-CD (M) (1) 0 (2) 0001 (3) 0002 (4) 0004 (5) 0006 (6) 0008 and (7) 001 Inset Fig Plot of fluorescence intensity vs concentration of α-CD
Fluo
resc
ence
inte
nsity
(au
)
Wavelength (nm)
600
300
0 280 400 520 340 460
SDMO
1
7 [α-CD] times 10-3 M
260
330
400
0 5 10 15
If
341 nm
Fluo
resc
ence
inte
nsity
(au
)
Wavelength (nm)
480
240
0 290 405 520
SMRZ If
[α-CD] times 10-3 M
200
260
0 4 8 12
320
341 nm
1
7
Fluo
resc
ence
inte
nsity
(au)
Wavelength (nm)
300
150
0 320 450 580
SFP
1
7
If
[α-CD] times 10-3 M
50
110
0 4 8 12
170
310 nm
136
Fig 54 Fluorescence spectra of SDMO SMRZ and SFP in different concentrations of β-CD (M) (1) 0 (2) 0001 (3) 0002 (4) 0004 (5) 0006 (6) 0008 and (7) 001 Inset Fig Plot of fluorescence intensity vs concentration of β-CD
340 460
Fluo
resc
ence
inte
nsity
(au
)
Wavelength (nm)
600
300
0 280 400 520
[β-CD] times 10-3 M
250
400
550
0 5 10 15
If
340 nm
1
7
SDMO
Fluo
resc
ence
inte
nsity
(au
)
Wavelength (nm)
300
150
0 320 450 580
SFP If
[β-CD] times 10-3 M
0 100 200
0 4 8 12
300
434 nm
1
7
Fluo
resc
ence
inte
nsity
(au
)
Wavelength (nm)
600
300
0 290 405 520
1
7 SMRZ If
[β-CD] times 10-3 M 0
300
0 4 8 12
600
452 nm
137
whereas no significant shift was observed in the LE band (341 nm) In SFP the LW and
MW emission bands are regularly red shifted on increasing the β-CD concentrations
accompanied by the increase in the intensity and the SW band became blurred In contrast to
β-CD both LE and TICT bands are not changed in α-CD However the emission intensity is
gradually increased Moreover SDMO SMRZ and SFP molecules show larger enhancement
in β-CD solution when compared to α-CD In CDs the enhancement of the LE and TICT
bands of sulfonamides may be explained as follows The enhancement of the LE band in CD
may be due to lowering of solvent polarity at higher CD concentration [154] Inside the CD
cavity sulfonamides have much less polar environment and the main non-radiative path of
the LE band through ICT or TICT is restricted which also causes an enhancement of the LE
and TICT band Further the geometrical restriction of the CD cavity would restrict the free
rotation of the heterocyclic ring (pyrimidinepyridine) in the CD cavity and thus favours the
formation of TICT state From the earlier studies [88] it is found that in aqueous CD
solutions containing the drugs hydrophobicity is the driving force for encapsulation of the
molecule inside the cavity and naturally the hydrophobic part prefer to go inside the deep
core of the less polar CD cavity and the polar group will be projected in the hydrophilic part
of the CD cavity [154] From the above findings it is clear that in CD the surrounding
polarity of SO2minusNH group does not change very much as there is no hypsochromic shift of
the most polar (TICT) state [170] This may be possible only if the orientation of
sulfonamide is such that the aromatic ring present inside the CD cavity and the amino group
is present outside of the CD nanocavity
The above results indicate that the SDMO SMRZ and SFP molecules are partially
entrapped into the CD cavity Since the size of SDMO SMRZ and SFP molecules are
larger than CD cavity the guests are partially entrapped into the CD It is noteworthy that
the LW emission intensity gradually increased along with red shift on increasing the
concentrations of α-CD and β-CD It can be suggested that the LW emission band is related
to the formation of CD inclusion complex Such a spectral shift may correspond to an
energy stabilization of the emitting state and is characteristic for the fluorescence of TICT
state The LW emission for the above sulfonamides originates from the TICT state with
twisting occurring at the amide SndashN bond between the aniline ring (electron donor) and the
SO2 group or pyrimidine ring (electron acceptor) Further Rajendiran et al [171 172]
reported whenever two aromatic rings are separated by the groups like SO2 CH2 CO NH
etc they form a TICT state Thus it can be speculated that the enhancement of the band at
138
445 nm emission should have originated from the TICT state The LW emission (445 nm) in
both CD solutions suggests that the inclusion process plays a major role in the TICT
emission
In all the three drugs the presence of isosbestic point in the absorption spectra
suggests the formation of 11 inclusion complex between the drugs and CDs The binding
constant for the formation of inclusion complex was determined by analyzing the changes in
the absorbance and fluorescence intensities with the different concentrations of CD The
binding constant (K) values determined using Benesi-Hildebrand relation [120] indicates
that 11 complexes are formed between the sulfonamides and CDs Fig 55 depicts the plot
of 1AndashA0 and 1IndashI0 as a function of 1[CD] for the SDMO SMRZ and SFP molecules The
plot of 1AndashA0 and 1IndashI0 as a function of 1[CD] gives linear line This analysis reflects the
formation of 11 inclusion complex formed in all sulfonamides The calculated binding
constant (K) values are listed in the Table 51 The binding constant values are small when
compared to previously reported hostguest complexes such as dialkyl aminobenzonitrile
and its derivatives [154] This is probably due to (i) sulfonamide molecules are partially
entrapped into the cavity (ii) heterocyclic ring (pyrimidinepyridine) might have entrapped
in the cavity and (iii) these molecules might not be tightly encapsulated in the CDs cavities
The Gibbs free energy changes (∆G) of the inclusion complexes are calculated using
the Eqn 25 As can be seen from Table 51 the calculated ∆G values for SDMOCD
SMRZCD and SFPCD inclusion complexes are negative which suggests that the inclusion
process proceeded spontaneously at 303 K The hydrophobic interaction between the
internal wall of CDs and guest molecules is an important factor for the stability of inclusion
complexes In sulfonamides it is considered that the change in the magnitude of the
hydrophobic interaction is related to that of the contact area of the guest molecule for the
internal wall of CD cavity
52 Effects of solvents
In order to investigate the TICT emission of SDMO SMRZ and SFP the absorption
and fluorescence maxima of the above molecules in the solvents having different polarities
and hydrogen bond forming tendency have been recorded The spectral data are listed in
Table 52 Due to the low solubility of the drug in non-polar cyclohexane solvent its
spectrum was recorded using 1 dioxane solution of cyclohexane The data in Table 52
indicate that the absorption bands are more intensed with less features where the relative
intensity of each is sensitive to solvent polarity This more intensed bands are caused by
139
Fig 55
140
Table 52
141
the (π π) transition of benzene ring and not by the (n π) transition of the carbonyl group
[155 156] The molar extinction coefficient is very high (~10-4 cm-1) at these maxima It is
observed that the absorption spectra of SDMO are red shifted from non-polar cyclohexane to
methanol due to the most proton accepting nature of solvents with increasing the polarity
Further water can act as proton donor solvent and thus produce a blue shift in the absorption
spectra of the drug molecule The spectral shifts observed in the absorption spectra of
SDMO in protic and aprotic solvents are consistent with the characteristic behaviour of
chromophore containing amino group [152c]
In addition the absorption spectral characteristics of SDMO are red shifted with
respect to that of sulfisomidine (SFM cyclohexane asymp λabs ~262 nm λflu ~327 nm
acetonitrile asymp λabs ~268 nm λflu ~340 nm methanol asymp λabs ~269 nm λflu ~318s 345 nm
water asymp λabs ~263 nm λflu ~342 432 nm) and sulfanilamide (SAM cyclohexane asymp λabs ~260
nm λflu ~320 nm acetonitrile asymp λabs ~261 nm λflu ~336 nm methanol asymp λabs ~261 nm λflu
~340 nm water asymp λabs ~258 nm λflu ~342 nm) [88] Likewise in SMRZ the absorption
maxima are red shifted compared to sulfadiazine (SDA cyclohexane asymp λabs ~262 nm λflu
~326 nm acetonitrile asymp λabs ~268 nm λflu ~330 nm methanol asymp λabs ~269 nm λflu ~318s 345
nm water asymp λabs ~263 nm λflu ~342 432 nm) [88] This shows that the replacement of
dimethoxy or methyl substituted pyrimidine ring on hydrogen atom of SO2ndashNH2 group has a
strong effect on the electronic energy levels of SAM The decrease in red shift of the above
sulfa drugs are in the order SDMO = SMRZ gt SFM = SDA gt SAM indicates the
substitution of pyrimidine ring and methoxy group is the key factor for absorption and
emission characteristics This is because of the different electronic densities of the HOMO
on each atom Further when compared to aniline [88] (cyclohexane asymp λabs ~283 235 nm λflu
~320 nm methanol asymp λabs ~278 230 nm λflu ~335 nm) the absorption spectra are blue
shifted while a red shift is observed in the fluorescence spectra However in polar solvents a
small shift was observed in the absorption and emission spectra for SDMO and SMRZ
suggesting that tautomeric structures present in sulfonamides [173] which is realistic reason
for insoluble nature of the drug in non-polar cyclohexane solvent
The typical fluorescence spectra of SDMO SMRZ and SFP in different solvents at
303 K are shown in Fig 56 In contrast to the weak solvent dependent absorption spectra
the emission properties of SDMO SMRZ and SFP molecules are strongly solvent dependent
indicating the possibility of a change in the character of the electronic state In all non
142
Fig 56 Fluorescence spectra of SDMO SMRZ and SFP in different solvents at 303 K (Conc = 4 times 10-5 M) (1) cyclohexane (2) ethyl acetate (3) acetonitrile (4) 2-propanol (5) methanol and (6) water
Fluo
resc
ence
inte
nsity
(au
)
Wavelength (nm)
600
300
0 280 390 500
1
2 3 4
5
6
335 445
SDMO λexci = 290 nm
Fluo
resc
ence
inte
nsity
(au
)
Wavelength (nm)
750
375
0 320 460 600
4 1
2
3
5
6
SFP λexci = 290 nm
Fluo
resc
ence
inte
nsity
(au
)
Wavelength (nm)
600
300
0 270 345 410
1
2
3 4 5
6
SMRZ λexci = 290 nm
143
aqueous solvents sulfonamide molecules give a single emission maximum whereas in water
they give two emission maxima Among the two maxima one occurs in shorter wavelength
region (SW) around ~340 nm and the other in longer wavelength region (LW ~430 nm) The
intensity of SW band is greater than LW band Further the fluorescence intensity is weaker
in water than other non-aqueous polar solvents As the solvent polarity is increased the
emission maxima of the above molecules undergo a considerable red shift Further the
excitation spectra corresponding to SW and LW emission maxima resembles the absorption
spectra of SDMO and SMRZ
The appearance of LW fluorescence in glycerol and CD solutions implies that the
spectral behaviour of the sulfonamides is not due to solute-solvent specific interaction
ie complex formation In non-aqueous solvents the LW emission from SDMO and SMRZ
seems to be very weak or absent as compared with the MW band and therefore the LW
band is assumed to be TICT state This is because the LW is red shifted in water suggesting
that the emitting state is TICT type This is indicated by large increase in dipole moment
upon excitation The increase in dipole moment is caused by a change in the electronic
configuration of the amino group from tetrahedral (Sp3) in S0 state to the trigonal (Sp2) in
the excited state In order to check the TICT the fluorescence spectrum of SDMO was
recorded in solutions consisting of different composition of glycerol-water mixtures As
expected the fluorescence intensity of MW band increased with an increase of glycerol
content This is according to the fact that as the viscosity increases the free rotation of
aniline group decreases In addition the larger Stokes shifts imply that in aprotic solvents
the unspecific interactions are the key factors in shifting the fluorescence maxima to the
longer wavelength for these sulfa drug molecules As evident from the above results these
interactions are large in case of the above drugs and may be attributed to increasing dipole
moment of S1 state and hence a strong charge transfer (CT) character of the emitting state In
the excited state rigid molecules with limited internal degrees of freedom change the
structure of the solvent cage with their dipole moment change This process induces a large
Stokes shifts in these sulfa drugs in the polar solvents
53 Prototropic reactions in aqueous and CD medium
The influence of different acid and base concentrations in the H0pHHndash range of -10
to 160 on the absorption and fluorescence spectra of SDMO SMRZ and SFP were studied
(Table 53) During the study of the pH dependence of absorption and emission the self
aggregation of drug molecule should be avoided Therefore the spectroscopic titrations
144
(absorption and emission) were performed in aqueous medium with the concentration of
2 times 10-5 M SDMO is likely to exist in different forms of the protonation and deprotonation
depending on the pH of aqueous solutions neutral monocation dication monoanion The
absorption and fluorescence intensity of SDMO were constant between pH ~75 and 95
indicating that in this range neutral species only present With a decrease on pH from 75
the absorption maxima are regularly red shifted The red shifts in SDMO with an increase of
hydrogen ion concentration suggest the formation of monocation formed by the protonation
of tertiary nitrogen in the pyrimidine ring The monocation can be formed either by
protonation of tertiary nitrogen or ndashNH2 group It is well established that protonation of ndash
NH2 group will lead to the blue shift whereas protonation at =Nndash atom will lead to the red
shift in the absorption and fluorescence spectra of the neutral species Dogra et al [174] have
clearly demonstrated that first protonation takes place on the pyrimidine nitrogen atom and a
regular red shift observed for dication reveals intramolecular proton transfer (IPT) process
between =Nndash atoms and amino group Further increase in the acid concentration from pH
~25 a large red shift was noticed in the absorption maxima suggested that the formation of
dication While increasing the pH above 8 a slight red shifted absorption maximum is
noticed at pH ~11 suggesting the formation of monoanion Further no significant change in
the absorption maxima was observed while increasing the pH of the solutions The same
trend was observed in the pH dependence of absorption and fluorescence spectra of SMRZ
and SFP molecules
The fluorescence spectral behavior of protonated species (monocation and dication)
of SDMO observed is similar to the absorption spectra On increasing the pH above 10 the
emission intensity of the fluorescent band decreased at the same wavelength without the
appearance of any new band This may be due to the formation of monoanion In general
the monoanion of many aromatic amino compounds are reported to be non-fluorescent in the
S1state [174]
To know the effect of CD on the prototropic equilibrium between neutral
monocation and dication the pH dependent changes in the absorption and emission spectra
of the above sulfonamides in aqueous solution containing α-CD and β-CD were recorded
and the spectral data are shown in Table 53 The absorption and emission maxima of these
sulfonamides were studied in 6 times 10-3 M CD solutions in the pH range 01 to 11 In CD
solutions the absorption and emission maxima of these sulfonamides neutral maxima were
red shifted on comparison with aqueous medium (Table 53)
145
Table 53
146
54 Possible inclusion complex
From the above results the possible inclusion mechanism is proposed as follows
According to the molecular dimension of the guests (long axis SDMO = 134013 Aring SMRZ =
120564 Aring and SFP = 121835 Aring) it is too large to fit entirely in the CD cavity and the entire
guest molecule cannot be fully entrapped within the hydrophobic CD cavity Since the internal
diameter of α-CD and β-CD was found to be approximately ~56 Aring and 65 Aring respectively
and its height ~78 Aring Therefore naturally two different types of inclusion complex formation
between the sulfa drugs and CDs are possible (i) the aniline ring is captured in the CD cavity
and (ii) the heterocyclic (pyrimidinepyridine) ring is captured in the CD cavity Let us consider
the type I arrangement where the aniline part of the drug molecules is encapsulated within the
CD cavity if this type of inclusion complex was formed the above drug molecules should not
show any dual emission in CD medium Further if the amino group is entrapped within the CD
cavity the dication maxima (ie protonation of amino group) should be blue shifted in α-CD
and β-CD than in aqueous medium [174 175] The present results indicate that no significant
difference in the spectral shifts in CDs and aqueous medium ie dication maxima follow the
same trend both in aqueous and CDs medium (Table 53)
In type II encapsulation if the heterocyclic ring (pyrimidinepyridine) is included into
the CD cavity the monocation maxima of the sulfonamide molecule (ie protonation of
tertiary nitrogen atom) should be red shifted in CD solution than aqueous medium The results
in Table 53 indicate that the heterocyclic ring interacts with CDrsquos hydroxyl groups confirming
the fact that CDs are good hydrogen donors The tendencies of these shifts in λabs and λflu for
the above molecules can be attributed to their inclusion into the CD cavity Further similar
results were observed in our earlier reports [88] Moreover in type II complex the CD cavity
impose a restriction on the free rotation of the methyl group or heterocyclic ring in the excited
state In this type of inclusion TICT emission should increase in CD medium Further another
question may arise why SDMO SMRZ and SFP does not exhibit the TICT emission in non-
aqueous and non-polar solvents It may be because of a weak dipole-dipole interaction between
RndashSO2ndashNH group with the solvent and fast back charge transfer These features support the
idea that the TICT state in CD medium was stabilized through complex formation between
SDMO SMRZ and SFP with CDs This confirms that the environments around the aniline
group in both CD medium were same as in the bulk aqueous medium Hence type II complex
formation is favored than type I complex formation These results reveal that the part of the
aniline and heterocyclic ring might be present inside of the CD cavity
147
55 Fluorescence life time analysis
The fluorescence lifetime values of SDMO SMRZ and SFP in water α-CD and
β-CD (001 M) have been monitored and the relevant data are compiled in Table 54 The
fluorescence decay curve for the free drugs in water was fitted to biexponential function with
χ2 values of ~11 This indicates that these drugs have two lifetime components One causative
maximum of the total fluorescence (τ1) and the other causative is the rest of fluorescence (τ2)
The first with a longer lifetime is assigned to LE emission and the other to TICT state of guest
molecule It is noteworthy that the decay time of the slow component is different to that of
TICT emission within experimental uncertainty This indicates that an equilibrium between
the locally excited (LE) state and the TICT state is achieved in water rather in a short period
By the addition of CDs biexponential decay curve becomes triexponential Three lifetimes (τ1
τ2 and τ3) were obtained in the presence of both α-CD and β-CD Fig 57 reflects that the
observed lifetime values increase with the addition of CD concentration in aqueous solution
due to the inclusion complex formation between the drugs and CDs The enhancement of
lifetime values indicate that SDMO SMRZ and SFP molecules experience less polar
hydrophobic environments within the CD cavity resulting reduced non-radiative decay
processes Thus the increase in fluorescence lifetimes is a result of the significant interactions
of the sulfa drugs with hydrophobic CD nanocavities The lifetime enhancement is found to be
higher with β-CD than that of α-CD suggests that the stronger hydrophobic interactions
between the sulfonamides and β-CD cavity
Table 54 Fluorescence decay parameters of SDMO SMRZ and SFP in water and 001 M CD solutions (λexcitation = 295 nm and λemission = 340 nm)
Drugs Medium Lifetime (ns) Pre exponential factor
ltτgt τ1 τ2 τ3 a1 a2 a3
SDMO Water 029 328 017 006 268 α-CD 043 114 483 012 007 003 294 β-CD 055 189 558 011 005 002 313
SMRZ Water 093 325 023 005 193 α-CD 052 179 672 012 007 002 360 β-CD 034 254 856 020 009 002 442
SFP Water 027 367 029 004 248 α-CD 036 182 521 027 008 003 279 β-CD 019 272 875 022 007 001 403
148
Fig 57 Fluorescence decay curves of (a) SDMO (b) SMRZ and (c) SFP in water and 001 M CD solutions
(a)
(b)
(c)
149
56 Molecular modeling studies
The energy features thermodynamic parameters (enthalpy entropy and free energy
change) HOMO-LUMO energy calculations and dipole moment values for the guests
(SDMO SMRZ and SFP) and their corresponding inclusion complexes are summarized in
Table 55 The PM3 level optimized structures of the inclusion complexes are shown in Figs
58 and 59 It can be seen from Figs 58 and 59 that the guest molecules formed stable
inclusion complexes with α-CD and β-CD Interestingly it can also be seen that the
structures of SDMOα-CD SDMOβ-CD SMRZα-CD SMRZβ-CD SFPα-CD and
SFPβ-CD inclusion complexes are all similar to each other
Table 56 depicted the bond distances bond angles and the most interesting dihedral
angles of the drugs (guests) before and after complexation within CDs obtained from the
PM3 optimized most stable structures (Figs 58 and 59) It was evident that in the CD
cavity the geometries of SDMO SMRZ and SFP drugs were slightly altered The
alterations were significant in the dihedral angles which indicate that the drugs adopted
a specific conformation to form a stable complex The internal diameter of α-CD is
approximately 50 Aring and β-CD is approximately 65 Aring considering the shape and
dimensions of both CD the drugs may not be completely embedded into the CD cavity
Since the vertical distance and length of the SDMO SMRZ and SFP drugs are greater than
the dimensions of both CD the guest molecule cannot be fully present inside of the CD
cavity Further the optimized structures of the inclusion complexes were also confirmed that
the guest molecules partially included in the α-CD and β-CD cavity
The optimized inclusion structures in Figs 58 and 59 demonstrated that hydrogen
bond is formed in all the inclusion complexes The intermolecular hydrogen bonds were
formed between hydrogen atom of amino group of the drugs and oxygen atom of primary
hydroxyl group of the CD with a dHO distance less than 30 Aring This justified the importance
of both interaction energy between the drugs and CD necessary to ensure a better inclusion
of the guest into the host molecules The above values were supported by the fact that the
flexibility of the host molecule may be one of the structural requirements for inclusion
complexes formation The present calculations also explained that hydrogen bond brings the
difference between the binding energies of both α-CD and β-CD complexation with the
SDMO SMRZ and SFP drugs
150
Table 55
151
Fig 58 PM3 optimized structures of 11 inclusion complexes of (a) SDMOα-CD (b) SDMOβ-CD and (c) SMRZα-CD
Side view
2965 Aring
1808 Aring
Upper view
1876 Aring 1840 Aring
2784 Aring
(c)
(b)
1825 Aring
2699 Aring
(a)
1807 Aring
2566 Aring
152
Fig 59 PM3 optimized structures of 11 inclusion complexes of (a) SMRZβ-CD (b) SFPα-CD and (c) SFPβ-CD
Side view
1623 Aring
1621 Aring
1821 Aring
2986 Aring
1741 Aring 2441 Aring
Upper view
(a)
(b)
(c)
2986 Aring
1826 Aring
2966 Aring
153
Table 56
154
In all the six inclusion complex structures in Figs 58 and 59 It is noticed that
drugCD complexes contain three hydrogen bonds one between nitrogen atom of
pyrimidine ring and H atom of the CD with hydrogen bonding dHO distance ranging from
1821 to 2986 Aring The two oxygen atoms of sulphonyl group (ndashSO2) and two hydrogen
atoms of the CD have hydrogen bonding with dHO distance of 162-296 Aring (Figs 58 and
59) Comparatively a careful analysis of the energetic values obtained from PM3 method
suggests that the mutual host-guest hydrogen bonding interactions contribute greatly to
Ecomplexation and are crucial in determining the stability of inclusion complexes [141]
It is well known that the van der Waals forces including the dipole-induced dipole
interactions are proportional to the distances between the guests the wall of the CD cavities
and the polarizabilities of the two components The interaction of the phenyl ring with CD
would play an important role because the phenyl moiety may achieve a maximum contact
area with the internal surface of the cavity of CD The above results imply that the inclusion
of the drug molecules within the CD cavity is affected by hydrophobic and electronic
interactions Since CD has a permanent dipole the primary hydroxyl end is positive and the
secondary hydroxyl end is negative in the glucose units of CD The stability of binding by
hydrophobic interactions is partly the result of van der Waals force but is mainly due to the
effects of entropy produced on the water molecules [176]
The dipole moment of SDMO (695 D) is significantly higher than the other isolated
SMRZ and SFP molecules (Table 55) The dipole moment of the inclusion complexes are
present in the following order SDMOβ-CD gt SDMOα-CD gt SFPβ-CD gt SFPα-CD
gt SMRZβ-CD gt SMRZα-CD All the inclusion complexes have dipole moment values
higher or lower than the corresponding isolated drugs molecules This indicates that the
polarity of the CD cavity changed after the drugs entered into the CD cavities From these
results it is concluded that the dipole moment shows a strong correlation with the
complexation behaviour of the guest and host molecules
The EHOMOndashELUMO gap is an important scale of stability [145] and chemicals with
larger EHOMOndashELUMO gap values tend to have higher stability Therefore we investigated
the electronic structure of the isolated drugs and the inclusion complexes using the PM3
method HOMO and LUMO energies of the sulfonamides and their inclusion complexes
are given in Table 55 and Fig 510 which exposed the energy gap and the chemical
activity of the molecules The LUMO as an electron acceptor represents the ability to
obtain an electron and HOMO represents the ability to donate electron Fig 510 illustrates
155
Fig 510
156
the LUMO energy orbital pictures of all the isolated drugs are similar to each other whereas
the HOMO is significantly varied The energy gap between HOMO and LUMO of each
complex suggest that there will be a significant change in the electronic structures of guest
molecules The EHOMOndashELUMO gap for SFPβ-CD inclusion complex (-843 eV) was more
negative which advocate that this complex is more stable than other inclusion complexes
Though the results are not readily understandable according to the driving forces
listed in the earlier reports the Morokuma theory of energy decomposition analysis [177]
can offer a reasonable explanation According to the theory when a supramolecule was
formed electrons will lose their identity as belonging to one or other component molecule
Four types of interactions should be considered in the formation of a supramolecule
(a) electrostatic interaction which is favoured by large permanent charges and dipoles
(b) polarization interaction which is favoured by large volume and polarizability of the
molecules (c) exchange energy or Pauli repulsion and (d) charge-transfer interaction which
is contributed from the mixing of the filled orbital of one component molecule with the
vacant orbital of the other The charge transfer is always attractive and the most important
terms in this interaction are contributed from the charge-transfer between the HOMO of one
component and the LUMO of the other These first three interactions constitute the
canonical driving forces in CD chemistry ie dipolendashdipole interaction dipole-induced
dipole interaction and steric effect However they cannot explain the unexpected theoretical
and experimental observations The higher HOMO of the guest molecule the stronger is the
charge transfer in the complexation Herein the PM3 calculations showed that no charge
transfer is formed between the guest and host molecules [176]
To investigate the thermodynamic parameters of the binding process the statistical
thermodynamic calculations were carried out at 1 atm pressure and 29815 K temperature by
PM3 method The thermodynamic quantities the binding energies (ΔE) Gibbs free energy
changes (ΔG) enthalpy changes (ΔH) and entropy changes (ΔS) are depicted in Table 55
The PM3 calculations express that energies of the complexation are lower than those for the
isolated host and guest molecules The complexation energy allowed us to evaluate the
inclusion process and to find the most stable inclusion complex between the complexes
under study The complexation reactions of SDMO SMRZ and SFP with CDs were
exothermic which was judged from the negative ΔE and ΔH values The negative energy
and enthalpy changes suggested that the inclusion processes were energetically and
enthalpically favorable in nature Among the six inclusion complexes SMRZβ-CD
157
complex has lowest energy (-1976 kcal mol-1) when compared with other complexes SFP
α-CD (-389 kcal mol-1) SFPβ-CD (-1742 kcal mol-1) SMRZα-CD (-1057 kcal mol-1)
SDMOα-CD (-671 kcal mol-1) and SDMOβ-CD (-1031 kcal mol-1) The above results
indicate that SMRZ and β-CD formed more stable inclusion complex than other two drugs
(because high negative value is more stable) The calculated interaction energies as
discussed above can be promptly understood in terms of the formation of intermolecular
hydrogen bonds only In this respect CD hydrogen atoms (particularly the inner protons)
play a major role in stability of these sulfonamide inclusion complexes For all these
complexes favourable hydrogen bonding interactions have been predicted based on the
distance between hydrogen atoms of hosts (α-CDβ-CD) and nitrogen atoms in heterocyclic
ring or sulphonyl (SO2) groups of the guest molecules For these six inclusion complexes
several hydrogen bonds are possible but only minimum number of hydrogen bonds were
identified (Figs 58 and 59) These findings suggest that dispersion forces must play an
important role in the complex formations [178] The significant ΔE values which may vary
with the length of hydrogen bonds has been predicted From Table 55 the interaction
energies of the six inclusion systems differs from each other this is due to the hydrogen
bond between different groups (Figs 58 and 59) It is often difficult to explain the
difference in interaction energies of these complexes at PM3 level of computing
The experimentally determined free energy change (ΔG) values for all of the
inclusion complexes from the stability constant are negative which indicates that the
encapsulation process was a spontaneous and thermodynamically favoured in the
experimental temperature (303 K) When compared with the experimental ΔG values a
similar negative magnitude was obtained for SMRZβ-CD complex by PM3 calculation On
the contrary positive magnitudes were observed for other inclusion complexes suggesting
that the inclusion reactions were non-spontaneous processes The difference in ΔG values
can be explained by the solvent effect The actual experiments were conducted in aqueous
medium but the computational work was done at vacuum phase Unfortunately because of
limitations in the calculation ability of our computer and the large molecular size of CD the
statistical thermodynamic calculations for these systems could not be performed in aqueous
phase as well as in excited state However it was observed that the solvent effect on the
host-guest interactions easily changes the inclusion process from a non-spontaneous process
in the gas phase to a spontaneous one in the aqueous phase The host-guest interaction
causes an enthalpy-entropy compensating process in the gas phase whereas the same
158
interaction causes an enthalpy-entropy co-driven process in aqueous solution because
inclusion complexation releases a number of water molecules from the cavities of CD
To the best of our knowledge the very small negative ΔH values indicate that the
inclusion formation of drugs with CD is exothermic and enthalpy driven It should be noted
that ΔH and ΔS values relyon (i) release of water bound in the cavity (ii) partial destruction
of hydration shells of the reagents (iii) non covalent interactions (van der Waals
hydrophobic and electrostatic interactions as well as hydrogen bonding) and (iv) hydration
of the inclusion complexes All these processes should be taken into account while
discussing thermodynamic parameters of complex formation The ΔH value for SMRZ
β-CD complex is more negative (-1767 kcal mol-1) compared to other inclusion complexes
Probably geometrical factor plays a considerable role in complexation process The small
negative ΔS values are the confirmation of restriction of freedom of the molecule and
formation of less compact structures As it is evident from Table 55 hydroxyl groups
reduce the binding affinity of CD with the drugs making the complexation process more
enthalpy and less entropy favourable [179] It is believed that both the cavity size of CD and
substituents of the drug molecule cause steric hinderence during the inclusion process
The observed small negative ΔS values are due to enhancement of disorder in the
system Moreover hydrophobic interactions which are long range interactions can be
important in the CD complex formation The inclusion complex structure in Figs 58 and
59 also suggest that the benzene ring is partially encapsulated inside the CD cavity and
interacts with it through hydrophobic interactions Further the small ΔH values can be
explained by the prevalence of hydrophobic interactions Based on the ΔS and ΔH values of
the three drugs with CDs it is confirmed that the six inclusion complexes are stable
Comparison of ΔH and ΔS confirmed that enthalpy changes are higher and entropy changes
are lower for the complexation Therefore complexes of the drugs with both α-CD and β-CD
are more enthalpy stabilized
57 Solid inclusion complex studies
571 Scanning electron microscopic morphological observations
In order to study the morphological changes the images of the powdered form of the
drugs α-CD β-CD and powdered form of inclusion complexes observed by SEM
(Fig 511) These images were utilized to evaluate the effect of coprecipitation process on
the surface morphology of the solids used for the formation of solid inclusion systems The
159
SEM photographs clearly elucidated the difference between the pure components and their
inclusion complexes It can be seen in the SEM image Fig 511a that pure SDMO crystals
are in the form of sheets with smooth surface whereas the images of pure SMRZ crystals
are well-defined bar shape and a mean size of about ~5-10 micron (Fig 511d) However
the examination of SEM photographs of SFP showed micronized crystals compact
structures can be observed with irregular shapes and different sizes characterized by smooth
surface and obtuse corners (Fig 511g) In contrast the morphologies of the inclusion
complexes are quite different in shapes and sizes from pure drugs and CDs The SDMO
α-CD solid complex (Fig 511b) was appeared in irregular shapes with variable size
whereas a bar like shape was observed for SDMOβ-CD complex (Fig 511c) The
SMRZα-CD complex (Fig 511e) exhibited cylindrical shaped particles and irregular
shaped crystals were observed for the SMRZβ-CD complex (Fig 511f) Likewise the
morphology of SFP drug is different from their inclusion complexes Both the SFPCD solid
crystals show cracks and dimples on the surface which confirms that the coprecipitation
method is able to encapsulate the SFP into the CD cavity Modification of these structures
can be taken as a proof of the formation of new inclusion complexes by molecular
encapsulation
572 Transmission electron microscopic morphological observations
TEM was used to investigate the micro-structural features of the wall of encapsulated
sulfa drugs (Fig 512) In all the inclusion complexes round (presumably spherical) shaped
nanoparticles with the average size of about 30-90 nm were observed In the case of the
SDMOβ-CD inclusion complex the nano particles were partly agglomerated (Fig 512b)
due to this it was somewhat complicated to predict the shape of nano particles A similar
guest encapsulation associated with nanoparticle formation was found for another
hydrophobic drug molecule [180] Preparation of nanoparticles from preformed inclusion
complexes of the sulfa drug and α-CD or β-CD have been proved to be an effective method
to enhance drug loading to nanoparticles These results suggest that the CD serve as a
delivery carrier for hydrophobic drugs It is clearly demonstrated by Bonini et al [181] that
depending upon the concentration the β-CD monomers aggregated in different shapes in
aqueous medium at 298 K According to their investigation β-CD at lower concentration (3
mM) displays a well developed sphere-like shaped nano aggregation with diameter of 100
nm whereas at higher concentration (6 mM) micro-planar aggregates were observed From
the SAED pattern shown in Fig 512b (inset) it is confirmed that the complexation process
160
of SDMO with CDs led the crystalline drug completely transferred to amorphous nature
which is also supported by XRD results
Fig 511 SEM photographs of (a) SDMO (b) SDMOα-CD complex (c) SDMO β-CD complex (d) SMRZ (e) SMRZα-CD complex (f) SMRZβ-CD complex (g) SFP (h) SFPα-CD complex and (i) SFPβ-CD complex
100 microm
20 microm
(b) (e)
(d) (a)
(c) (f)
(h)
(g)
(i)
50 microm
30 microm
20 microm
10 microm 30 microm
10 microm
20 microm
161
Fig 512 TEM photographs of (a) SDMOα-CD complex (b) SDMOβ-CD complex (c) SMRZα-CD complex (d) SMRZβ-CD complex (e) SFPα-CD complex and (f) SFPβ-CD complex Inset in figure (b) shows SAED pattern of SDMOβ-CD complex
(a) (b) 90 nm
20 microm 50 microm
02 microm
95 nm
(f) (e)
(c) (d)
200 nm
1 microm 500 nm
162
573 FTIR spectral analysis
The complexation between the sulfonamides and CDs was investigated using FTIR
spectroscopy Figs 513 and 514 depict the FTIR spectra of free SDMO SMRZ SFP and
their corresponding inclusion complexes The investigation of the inclusion complexes was
complicated due to the strong stretching frequency of CDs overlapping with the bands of the
drugs The IR spectrum of SDMO drug (Fig 513a) was characterised by principal
absorption peaks at 3450 and 3348 cm-1 (for NH stretching in SO2ndashNH group) 3231 cm-1
(for NH2 stretching) 1651 cm-1 (for NH2 deformation) 1593 cm-1 (for C=C stretching)
1444 and 1352 cm-1 (for CH3 deformation) 1305 cm-1 (for SO2 asymmetric stretching)
1260 cm-1 (for CndashO stretching in ndashCOCH3 group) 1186 cm-1 (for SO2 symmetric
stretching) 1089 and 810 cm-1 (for CndashH deformation in phenyl ring) 1005 cm-1 (for CndashN
stretching) 875 cm-1 (for SndashN stretching) and 545 cm-1 (for SO2 deformation) The FTIR
spectra of CD consisted of the prominent absorption peaks of OndashH stretching (3392 cm-1)
CndashH stretching (2926 cm-1) HndashOndashH bending (1646 cm-1) CndashO stretching (1157 cm-1) and
CndashOndashC bending (1028 cm-1) In contrast the IR spectral features of the pure drug had
completely disappeared in the inclusion complexes The band assigned to the NH stretching
in SO2ndashNH group and NH2 stretching had completely disappeared in the inclusion
complexes (Figs 513b and c) The bands positioned at ~1651 1593 1260-1089 cm-1 were
shifted and their intensities were diminished The NH2 deformation and CH3 deformation
frequencies were shifted in the inclusion complexes to 1654 and 1446 1355 cm-1
respectively However the CndashN stretching was shifted to lower frequency (992 cm-1) in the
inclusion complexes The SndashN stretching and SO2 deformation bands became shorter and
shifted to lower frequencies of 871 and 542 cm-1 respectively The above changes can be
due to the formation of SDMOCD inclusion complexes in solid state According to the
above FTIR analysis of inclusion complexes we might suggest that the aniline ring of the
SDMO was involved in the complexation and the amino group is present outside of the CD
cavity Nevertheless no new chemical bonds were formed which revealed that the non-
covalent interactions between the drug and CDs These results may be due to the presence of
van der Waals interactions between CD and SDMO In this regard van der Waals
interactions are generally considered to contribute to the formation of inclusion complexes
with CDs
Fig 513d shows the characteristic bands of SMRZ at 3483 cm-1 and 3379 cm-1
for amido stretching and amino stretching vibrations respectively 1246 cm-1 for primary
163
Fig 513 FTIR spectra of (a) SDMO (b) SDMOα-CD complex (c) SDMOβ-CD complex (d) SMRZ (e) SMRZα-CD complex and (f) SMRZβ-CD complex
Tra
nsm
ittan
ce
4000 40000 30000 20000 10000
Wavenumber (cm-1)
(a)
3231
06
2953
28
1444
81
1186
33
1143
89
682
86
542
05
1651
22
1089
88
3450
96
3348
73
1593
35
1417
81
1352
22
567
12
875
76
810
18
(d)
(f)
(e)
3254
21
3078
67
1408
16
1302
07
1153
54 68
286
522
05
1630
01
1091
81
3483
76
3379
59
1597
20
1493
04
1327
14
583
12
835
25
2874
19
2779
67
2955
21
891
19
2926
28
3379
59
2773
89
1630
10
1597
28
1570
20
1493
05
1408
16
1329
85
1157
39
1029
15 89
119
83
718
679
47
578
70
545
90
2920
49
3380
23
1641
57
1597
20
1570
20
1493
15
1410
09
1329
55
1157
39
1302
07
889
26
837
18
680
93
576
77
545
90
(b)
(c)
2928
12
3358
24
1653
22
1593
35
1446
78
1355
26
1157
06
1030
31
684
86
569
47
2928
01
3359
21
1654
35
1593
35
1445
85
1355
28
1156
98
1030
68
684
79
569
82
1246
89
164
Fig 514 FTIR spectra of (a) SFP (d) SFPα-CD complex and (e) SFPβ-CD complex aromatic amine (CndashN stretching) 1630 cm-1 for secondary amine stretching 1597 cm-1 for
C=C bending and 795-637 cm-1 for CndashH bending vibrations The SO2 symmetric and
asymmetric vibrations are observed at 1153 cm-1 and 1302 cm-1 respectively It can be seen
from Figs 513e and f the characteristic stretching vibrations for C=C 1607 cm-1 and 1502
cm-1 band intensities are reduced and shifted in the solid inclusion complexes (1597 cm-1
and 1493 cm-1) due to the encapsulation of phenyl ring into the CD cavity The symmetric
and asymmetric vibrations of SO2 group are shifted to 1157 cm-1 and 1306 cm-1 in the
inclusion complexes However the band at 1246 cm-1 (for CndashN stretching) diminished
considerably Further the amino and amido stretching vibrations of SMRZ disappeared in
the inclusion complexes The similar changes in the corresponding functional group
frequencies of SFP after inclusion complexation with CDs were also observed (Fig 514)
4000
Tra
nsm
ittan
ce
40000 30000 20000 10000 Wavenumber (cm-1)
3244
56
3310
15
1263
49
679
00
504
05
999
22
3418
17
1583
70
947
13
769
67
1890
41
1772
74
1637
71
1504
61 14
525
3 13
676
5 13
232
9
1222
98
1124
60
1076
38
869
97
825
61
642
35
592
05
(a)
3379
59
2928
56
1643
59
1523
42
1504
51
1244
58
827
48
(c)
3383
45
1585
88
1369
59
1263
21
1157
91
1128
29
1078
12
1028
42
947
35
767
18
680
51
613
87
567
56
2929
35
1643
57
1585
45
1523
39
1504
75
1369
21
1263
78
1157
46
1244
41
1128
23
1078
11
1028
27 94
726
827
92
767
83
680
45
613
57
567
42
(b)
165
The bands positioned at 1637 and 1583 cm-1 of SFP shifted to longer frequencies and their
intensities diminished in the inclusion complexes The bands in the region 1124-999 cm-1
completely disappeared in the spectra of SFPCD complexes The CndashS stretching and SO2
stretching frequencies of SFP shifted to 1644 and 1370 cm-1 in the inclusion complexes
respectively and their intensities decreased These IR spectral changes suggest that the
aromatic moiety with SO2ndashNH group of the SMRZ and SFP is probably encapsulated into
the CD cavity and formed stable inclusion complexes in the solid state
574 Differential scanning calorimetry
The DSC thermograms of pure drugs and the solid inclusion complexes are
presented in Fig 515 The thermal curve of SDMO was typical of a crystalline anhydrous
substance with a sharp endotherm at 2034 degC indicating the melting point of the drug On
contrary the complete disappearance of SDMO characteristic endotherm in the solid
inclusion systems is an indicative of a strong interaction between the drug and CD
However the endotherms of α-CD and β-CD shifted to 584 995 1042 degC and 1012 degC
respectively along with significant decrease in the intensity was observed This finding
probably indicates the formation of true inclusion complex of CD with the guest in solid
dispersion andor inclusion complexes with different properties The thermal features of CD
shifted to lower temperature in the complex may be due to the reorientation of CD by the
insertion of the drug molecules
The thermal curve of SMRZ (Fig 515d) was typical of a crystalline anhydrous
substance with a sharp fusion endotherm at 2368 ordmC corresponding to the melting point of
the drug A comparison of the DSC curves of pure CDs with those of encapsulated solid
samples (in 11 mole ratio) clearly showed that the displacement of the endothermic peaks
are due to loss of water into the lower temperature However the complete disappearance of
the characteristic endothermic peak of SMRZ in the DSC curves of inclusion complexes
(Figs 515e and f) indicate a strong interaction of the drug with CD nanocavities and the
stable encapsulated complexes are formed between SMRZ and CDs Similar phenomena
were also obtained for the thermal properties of SFPCD complexes (Figs 515h and i) The
overall DSC results suggest that complexation of the sulfonamides with both CDs was
achieved in the solid state by coprecipitation method
575 X-ray diffraction analysis
Powder XRD has been used to assess the degree of crystallinity of the given samples
When the inclusion complexes of drug and CDs are formed the overall numbers of
166
crystalline structure have reduced and more number of amorphous structures have increased
So the solid complexes show less number as well as less intensity of peaks This shows that
overall crystallinity of complexes decreased and due to amorphous halo nature the solubility
increased The XRD patterns of pure SDMO SMRZ and SFP exhibited several sharp and
intense peaks indicating the crystalline nature of the drugs (Fig 516) SDMO exhibits
characteristic peaks at 2θ values of 1028deg 1210deg 1410deg 1902deg 2093deg 2202deg 2494deg
2813deg 3177deg 3295deg 3514deg and 3923deg Most of the characteristic peaks of SDMO were
present in the diffraction patterns of physical mixtures of the drug with CDs without loss of
intensity In contrast the XRD patterns of the SDMOα-CD and SDMOβ-CD complexes
differed considerably from those of the drug and CD alone with a completely diffuse
diffraction pattern which reveals the amorphous nature of the samples The intensity of
peaks at 2θ = 1028deg 1410deg 1902deg 2093deg and 2494deg of SDMO reduced significantly in
SDMOCD inclusion complex diffraction patterns which suggests reduction in crystallinity
of SDMO Some low intensity peaks of SDMO at 2θ = 3295deg 3514deg 3923deg were absent
after complexation with CDs This different pattern might be due to inclusion of SDMO
molecule into the cavity of CD Further appearance of new peaks at 2θ values for the
patterns of SDMOα-CD (1219deg and 1319deg) and SDMOβ-CD (1529deg 2485deg and 2822deg)
inclusion complex indicates the change in SDMO and CD environment after inclusion
complexation
In the XRD pattern of SMRZ (Fig 516d) the intense peaks at 2θ values of 1228deg
1456deg 1702deg 2421deg 3086deg and 3245deg indicate the higher degree of crystallinity of drug
The diffractogram of the SMRZα-CD and SMRZβ-CD complexes (Figs 516e and f)
differed from that of the corresponding SMRZ drug where the characteristic peaks of
SMRZ particularly the major intense diffraction peaks at 2θ = 1228deg 1702deg and 3245deg are
dramatically affected in the inclusion complexes indicating the formation of inclusion
complexes In addition it can be observed the disappearance of characteristic peaks of
SMRZ in the encapsulated complexes suggesting that the crystallinity of the drug further
reduced to a greater degree These phenomena are an indication of the existence of
molecular interactions between the drug and CDs resulting in an amorphous state
Similarly the diffraction pattern of the SFPCD complexes (Figs 516h and i) was more
diffused as compared to pure components (SFP and CD) These observations were indicative
of the transformation of SFP from crystalline to amorphous state which might be because of
inclusion of SFP into CD nanocavities
167
Fig 515 DSC thermograms of (a) SDMO (b) SDMOα-CD complex (c) SDMOβ-CD complex (d) SMRZ (e) SMRZα-CD complex (f) SMRZβ-CD complex (g) SFP (h) SFPα-CD complex and (i) SFPβ-CD complex (25-260 oC at 10 oCmin)
Exo
ther
mic
(mW
mg)
40 60 80 100 120 140 160 180 200
1922 degC
672 degC 1064 degC 1232 degC
1143 degC
(g)
(h)
(i)
Temperature (oC)
Exo
ther
mic
(mW
mg)
40 60 80 100 120 140 160 180 200 220
(a)
(b)
(c)
2034 degC
1042 degC 995 degC 584 degC
1012 degC
Exo
ther
mic
(mW
mg)
40
(d)
(e)
(f)
2368 degC
60 80 100 120 140 160 180 200 220 240 260
1182 degC
1238 degC 1064 degC
663 degC
168
Fig 516
169
576 1H NMR analysis
Further to gain more information about the structure of the inclusion complexes
between sulfonamides and CDs 1H NMR spectra for the free drugs and the inclusion
complexes were recorded [152] Figs 517-519 illustrated the chemical shift change of
hydrogen atoms of SDMO SMRZ SFP and their inclusion complexes and the assignations of
protons of the drugs are shown as inset The values of chemical shift (δ) and changes of
chemical shift (Δδ) values are listed in Table 57 The chemical shift of CDs protons reported
by different authors are very close to the values reported in this work When the guest
molecule was inserted into the CD cavity the NMR chemical signals of the guests shifted to
downfield and the CD protons shifted to upfield The H-3 and H-5 protons are located in the
interior of the CDs cavity and it is therefore likely to interact with the protons of drug It can
be seen from Fig 517 and Table 57 that Ha Hc and Hd protons of SDMO showed larger
chemical shifts because of the diminished freedom of rotation caused by the insertion of
SDMO molecule into the CDs cavities This reveals that a part of aniline moiety and
pyrimidine moiety has entered into the CDs cavity However the He proton exhibited
comparably less chemical shift changes in the inclusion complexes The NMR signals of CD
protons placed inside the cavity (H-3 and H-5) are hardly affected by the benzene protons of
the guest suggesting that the SDMO molecule entered through the wider side of the CD cavity
As can be seen from Fig 518 the chemical shift data for the SMRZCD inclusion
complexes were different from those of pure SMRZ drug In particular the resonance of the
aromatic protons (Hb Hc) of SMRZ showed remarkably upfield shift (α-CD asymp -014 -017
ppm and β-CD asymp -015 -019 ppm) in the SMRZCD complexes which suggest that the
resonance of Hb and Hc protons are shielded considerably in the complex and thus the
aromatic part should enter deeply into the cavity However a major shift was observed for
the amino protons of SMRZ (Ha and Hd) in the inclusion complexes which clearly
indicated that the guest molecule has been encapsulated within the CDs cavities Further the
inclusion complexation with SMRZ had significant changes (upfield shift) in the resonance
of H-3 and H-5 protons of CD It is noteworthy that after guest inclusion the H-3 protons
shifted to 003-006 ppm while H-5 protons shifted to 001-003 ppm Both H-3 and H-5
protons are located in the inner part of the CD and H-3 protons are nearer to the wider rim
side of the cavity whereas H-5 protons are nearer to the narrow rim side
The signal assignment for individual proton chemical shift of SFP is shown as inset
in Fig 519 The δ value of Ha is due to the amino group (ndashNH) protons of SFP drug which
170
Fig 517 1H NMR spectra of (a) SDMO (b) SDMOα-CD complex and (c) SDMO β-CD complex Inset Fig Assignation of protons of SDMO
(c)
(b)
(a) a
H3CO NH2 a
S O O
N
H N
N
H3CO b
b c
c
d
e
f
g
b c d e
f g
171
Fig 518 1H NMR spectra of (a) SMRZ (b) SMRZα-CD complex and (c) SMRZβ-CD complex Inset Fig Assignation of protons of SMRZ
a b
c
e
f d
(c)
(b)
(a)
g
H3C NH2
H
O O
N S
N
N a b
b c
c
d
e
f
g
172
Fig 519 1H NMR spectra of (a) SFP (b) SFPα-CD complex and (c) SFPβ-CD complex Inset Fig Assignation of protons of SFP
a b c
d
e f
g j
(c)
(b)
(a)
NH2 H
O O
N S
N a b
g
j
c e
f d
d g
173
Table 57
174
shifts to -0046 ppm up field in α-CD complex and -0053 ppm in β-CD complex
(Table 57) The aromatic protons of the SFP molecule (Hd and Hg) shifted to up field as
compared with the corresponding values those for free drug These results indicate that these
above aromatic protons interact with CD cavity protons Further considering the higher
chemical shift of the Ha proton when compared to other protons suggests that the Ha proton
of the SFP molecule considerably has more interactions with the CDs
58 Conclusion
The effects of α-CD and β-CD on the absorption and fluorescence spectra of three
sulfa drugs were investigated Both experimental and theoretical studies have demonstrated
that both CDs form 11 inclusion complexes with sulfonamides In aqueous medium SDMO
SMRZ and SFP showed dual emission one is due to locally excited (LE) and another is due
to TICT Solvent studies revealed that the position of the substituent (dimethoxymethyl
pyrimidine or pyridine group) in the sulfonamide molecule (RminusSO2minusNHminus) is the key factor
to change the absorption and emission behaviour of these molecules The red shift and the
presence of TICT in the CD medium confirmed that the heterocyclic (pyrimidine or
pyridine) ring is encapsulated in the CD cavity and the aniline ring is present outside of the
CD cavity SEM FTIR DSC XRD and 1H NMR results also indicated the formation of
inclusion complexes in the solid state TEM examinations revealed that the nano-sized
particles could be produced from the molecular encapsulation of drugs within the CDs
cavities The various complexation reactions of SDMO SMRZ and SFP with α-CD and β-
CD were studied by semiempirical quantum mechanical calculations (PM3 method) The
optimized host-guest inclusion complex structures proved SDMO SMRZ and SFP
molecules are partially embedded into the CD nanocavities The statistical thermodynamic
calculations advocated that the formations of these inclusion complexes were enthalpy-
driven process The overall theoretical results suggested that hydrogen bonding and
hydrophobic effect play an important role in the complexation process
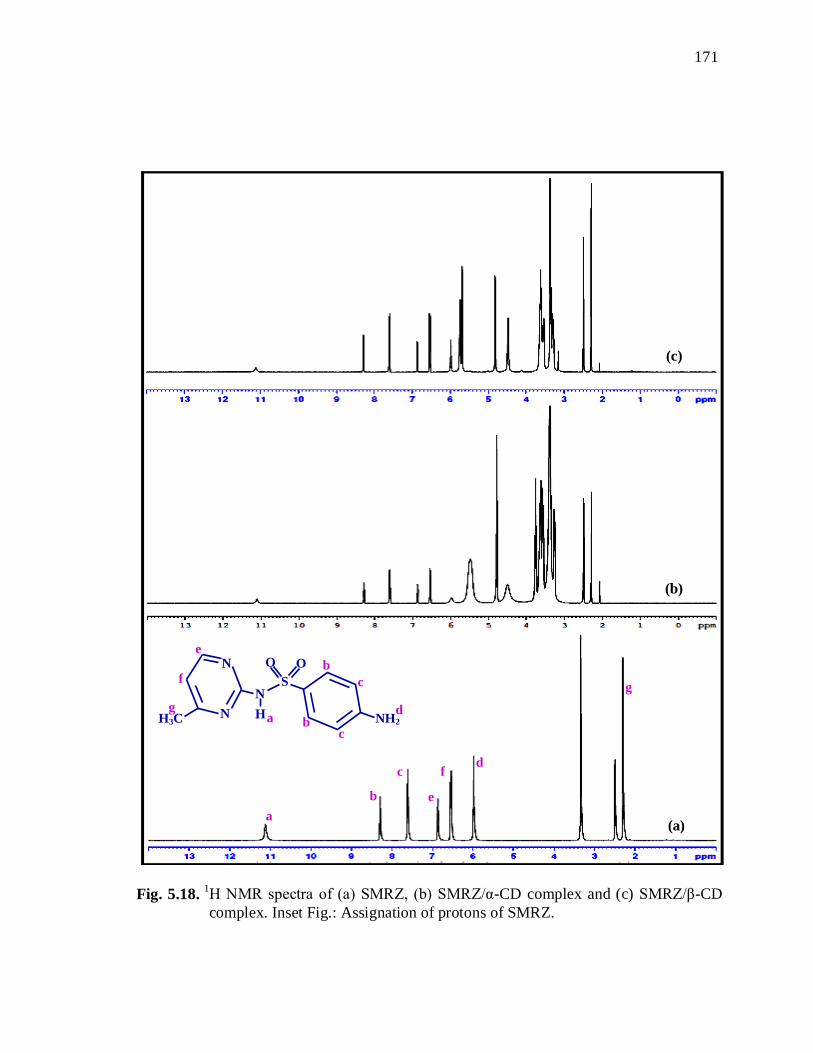