chapter 5 - business and enterprise
TRANSCRIPT

Consultation Draft
Chapter 5 – Business and Enterprise
1
Chapter 5 Business and Enterprise Business Start Up 5.1 One of the headline data that is often cited to highlight business
performance in Derby is the business start up rate. Statistics show that Derby continues to lag behind other areas in terms of business birth rates. In 2007 there were 48 business births per 10,000 population, compared to a regional average of 53. In 2008 this figure had dropped to 41, albeit against a background of national recession and drop in the regional average to 47. However, there is more positive evidence for Derby with latest ONS data showing that the overall number of active enterprises in Derby continues to rise and that longer term business survival has been a strength of Derby’s economy.
Business Demography 5.2 In December 2009 the ONS published its latest statistics on business
demography1. The following paragraphs outline what these statistics show for Derby. It should be noted that this data is based on VAT registrations and can therefore fail to pick up on the rates of sole traders and others who fall below the VAT threshold. This is explored later in the chapter.
Births of new enterprises 5.3 According to ONS a total of 780 enterprises were born in Derby during
2008. The majority of these were small businesses of up to 4 employees.
Table 5.1 Births of Enterprises by Employment Size, 2008
Total 0-4 5-9 10-19 20+
Count Count % Count % Count % Count %
Derby 780 700 89.7 55 7.1 15 1.9 10 1.3
E.Mids 16900 15265 90.3 1075 6.4 405 2.4 155 0.9
England 238895 217365 91.0 14040 5.9 5210 2.2 2280 1.0
Source: Business Demography 2008, ONS
Deaths of enterprises 5.4 A total of 705 businesses ceased trading in Derby during 2008 and
84% of the closures were in the 0-4 employment size band. Of the 9 upper tier authorities in the East Midlands, Derby had the second
1 ‘Enterprise Births, Deaths and Survivals – 2008’, ONS

Consultation Draft
Chapter 5 – Business and Enterprise
2
lowest number of closures in 2008. However the proportion of closures in the 5-9 and 20+ size bands was greater in Derby than the region.
Table 5.2 Deaths of Enterprises by Employment Size, 2008
Total 0-4 5-9 10-19 20+
Count Count % Count % Count % Count %
Derby 705 595 84.4 75 10.6 20 2.8 15 2.1
E.Mids 14760 13010 88.1 1150 7.8 420 2.9 180 1.2
England 192955 171915 89.1 13795 7.2 5205 2.7 2040 1.1
Table 5.3 Births and Deaths of Enterprises, percentage of 2008
stock
Stock Births Deaths Net
change
Count Count % Count % %
Derby 6925 780 11.3 705 -10.2 1.1 E.Mids 158365 16900 10.7 14760 -9.3 1.4 England 2024990 238895 11.8 192955 -9.5 2.3
Note: Net change in stock = (Births - Deaths) / Stock of Enterprises Source: Business Demography 2008, ONS
Active Enterprises 5.5 An active enterprise is defined as a business that had either turnover or
employment at any time during the reference period. 5.6 In 2008 Derby had a total of 6,925 active enterprises. 75% of these
were small businesses of up to 4 employees. Table 5.4 highlights the breakdown of active enterprises by employment size.
Table 5.4 Active Enterprises 2008:
Derby Employment Size Band 0-4 5-9 10-19 20+ Total Number 5,200 875 415 435 6,925 Proportion 75% 13% 6% 6% 100%
Source: ONS Business Demography, 2009
5.7 Derby has seen a consistent increase in the total number of active
enterprises between 2004 and 2008, in line with regional and national trends, as shown in Table 5.5.
Table 5.5 Active Enterprises 2004 – 2008:
2004 2005 2006 2007 2008 Derby 5,990 6,385 6,525 6,875 6,925 Leicester 9,590 9,540 9,400 9,600 9,715
Nottingham 7,650 7,885 8,035 8,230 8,245 East Midlands
147,345 149,980 151,960 156,650 158,365
UK 2,158,555 2,182,750 2,207,290 2,280,215 2,325,770 Source: ONS Business Demography, 2009

Consultation Draft
Chapter 5 – Business and Enterprise
3
Survival of Newly Born Enterprises 5.8 Business survival can be seen as a key indicator of the strength of a
local economy. Table 5.6 indicates the percentage survival rate of businesses in Derby relative to the year in which they began trading:
Table 5.6 Business Survival Rates
Business Survival in Derby Birth year of units
Year 1 Year 2 Year 3 Year 4 Year 5
2003 92.5% 78.9% 66.5% 57.1% 49.7% 2004 93.5% 78.1% 66.9% 56.2% -
2005 91.5% 78.2% 63.5% - - 2006 96% 80.3% - - - 2007 95.1% - - - -
Source: ONS Business Demography, 2009
Figure 5.1 3 year Survival Rate, Regional Comparison
Survival of enterprises born in 2003, 2004 and 2005
66.5 64.6 63.5
0.0
66.9 66.8 65.2
0.0
63.5 65.4 64.6
0.00
20
40
60
80
Derby East Midlands England
Source: Business Demography 2008, ONS
Percentage year of birth 2003 year of birth 2004 year of birth 2005
Source: ONS Business Demography, 2009
5.9 In every year of birth the number of Derby businesses surviving for
their first year is slightly lower than regional and national averages. However, the percentage of Derby businesses born in 2003 and surviving 3, 4 and 5 years is higher than both regional and national averages. The same applies to those born in 2004 and surviving for 3 and 4 years, suggesting that Derby has retained higher proportions of its business stock over time compared to the average. Derby was successful in attracting significant investment through developments such as the Westfield Shopping Centre and QUAD Arts Centre during 2007 and 2008. This clearly had an influence in retaining businesses in the city as Derby’s potential was being realised.

Consultation Draft
Chapter 5 – Business and Enterprise
4
Business Units 5.10 The employment structure chapter provides information on the shape
of the local economy. It is also important to consider the size and change in business stock that underpins the economy.
5.11 Of the VAT and/or PAYE based enterprises in Derby, 62% of local
units were for those employing up to 4 people. Just 13% of the total units were for businesses employing over 20 people. Derby has a smaller proportion of local units within the 0-4 employee size band than the regional and national average. However, in all other employment size bands Derby has a higher than average number of units.
Table 5.7 Local units in VAT/PAYE based enterprises, 2009
Total 0 - 4 5 - 9 10 - 19 20 - 49 50 - 99 100+
Count % % % % % %
Derby 7865 61.5 15.9 9.9 8.3 2.5 2.0
East Midlands
180215 67.3 14.9 8.5 5.8 1.9 1.5
England 2237555 68.6 14.6 8.1 5.4 1.9 1.5
Source: UK Business: Activity, Size and Location, ONS, 2009
Figure 5.2 Proportion of units by employment size band, 2009
Source: UK Business: Activity, Size and Location, ONS
5.12 Figure 5.3 shows that the sector with the highest proportion of units in
Derby is Retail with 13.7% of the overall units. Professional, Scientific and Technical is the second highest (12.7%) and Construction is third highest (11.6%). This is broadly in line with national trends.
Proportion of local units by employment size bands, 2009
0
10
20
30
40
50
60
70
80
0 - 4 5 - 9 10 - 19 20 - 49 50 - 99 100+
Source: UK Business: Activity, Size and Location, ONS
Percentage
Derby East Midlands England

Consultation Draft
Chapter 5 – Business and Enterprise
5
Figure 5.3 Proportion of local units in Derby by industry, 2009
Proportion of local units by industry, 2009
0.36.8
11.6
4.1
4.5
13.7
2.9
6.85.5
2.7
3.8
12.3
7.5
0.8
3.3
7.0
6.4
Agriculture, forestry & fishing
Production
Construction
Motor trades
Wholesale
Retail
Transport & storage (inc. postal)
Accommodation & food services
Information & communication
Finance & insurance
Property
Professional, scientific & technical
Business administration and support services
Public administration and defence
Education
Health
Arts, entertainment, recreation and other
services
Source: UK Business: Activity, Size and Location, 2009, ONS
NI 171 Business Registration rate 5.13 The business registration rate is calculated by taking the number of
VAT and/or PAYE businesses that have registered for the first time and dividing this by the local population (per 10,000 aged 16+). This indicator has been part of Derby’s Local Area Agreement.
5.14 Business registration rates for Derby have consistently fallen below the
regional and national levels between 2002 and 2008 (Table 5.8). The latest data from 2008 shows this gap to be increasing. Local business start up data, explored later in this chapter, suggests there is a healthy rate of new business starts but clearly the city does not perform well when registrations are correlated to its population.
Table 5.8 Business registration Rates (2002 – 2008) – NI 171
2002 2003 2004 2005 2006 2007 2008 Derby 38.0 43.4 45.2 56.1 45.6 47.8 40.5 East Midlands 48.4 52.5 54.3 54.6 50.0 51.9 46.7 England 54.0 59 61.6 59.2 54.8 59.5 57.2
Source: DBERR via BIS website, February 2010

Consultation Draft
Chapter 5 – Business and Enterprise
6
NI 172 Small Businesses Showing Employment Growth 5.15 In order to assess the strength of the small business sector, NI 172
identifies the proportion of small VAT and/or PAYE registered businesses (<50 employees) showing year-on-year employment growth.
5.16 Figure 5.4 suggests that Derby performed similarly to national levels in
2007/08. Since 2002, Derby has performed well against the regional and national averages and remains on a par with both during 2007/08.
Figure 5.4 Proportion of Small Businesses Showing Employment
Growth
0
2
4
6
8
10
12
14
16
2002-03 2003-04 2004-05 2005-06 2006-07 2007-08
Year
pe
rce
nta
ge
Derby
East Midlands
England
Source: DBERR via BIS website, February 2010
5.17 The Demand for Skills in Derby and Derbyshire 2009-2023 research,
published on behalf of Derby City Partnership in April 2009, included an analysis of the priority sectors2 within Derby and Derbyshire. Table 5.9 highlights the breakdown of businesses by priority sector.
Table 5.9 Breakdown of Priority Business Sectors in Derby Priority Business
Sector Number of Businesses Percentage of total
Retail 1,114 32% Manufacturing 554 16% Hospitality 522 15% Health and Social Care 499 14%
2 Priority sectors as defined by the Demand for Skills research

Consultation Draft
Chapter 5 – Business and Enterprise
7
Creative Industries 233 8% Tourism related 169 5% Logistics 125 4% Public Sector 99 3%
Airport Activities 84 2% Source: Derby Skills Research, 2009
5.18 This breakdown provides an interesting analysis of Derby’s business
structure. It is perhaps not surprising that retail businesses form the majority as this is the primary focus of the city centre and district centres and many will only have a few staff members. Manufacturing has a relatively high percentage of the overall stock. The large well established companies such as Rolls-Royce and Bombardier will be included here but the figure of 554 reflects the extent of smaller companies who make up the supply chain.
Banksearch Business Start Up Data 5.19 The Banksearch business start-up data is based on detailed individual
account-level transactions data for new business starts, which is sourced directly from the banks.
5.20 National data sources have been used earlier in this chapter to allow
comparisons with other cities and with regional and national averages. Banksearch data allows analysis of the business make up within the city boundary in greater depth and with more variables.
5.21 The data suggests that by far the most new business starts are
consistently located within Arboretum, the city centre ward. Other wards that have seen high numbers of business starts between August 2009 and August 2010 are Darley, Alvaston, Littleover, Chellaston, Normanton and Abbey, all of which are shown to have over 100 business start ups.

Consultation Draft
Chapter 5 – Business and Enterprise
8
Figure 5.5 New Business Starts Aug 2009 – Aug 2010, by Ward
Source: BankSearch Information Consultancy Limited, Sept 2010
5.22 The high number of business starts within predominantly residential areas such as Chellaston and Littleover could suggest a significant number of sole traders setting up businesses from home.
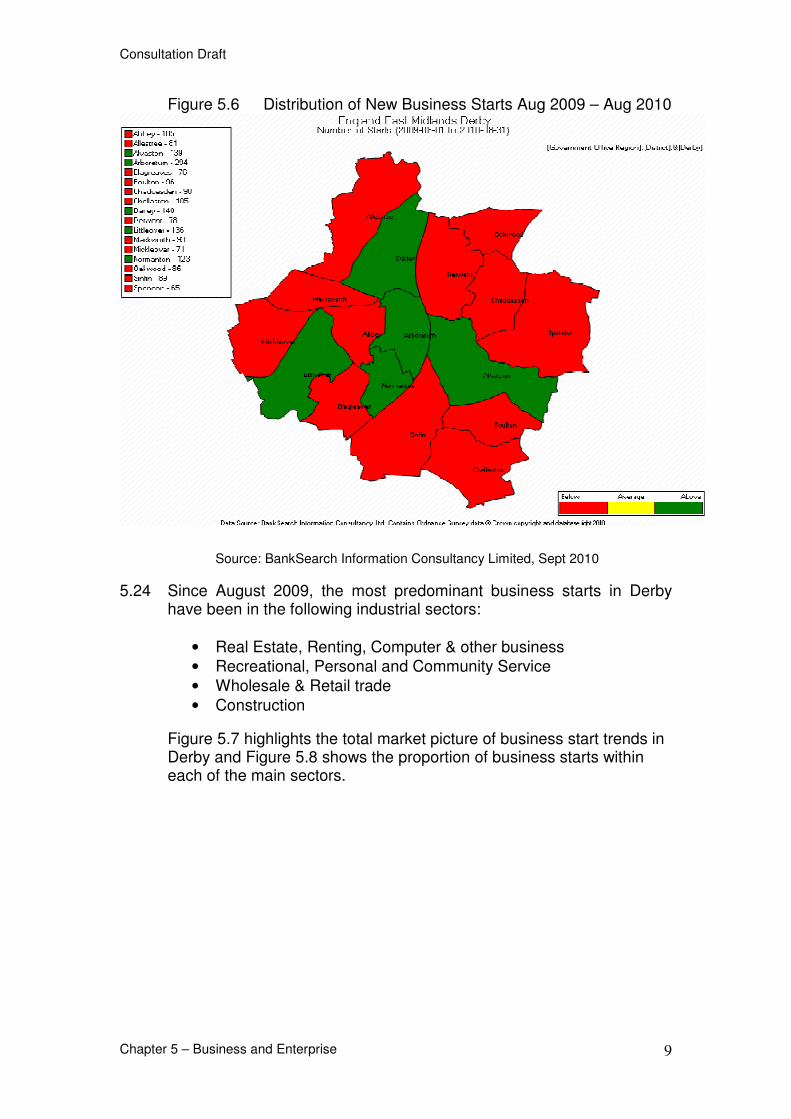
5.23 It is interesting to note the geographical distribution of new business
starts over the past two years. Figure 5.6 highlights the areas of the city where above average levels of business starts were located between August 2009 and August 2010. This clearly shows that above average numbers of business starts were formed in wards in and around the city centre and within wards where there are key arterial roads in to the city, i.e. the A6 through Darley, Uttoxeter New Road through Littleover, and London Road through Alvaston. This pattern broadly replicates the employment areas (proposed and existing) that are allocated in the Local Plan, i.e. following the river corridor, and aligns with local planning policy which aims to steer employment uses into existing and proposed employment areas.
Consultation Draft
Chapter 5 – Business and Enterprise
9
Figure 5.6 Distribution of New Business Starts Aug 2009 – Aug 2010
Source: BankSearch Information Consultancy Limited, Sept 2010
5.24 Since August 2009, the most predominant business starts in Derby have been in the following industrial sectors:
• Real Estate, Renting, Computer & other business
• Recreational, Personal and Community Service
• Wholesale & Retail trade
• Construction
Figure 5.7 highlights the total market picture of business start trends in Derby and Figure 5.8 shows the proportion of business starts within each of the main sectors.

Consultation Draft
Chapter 5 – Business and Enterprise
10
Figure 5.7 Business Starts in Derby, by Broad Industrial Sector, Aug 2009 – Aug 2010
Source: Bank Search, Sept 2010

Consultation Draft
Chapter 5 – Business and Enterprise
11
Figure 5.8 Business Starts in Derby, by Broad Industrial Sector, by Percentage, Aug 2009 – Aug 2010
Source: Bank Search, Sept 2010

Consultation Draft
Chapter 5 – Business and Enterprise
12
High Technology City 5.25 Derby has always been a high technology city. The Silk Mill in the city
centre is the site of the first factory in the world, placing Derby at the hub of the textile industry during the 18th and 19th Centuries. Derby remained at the forefront of technological development throughout the industrial revolution by capitalising on its expertise in the rail industry. During the 20th Century the city expanded this expertise into the aerospace industry with the rise of Rolls-Royce. Today, the city is the UK’s number one hi-tech city by employment, with 9% of the city’s jobs in advanced manufacturing, compared to 1.2% nationally3. This is influenced heavily by the presence of Rolls Royce who employ over 11,000 people in Derby.
Table 5.10 Major Employers in Derby
Company Employees (approx)
Rolls Royce 11,000
Derby City Council 11,000
Derby NHS Trust 7,000
Bombardier 3,000
University of Derby 2,600
East Midlands Trains 2100
ASDA 1,320
Egg (Citi Bank) 1,100
Severn Trent 750
S&A Foods Ltd 650
Derbyshire Building Society/Nationwide 650
Derby Evening Telegraph 380
Deltarail holdings Ltd 290
Draka UK Ltd 285
Pennine Healthcare limited 280
Interfleet Technology 279
Eurocom Developments Ltd 275
Arriva Midlands 250
Source: Marketing Derby and Derby City Council Note: Some companies with high number of employees are not
included. East Midlands Trains, whose head office is in Derby, employs approx 2,100 across the East Midlands.
3 Shifting Gears, Centre for Cities, October 2010.

Consultation Draft
Chapter 5 – Business and Enterprise
13
Productivity Output (GVA) in Derby 5.26 Gross Value Added (GVA) is the principal measure of the total value of
goods and services that a geographical area produces. GVA, and particularly GVA growth, is an important indicator of the overall health of the economy. It is calculated by summing the incomes generated in the production process. GVA’s relationship with Gross Domestic Product (GDP) – the measure for a county’s net income – is defined as:
GVA + taxes on products – subsidies on products = GDP
5.27 Since aggregates of taxes and subsidies are available only at national
level, GVA is used as the measure of output at a local level. 5.28 In 2007 Derby produced £5.5billion worth of output to the national
economy. Total GVA has increased in Derby during the past decade in line with national trends.
Figure 5.9 Derby Headline GVA (£million)
Source: ONS, 2009
5.29 GVA per head is the most frequently used measure of productivity at the sub-regional level. It measures the value of goods/services that a local area produces as a proportion of the number of residents who live there. In 2007, the headline GVA per head in Derby was £23,167. Figure 5.10 shows that GVA per head figures have increased steadily since 1999 and that Derby outperforms the regional and national averages.
-
1,000
2,000
3,000
4,000
5,000
6,000
1999 2000 2001 2002 2003 2004 2005 2006 2007 Year
GVA (£'000)
Derby Headline GVA figures (£'000s)

Consultation Draft
Chapter 5 – Business and Enterprise
14
Figure 5.10 Derby Headline GVA Per Head
-
5,000
10,000
15,000
20,000
25,000
1999 2000 2001 2002 2003 2004 2005 2006 2007
Year
GV
A P
er
Head
(£)
Derby
East Midlands
UK
Source: ONS, 2009
5.30 The majority of output in Derby continues to be from ‘production’ industries, which has remained relatively stable during the past decade. This aligns with the business make up described earlier in this chapter and the employment profile detailed in chapter 3, both of which highlight the continued presence of large manufacturing and engineering companies in the city such as Rolls-Royce and Bombardier. Figure 5.11 shows that Business Service and Finance and Other Service industries have continued to increase in terms of output over the same period.
Figure 5.11 Derby GVA by Industry
0
200
400
600
800
1000
1200
1400
1600
1800
2000
1999 2000 2001 2002 2003 2004 2005 2006 2007
Year
GV
A b
y B
road
In
du
str
y (
£m
illi
on
) Agriculture, forestry and fishing
Production
Construction
Distribution, transport and
communication
Business services and finance
Other services
Source: ONS, 2009

Consultation Draft
Chapter 5 – Business and Enterprise
15
GVA Growth Rate Trends 5.31 Growth rates for Derby have been less stable than regional and UK
averages. This is often the case with smaller economic areas where any change in output experienced by a business sector is more likely to register in aggregate GVA. The reduced rate of GVA growth in Derby during 2002 – 2005 correlates with a reduction in the year on year output in the ‘production’ sector.
Figure 5.12 GVA Growth Rates (year on year) 2000 - 2007
0.00
1.00
2.00
3.00
4.00
5.00
6.00
7.00
2000 2001 2002 2003 2004 2005 2006 2007
Year
GV
A G
row
th R
ate
(%
)
Derby
East Midlands
UK
Source: ONS, 2009
GVA Growth, Recession and Forecasts 5.32 The economic situation is very different today that in 2007. A lack of
liquidity and credit in the financial markets, coupled with a related global slump in demand has had an impact on all industry sectors. This has led to falls in UK output during 2008 and 2009. Given past trends and reports from local businesses, it is likely that Derby figures (when available) will show similar reductions.
5.33 Looking ahead, figure 5.13 shows Experian’s output (GVA) growth
forecasts4 from 2006 to 2026 for the sectors predicted to grow most in this period in Derby. The general trend shown by the model as a whole is for the regional and UK economy to contract during 2009 and for
4 Experian’s output and employment forecasts are based on its Integrated Regional Sectoral
Model (IRSM) of the UK. In this model each sector of the economy is treated as an economic entity in its own right. The forecasts take into account historical relationships between a range of national and non-local variables, but also rely heavily on local sector structure and labour markets.

Consultation Draft
Chapter 5 – Business and Enterprise
16
Derby, the region and the UK to expected to recover steadily from 2010. The model provides a forecast for 30 different industry sectors. Most sectors in Derby are forecasted to grow steadily but the graph indicates that Business Services and Health sectors are expected to see the largest growth towards 2026.
Figure 5.13 Forecast Growth by Industry, 2006 - 2026
Derby Baseline Output (£m)
0.000
200.000
400.000
600.000
800.000
1000.000
1200.000
2006
2008
2010
2012
2014
2016
2018
2020
2022
2024
2026
Year
Outp
ut
(£m
)
Transport Equipment Retailing Wholesaling
Banking & Insurance Business Services Health
Source: Experian Output Growth Forecast, 2009

Consultation Draft
Chapter 5 – Business and Enterprise
17
Property Demand 5.34 During 2009, the majority of property enquiries5 were for industrial and
office premises. Figure 5.14 shows a breakdown of property demand via the Invest in Derby team during 2009.
Figure 5.14 Property and Land Demand in Derby, 2009
Derby Property Demand in 2009
0
5
10
15
20
25
30
35
40
Industr
ial
Investm
ent
Pro
pert
y/B
usin
ess
for
Sale
Land/S
ites
Leis
ure
/Hote
l
Off
ice
Reta
il
Serv
iced
Off
ice/M
anaged
Work
space
Ware
house
Num
ber
Source: Tractivity. Note: counts do not equate to total enquiries due to overlapping requirements e.g. Industrial and warehouse
Local Business Surveys 5.35 On top of the wide range of national datasets presented in this chapter
there are also a number of local business surveys which can illustrate a more timely and qualitative view of business conditions in Derby and the wider sub-region. These are particularly useful in understanding the effect of the economic downturn on local employers and provide some insight into the differences by industrial sector.
5.36 Presented below is a summary of the key findings from two local
surveys namely the Derbyshire & Nottinghamshire Chamber of Commerce Quarterly Economic Survey (June 2010) and the Derby Evening Telegraph Business Survey (July 2010). The former survey presents findings from 331 businesses across Nottinghamshire (167) and Derbyshire (164). Although this doesn’t provide analysis below the sub-regional level it is useful for providing evidence on the latest business performance, future confidence and expectations, and business support priorities. Whereas, the Derby Evening Telegraph survey presents qualitative analysis of around 100 local businesses across 6 sectors.
5 Via the Invest in Derby Team

Consultation Draft
Chapter 5 – Business and Enterprise
18
5.37 Alongside this we have reviewed the latest Federation of Small
Businesses Survey (June 2010). This is a national survey presenting findings from 1,216 employers. Although the findings are presented at national level it is useful as a comparison to the two local surveys and to test whether the trends found locally are the same as the rest of the country.
5.38 In general, businesses in Derby have performed well for the first half of
2010 and experienced fewer difficulties as compared to 2009. 5.39 The rail sector in Derby in particular has been making great strides in
the first half of this year:
“rail work has grown over the last six months…”
"A pleasant surprise was that there is to be a new rail freight terminal in Castle Donington which is good news for local rail
firms…”
“Rail franchise operator East Midlands Trains has had a busy six months…”
5.40 This is, however, not unique to Derby and this early promise has been
seen in Derbyshire and in small businesses across the country. Compared with the first quarter of 2010 Derbyshire businesses have seen improvements in recruitment, employment levels and export sales. Interestingly Derbyshire businesses have reported stronger performance compared to Nottinghamshire. For example, 22% of Derbyshire businesses are planning to increase their workforce and only 3% looking to reduce labour compared with 11% of Nottinghamshire employers looking to shed labour. The main reason for this is that manufacturing has demonstrated the bulk of the improvements, of which a significant share is found in Derbyshire.
5.41 One of the key reasons reported for the improved performance in
Derby is that businesses have been diversifying their services and in turn their client base.
“for the first time ever, we’re attending an aerospace composites
show in September to engage with a brand new sector…”
“new markets and new products have helped to stimulate our business…”
“we’re trying to get out there and build our market share in different
areas…” 5.42 Despite this positive news in relation to recent performance there is an
indication that the recent election and consequent funding cuts is

Consultation Draft
Chapter 5 – Business and Enterprise
19
beginning to impact on employers and that the confidence portrayed for the next 12 months is low. A majority share of Derbyshire businesses suggest that their turnover will decrease in the next quarter, for example. Alongside this a number of businesses suggest that the VAT increase that has been set for January will create difficulties, especially in retail, as prices will inevitably increase and many people will not enjoy proportionate increases in disposable income. However, when asked about this specifically in the Chamber of Commerce survey, 39% of businesses (across Derbyshire and Nottinghamshire) suggested that a VAT increase is preferable to other business taxes being raised.
“The election has had a negative impact this year with nervousness
about public sector budgets…”
“the challenges we have experienced have not been helped by the uncertainty pending the outcome of the General Election…”
5.43 Confidence within the construction sector appears to be even lower
with two commentators suggesting that:
“the recession in the construction industry won’t be over for a couple of years so we’ll be keeping a tight ship and being more
efficient…”
“the real issue facing us is that clients are struggling to get funding…”
5.44 This low confidence is leading employers to continually and closely
monitor their spending much more than they did before the economic downturn.
“sales are down but profit has risen as we continue to put in place
plans to make savings…”
“Businesses generally are still looking to keep costs down…” Evidence of Skills Gaps 5.45 Despite the fact that businesses have been recruiting less and
unemployment has been on the increase and as such, more people are looking for work, employers are still struggling to fill some vacant posts due to skills gaps.
5.46 In the manufacturing sector, which is key to the success of the local
economy, employers are struggling to recruit skilled manual and technical workers. One in five reported this as the biggest problem.

Consultation Draft
Chapter 5 – Business and Enterprise
20
Business Support Priorities 5.47 Businesses in Derbyshire reported their priorities in business support
as; Business Link advisory services (43%), maintaining local authority business support (37%) and maintaining investment for new infrastructure (33%).
5.48 Rather alarmingly only 56% of businesses (across Derbyshire and
Nottinghamshire) have checked their eligibility for business rates relief. Of those that hadn’t, there was a lack of awareness that they could claim; there were concerns about the bureaucracy involved and also that business rates may actually be increased as a result of any claim.
Economic Downturn Report 5.49 In April 2008, against a backdrop of worsening economic conditions
and the restriction of the commercial debt markets, emda began to monitor disinvestments in the region. The data was captured through various sources including company visits, media reports and market intelligence.
5.50 The following looks at disinvestments in Derby in terms of timeframe,
sector and size of redundancy. Disinvestments are defined as actual job losses of 25+ within the area.
5.51 Derby experienced the bulk of job losses during early 2009, as per the
regional peak. The average disinvestment size was slightly above the regional average at 104 job apiece.
Fig 5.15 Job Losses and Disinvestments in Derby City
Job Losses & Disinvestments - Derby City
0
50
100
150
200
250
300
350
400
450
500
Apr-
08
May-0
8
Jun-0
8
Jul-08
Aug-0
8
Sep-0
8
Oct-
08
Nov-0
8
Dec-0
8
Jan-0
9
Feb-0
9
Mar-
09
Apr-
09
May-0
9
Jun-0
9
Jul-09
Aug-0
9
Sep-0
9
Oct-
09
Nov-0
9
Dec-0
9
Jan-1
0
Feb-1
0
Mar-
10
Apr-
10
May-1
0
Jun-1
0
Jul-10
0
0.5
1
1.5
2
2.5
Jobs
Disinvesments
Source: emda, Economic Downturn Report, August 2010
5.52 Despite the small number of disinvestments, a wide range of industries
were affected by the activity – see Fig 5.16. Aerospace was the worst affected in terms of job numbers (378), however, aerospace job losses should be placed in the context of the relatively high employment in the sector within Derby. Publishing and Printing suffered in terms of both jobs lost (315) and the number of disinvestments, although two of the four were by the same company (Bemrose Booth). No automotive

Consultation Draft
Chapter 5 – Business and Enterprise
21
losses were recorded in Derby despite the presence of nearby Toyota. Derby’s other primary sector, rail, did incur one disinvestment. This may have been worse had it not been for Bombardier acquiring several supply chain companies who encountered difficulties.
Fig 5.16 Job Losses and Disinvestments in Derby, by Sector
Job Losses & Disinvestments by Sector - Derby City
0
50
100
150
200
250
300
350
400
Aerospace
Business ServicesChemicals
CommunicationsEngineering
Publishing/printing Rail
Software Computer Services
0
0.5
1
1.5
2
2.5
3
3.5
4
4.5
Job Losses
Disinvesments
Source: emda, Economic Downturn Report, August 2010