chapter 4shodhganga.inflibnet.ac.in/bitstream/10603/1715/11/11_chapter 4.pdf · chapter 4...
TRANSCRIPT

CHAPTER 4
NEUROTRANSMITTERFUNCTIONS
73
Hepatic encephalopathy (HE) following hepatic failure occurs when
overall liver function is grossly subnormal as a consequence of massive and
acute necrosis of liver as seen in cirrhosis of liver, hepatitis and Reye's
syndrome (Adams et al., 1953; Rao et al., 1992). Several neurological and
neuropsychiatric changes have been reported in man and several experi-
mental animal models under these conditions (Hoyumpa and Schenker,
1985). Biochemical basis of cerebral dysfunction in FHF is still under
debate and several mechanisms have been proposed as of today. As was
mentioned earlier, in recent years, attention is being focused on the
involvement of neurotransmitters and their receptors in the aetiology of
cerebral dysfunction in FHF and other hyperammonemic disorders.
Ferenci et al., (1983) reported alterations in neurotransmitter functions
in hyperammonemic states. These investigators reported that the dietary
glutamate is converted to GABA by the gut bacteria and is transported into
portal blood. In the absence of a functional liver, to detoxify the gut derived
GABA (liver has very high activity of GABA-T), it enters systemic circu-
lation. In fact, Ferenci et al., (1983) reported an elevation in the blood
levels of GABA (or GABA like substances) in patients with hepatic
encephalopathy. Further, they predicted that due to a selective disruption of
blood brain barrier (BBB), gut derived GABA enters the brain and
enhances the GABAergic transmission. They have also reported an increase
in the benzodiazipine receptor activity (associated with GABA receptors)
under these conditions. This was in concurrence with the earlier reports
that patients with HE develop an increased sensitivity to benzodiazipine
(Fowler and Schafer, 1981). Subsequently, Baraldi and Zeneroli (1982) and

74
Schafer and Jones (1982) reported an increase in muscimol (GABA ago-
nist) binding and Peterson et al., (1990) reported a decrease in NMDA
binding in animals with portocaval shunts. Rao et al., (1991) reported a
decrease in glutamate binding and an increase in muscimol binding in CB
of rats rendered hyperammonemic by direct injection of ammonium acetate.
Neurotransmitters are substances that are released from nerve termi-
nals upon stimulation. They act on receptor sites and produce either excita-
tion or inhibition of the target cell. Chemically mediated neurotransmission
involves the following processes :
1. Synthesis of the neurotransmitter at the presynaptk terminal2. Storage of the neurotransmitter in the synoptic vesicle.3. Release of the neurotransmitter into the synoptic cleft4. Recognition and binding of the neurotransmitter to their receptors.5. Post synoptic action of neurotransmitter.6. Inactivation and termination of the action of the neurotransmitter by
uptake into the pre- or post-synaptic neurons or into the surround-ing glial cells.
Presently, three aspects of neurotransmitter functions were studied in
GALN induced hepatic failure. They are (1) release of glutamate from
nerve terminals (2) binding of glutamate and GABA to respective receptors
(representing post-synaptic action of these amino acid neurotransmitters)
and (3) uptake of glutamate into terminals (representing inactivation of
glutamate released). At this juncture, it must be reiterated that (i) glutamate
and GABA are the predominant neurotransmitter mediating excitatory and
inhibitory neurotransmission, respectively, in mammalian central nervous
system (Curtis and Watkins, 1960; Curtis and Johnston, 1974), and (ii)
alterations in these neurotransmitter systems have been implicated in
several neurological disorders, such as Alzheimer's disease, Huntington's
75
chorea, epilepsy, Parkinson's disease, amyotropic lateral sclerosis, AfflS
encephalopathy and dementia complex (Gasic and Hollman, 1992; Kamboj
et a!., 1994; Dingledine and McBain, 1994; DeLorey and Olsen, 1994).
Though other neurotransmitters do mediate excitatory or inhibitory neuro-
transmission in brain, their contribution is quite low when compared to
glutamate and GAB A (Ito, 1984). Therefore, it was felt appropriate to study
the region specific alteration, if any, in neurotransmitter functions of gluta-
mate and GABA in cerebral cortex (CC), cerebellum (CB) and brainstem
(BS) of GALN treated rats.
RELEASE OF GLUTAMATE
Preliminary standardization on the release of glutamate was carried out
with synaptosomes isolated from the cerebral cortex of normal animals.
Prior to the initiation of release, synaptosomes were loaded with radioactive
glutamate by incubating them for 15 min in non-depolarizing conditions
(2.5 mM K+ in medium). The total amount of glutamate loaded into synap-
tosomes under such conditions was 32.52 nmoles/mg protein. Results
were expressed as % of glutamate released from the amount of radioactivity
present in the synaptosomes after the completion of preloading.
One of the prerequisites for a substance to be called as neurotrans-
mitter is its release from the nerve terminals when they are depolarized.
Such evoked release of the neurotransmitter should, however, occur in the
presence of Ca2+ (Blaustein, 1975). Release of glutamate from brain cortex
in vivo after activation through neuronal pathways was first demonstrated
by Jasper and Koyama (1969). Depolarization induced release of glutamate
from different types of brain preparations (such as whole brain, synapto-

76
somes, cells in cultures etc.,) in in vivo and in vitro conditions from
different species has been reported (Levi et al., 1976; Naddler et al., 1978;
Potashner, 1978; Rao and Murthy, 1991). However, calcium dependency of
glutamate release has become controversial due to the reported release of
glutamate both in the presence and absence of calcium (Erecinska et al.,
1987; Haycock et al., 1978; Wheeler and Wise, 1983; Rao and Murthy,
1991). Nicholls and Attwell (1990) reviewed this aspect and concluded
that glutamate present in the synaptic vesicles is released from the
depolarized nerve terminals by exocytosis in a calcium dependent manner.
This release is highly dependent on the maintenance of high energy levels
and any decrease in ATP/ADP ratio inhibits this release. They further
suggested that calcium independent release occurs by the reversal of high
affinity uptake system for glutamate. They suggested that this glutamate
belongs to non-vesicular pool which resides in the synaptic cytoplasm.
Release of mis pool occurs when the energy levels of the nerve terminals
are low due to the decreased ATP/ADP ratio.
Prior to describing the results, it is worth defining the term "basal
release". Some investigators consider basal release of the neurotransmitter
as the release that occurs under nondepolarized conditions in the absence of
Ca2+ (Foster and Roberts, 1980; Levi et al., 1982). However, in the present
study, basal release is considered as the release of neurotransmitter under
nondepolarised conditions in the presence of Ca2"1". The rationale behind
such a definition is that under physiological conditions, Ca2+ is present in
the extracellular medium whether the nervous system is depolarized or not.

77
In the present study, glutamate release was observed even in
nondepolarizing conditions (Fig. 2.1 A). Such a basal release has been
reported earlier (Drejer et al., 1982; Wheeler and Wise, 1983; Rao and
Murthy, 1991). Increasing the extracellular potassium concentration is
known to depolarize the neurons and bring about the release of neuro-
transmitters (Wheeler and Wise, 1983).
A small but statistically significant increase was observed in the
release of glutamate when the extracellular K+ was increased to 50 mM.
This phenomenon was observed only in the presence of Ca2"1". Mere
depolarization (by increasing extracellular K+) had no effect on the release
of glutamate (Fig. 2.1 A). These results were in concurrence with the
earlier reports on the Ca2+ dependent release of neurotransmitter,
especially of glutamate, from different types of brain preparations such as
slices, synaptosomes and cell cultures (Bosley et al., 1983; Levi and Gallo,
1986; Rao and Murthy, 1991). However, the magnitude of increase
observed in the present study was less when compared to that reported by
others.
Alterations in the release of glutamate under depolarized and non-
depolarised conditions in the presence and absence of Ca2+ was deter-
mined at different time periods in normal and GALN treated rats. As was
mentioned earlier, mere depolarization in the absence of Ca2+, (- K+, +
EGTA Vs + K+- + EGTA), had no effect on the release of glutamate in
normal animals. However, this was not the case in GALN treated animals.
In these animals glutamate release was enhanced by depolarization even in
the absence of Ca2+. Another interesting observation was the loss of Ca2+
78
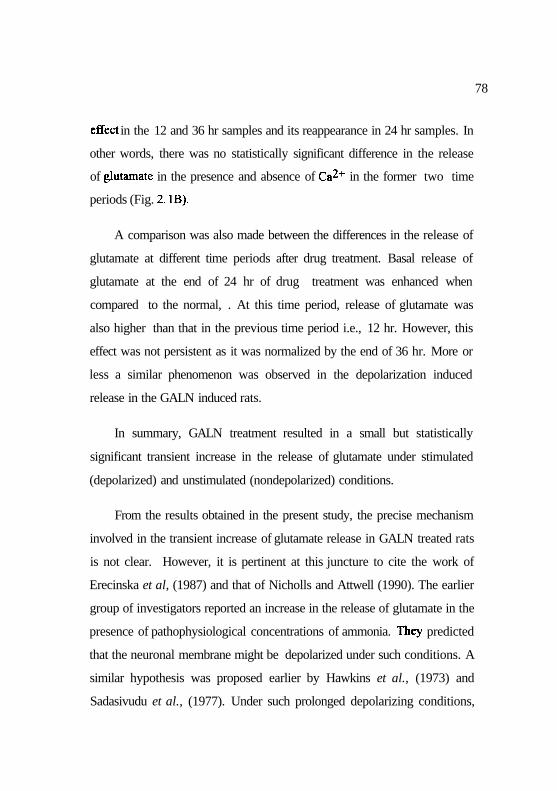
effect in the 12 and 36 hr samples and its reappearance in 24 hr samples. In
other words, there was no statistically significant difference in the release
of glutamate in the presence and absence of Ca2+ in the former two time
periods (Fig. 2. IB).
A comparison was also made between the differences in the release of
glutamate at different time periods after drug treatment. Basal release of
glutamate at the end of 24 hr of drug treatment was enhanced when
compared to the normal, . At this time period, release of glutamate was
also higher than that in the previous time period i.e., 12 hr. However, this
effect was not persistent as it was normalized by the end of 36 hr. More or
less a similar phenomenon was observed in the depolarization induced
release in the GALN induced rats.
In summary, GALN treatment resulted in a small but statistically
significant transient increase in the release of glutamate under stimulated
(depolarized) and unstimulated (nondepolarized) conditions.
From the results obtained in the present study, the precise mechanism
involved in the transient increase of glutamate release in GALN treated rats
is not clear. However, it is pertinent at this juncture to cite the work of
Erecinska et al, (1987) and that of Nicholls and Attwell (1990). The earlier
group of investigators reported an increase in the release of glutamate in the
presence of pathophysiological concentrations of ammonia. They predicted
that the neuronal membrane might be depolarized under such conditions. A
similar hypothesis was proposed earlier by Hawkins et al., (1973) and
Sadasivudu et al., (1977). Under such prolonged depolarizing conditions,

an initial increase followed by a decline (due to the exhaustion of the
neurotransmitter pool) in the release of glutamate might be expected. It
has been shown that neurotransmitter pool of glutamate is derived pre-
dominantly from glutamine. Glutaminase, responsible for the genesis of
this pool of glutamate, was reported to be inhibited by pathophysiological
concentrations of ammonium ions (Bradford et al., 1978; Van Den Berg et
al., 1978; Schousboe and Hertz, 1983). This might be one of the reasons
for the depletion in the neurotransmitter pools of glutamate.
As mentioned above, Nicholls and Attwell (1990) reported that a
decrease in ATP/ ADP ratio would inhibit Ca^+ dependent release of glut-
amate and at the same time enhance the release of cytosolic pool of gluta-
mate by the reversal of high affinity uptake system. As cerebral ATP/ADP
levels are supposed to be decreased in the presence of pathophysiological
concentrations of ammonia (Hindfelt, 1983; Pusinelli and Cooper, 1994), it
is possible that the above said mechanism for the release of glutamate
might become operative under hyperammonemic conditions. The results of
these two investigators are pertinent to the present study as liver failure is
known to be associated with an increase in cerebral ammonia levels. An
increase in the release of glutamate was also reported by Moroni et al.,
(1983); Rao and Murthy (1991); Butterworth et al., (1991) in
hyperammonemic states.
Though the above hypothesis seems to be attractive, it is applicable
only to in vivo release of glutamate. However, in the present study gluta-
mate release was studied under in vitro conditions. In these experiments,
synaptosomes (nerve terminals) isolated from normal and experimental
79

80
animals were provided with glucose and oxygen. Moreover, the
endogenous ammonia content, even it was elevated in in vivo conditions,
would have been diluted to a very great level during the preparation of
synaptosomes. Hence, the above said mechanisms may not be operative
under present experimental conditions It is therefore suggested that
changes that have occured in the release mechanisms under in situ condi-
tions have persisted the rigours of synaptosomal preparation and manifested
during the assay. It is quite likely that the changes would have occured in
the GALN treated rats at the level of neuronal membrane and such changes
might have altered the release of glutamate. Further evidence for this tenet
(i.e., altered membrane architecture) will be presented in the next chapter.
Whatever may be the mechanism, it appears that the release of neuro-
transmitter pool of glutamate was affected during FHF. It is not known at
present whether this change is specific to glutamate or all other neuro-
transmifters
RECEPTOR BINDING STUDIES :
Neurotransmitter (glutamate and GABA) once released, binds to its
receptors present on the pre- and post-synaptic membranes. Alteration in
the binding of these neurotransmitters affects neurotransmission at the
nerve terminals and neuronal pathways. For e.g. GABA receptor abnor-
malities have been found in Parkinson's disease and Huntington's Chorea
(DeLorey and Olsen, 1994). Similarly, decreased GABA binding was found
in the hippocampus and substantia nigra of Parkinson's patients (Lloyd and
Dreksler, 1978). Changes in the neurotransmission mediated by excitatory
amino acid have been implicated in neurological disorders, such as
81
Alzhiemer's disease, Huntington's chorea, epilepsy, Parkinson's disease,
amyotropic lateral sclerosis, AIDS encephalopathy, dementia complex and
the chronic neurodegenerative diseases (Choi, 1988; Gasic and Hallman,
1992; Kitamura et a!., 1993; Dingledine and McBain, 1994).
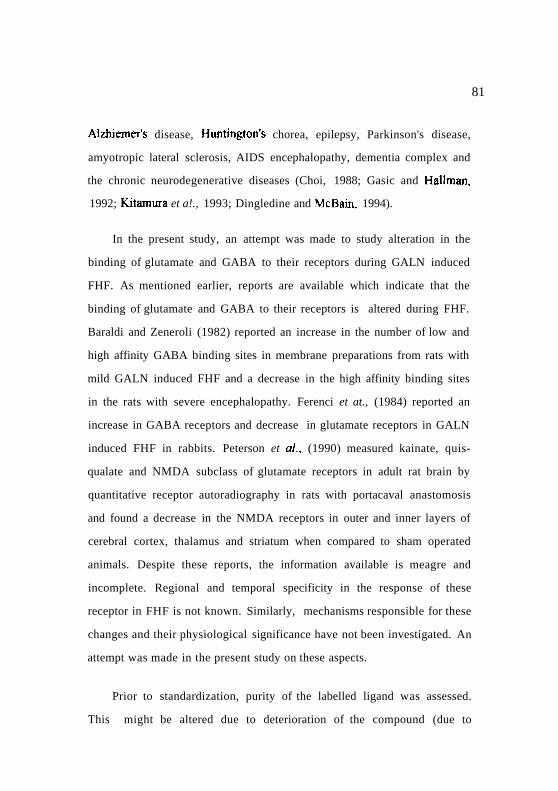
In the present study, an attempt was made to study alteration in the
binding of glutamate and GABA to their receptors during GALN induced
FHF. As mentioned earlier, reports are available which indicate that the
binding of glutamate and GABA to their receptors is altered during FHF.
Baraldi and Zeneroli (1982) reported an increase in the number of low and
high affinity GABA binding sites in membrane preparations from rats with
mild GALN induced FHF and a decrease in the high affinity binding sites
in the rats with severe encephalopathy. Ferenci et at., (1984) reported an
increase in GABA receptors and decrease in glutamate receptors in GALN
induced FHF in rabbits. Peterson et al., (1990) measured kainate, quis-
qualate and NMDA subclass of glutamate receptors in adult rat brain by
quantitative receptor autoradiography in rats with portacaval anastomosis
and found a decrease in the NMDA receptors in outer and inner layers of
cerebral cortex, thalamus and striatum when compared to sham operated
animals. Despite these reports, the information available is meagre and
incomplete. Regional and temporal specificity in the response of these
receptor in FHF is not known. Similarly, mechanisms responsible for these
changes and their physiological significance have not been investigated. An
attempt was made in the present study on these aspects.
Prior to standardization, purity of the labelled ligand was assessed.
This might be altered due to deterioration of the compound (due to

82
inherent radiation energy) over a period of time even when stored at -20°
C. In fact, it was indicated in the supplied technical information, that the
rate of deterioration would be 1% per month under standard conditions of
storage. In such a case, it is possible that the products formed due to
deterioration might interfere with the binding of the labelled ligand. Hence,
it is imperative to check this before performing the actual experiments.
Purity of the labelled glutamate was checked by paper chromatography
as described in the methods section. About 60% of the applied radioactivity
was recovered in an area corresponding to authentic glutamate (Rf value is
0.27). Rest of the radioactivity was distributed all along the length of the
paper. Of this, about 20% of radioactivity was localized to two spots (Rf
values of 0.562 and 0.72) and rest was diffusely distributed (Fig. 2.2).
Areas corresponding to 60% of radioactivity of (glutamate) and 20%
radioactivity (might be a contaminant) were eluted (described in methods)
and binding studies were performed (Fig. 2.3A). These results were
compared with the values obtained by using unpurified labelled ligand.
After normlizing the specific activities to the amount of glutamate
applied, the values obtained for receptor binding with purified and unpuri-
fied glutamate were more or less same. Since the nature and content of
contaminant was unknown, its binding to membranes was expressed as
percentage of cpm of glutamate binding. This was observed to be ~ 5%.
These results demonstrated that contaminant was not interfering with the
binding of glutamate and purification of glutamate prior to performing
binding studies had no significant influence either on the binding or on the
values obtained. Hence, in subsequent studies labelled glutamate was used
83
without any purification. Due to this it is possible that the value obtained
presently may be having an offset of about 5%.
Preliminary standardization of glutamate binding was performed with
the membranes from CC of normal animals. These experiments include the
optimization of incubation time and the reversibility of the binding (Fig.
2.3B-2.3C). Glutamate binding to the membranes increased with time of
incubation till 15 min and did not show any significant increase till 30 min.
Reversibility of glutamate binding was determined by incubating the mem-
branes for 30 min with 20 nM [^HJglutamate followed by the exposure of
these membranes to a large excess (1 mM) of unlabelled glutamate.
Aliquots were taken at various time periods and filtered. These filters were
washed and radioactivity was determined. Addition of unlabelled glutamate
decreased the amount of label bound to the membranes indicating that
binding was specific, saturable and reversible. Possibility of glutamate
binding to its transport site was ruled out as binding was performed in the
absence of sodium ions, which is essential for the binding of glutamate to
its transport sites (Roberts, 1974). In all these studies, non-specific binding
was 20% of total binding (Fig. 2.4A).
In normal animals, glutamate binding was higher in CB than in CC
and BS (Fig. 2.4B). Extent of glutamate binding to the membranes of CC
and BS in these animals was more or less identical. Such regional
heterogeneity in glutamate binding to its receptor might be due to the
differences in the number of receptor sites and their properties in these
regions.

Glutamate binding was studied in animals treated with GALN. As the
animals survived for 40-50 hr, 12, 24 and 36 hr of time period of treatment
were selected for further studies. Region specific and time dependent
alterations were observed in glutamate binding in the brains of GALN
treated rats (Fig. 2.4C). There was a progressive increase in glutamate
binding in the CC till 36 hr after GALN treatment. Peak elevation (+54%)
was observed at 36 hr. A similar change but of a lesser magnitude (+33%)
was observed in BS except that maximal elevation was observed earlier (at
24 hr) than in CC. There was no further increase in the glutamate binding at
36hrinBS.
However, magnitude of elevation was not same throughout the time
periods in these two regions. In CC and BS, the magnitude of elevation
between 0 and 12 hr was 26% and 21%, between 12 and 24 hr it was 10%
and 9% and between 24 and 36 hr it was 10% and 2%, respectively. In
both these regions maximum elevation has occurred between 0 and 12 hr
and thereafter the magnitude of elevation was decreased.
In contrast to the above two regions, glutamate binding in CB
decreased in GALN treated rats. Though the decrease was progressive with
time, maximal decrease occurred between 12 to 24 hr after GALN admini-
stration. At 36 hr, glutamate binding in CB of these rats was 19% of
controls. As was observed in CC and BS, the magnitude of decrease was
not uniform at all the time periods. Between 0 and 12 hr mere was a 33%
decrease in glutamate binding, between 12 and 24 hr it was 56% and
between 24 and 36 hr it was only 9%. In other words, maximal decrease in
glutamate binding in CB occurred between 24 and 36 hr.
84

85
As mentioned , Ferenci et al., (1984) reported a decrease in gluta-
mate binding in the whole brain membrane preparations of rabbit following
the administration of GALN. Results of the present study on glutamate
binding in GALN toxicity, especially of CB, are in agreement with the
results of Ferenci et al., (1984). No reports are available on the regional
and time dependent changes in the glutamate binding in GALN toxicity.
Observed alterations in the binding in GALN toxicity might be due to
changes in the affinity of the receptor to its ligand or due to a change in the
number of binding sites. These changes might be due to (i) alterations in
the synthesis of the number of receptor proteins or synthesis of receptor
protein with altered conformation and or (ii) direct effect of the drug or
some other toxic compounds (generated during the course of action of the
drug) on the receptor protein and or (iii) changes in the membrane architec-
ture affecting lipid-protein interactions. This might be particularly relevant
as the receptors are integral proteins of the plasma membrane and span the
entire bilayer including the hydrophobic lipid core of the plasma membrane
and'or (iv) post-translational modifications of the existing receptor sites
(such as phosphorylation/dephosphorylation) and or sensitization/desensi-
tization due to exposure to ligand (Nantel and Bouvier, 1993; Nestler and
Greengard, 1994). Keeping this in view, efforts were made in the present
study to understand the possible mechanism involved in the region specific
alterations in glutamate binding in GALN toxicity.
Kinetics of glutamate binding to its receptors was studied in the mem-
brane preparations of CC, CB and BS of normal and GALN treated
animals. In both these groups, nonlinearity of the Scatchard plots indicated

86
the existence of more than one binding site for glutamate - a low affinity
binding site and a high affinity binding site (Fig. 2.5-2.6). By convention,
high affinity binding sites were considered to be the receptor binding sites
(Michaelis et al., 1974). In addition to the receptor sites, glutamate also
binds to the uptake sites which transports the amino acid across the mem-
brane. However, these two sites can be distinguished from the Kd (1.87
and 17 [iM for receptor and uptake sites, respectively; Tables 2.1 and 2.6),
Bmax values (42 pmoles/mg protein and 283 nmoles/mg protein/hr, respec-
tively; Tables 2.1 and 2.6) and their sodium dependency. The uptake sites,
especially the high affinity uptake site, requires sodium ions for the trans-
port while the receptor sites do not require this ion. In the present study, all
the receptor binding assays were performed in the absence of sodium ions.
In normal animals, there was no statistically significant difference in
the Kd of low affinity binding sites in different regions of brain (Table 2.1).
Bmax of low affinity binding sites were more or less same in CC and BS.
and were greater than that in CB. Unlike the low affinity sites, significant
differences in the Kd and Bmax values in high affinity binding sites was
observed in different regions of brain.
Kd for the high affinity binding of glutamate in the CB of normal
animals was 3 folds lesser than that of BS and 5 fold lesser man that of CC.
Among these two regions (CC and BS), the Kd for glutamate binding was
higher in CC than in BS. More or less a similar profile was obtained with
respect to Bmax values. The Bmax value in CB was 3 and 2 fold lesser man
those observed in CC and BS respectively. In the later two regions, Bmax
for glutamate binding was higher in CC than BS.

87
As the affinity of the receptor site to its ligand, is inversely related to
Kd, results of the present study suggested that the affinity of the receptor to
glutamate in CB was higher than in CC and BS (Table 2.1). The density of
receptor sites, which is directly proportional to Bmax values, was highest in
CC followed by BS and CB. This is in contrast to the values reported in
Fig. 2.4C for total binding wherein the amount of glutamate bound was
highest in CB than in CC and BS. This anomaly might be due to the fact
that 20 nM glutamate was used in those studies. As the Kd for glutamate
was lower in CB than in CC and BS, the number of sites saturated with
glutamate at this concentration would be higher in CB than in CC and BS.
Significant changes were noticed in the kinetics of glutamate binding
sites in the brains of GALN treated animals when compared to normal
animals. Scatchard analysis of binding isotherms indicated an increase in
the Bmax of binding sites for glutamate in CC and BS and a decrease in the
CB of GALN treated rats. All these changes were statistically significant.
Magnitude of increase in Bmax was higher in BS than in CC. A similar
increase was observed in the Kd values of glutamate receptors in CC and
BS of GALN treated rats, while in CB, Kd was unaltered. Changes in the
Kd and Bmax of low affinity binding sites in these three regions of brain of
GALN treated rats were not statistically significant.
Usually, in the receptor binding studies, changes in Kd values are
considered as a measure of change in the affinity of the receptor for the
ligand. This depends on the conformational state of the receptor. Binding of
the modulators to the receptor protein might alter the conformational state
of die receptor protein and thus die architecture of binding sites. This
88
would eventually affect the affinity of the receptor for its ligand. At least
three such modulators have been reported for glutamate receptors. These
are glycine (which increase the affinity of NMDA subtype of receptor),
spermidine (which has similar action as glycine) and steroids (gonadal,
adrenal). Sex differences were also observed in the action of steroids on
glutamate receptors (Akinci and Johnston, 1993; 1994).
As the neurotransmitter receptors are integral part of membranes,
spanning the entire bilayer, any perturbation in the membrane architecture
or its physicochemical properties might affect the conformation of receptor
protein and thus the affinity of the receptor for its ligand. Another
parameter that affects the conformational state of the receptor might be
post-translational modifications of receptor, such as phosphorylation/
dephosphorylation. Therefore, alteration in the Kd values of glutamate
binding in CC and BS suggested that the receptors might have undergone
some conformational change which alters its affinity to the ligand.
Bmax values are usually considered as a measure of the number of
binding sites available for the ligand. This might be modulated in more
than one way - the binding sites might be removed or expelled from the
membrane or they might be masked either permanently or transiently or
they might be sensitized/desensitized (these two changes might be due to
altered architecture of die receptor). Such changes would alter the amount
of the ligand bound to the receptor. In contrast, synthesis and insertion of
the receptor proteins, or unmasking of the existing ones increase die
number of binding sites, and such an increase would be a true increase in
the number of binding sites. However, it must be mentioned about the
possibility of an apparent increase in the number of binding sites as a result
of decreased affinity of the receptor to its ligand. Under such conditions,
large amounts of ligand would be required for the saturation of receptor
site. This might result in an apparent increase in the Bmax value (which is
calculated from the amount of ligand bound to the receptor) without any
corresponding change in the actual number of receptor sites. Increase in
the Bmax values observed in CC and BS of the GALN treated rats might be
an apparent or a true increase in the number of receptor sites.
Studies on kinetics of the glutamate binding, thus, revealed a regional
heterogeneity in the response of glutamate receptors to the drug induced
FHF. However, from these studies it was not possible to envisage the
nature of the causative factor responsible for changes in glutamate
receptors. It must be mentioned that either, the drug or some other
compound (generated during the drug action) might be responsible for the
observed changes in glutamate binding. However, it was reported that
GALN is not permeable across the BBB and is degraded completely in the
liver (Groflin and Tholen, 1978; Blei et al, 1992). Hence, the direct action
of GALN on the glutamate receptors might be a remote possibility.
Hepatic necrosis is known to be associated with changes in the levels
of ammonia, mercaptans, short chain fatty acids and amino acid (Blei et
al, 1992; Hilgier et al, 1994). As mentioned earlier, ammonia is still
believed to be the chief culprit for the neurological dysfunction in condi-
tions of hepatic inadequacy (Raabe, 1990; Rao et al, 1992; Mousseau and
Butterworth, 1994). It was mentioned earlier (page no. 60) that plasma
ammonia levels were elevated by 10 fold in GALN toxicity. It has been
89
90
reported earlier that a rapid equilibrium would be established between
plasma and brain ammonia levels (Cooper et a!., 1979; Cooper and Plum,
1987). Cooper et al., (1979) have shown that ty2 for the conversion of
plasma ammoma to cerebral glutamine is less than 1-3 sec.
These results suggested that changes in plasma ammonia levels would
be reflected in cerebral ammonia levels. Hence, ammonia levels were
measured in the brains of GALN treated rats. Though it is desirable to
measure the levels of ammonia in different regions of brain, it was not
possible in the present study as the brains were fixed! in liquid nitrogen.
Regional dissection of brain was not possible in the brains fixed in liquid
nitrogen. Efforts to thaw the brain even to -20°C resulted increased the
ammonia levels in brain. Hence, ammonia content was determined in the
whole brain extracts of normal and GALN treated rats.
hi the normal animals, brain ammonia levels were 0.23 nmoles/g wet
weight or 0.3 mM (Table 2.2) which was within the range of reported
values (Benjamin, 1982; Cooper and Plum, 1987; Ratndknmari and Murray,
1990; Rao and Murthy, 1991). It is interesting to note Ait brain ammonia
levels in normal animals were about 1.5 fold highar than those of the
plasma. A similar observation was made earlier by sveral investigators
(Ratnakumari and Murray, 1990; Rao and Murthw, 1991). This was
explained to be due to the differences in the pH off brain and plasma
(Warren and Nathan, 1958; Stabenau et al, 1959; Cooler and Plum, 1987).
Galactosamine induced hepatic necrosis increased: the brain ammonia
levels above the normal values. Though the magnitude of increase was
91
observed to be 3.4 fold (235%) over the control, it was not uniform at all
the time periods. By the end of 12 hr, there was a 2 fold increase (104%)
in brain ammonia levels and there was no further increase between 12 and
24 hr. However, between 24 and 36 hr there was an additional 57%
increase (1.6 fold) in the brain ammonia levels. This is in contrast to the
changes observed in plasma ammonia levels where a gradual increase was
observed till 18 hr and no further change was noticed till the death of the
animals (48 hr). Interestingly, from 12 hr onwards the plasma ammonia
levels were higher than brain ammonia levels, a condition different from
that of normal animals.
As the increase in the blood and brain ammonia levels and changes in
glutamate binding in different regions of brain were time dependent, it was
felt worthwhile to investigate the relationship, if any, between these two.
The correlation coefficient between the percent change in plasma and brain
ammonia levels and glutamate binding in brain was observed to be =1 in all
the three regions (Fig. 2.7-2.8). This suggested a close relationship between
the changes in ammonia levels in both brain and plasma and the changes
(increase in CC and BS and decrease in CB) in glutamate binding.
To prove the correlation between elevated ammonia levels in blood
and brain and glutamate binding, it was felt to select a drug that induces
hypcrainmonemia without inducing hepatic necrosis. For this purpose, one
more animal model of hyperammonemia was selected. Studies of glutamate
binding was conducted in rats injected with ammonium acetate (non-con-
vulsive and convulsive dose) to induce hyperammonemia within a short
time span of 10 mm Involvement of factors (generated due to hepatic
92
necrosis) other than ammonia would be minimal in this animal model. Rao
and Murthy, (1991) and Rukmini and Murthy (1993) reported a 3 and 6
fold elevation in brain ammonia levels in nonconvulsive and convulsive
groups of animals (using same dose), respectively.
Binding experiments in normal, non-convulsive and convulsive hyper-
ammonemic group of animals were performed. In normal animals, binding
was more or less similar in all the three regions of brain (Fig. 2.9A).
Surprisingly, this result was found to be different from that reported earlier
wherein the (Fig. 2.4B) binding was higher in CB than in CC and BS.
Scrutiny of experimental protocols revealed no differences except that these
experiments were performed using female rats (due to the shortage of male
rats). When glutamate binding was done separately in male and female
rats (Fig. 2.9B). The rank order of binding in male rats was CC = BS < CB
while in female rats, it was CB = BS >CC. Sex difference in the binding of
glutamate and responses of glutamate receptors to stress conditions have
been reported earlier (Akinci and Johnston, 1993; 1994).
When animals were treated with non-convulsive or convulsive dose of
ammonium acetate and glutamate binding performed, the profile of changes
in binding was same as in the GALN treatment in all the three regions of
brain (Fig. 2.9C). In CC and BS, an increase in the binding of glutamate
was observed while a decrease in binding was seen in CB. Changes
observed in the binding were not statistically significant in the non-
convulsive group. These results suggested that the increase in ammonia
levels (both in blood and brain) might be responsible for the changes
observed in cerebral glutamate binding.

93
Increase in glutamate binding in CC and BS and decrease in binding in
CB in both GALN treated rats and ammonium acetate injected rats might
be due to the direct effect of pathophysiological levels of ammonia
accumulated in brain under these conditions. Alternately it might be due to
the ammonia induced alterations in the levels of a modulator which exerts
its influence on the glutamate binding sites. As the duration of hyper-
ammonemia was less than 10 min in ammonium acetate treated rats, the
possibility of ammonia induced changes in the synthesis/insertion (into
membranes) of receptor proteins might be ruled out.
To resolve mis, membranes from CC, CB and BS of normal animals
were pre-incubated with two different concentrations of ammonium acetate
(1 & 5 mM; pH 7.0) and binding assays were performed (Fig. 2.9D). Expo-
sure of membranes from CC and BS of normal animals to ammonium ace-
tate increased binding while a decrease in glutamate binding was observed
in cerebellar membranes. The magnitude of increase (in the CC and BS)
was higher with 1 mM ammonium acetate man with 5 mM ammonium
acetate whereas in CB the decrease was same at both the concentrations.
These results indicated that ammonium ions, at pathophysiological
concentrations, might be acting directly on the glutamate receptors.
However, these results, do not rule out the possibility of ammonium ions
acting on the membrane and thus affecting the receptor properties.
From observations of the present study, it may be concluded that (a)
hepatic necrosis is associated with hyperammonemia and (b) hyper-
94
ammonemia with or without hepatic necrosis alters glutamate binding. The
later observation is important as it suggested that a mere elevation in
ammonia level altered the glutamate binding in brain. This is important as
brain ammonia levels were reported to be elevated not only in pathological
states (about 32 different diseases with or without hepatic necrosis; Cooper
and Plum, 1987) but also even under physiological conditions such as
conditioned reflex and learning (Tsukada, 1985). In fact brain ammonia
levels are considered to be an index of neuronal activity as heightened neu-
ronal activity elevates ammonia levels in brain (Benjamin, 1982; Tsukada,
1985). As the extracellular space is limited and ammonia leaks out of the
cell, ammonia levels might reach millimolar concentrations in brain under
such conditions. This suggested that ammonia might be acting as a modula-
tor for glutamate receptors.
There are several subtypes of glutamate receptors in brain. Hence,
studies on total binding fail to provide information on changes in glutamate
receptor subtypes in hyperammonemic states. This information is essential
as each receptor subtype exerts a different post-synaptic effect. For
example, binding of glutamate to NMDA type of receptor was reported to
increase the permeability of membrane to Na+ and Ca^+, stimulate phos-
photidlyinositol breakdown, enhance cytosolic Ca^+ levels and generate
nitric oxide. In contrast, KA receptor is purely an ionotropic receptor and
enhances Na+ permeability of post-synaptic membrane. Metabotropic (L-
AP4) subtype of glutamate receptor promoting cGMP production have also
been reported (Nawy and Jahr, 1990; Dingledine and McBain, 1994).
Hence, changes in the binding of glutamate to its receptor subtypes was
95
studied in GALN toxicity. An attempt was made to see whether the
observed increase in glutamate binding in CC and BS and the decrease in
CB was global (i.e., all the subtypes are affected) or was restricted to any
one particular subtype of glutamate receptor.
To resolve this, glutamate binding was studied in the presence of two
agonists (NMDA and KA) of glutamate in the three different regions of
brain in GALN treated animals. For this purpose, agonist specific receptor
was blocked by pre-incubating membranes either with NMDA or KA and
glutamate binding was performed. Differences in the specific binding in the
presence and absence of an agonist (NMDA or KA) was taken as a measure
of agonist specific binding.
Distribution of ligand specific receptors in the brains of normal
animals varied from region to region. Glutamate binding to NMDA recep-
tors was 2 fold higher in CB than in CC and BS in which there was no
significant difference in the distribution of receptor binding sites (Fig.
2.10). This profile was observed to be similar to that of total binding of
glutamate in these three regions of brain. The rank order of binding of
glutamate to KA receptors was observed to be CB>BS>CC. The magnitude
of difference between CB and other regions was observed to be 2 to 4
folds. In the CC of normal rats, NMDA receptor population was higher
than mat of KA type. In CB and BS, these two receptors occur in equal
densities. In these two regions the sum of NMDA and KA binding
exceeded the total binding of glutamate. A similar observation was made by
Rao et ed., (1991). This suggests a possibility of cross reactivity among
receptor subtypes. Actually low affinity AMPA binding sites are known to
be sensitive to kainate and thus likely to represent common sites partially
shared by AMPA and kainate (Morgan et al., 1991).
In GALN treated rats, region specific and time dependent changes
were noticed in glutamate binding to NMDA receptors. In CC, there was a
progressive increase in binding of glutamate to NMDA receptors. Though
such an increase was observed at the end of 12 hr, it was statistically signi-
ficant only from 24 hr onwards. Maximum change in this region was
observed to be 89% at the end of 36 hr (Fig. 2.11 A). Unlike CC, there was
a progressive decrease in glutamate binding to NMDA receptors in the CB
of GALN treated rats. In this region, maximal decrease (-90%) was
observed at the end of 36 hr (Fig. 2.1 IB). In contrast to the above, gluta-
mate binding to NMDA receptors in BS was decreased initially (12 hr) and
increased thereafter till the normalcy was established (Fig. 2.11C).
After 12 hr of GALN treatment, glutamate binding to KA receptors in
CC was similar to that of normal animals. However, mis was enhanced by
three folds by 24 hr and then decreased by 36 hr. At this time period, the
new value obtained for KA receptor binding in CC was 2 folds higher
than that of normal animals (Fig. 2.11 A). More or less a similar profile of
change was seen in the glutamate binding to KA receptors in BS of GALN
treated rats. However, these changes were statistically not significant (Fig.
2.11C). In the CB of these rats, there was a continuous decrease in the glu-
tamate binding to KA receptors and at the end of 36 hr. The magnitude of
this decrease was 79% of control (Fig. 2.1 IB).
Present results, demonstrated that glutamate binding to NMDA and
96
97
KA subtype of receptors was altered in all the three regions of the brain in
GALN treated rats. The pattern of changes for NMDA and KA receptors
were more or less similar to that of total binding of glutamate. Precise
reason for the alteration in the binding is difficult to understand unless
kinetics of NMDA and KA binding are performed. This would explain
whether the changes observed in binding to receptor subtypes was due to
decrease/increase in the number of binding sites or due to changes in the
affinity of the receptors to their ligands.
Earlier attempts to label NMDA receptors using [̂ H]NMDA were un-
successful and beset with various difficulties due to the low affinity of this
compound for the receptor (Foster and Fagg, 1984). However, a wide
spectrum of ligands were developed for this receptor and are currently
available. In this respect, [^H]MK-801, an antagonist of NMDA receptor
operated channel, is widely used to study the NMDA receptor (Kataoka et
al., 1993). An attempt was made to study alteration in the binding of MK-
801 to NMDA receptors during GALN induced FHF.
Regional differences in MK-801 binding in normal animals was shown
in Fig. 2.12. Cerebral cortex has the highest number of binding sites com-
pared to CB and BS. ha these two regions, the intensity of binding was only
one-tenth of CC. Regional profile of MK-801 binding was observed to be
different from the results of the masking experiments reported earlier.
Results of the masking experiments indicated greater number of NMDA
sites in CB than in CC and BS while the binding of MK-801 was greater in
CC than in CB.

98
This anomaly might be due to region specific differential expression of
the genes involved in the synthesis of subunits of NMDA receptors. With
the availability of an NMDA receptor mRNA, presence of an unique
NMDA receptor subtype was reported to be localized specifically in CB
not in forebrain (Kutsuwada et al, 1992; Monyer et al, 1992). In other
words, pharmacologically distinct subtypes of NMDA receptors might be
present in different regions of brain.
Although NMDA receptors have been classified as a homogeneous
population of receptors, some studies indicate the existence of subtypes of
the NMDA receptors (Maragos et al, 1988; Monaghan et al, 1988;
Honore et al, 1988., McDonald et al, 1990). This is further supported by
the observation on the regional heterogeneity in the distribution of the
binding sites for MK-801 and PCP, both of which are antagonists for
NMDA receptors. Lesser binding of MK-801 in CB and BS man CC
might be due to a pharmacologically distinct population of NMDA recep-
tors present in these regions. Sakurai et al, (1993) reported absence of
MK-801 binding in CB.
At the end of 36 hr, MK-801 binding increased in CC and decreased
in CB of GALN treated rats. Both the changes were statistically significant.
Binding of MK-801 was unaffected in me BS of FHF rats (Fig. 2.12).
Results of MK-801 binding in CC, CB and BS of GALN treated rats (after
36 hr) were in agreement with the results where unlabelled NMDA was
used to block mis subtype of receptor.
Having established the specific response of NMDA receptors, experi-
99
ments were performed to study the kinetics of MK-801 binding (Fig.
2.13A). As the magnitude of binding in CB and BS was very less, kinetic
studies were performed with the membranes of CC. These studies revealed
two types (high affinity and low affinity) of binding sites for MK-801 in
the membranes of CC in both control and GALN treated rats (Fig. 2.13B).
There was a significant increase in the Kd and Bmax values of both
high and low affinity binding sites during GALN induced FHF (Table 2.3).
These changes in Kd and Bmax values of MK-801 binding sites in FHF
rats were similar to that of total glutamate binding except for low affinity
binding sites. As mentioned earlier, changes in MK-801 binding in GALN
treated rats might be due to a change in the number of binding sites (Bmax)
and or in the affinity of the receptor (Kd).
Similar studies were performed with kainate in different regions of rat
brain by using the specific agonist [^H]kainic acid. In normal rats, KA
binding was highest in CC compared to that of CB and BS. Brain stem had
the lowest intensity of binding to KA subtype of receptor (Fig. 2.14). These
results demonstrated a regionally distinct regulation/expression of kainate
receptors.
Kinetics of KA binding was performed in the normal and 36 hr GALN
treated rats. Unlike MK-801, a single type of receptor was noticed for KA
(Fig. 2.15) i.e., there were no low and high affinity binding sites for KA
(Fig. 2.16). Akinci and Johnston (1994) also have shown a single affinity
binding site in the mouse forebrain. There was a marginal but not signifi-
cant, increase in the Kd and Bmax values in the CC of GALN treated rats
100
to that of normal animals (Table. 2.4). This result was not similar to the
previous result where this receptor was blocked with unlabelled KA and
[•̂ HJglutamate binding performed. In that particular experiment mere was a
75% increase in binding in GALN treated rats at the end of 36 hr and this
change was statistically significant. In the CB of the GALN treated rats, the
affinity of the receptors decreased when compared to that of normal
animals whereas the Bmax values remained more or less unaltered.
In the present study, a relationship was demonstrated between cerebral
ammonia levels (which were enhanced in GALN toxicity) and the changes
in glutamate binding. It was suggested that ammonia might be responsible
for the changes observed in glutamate binding in FHF. Presently, an effort
was made to verify this tenet by studying the binding of both MK-801 and
KA in rats treated with convulsive dose of ammonium acetate.
This group of animals also showed the same pattern of changes in the
binding of MK-801 and KA to that of FHF (Fig. 2.17A-B). In ammonium
acetate treated group of animals, the receptors were exposed to a very high
concentration of ammonia. As the duration of hyperammonemia was < 10
min in these rats, the probability of upregulation of receptors was ruled out.
Since, both the experimental group of animals (GALN and ammonium
acetate treated) showed the similar pattern of [3HJMK-801 binding, it
might be suggested that ammonia, particularly at pathophysiological con-
centrations, might exert a direct action on the membranes and'or on the
receptor-ion channel complex.
However, one more possibility for the change in glutamate binding has
101
to be considered before concluding the role of ammonium ions in this
process. As was mentioned earlier, the animals stop feeding from 6-12 hr
after GALN treatment. Therefore, it was felt appropriate to check whether
the alterations observed in glutamate binding during GALN toxicity was
due to starvation stress on the animal. In other words, stress due to starva-
tion would be a factor in addition to the trauma of hepatic necrosis in
GALN treated animals. This is important as stress was shown to affect the
MK-801 binding in rats (Akinici and Johnston, 1993).
The pattern of change in glutamate binding during starved conditions
was shown in Fig. 2.17C. Glutamate binding profiles during starvation
were entirely different from that observed in GALN and ammonium acetate
treatment. In the starved animals, binding of glutamate was decreased in the
CC and BS which was unlike the above two experimental conditions, hi
CB, binding was not altered during starvation. These results, thus ruled out
starvation as a causative factor for the changes observed in glutamate
binding during FHF. This result further strengthened the role of ammonia
in bringing about alteration in glutamate binding during FHF.
A delicate and dynamic balance between inhibitory and excitatory
neurotransmission is a prerequisite for normal functioning of brain. Results
obtained in the present study indicated mat the binding of glutamate, a
major excitatory neurotransmitter, was affected in brain in conditions of
FHF. Hence, it was felt appropriate to know whether changes also occur in
the binding of inhibitory neurotransmitters, especially of GABA. The
rationale behind selecting GABA is obvious - it is the major inhibitory
neurotransmitter and is widely distributed in mammalian brain. It is known

102
to be released from neurons in a Ca2+ dependent manner, when they are
depolarized and binds to the pre- and post-synaptic GABA receptors which
results in the suppression of neuronal activity (DeLorey and Olsen, 1994).
In normal animals, GABA binding was higher in CB than in CC and
BS (Fig. 2.18A). In CC and BS, identical values were obtained for GABA
binding. In GALN treated rats, a decrease was observed in GABA binding
to the membranes of CC and BS. The magnitude of decrease was less in
CC (ranging from 20-30%) when compared to that of BS (= 60%). Unlike
the changes observed in these two regions, GABA binding in the CB of
GALN treated rats was enhanced by two folds (Fig. 2.18B).
The profile of changes observed in the GABA binding under these
conditions were exactly opposite to that of glutamate. In the regions where
the glutamate binding decreased, there was an increase in GABA binding
and vice versa. However, changes observed in glutamate binding, were time
dependent, while those in GABA binding were not time dependent and the
maximal change was observed even in early periods of GALN toxicity.
They persisted more or less at the same level in subsequent time periods.
Changes observed, presently, in GABA binding were in concurrence
with the earlier reports in other models of liver failure and hyperammone-
mic states. Enhanced binding to GABA receptors was reported earlier in
HE induced by GALN (Baraldi and Zeneroli, 1982; 1984; Ferenci et al,
1984). Rao et al, (1991) reported an enhanced muscimol (GABA agonist)
binding in die CB of rats treated with ammonium acetate.
Kinetics of GABA binding to its receptors were studied in the mem-

103
brane preparations of CC and BS of normal and GALN treated animals.
Nonlinearity of the Scatchard plots indicated more than one binding site for
GABA (Fig. 2.19-2.20). In normal animals there was no statistically sig-
nificant difference in the Kd of high and low affinity binding sites in CC
and CB. Bmax value of both the affinity systems were, however, higher in
CC than CB. Significant changes were observed in the kinetic parameters
of GABA binding sites in the brains of GALN treated rats when compared
to normal animals (Table 2.5).
Scatchard analysis of binding sites indicated a significant decrease
(41%) in the Bmax value of the high affinity binding site in CC while an
increase was observed in CB. An opposite change was observed in the Kd
values in these two regions. There was a 31% decrease in the Bmax value
of low affinity binding site in CC and in CB it was unaltered. Kd for
GABA binding to the low affinity system showed an increase (95%) in CC
while a significant decrease (26%) was observed in CB.
When the correlation coefficient for brain ammonia levels and GABA
binding was calculated it was in the range of 0.81 to 0.98 (0.98 for CC; 0.9
for CB and 0.81 for BS; Fig. 2.1). Correlation coefficient for plasma
ammonia levels and GABA binding was also in the range 0.69 to 0.79 (0.79
for CC; 0.69 for CB and 0.75 for BS; Fig. 2.22). These observations
demonstrated the involvement of ammonia in altered GABA binding in
conditions of FHF. Further evidence for this suggestion was obtained by
studying GABA binding in animals treated with a convulsive dose of
ammonium acetate. In these animals, the pattern of changes in GABA
binding was similar to those observed in GALN treated rats (Fig. 2.23A).
104
To see if starvation had any effect on GABA binding, animals were
subjected to 36 hr starvation and GABA binding was performed. The
pattern of changes in binding in starved animals were more or less similar
to that of GALN and ammonium acetate treated animals but the magnitude
of change was different (more in CC and less in CB and BS) in this group
(Fig 2.23B). There are previous reports stating that stress leads to altera-
tions in GABAergic systems in the brains. Schwartz et al., (1987) reported
an enhanced GABAergic neurotransmission during acute swim stress,
handling (Biggio et al, 1984) and saline injections (Maddison et al, 1987).
It thus appears that the changes in GABA binding in CC, CB and BS in
GALN treated rats might be due to ammonia and or stress (due to starva-
tion) to which the animal was subjected to during this period.
In conclusion, GALN treatment resulted in the reduction of GABA
binding and an increase in glutamate binding in CC and BS while a reverse
pattern was observed in CB. These reciprocal changes might lead to a loss
of inhibitory control on the neuronal activity in CC and BS and increased
inhibition of the neuronal activity in CB. Such changes might play a key
role in the loss of motor control and induction of convulsions in these rats.
Moreover, BS is known to be the seat of reticular activating system which
and involved in the control of quantity of consciousness. This system is
known to exert an inhibitory control over CC, a modulator of the quality of
consciousness. Loss of inhibitory control in mis region might alter the state
of consciousness and thus the rapport of animal with its environment.
With the reduction in GABA binding in these two regions, there would
be prolonged excitation of the neurons. This might ultimately lead to

105
hyperpolarization and thus suppression of neuronal activity. Similar
changes induced by ammonium acetate administration indicated that
ammonia might be responsible for such changes in neurotransmitter bind-
ing. This study is important because alterations in the binding of these two
neurotransmitters was induced in hyperammonemic states associated with
and without liver failure. This indicates that ammonia might be directly
responsible for these alterations.
GLUTAMATE UPTAKE
Neurotransmitter activity of glutamate released into the synaptic cleft
would be terminated by its uptake into the pre- and post-synaptic neurons
and into surrounding astrocytes. There are two types of uptake mechanisms
- one with a high affinity and the other with a low affinity. The high
affinity uptake system (HAUS) has a low Vmax and a low Km (high
affinity) for glutamate and is supposed to internalize the amino acid when
its extracellular concentration is low. This system requires the presence of
sodium ions for its activity (Stallcup et al., 1979). The low affinity uptake
system (LAUS) has high Vmax and high Km (low affinity) for glutamate
and is supposed to internalize the amino acid when its extracellular concen-
tration is very high. Several lines of evidence indicate that the HAUS is
primarily involved in the termination of the action of the amino acid neuro-
transmitters (Erecinska and Silver, 1990).
As the results of the present investigation indicated changes in the
release and binding of glutamate to its receptors, it was felt worthwhile to
study the alterations in the reuptake of glutamate into synaptosomes in
GALN treated animals. .. •
106
Preliminary standardization studies in CC revealed that glutamate
uptake into synaptosomes was linear up to 200 ^g of protein (Fig. 2.24A).
In the subsequent experiments 100 ug protein was used. Glutamate uptake
into synaptosomes was found to be linear till 10 min of incubation time
(Fig. 2.24B). In all the other experiments, incubation was performed for 5
min, so that the metabolism of glutamate could be minimized. Ouabain
effects indicated that sustained transport requires the presence of sodium
ions (Fig. 2.24C).
Kinetics of glutamate transport confirmed the earlier observations on
the presence of two affinity systems (high and low affinity uptake systems)
for glutamate transport in synaptosomes (Fig. 2.25A-2.25B). The affinity of
the transport (as indicated by Km) of the LAUS was found to be 21 folds
higher than that of HAUS (Table 2.6). Similarly, the rate of transport (as
indicated by the Vmax values) of LAUS was about 2 folds higher than that
of HAUS. Thus, the LAUS acts as low affinity and high capacity system
for glutamate transport, while the opposite was true for HAUS (high
affinity and low capacity system).
From twelve hours after the administration of GALN, marginal
changes were observed in the Km of LAUS. It increased by 16%, which
was statistically not significant. However, the Vmax of LAUS decreased in
GALN treated to that of normal animals. At 12 hr of GALN treatment there
was a marginal but statistically not significant increase (9%) in the Vmax.
However, 24 hr after GALN administration, Vmax decreased by 24% and
by the end of 36 hr, it decreased by 33%.

107
In the case of HAUS, Km remained unaltered till the end of 24 hr but
at 36 hr of GALN treatment a 35% decrease in the Km values was noticed.
A decrease in the Vmax of HAUS was observed with increasing time
periods of GALN treatment. The magnitude of decrease was quite high
(62%) by the end of 36 hr.
The decrease in the Km of HAUS at 36 hr indicated an early saturation
of the transport system (due to increased affinity) at much lower glutamate
concentrations in the extracellular fluid. The corresponding decrease in the
Vmax of this above system could be due to decrease in the number of
transporters or due to the increased affinity. Early saturation of the trans-
port system occurring at a lower concentration of glutamate, suggested that
the amount of glutamate transported might be less under these conditions.
As a result, glutamate levels in extracellular space would be elevated.
Similarly, the unaltered Km values and decreased Vmax values in LAUS in
the experimental animals (especially the Vmax at 24 and 36 hr) might also
result in prolonged presence of glutamate in the extracellular space,
especially in synaptic cleft.
The overall decrease in the Vmax and Km of HAUS might be an indi-
cation of decreased uptake of glutamate into nerve terminals during GALN
treatment. The decrease in high affinity transport might be due to a poor
(decreased) energy status of the cell. Previous reports have indicated that
cerebral ATP/ADP levels were decreased in the absence of a functional
liver and in the presence of pathophysiological concentrations of ammonia
(Hindfelt, 1983; Pulsinelli and Cooper, 1994). In this condition, the HAUS
might transport glutamate from the cell into the extracellular fluid, thus
108
resulting in the release of glutamate, which was reported to be a Ca^+
independent process. It must also be mentioned here that an enhanced
release of glutamate in a Ca2+ independent fashion in GALN treated rats
(12 and 36 hr) has been observed in the present study (release experi-
ments).
Rao and Murthy, (1991) reported that the Vmax value of LAUS in
synaptosomes was unaltered in CB of hyperammonemic rats or by the
addition of ammonium acetate (5 mM) to the preparations of normal
animals. On the other hand, they observed an elevation in the Vmax of
HAUS. Moreover, the Km of the HAUS was unaltered while that of LAUS
was reduced. Differences in the results of Rao and Murthy (1991) to those
of present study might be due to the differences in the regions used and the
animal model. In the present study, CC was used, whereas Rao and Murthy
used CB
Previous studies suggested mat at least two subtypes of sodium
dependent high affinity glutamate transporters exist in mammalian CNS -
one is expressed in forebrain and another in cerebellum (Ferkany and
Coyle, 1986; Robinson el ed., 1991). Norenberg et ai, (1985) also reported
that the exposure of primary cultures of astrocytes to 2 mM ammonia for 4
days suppressed the glutamate uptake into these cells.
Studies on the release, receptor binding and uptake indicated that
neurotransmission mediated by glutamate and GABA might be altered
during FHF. This could be due to increased levels of ammonia in the blood
and brain.

Fig. 2 . 1 : Release of preloaded f^H]glutamate from synaptosomes fromthe CC of (A) normal (B) different time periods of GALNtreated rats. Each value is Mean + SD of 5 separateexperiments done in duplicates. * — P<0.01 when compared tonormal. # = PO.05 when compared to the nondepolarizedcondition. ( ! J ) Normal; ( [£*•] ) 12 hrs; ( Q J ) 24 hrs;( E D ) 36 hrs after the treatment of GALN.
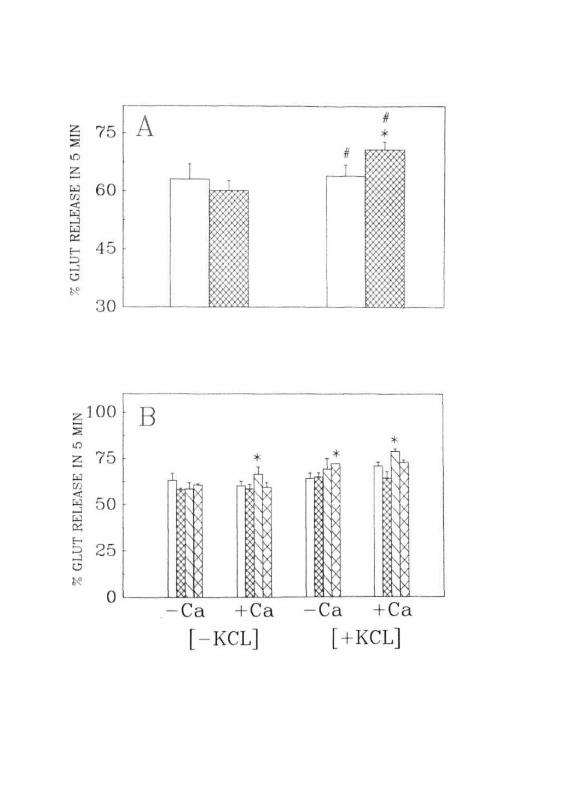

Fig. 2.2: Autoradiogram of [^H]glutamate separated on Whatman No. 1sheet (butanol : acetic acid : water; 65 : 25 : 15, ascending).Arrow indicates the pure glutamate spot


Fig. 2 . 3 : (A) Purity of [^Hjglutamate separated by paper chromato-
graphy. 0 — 0 Amersham, A — A ARC.(B) Binding of [^H]glutamate to the membranes isolated fromthe CC of normal rats as a function of time of incubation.(C) Reversibility of [^HJglutamate bound to the membranesisolated from the CC of normal rats. 4 indicates the time pointat which nonradioactive glutamate (linM) was added. Eachvalue is Mean ± SD of 3 separate experiments done induplicates.
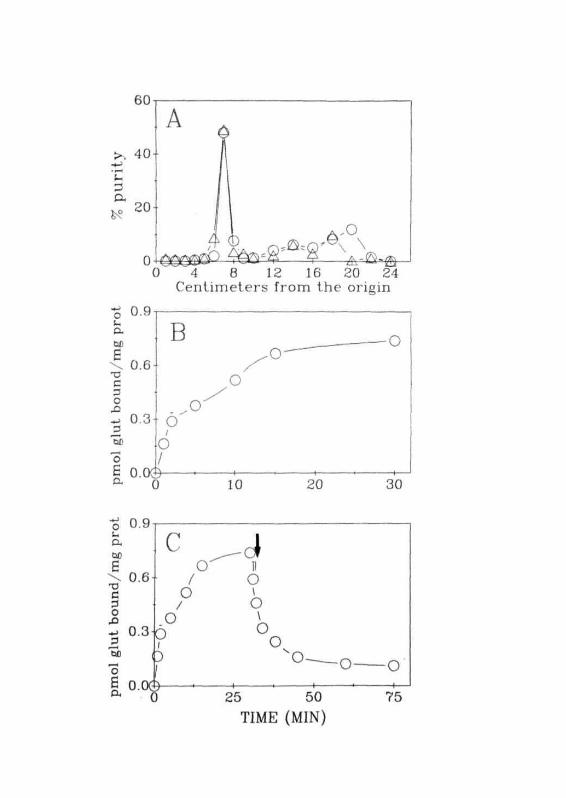
Fig. 2.4: (A) Total ( ES3 ), non-specific ( L3J ) and specific (binding of [^HJglutamate to the membranes from the CC ofnormal animals.(B) Specific binding of [^H]glutamate to the membranes ofCC ( E S X CB ( CX] ) and BS ( [ 2 J ) of normal rats.(C) Specific binding of [^HJglutamate to the membranes ofCC, CB and BS of GALN treated rats. ( • ) Normal,( ^ ) 1 2 h r s , ( C J ) h r s , ( CX] ) 36 hrs after GALNtreatment. Each value is Mean ± SD of 10 separate experimentsdone in duplicates.
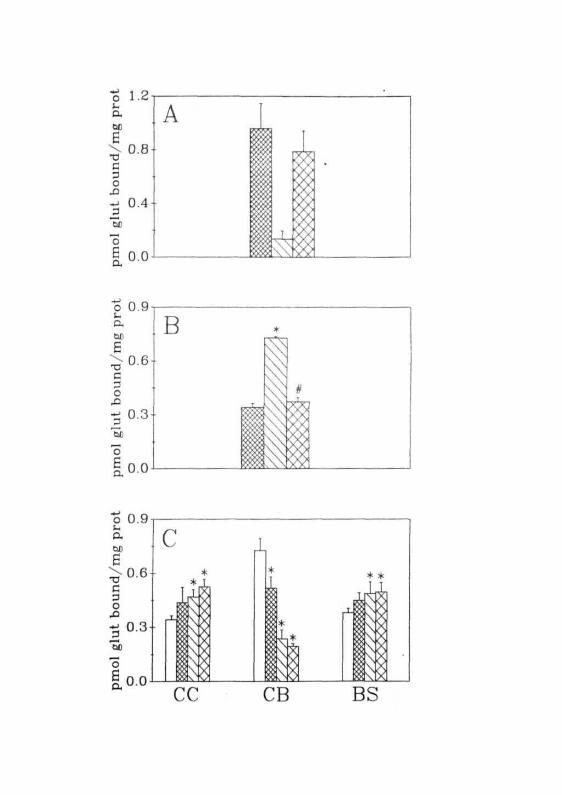

Fig. 2 .5 : Saturation isotherms of [^HJglutamate binding to membranesisolated from the CC, CB and BS of normal animals. Eachvalue is Mean ± SD of 4 separate experiments done induplicates.

Fig. 2.6: Scatchard plots of [^H]glutamate binding to the membranesfrom the CC, CB and BS of normal animals. Each value isMean ± SD of 4 experiments done in duplicates. ( O ) Highaffinity, ( # ) Low affinity.


Fig. 2.7: Correlation coefficient between the percent changes in plasmaammonia levels and glutamate binding in CC, CB and BS ofnormal and different time periods of GALN treated rats.


Fig. 2.8: Correlation coefficient between the percent changes in brainammonia levels and glutamate binding in CC, CB and BS ofnormal and different time periods of GALN treated rats.


Fig. 2.9: (A) Specific binding of [^H]glutamate to the membranes fromCC ( EZ2,), CB ( E 3 ) and BS ( ££3 ) of normal rats.(B) Specific binding of [3H]glutamate to the membranesfrom CC, CB and BS of male ( d ' } ) and female ( E22! )rats.(C) Specific binding of [̂ H] glutamate to the membranes fromCC, CB and BS of normal ES3). nonconvulsive ( [1. ] ) andconvulsive ( j~7~i ) group of animals(D) In vitro effects of ammonium acetate on [^H]glutamatebinding to the membranes of CC, CB and BS of normalanimals. Normal ( [-X:i ), 1 mM (I_\J ) and 5mM ( QI] )ammonium acetate. Each value is Mean ± SD of 5 separateexperiments done in duplicates. * = P<0.01 when compared tonormals.
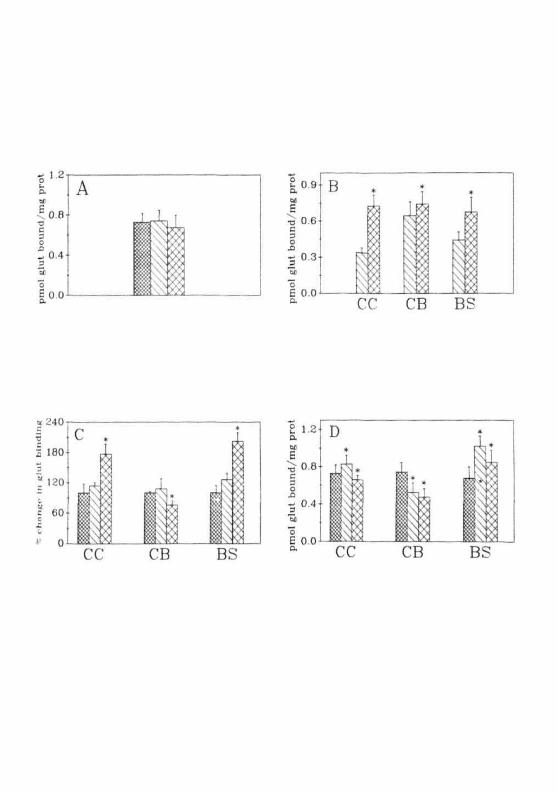
Fig. 2.10: Specific binding of [^HJglutamate to subtypes of glutamatereceptors to the membranes from CC, CB and BS of normalanimals. Total ( E S )> NMDA ( [_3H ) and KA ( QD )Each value is Mean ± SD of 10 separate experiments done induplicates.
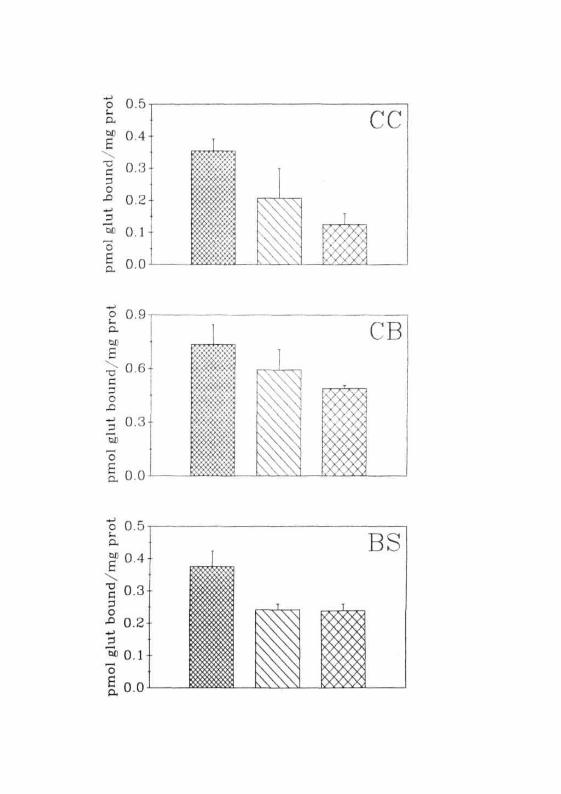

Fig. 2 .11: Specific binding of [3H]glutamate to total, NMDA and KAglutamate receptors to the membranes of (A) CC, (B) CB and(C) BS of normal and GALN treated animals. ( Q j )Normal, ( £23 ) 12 hrs, ( iZJ ) 24 hrs, ( QT] ) 36 hrs ofGALN treatment. Each value is Mean ± SD of 5 separateexperiments done in duplicates. • = P<0.01 when compared tonormals.


Fig. 2.12: Specific binding of [3H]MK-8O1 to the membranes from theCC, CB and BS of normal and GALN treated rats. ( r j )Normal, ( CEJ ) 36 hrs of GALN treatment. Each value isMean ± SD of 3 separate experiments done in duplicates. • =P<0.01 when compared to normals.


Fig. 2.13: (A) Saturation isotherm of [3H]MK-801 binding tothemembranes isolated from the CC of normal animals.(B) Scatchard plots of [3H]MK-801 binding to themembranes isolated from the CC of normal animals.( O ) High affinity, ( 0 ) Low affinity. Each value isMean ± SD of 3 separate experiments done in duplicates.
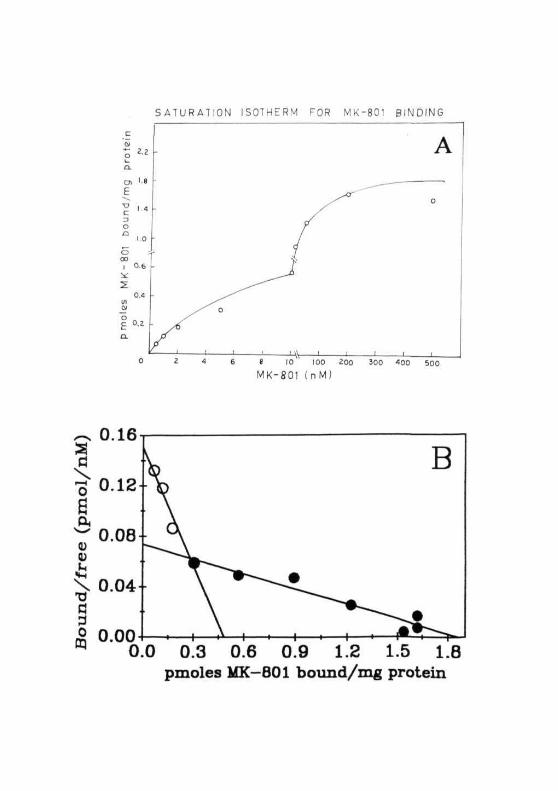

Fig. 2.14: Specific binding of [3H]KA to the membranes from the CCand CB of normal ( [3D ) and 36 hrs GALN ( CS] ) treatedrats. Each value is Mean ± SD of 3 separate experiments donein duplicates.


Fig. 2.15: Saturation isotherm of [^H]KA binding to the membranesfrom the CC and CB of normal animals. Each value is Mean ±SD of 3 separate experiments done in duplicates.


Fig. 2.16: Scatchard plots of [̂ H]KA binding to membranes from theCC and CB of normal animals. Each value is Mean ± SD of 3separate experiments done in duplicates.
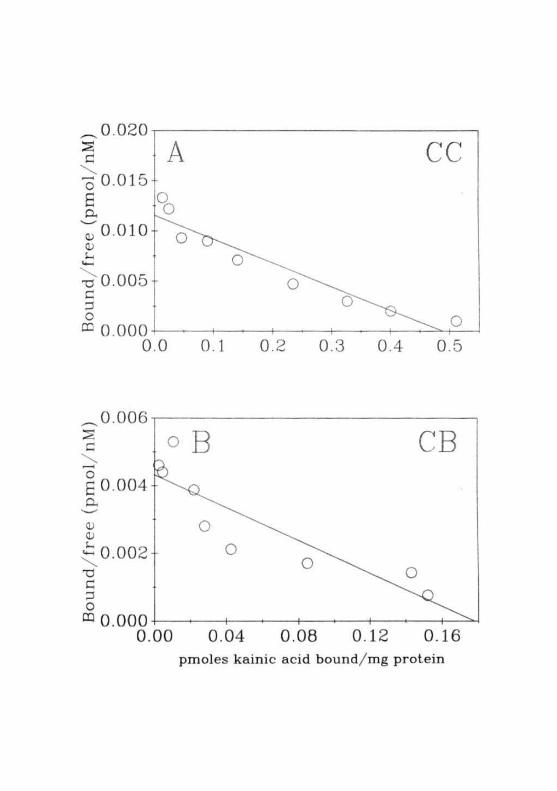
Fig. 2.17: (A) Specific binding of [3H]MK-801 to the membranes fromthe CC, CB and BS of normal ( ("771 ) and convulsive dose( t-\N ) of ammonium acetate treated rats.(B) Specific binding of [3H]KA to the membranes of CC,CB and BS of normal ( [Z~ ) and convulsive dose ( C27J ) ofammonium acetate treated rats. Each value is Mean ± SD of 3separate experiments done in duplicates. • = PO.02 whencompared to normal values.(C) Specific binding of [3H]glutamate to the membranes fromthe CC, CB and BS of normal ( r
L"3; ) and 36 hrs starved( C2H ) r a t s Each value is Mean ± SD of 5 separateexperiments done in duplicates. • = P<0.01 when compared tonormal animals.
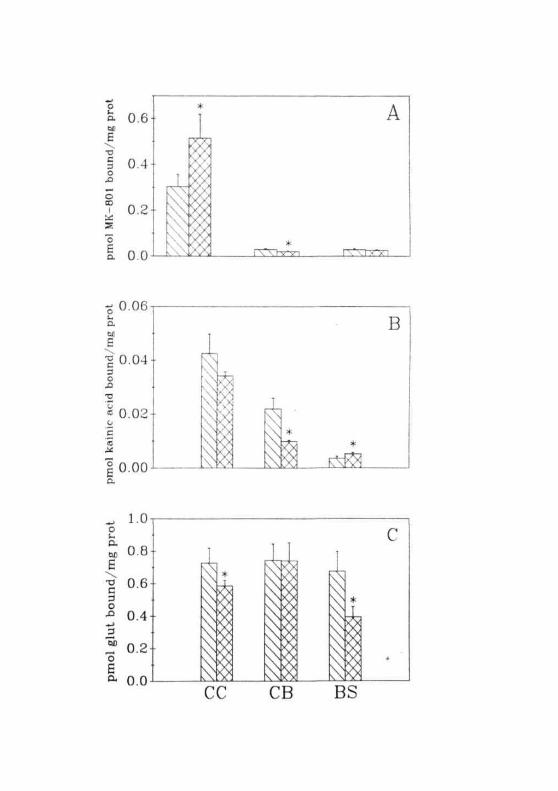
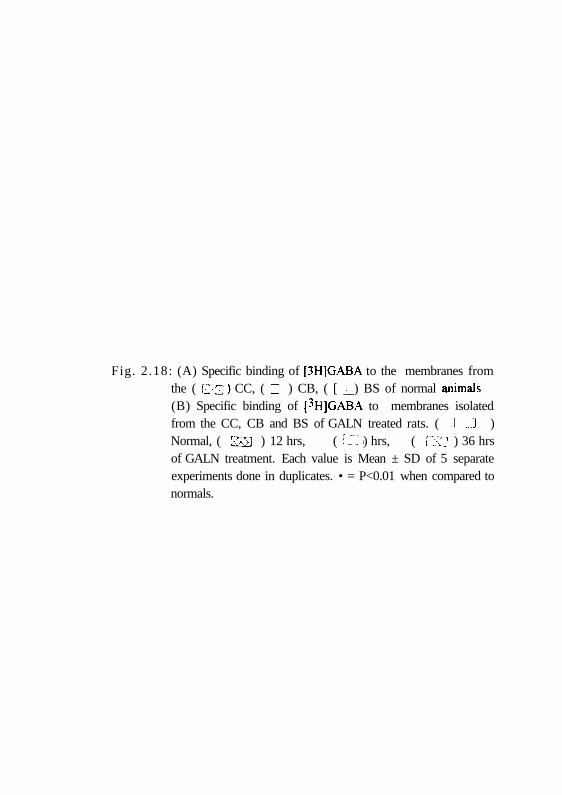
Fig. 2.18: (A) Specific binding of [3HJGABA to the membranes fromthe ( £12) CC, ( [I. ) CB, ( [ ^ ) BS of normal animals(B) Specific binding of [̂ HJGABA to membranes isolatedfrom the CC, CB and BS of GALN treated rats. ( CZ1 )Normal, ( LZ-J ) 12 hrs, ( il'J ) hrs, ( CK] ) 36 hrsof GALN treatment. Each value is Mean ± SD of 5 separateexperiments done in duplicates. • = P<0.01 when compared tonormals.
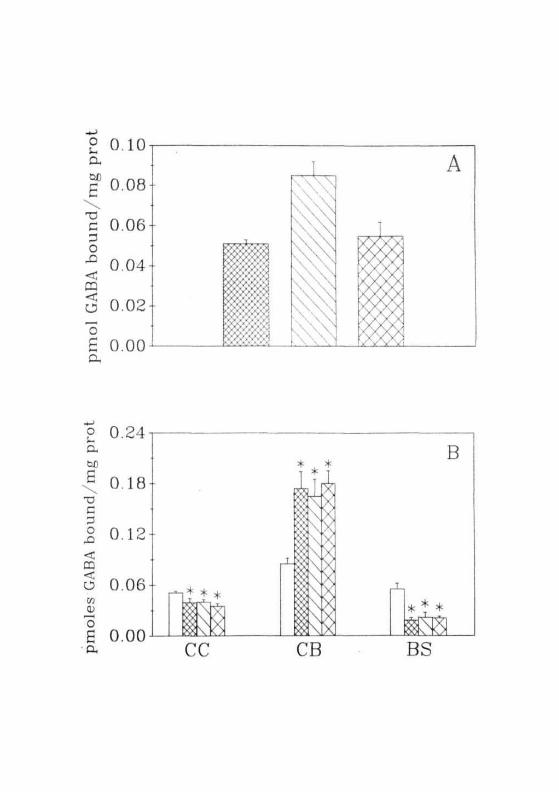
Fig. 2.19: Saturation isotherms of [^H]GABA binding to membranesisolated from the CC and CB of normal rats. Each value isMean ± SD of 4 separate experiments done in duplicates.


Fig. 2.20: Scatchard plots of [̂ H]GABA binding to membranes fromthe CC and CB of normal animals. Each value is Mean ± SDof 4 separate experiments done in duplicates.

Fig. 2 .21: Correlation coefficient between percent changes in brainammonia levels and GABA binding in CC, CB and BS ofnormal and different time periods of GALN treated rats.

Fig. 2.22: Correlation coefficient between percent changes in plasmaammonia levels and GABA binding in CC, CB and BS ofnormal and different time periods of GALN treated rats.
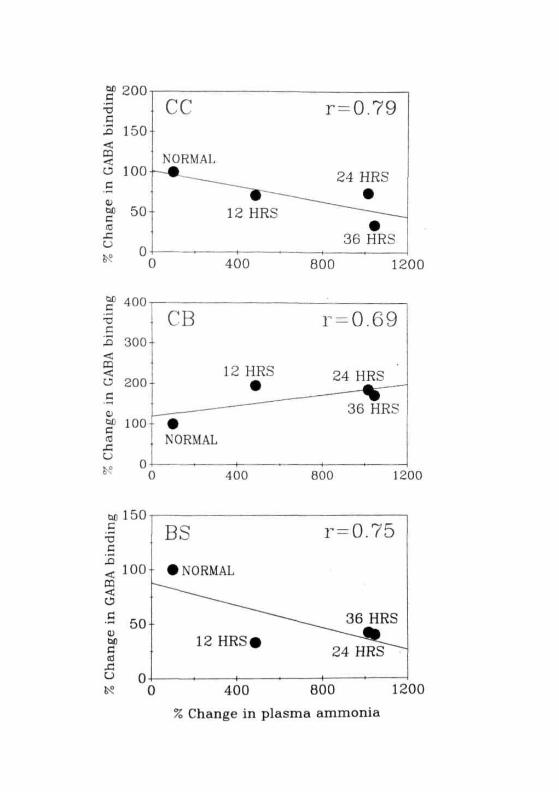

Fig. 2.23: (A) Specific binding of [3H]GABA to the membranesisolated from the CC, CB and BS of normal ( EH] ),nonconvulsive ( ) and convulsive ( I~7H ) group of rats.(B) Specific binding of [^H]GABA to the membranesisolated from the CC, CB and BS of normal ( HZl ) and 36hrs starved ( [~X~1 ) rats. Each value is Mean ± SD of 3separate experiments done in duplicates. • = P<0.01 whencompared to normals.
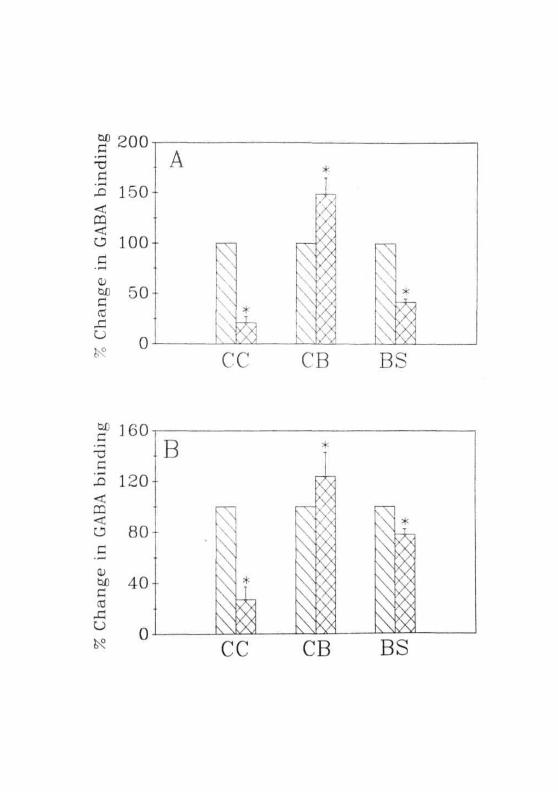
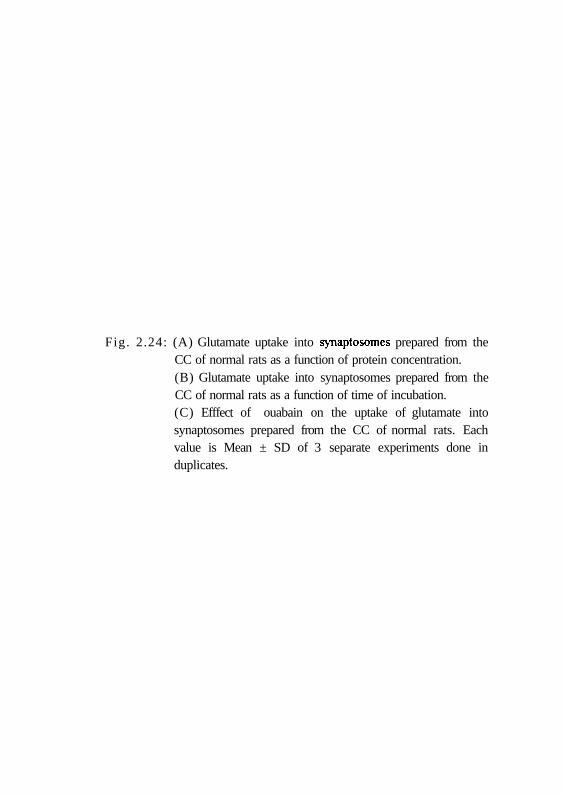
Fig. 2.24: (A) Glutamate uptake into synaptosomes prepared from theCC of normal rats as a function of protein concentration.(B) Glutamate uptake into synaptosomes prepared from theCC of normal rats as a function of time of incubation.(C) Efffect of ouabain on the uptake of glutamate intosynaptosomes prepared from the CC of normal rats. Eachvalue is Mean ± SD of 3 separate experiments done induplicates.

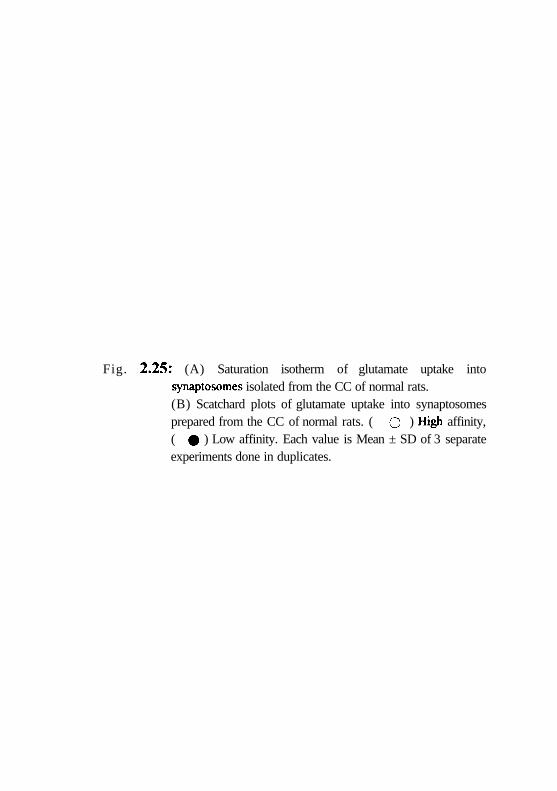
Fig. 2.25: (A) Saturation isotherm of glutamate uptake intosynaptosomes isolated from the CC of normal rats.(B) Scatchard plots of glutamate uptake into synaptosomesprepared from the CC of normal rats. ( O ) High affinity,( # ) Low affinity. Each value is Mean ± SD of 3 separateexperiments done in duplicates.

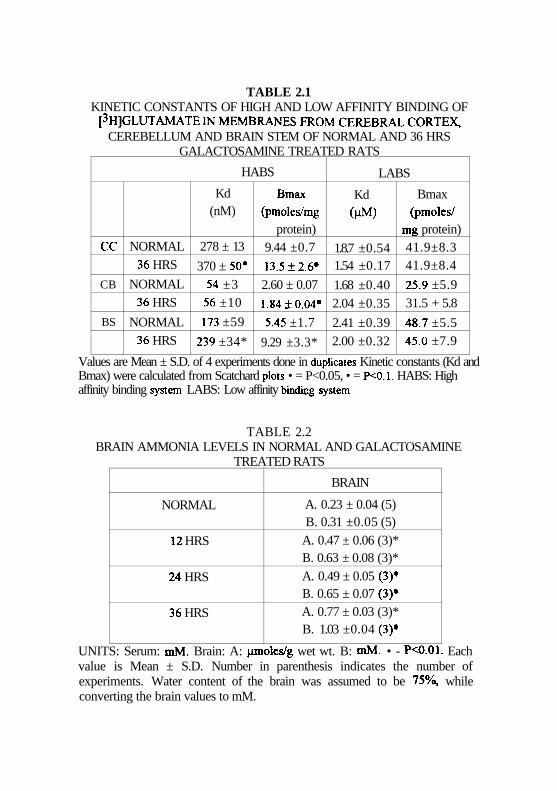
TABLE 2.1KINETIC CONSTANTS OF HIGH AND LOW AFFINITY BINDING OF
[3HJGLUTAMATE IN MEMBRANES FROM CEREBRAL CORTEX,CEREBELLUM AND BRAIN STEM OF NORMAL AND 36 HRS
GALACTOSAMINE TREATED RATS
HABS
CC
CB
BS
NORMAL36 HRS
NORMAL36 HRS
NORMAL36 HRS
Kd(nM)
278 ± 13
370 ± 50*54 ±356 ±10
173 ±59
239 ±34*
Bmax(pmoles/mg
protein)9.44 ±0.7
13.5±2.6#
2.60 ± 0.07
1.84±0.04-
5.45 ±1.7
9.29 ±3.3*
LABS
Kd(HM)
1.8.7 ±0.541.54 ±0.17
1.68 ±0.402.04 ±0.35
2.41 ±0.392.00 ±0.32
Bmax(pmoles/
mg protein)41.9±8.341.9±8.4
25.9 ±5.931.5 + 5.8
48.7 ±5.545.0 ±7.9
Values are Mean ± S.D. of 4 experiments done in duplicates Kinetic constants (Kd andBmax) were calculated from Scatchard plots • = P<0.05, • = P<0.1. HABS: Highaffinity binding system LABS: Low affinity bindicg system
TABLE 2.2BRAIN AMMONIA LEVELS IN NORMAL AND GALACTOSAMINE
TREATED RATS
NORMAL
12 HRS
24 HRS
36 HRS
BRAIN
A. 0.23 ± 0.04 (5)B. 0.31 ±0.05 (5)
A. 0.47 ± 0.06 (3)*B. 0.63 ± 0.08 (3)*A. 0.49 ± 0.05 (3)*B. 0.65 ± 0.07 (3)*A. 0.77 ± 0.03 (3)*B. 1.03 ±0.04 (3)*
UNITS: Serum: mM. Brain: A: pmoles/g wet wt. B: mM. • - PO.01. Eachvalue is Mean ± S.D. Number in parenthesis indicates the number ofexperiments. Water content of the brain was assumed to be 75%, whileconverting the brain values to mM.
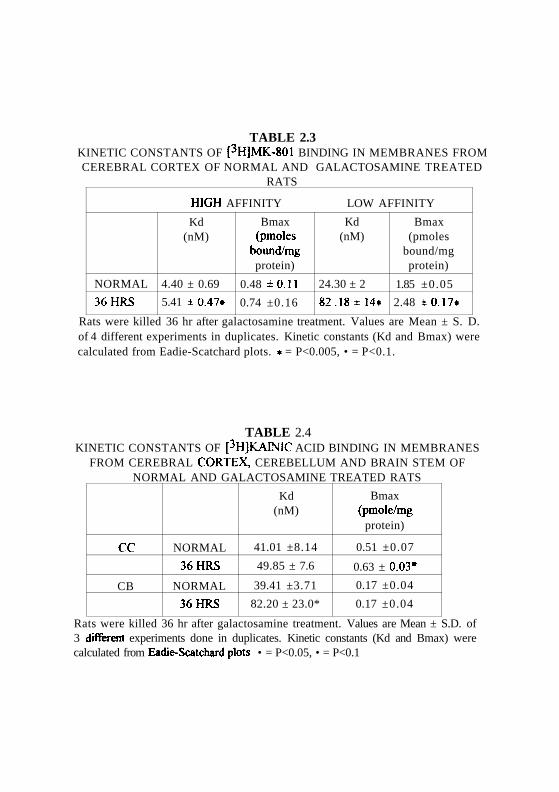
TABLE 2.3KINETIC CONSTANTS OF [3HJMK-801 BINDING IN MEMBRANES FROMCEREBRAL CORTEX OF NORMAL AND GALACTOSAMINE TREATED
RATS
NORMAL
36HRS
HIGH AFFINITY
Kd(nM)
4.40 ± 0.69
5.41 ±0.47»
Bmax(pmoles
bound/mgprotein)
0.48 ±0.11
0.74 ±0.16
LOW AFFINITY
Kd(nM)
24.30 ± 2
82.18 ±14*
Bmax(pmoles
bound/mgprotein)
1.85 ±0.05
2.48 ±0.17*
Rats were killed 36 hr after galactosamine treatment. Values are Mean ± S. D.of 4 different experiments in duplicates. Kinetic constants (Kd and Bmax) werecalculated from Eadie-Scatchard plots. • = P<0.005, • = P<0.1.
TABLE 2.4KINETIC CONSTANTS OF [^HJKAINIC ACID BINDING IN MEMBRANES
FROM CEREBRAL CORTEX, CEREBELLUM AND BRAIN STEM OFNORMAL AND GALACTOSAMINE TREATED RATS
cc
CB
NORMAL
36HRS
NORMAL
36HRS
Kd(nM)
41.01 ±8.14
49.85 ± 7.6
39.41 ±3.71
82.20 ± 23.0*
Bmax(pmole/mg
protein)
0.51 ±0.07
0.63 ± 0.03#
0.17 ±0.04
0.17 ±0.04
Rats were killed 36 hr after galactosamine treatment. Values are Mean ± S.D. of3 different experiments done in duplicates. Kinetic constants (Kd and Bmax) werecalculated from Eadie-Scatchard plots • = P<0.05, • = P<0.1
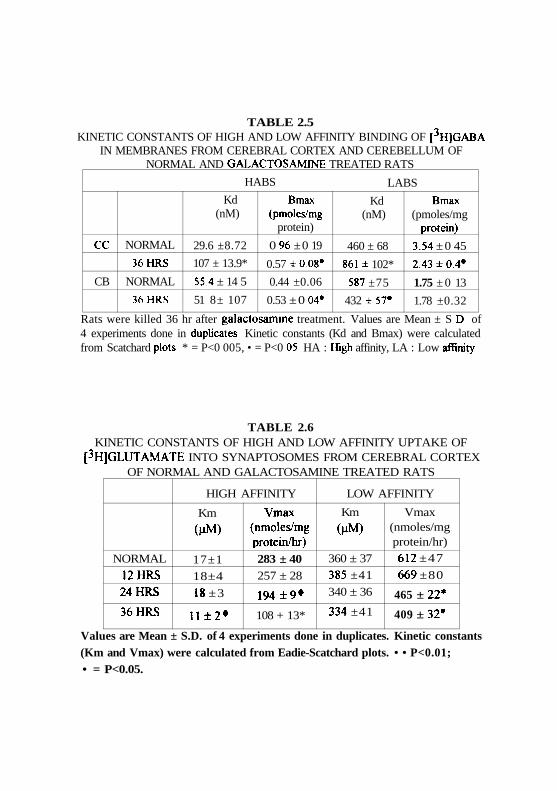
TABLE 2.5KINETIC CONSTANTS OF HIGH AND LOW AFFINITY BINDING OF [3H]GABA
IN MEMBRANES FROM CEREBRAL CORTEX AND CEREBELLUM OFNORMAL AND GALACTOSAMINE TREATED RATS
HABS
CC
CB
NORMAL
36HRS
NORMAL
36HRS
Kd(nM)
29.6 ±8.72
107 ± 13.9*
55.4 ± 14 5
51 8± 107
Bmax(pmoles/mg
protein)
0 96 ±0 19
0.57 ±0.08*
0.44 ±0.06
0.53 ±0 04*
LABS
Kd(nM)
460 ± 68
861± 102*
587 ±75
432 ±57#
Bmax(pmoles/mg
protein)
3.54 ±0 45
2.43±0.4#
1.75 ± 0 13
1.78 ±0.32
Rats were killed 36 hr after galactosamine treatment. Values are Mean ± S D of4 experiments done in duplicates Kinetic constants (Kd and Bmax) were calculatedfrom Scatchard plots * = P<0 005, • = P<0 05 HA : High affinity, LA : Low affinity
TABLE 2.6KINETIC CONSTANTS OF HIGH AND LOW AFFINITY UPTAKE OF
[3H]GLUTAMATE INTO SYNAPTOSOMES FROM CEREBRAL CORTEXOF NORMAL AND GALACTOSAMINE TREATED RATS
NORMAL
12HRS
24HRS
36HRS
HIGH AFFINITY
KmGiM)
17±118±4
18 ±3
11±2*
Vmax(nmoles/mgprotein/hr)
283 ± 40257 ± 28
194 ± 9 *
108 + 13*
LOW AFFINITY
Km(MM)
360 ± 37385 ±41340 ± 36
334 ±41
Vmax(nmoles/mgprotein/hr)612 ±47
669 ±80
465 ± 22*
409 ± 32*
Values are Mean ± S.D. of 4 experiments done in duplicates. Kinetic constants(Km and Vmax) were calculated from Eadie-Scatchard plots. • • P<0.01;• = P<0.05.