chapter 46: marketing bred beef heifers and cows
TRANSCRIPT

BEEFChapter 46
Marketing Bred Beef Heifers and Cows
Lisa Elliott
SDSU Extension is an equal opportunity provider and employer in accordance with the nondiscrimination policies of South Dakota State University, the South Dakota Board of Regents and the United States Department of Agriculture.

46-1 extension.sdstate.edu | © 2020, South Dakota Board of Regents
Chapter 46:
Marketing Bred Beef Heifers and Cows
Key Points
• Buyers rate disposition and temperament as extremely important, and they rate a completed vaccination program, calving ease factors that include minimum pelvic requirements, birth weight, and EPDs (including accuracies), and breed as important.
• One component that must be calculated for a bred female is the potential net cash flow (revenue from weaned calf minus annual cow cost).
• Producers who decide to sell bred females should consider all available marketing options to realize the greatest value for their cattle.
IntroductionThis chapter examines the marketing of bred heifers and cows. The first section discusses the potential bred female characteristics that buyers’ value. This information can be incorporated into herd genetic and management decisions and strategic marketing plans. The second section focuses on the importance of measuring dam productivity. Dam productivity is critical when determining to maintain ownership of bred females or selling them on the market. The final section discusses various selling options for operations.
What characteristics are valued in a bred heifer or cow?Economic studies can estimate premiums and discounts for various characteristics of a female. Some studies use surveys to elicit potential buyers’ willingness-to-pay for certain characteristics, while others use actual market data to estimate characteristic values.
The first highlighted study uses a survey method to discover which bred heifer characteristics buyers find most important (Parcell et al., 2010). Buyers rate disposition and temperament as extremely important. In addition, they rate a completed vaccination program, calving ease factors that include minimum pelvic requirements, birth weight, and EPDs (including accuracies), and breed as important. The following factors are important, but to a lesser extent than the above characteristics: narrow calving window, pen uniformity, body condition, and muscling. It is expected that if buyers place importance on specific characteristics, they would be willing to pay a premium for females that have those characteristics. The survey results show that buyers are willing to pay a premium between $25 to $26 for each of the following characteristics: pen uniformity, synchronized calving, artificially inseminated to calving ease bull, and heifer size (1110 to 1200 pounds). Pen uniformity refers to calving date, breed, color, type, weight, muscling, body condition, and size in this study.
Characteristics that influence bred heifer prices include heifer

46-2 extension.sdstate.edu | © 2020, South Dakota Board of Regents
and calving attributes, and market factors, based on actual market data. Some characteristics elicit premiums, while negative attributes receive discounts.
Heifer characteristicsA heifer’s physical characteristics, such as weight will exhibit a positive relationship to price, while breed type may also influence price. Depending upon the type of sale, heifers that are Angus may exhibit premiums over other breeds. Typically, a 1-pound increase in bred heifer weight will be equal to its future marginal cull value ($/pound).
Overall, uniformity in heifer lots results in premiums. A lot of bred heifers may garner a premium if there is a narrow calving span amongst the lot. If a lot has a span of greater than 30 days, this results in around a $25 discount per head (Parcell et al., 2006).
Heifer lots where more than one sire is used to breed the heifers results in a discount. For example, Elliott et al. (2013) showed a $60 per head discount when more than one sire was used to breed a heifer lot. It is expected that pens with more than one heifer may result in per head premiums. Parcell et al. (2006) found that as pen size increased, so did per head premiums. However, at a certain heifer lot size, premiums may begin to decline because the pool of potential buyers shrinks as lot size becomes larger. Elliott et al. 2006 showed that per head premiums began to decline at a pen size of eight head. This may have been due to the smaller operation size in Missouri. Bred heifer lots of four head garner a per head premium of approximately $25-$111 compared to a pen with one heifer (Parcell et al., 2006; Elliott et al., 2013).
Service Sire Characteristics and Breeding MethodExpected progeny differences (EPDs) of the sire used to breed the heifer could influence bred heifer prices. Heifers bred to a sire with a greater birth weight EPD may result in a discount in the bred heifer’s price. The service sire’s carcass EPD values of marbling, carcass weight, and ribeye area may positively influence the bred heifers’ price. Lower marbling EPD values may cause price discounts, while greater values may garner a heifer price
premium. A female bred to a sire with a high marbling EPD may receive a premium close to the prime-to-select spread. Service sires with greater carcass weight and ribeye area EPD values may garner heifer price premiums. Females bred by artificial insemination garner premiums from $20 to $40 a head (Parcell et al., 2006; Elliott et al., 2013). In addition, it has been found that a heifer’s sire that meets minimum EPD accuracies (calving ease/direct- 0.65, calving ease/maternal- 0.30, weaning weight- 0.75, carcass weight- 0.20, and marbling- 0.20), can garner a $30 premium (Elliott et al., 2013).
Market FactorsThere are other market factors that can influence price besides cattle attributes. As an example, differences in sale location and season can impact a bred animal’s price. Elliott et al. (2013) found that bred heifers that sold in the fall were discounted by approximately $45 compared to spring sales. Also, buyers may pay a premium for heifers expected to calve in a certain preferred month by producers of a particular region. Typically, lots sold at the mid-point of the sale earned the highest premiums.
Replacement Bred CowsWhen bred cows are sold for replacement purposes rather than market/cull cows, it would be expected that the characteristics’ impact on price that were discussed for bred heifers would have a similar directional effect on replacement bred cow prices. However, those premiums may decrease over time according to age, while the discounts may be magnified as the age of the cow increases. With older replacement cows, health issues become a factor that will impact the cow’s price. Cows with health issues, such as bad eyes and diseases, are likely to result in a discount (Mintert et al., 1990). And bred cows sold in later trimester stages are likely to receive a premium as compared to earlier stages (Troxel, 2002). In addition, medium framed replacement cows receive the highest premium, followed by small framed cows as compared to large framed cows (Troxel, 2002).
Producers should make genetic and management decisions that fit with the goals and structure of their operations. However, if producers plan to possibly sell replacement females, they may want

46-3 extension.sdstate.edu | © 2020, South Dakota Board of Regents
to incorporate the previous information into their management decisions. This may include using a strategic criterion (characteristics that garner premiums) for choosing a service sire when making breeding decisions. Also, one may want to consider timing and method of breeding benefits against the costs associated with both. Artificially inseminated females have shown to garner premiums along with lots being uniform and larger. If producers are using reproductive and genetic management practices that should add value to heifers, they need to clearly describe and document the practices and genetic protocol that was utilized. In addition, producers should also consider local market demand factors and seasonal price patterns when making management and marketing decisions.
Dam productivityDam productivity baselineProducers should consider developing a dam productivity baseline in order to decide whether they should keep a bred female in their herd or sell her on the market. To develop a female productivity baseline, producers should use their own budget figures and projected calf and cull cow prices and projected feed costs. One component that must be calculated for a bred female is the potential net cash flow (revenue from weaned calf minus annual cow cost). Using a current budget, net cash flow can be projected into the future by using projected calf prices (including any basis, difference between average U.S. price and local prices) multiplied by the operation’s historical weaning weights and subtracting future annual cows costs. Future annual cow costs can be projected by utilizing past
budgets and adjusting for potential changes in feed quantities and/or rations, and multiplying those quantities by projected prices (accounting for any potential basis difference) for the inputs (e.g., feed, diesel, electricity, etc.). For cost categories where projected prices are unavailable, projected indices of prices paid by producers can be utilized (Food and Agricultural Policy Research Institute [FAPRI] - publishes indices in its annual Baseline Briefing Book). For example, if costs are calculated from historical records for 2013, projections for a 2014 production cost category could be developed by multiplying 2013 costs for the category by the 2014 price index divided by the 2013 price index.
Many firms try to project future prices, including marketing firms and university institutions. An example of a university institution that forecasts commodity prices is the Food and Agricultural Policy Research Institute (FAPRI) at the University of Missouri. In early March, FAPRI releases its baseline projections for the marketing year. The FAPRI U.S. Baseline Briefing Book includes a ten-year baseline projection for U.S. agricultural commodities. The baseline projection is developed by considering 500 alternative outcomes based on different assumptions about weather, oil, GDP growth, and other crucial factors that influence supply and demand and price for commodities. It is important to understand that actual market prices can vary from the projected average prices due to economic factors not included in the projection models that can result in supply or demand shocks. The projections reflect the most likely price scenario given the model assumptions. Baseline
Table 2: Food and Agricultural Policy Research Institute 2014 baseline price projections for cull cows.
YearCull Cow
Price, cwt.Cull Weight
(lbs.)Cull Cow
Value
2014 $86 1400 $1,199
2015 $87 1400 $1,212
2016 $79 1400 $1,104
2017 $73 1400 $1,018
2018 $69 1400 $964
2019 $65 1400 $904
2020 $62 1400 $867
2021 $63 1400 $881
2022 $64 1400 $903
Table 1: Food and Agricultural Policy Research Institute 2014 baseline price projections for feeder steers (600-650 lbs, OKC-$/cwt).
Year Feeder Steer prices
2014 $184
2015 $186
2016 $174
2017 $165
2018 $156
2019 $150
2020 $148
2021 $151
2022 $155

46-4 extension.sdstate.edu | © 2020, South Dakota Board of Regents
projections for cattle prices include the Total All Grade-5-Area Direct Steers, 600-650#-Oklahoma City Feeder steers, and Utility cows- Sioux Falls. In addition, cow-calf returns are included (receipts, feed expenses, non-feed expenses, and net returns). On the input side, price projections are included for corn, soybean meal, sorghum, feed barley, oats, hay, corn gluten feed, corn gluten meal, and dried distillers grains plus solubles (DDGS). Also, indices of prices paid by producers for production items such as feed, fuels, and supplies/repairs are included.
Table 3: Food and Agricultural Policy Research Institute 2014 baseline cow-calf returns projections ($/cow).
Year ReceiptsFeed
expensesNon-feed expenses
Net returns
2014 $939 $227 $479 $232
2015 $943 $206 $486 $251
2016 $875 $203 $492 $180
2017 $827 $203 $500 $124
2018 $784 $205 $504 $75
2019 $751 $207 $507 $37
2020 $737 $208 $513 $17
2021 $753 $207 $522 $24
2022 $771 $206 $529 $36
The USDA Economic Research Service (ERS) has published agricultural price projections through 2022. ERS develops its projections by making specific assumptions regarding the macroeconomic indicators, agricultural policy, weather, and international factors. ERS uses a different procedure than FAPRI for its price projections. Projected cattle price are included (farm beef cattle, farm calves, 5-area steers, yearling steers-Oklahoma city). Projected input prices for corn, sorghum, barley, and soybean meal are also included.
What is the value of the female in operation vs. market?When considering selling bred females, producers should examine the worth of keeping the female versus selling her on the market. One way to do this would be to find the net present value of the female. The steps in determining net present value of bred heifers are outlined in the appendix. The revenue from the female includes her calves and her own remaining value.
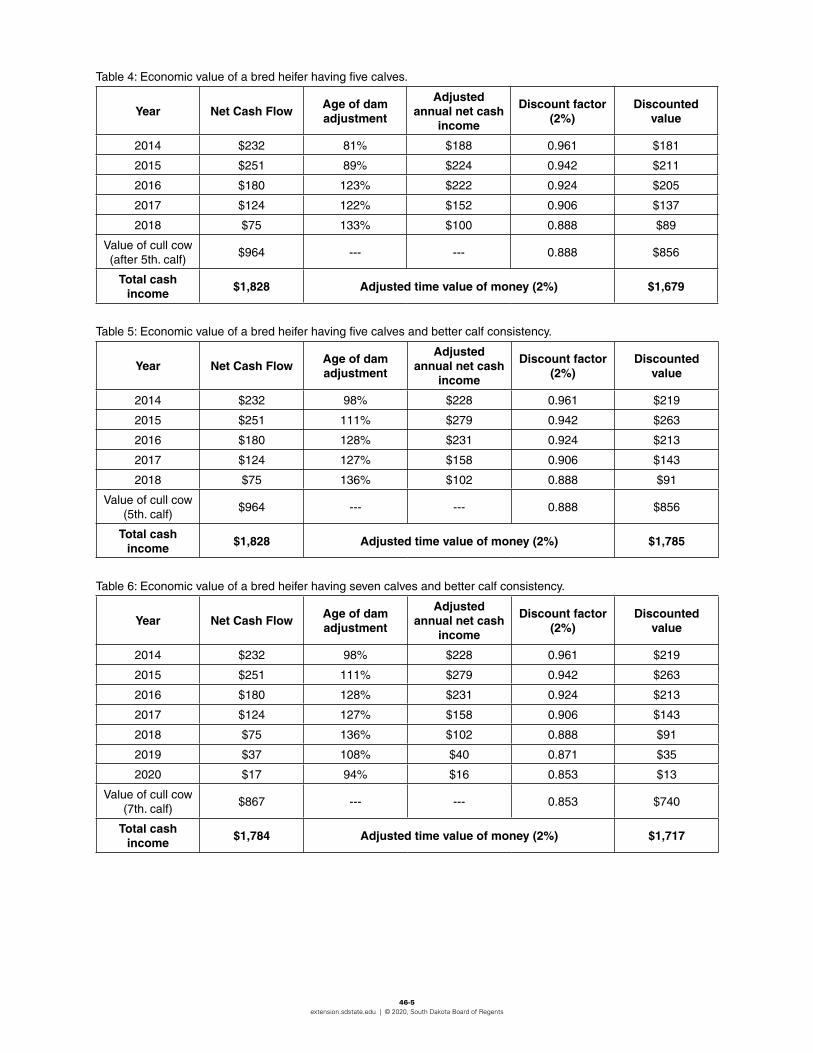
In Tables 4 to 6 below, the net cash flow estimates
were obtained from the 2014 FAPRI Briefing Book (March release). The age of dam adjustment, adopted from the work of Dr. Harlan Hughes (e.g., Hughes, 2013), represents a productivity index that accounts for lower and higher productivity throughout a female’s life. The net cash flows are calculated from the expected annual calf value and the value of the cull cow. The tables below are modified based on previous work by Parcell and Franken (2009a, 2009b).
The adjusted time value of money shows that a fifth-calf cow is worth $1,679, which one might compare to what they could sell the female for under the current market assumptions. If one could sell the female for more than $1,679 today, then they should consider selling her. However, if the producer couldn’t sell the female for more than $1,679, the producer should keep her in the herd. However, the age of dam adjustment could be modified if the producer follows recommended reproductive management strategies for their females or purchases females that were developed according to recommended methods.
The net present value tables have several components that can be changed, so the discussion which follows addresses the relationship with these variables to net present values. The first component that can change is the discount factor when interest rates change. When the discount factor increases with everything else remaining constant, the net present value decrease. Also, if the market assumptions change, such as when cull cow prices increase with everything else remaining constant, this would raise the net present value. Also, if prices for weaned calves increase with everything else remaining constant, this would also increase the net present value. In addition, producers who have a lower cost structure would see a higher net present value.
By having a better developed female, this can increase the age of dam adjustment to reflect a female that raises higher productive calves (changes from Table 4 to Table 5). The net present value increases by $106 to $1,785. Changing the number of calves expected from five to seven actually decreases the net present value by $68 to $1,717 (changes from Table 5 to Table 6). This is due partly
46-5 extension.sdstate.edu | © 2020, South Dakota Board of Regents
Table 4: Economic value of a bred heifer having five calves.
Year Net Cash FlowAge of dam adjustment
Adjusted annual net cash
income
Discount factor (2%)
Discounted value
2014 $232 81% $188 0.961 $181
2015 $251 89% $224 0.942 $211
2016 $180 123% $222 0.924 $205
2017 $124 122% $152 0.906 $137
2018 $75 133% $100 0.888 $89
Value of cull cow (after 5th. calf)
$964 --- --- 0.888 $856
Total cash income
$1,828 Adjusted time value of money (2%) $1,679
Table 5: Economic value of a bred heifer having five calves and better calf consistency.
Year Net Cash FlowAge of dam adjustment
Adjusted annual net cash
income
Discount factor (2%)
Discounted value
2014 $232 98% $228 0.961 $219
2015 $251 111% $279 0.942 $263
2016 $180 128% $231 0.924 $213
2017 $124 127% $158 0.906 $143
2018 $75 136% $102 0.888 $91
Value of cull cow (5th. calf)
$964 --- --- 0.888 $856
Total cash income
$1,828 Adjusted time value of money (2%) $1,785
Table 6: Economic value of a bred heifer having seven calves and better calf consistency.
Year Net Cash FlowAge of dam adjustment
Adjusted annual net cash
income
Discount factor (2%)
Discounted value
2014 $232 98% $228 0.961 $219
2015 $251 111% $279 0.942 $263
2016 $180 128% $231 0.924 $213
2017 $124 127% $158 0.906 $143
2018 $75 136% $102 0.888 $91
2019 $37 108% $40 0.871 $35
2020 $17 94% $16 0.853 $13
Value of cull cow (7th. calf)
$867 --- --- 0.853 $740
Total cash income
$1,784 Adjusted time value of money (2%) $1,717

46-6 extension.sdstate.edu | © 2020, South Dakota Board of Regents
to net cash flows decreasing substantially past the fifth year when the projected price of cull cows was expected to decrease over that time.
If producers project that the net present value of a bred heifer is currently higher than the current market price, then they should retain the female in the herd. However, if the projected net present value of the bred heifer is less than the current market price, one should consider selling the female. A decision aid is shown in Figure 1.
Net Present Value (NPV) of aBred Heifer
Is Current Market Price Greaterthan NPV?
Yes
Retain Femalein Herd
Sell Female
No
Figure 1: Sell vs. retain female decision aid
Selling OptionsVarious marketing alternatives exist for producers to sell bred females. Traditionally, marketing includes selling females through auctions and direct price mechanisms, including private treaties. Other mechanisms include selling via a video auction, strategic alliances (partnering with other producers with like management/genetic strategies), or third-party sanctioned sales. Producers need to weigh the potential costs and benefits associated with different selling options. Producers need to choose selling venues that most optimize their operation’s profits and fit with their operation’s management and strategic goals.
It is important to note that there are various mechanisms to advertise animals to sell. Whichever strategies an operation chooses, it is important to clearly communicate the quality of the females that will be sold. This means that it is important to clearly communicate the management protocol
and genetic characteristics of the females. This may include sharing the characteristics (EPDs, accuracies) of the female’s service sire. This also includes communicating the reproductive management protocol to potential buyers (e.g., health examinations and vaccinations done during weaning, prior to breeding and during pregnancy).
Producers have the potential to add-value to bred females through genetic selection and management decisions that develop a quality characteristic in the female that is demanded by buyers. Various mechanisms can be used to attempt to capture value, which include direct marketing, vertical integration, and strategic producer or cooperative alliances. However, developing a value-added bred female does involve production, marketing, and financial (including labor effort) risk. The potential benefits should be weighed with the operation’s costs when deciding to developed value-added females.

46-7 extension.sdstate.edu | © 2020, South Dakota Board of Regents
AppendixSteps in Determining Net Present Value of Bred Heifers1. Determine own budget figures
a. Know historical revenues and costs
2. Project future revenues and costsa. Project future revenues (calves and cull cow)
i. Calculate future calf revenue1. Multiply projected calf prices by
the operation’s historical weaning weights
a. Multiply projected calf revenue by the Age of Dam Adjustment – the productivity index which accounts for lower and higher productivity throughout the female’s lifeii. Calculate future cull cow revenue
1. Multiply projected cull cow weight by projected cull cow price
b. Project future costs (feed and non-feed)1. Calculate projected annual cow costs
a. Use past budgets and adjust for potential input changes (in feed quantities/rations, diesel, electric, etc.), then multiply by projected input pricesi. Example: project 2014 costs-
adjust own 2013 historical costs by projected 2014 cost changes
c. Sources for projectionsi. FAPRI U.S. Baseline Briefing Book
(released in March- http://www.fapri.missouri.edu/)—can be utilized to find projected prices and costs1. Baseline price projections for cattle,
corn, hay, fuels, and othersii. USDA-Economic Research Service
(released in February- http://www.ers.usda.gov/publications/oceusda-agricultural-projections) – also publishes agriculture price projections1. Uses different assumptions than
FAPRI—price projections will vary
3. Calculate net cash flowa. Determine future calves’ net cash flows
i. Calf revenue minus annual cow costb. Determine future cull cow net cash flow
i. Cull cow revenue
4. Keeping vs. Selling Bred Heifers—Determining Net Present Value (NPV)a. Adjust all net cash flows (calves and cull
cow) by discount factor (interest rate)b. Sum all time adjusted net cash flows (calves
and cull cow)
5. Factors affecting bred heifer Net Present Valuea. Discount factor when interest rates change
(everything else constant)i. Discount factor increases (decreases),
NPV would decrease (increase)b. Other changes (everything else constant)
i. Cull cow prices increase (decrease), NPV would increase (decrease)
ii. Weaned calf prices increase (decrease), would increase (decrease) NPV
iii. Producers who have a lower (higher) cost structure would see a higher (lower) NPV””
iv. A better developed female, will increase the age of dam adjustment, will raise higher productive calves, and would increase NPV
v. Changing the number of expected calves will change NPV1. Change cull cow value (change year
cull cow sold)
6. Decision Rulea. If producers project the NPV of a bred
heifer is greater than the current market price, they should retain the female in the herd.
b. If the producer projects the NPV of the bred heifer is less than the current market price, should consider selling the female.

46-8 extension.sdstate.edu | © 2020, South Dakota Board of Regents
ReferencesElliott, L., J. Parcell, and D. Patterson. 2013.
Determination of the Value of Minimum Sire Accuracy Traits. Journal of Agricultural and Applied Economics 45.2:259-75.
Hughes, H. (2013, May 27). If Nature Cooperates, Good Times Are Ahead For Beef Producers. [Market Advisor Blog, Beef Magazine]. Retrieved from September 10, 2013, from http://beefmagazine.com/blog/if-nature-cooperates-goodtimes-are-ahead-beef-producers.
Mintert, J., Blair, J., Schroeder, T., & Brazle, F. 1990. Analysis of factors affecting cow auction price differentials. Southern Journal of Agricultural Economics 22.2: 23-30.
Parcell, J., K.C. Dhuyvetter, D. Patterson, and R. Randle. 2006. The Value of Heifer and Calf Characteristics in Bred Heifer Prices. The Professional Animal Scientist 22:217-24.
Parcell, J. and J. Franken. 2009a. Dam Productive Baseline, Volume 1. Beef Cow Economics Newsletter. Department of Agricultural Economics, University of Missouri.
Parcell, J. and J. Franken. 2009b. Improving Calving Consistency, Volume 3. Beef Cow Economics Newsletter. Department of Agricultural Economics, University of Missouri.
Parcell, J., J. Franken, M. Cox, D. Patterson, and R. Randle. 2010. Buyers’ Perceptions of Importance and Willingness-to-Pay for Certain Attributes of Source and Production Verified Bred Heifers. Agricultural Economics 41,5:463-70.
Schroeder, T., J. Mintert, F. Brazle, and O. Grunewald. 1988. Factors affecting feeder cattle price differentials. Western Journal of Agricultural Economics. Pp. 71-81.
Troxel, T., M. Gadberry, S. Cline, J. Foley, G. Ford, D. Urell, and R. Wiedower. 2002. Factors affecting the selling price of feeder cattle sold at Arkansas livestock auctions. The Professional Animal Scientist 18.3:227-236.