chapter 41 uchart statement
TRANSCRIPT

Chapter 41UCHART Statement
Chapter Table of Contents
OVERVIEW . . . . . . . . . . . . . . . . . . . . . . . . . . . . . . . . . . .1419
GETTING STARTED . . . . . . . . . . . . . . . . . . . . . . . . . . . . . .1420Creating u Charts from Defect Count Data . . .. . . . . . . . . . . . . . . .1420Saving Control Limits . . . . . . . . . . . . . . . . . . . . . . . . . . . . .1422Reading Preestablished Control Limits. . . . . . . . . . . . . . . . . . . . .1424Creating u Charts from Nonconformities per Unit. . . . . . . . . . . . . . .1425Saving Nonconformities per Unit . .. . . . . . . . . . . . . . . . . . . . . .1428
SYNTAX . . . . . . . . . . . . . . . . . . . . . . . . . . . . . . . . . . . . .1430Summary of Options . . . . . . . . . . . . . . . . . . . . . . . . . . . . . .1432
DETAILS . . . . . . . . . . . . . . . . . . . . . . . . . . . . . . . . . . . . .1440Constructing Charts for Nonconformities per Unit (u Charts). . . . . . . . .1440Output Data Sets . . . . . . . . . . . . . . . . . . . . . . . . . . . . . . . .1442ODS Tables . . . . . . . . . . . . . . . . . . . . . . . . . . . . . . . . . . .1445Input Data Sets. . . . . . . . . . . . . . . . . . . . . . . . . . . . . . . . .1445Axis Labels . . . . . . . . . . . . . . . . . . . . . . . . . . . . . . . . . . .1448Missing Values . . . . . . . . . . . . . . . . . . . . . . . . . . . . . . . . .1448
EXAMPLES . . . . . . . . . . . . . . . . . . . . . . . . . . . . . . . . . . .1449Example 41.1 Applying Tests for Special Causes . . . . . . . . . . . . . . .1449Example 41.2 Specifying a Known Expected Number of Nonconformities . . 1451Example 41.3 Creating u Charts for Varying Numbers of Units . . . . . . . .1452
1417

Part 9. The CAPABILITY Procedure
SAS OnlineDoc: Version 81418

Chapter 41UCHART Statement
Overview
The UCHART statement createsu charts for the numbers of nonconformities (de-fects) per inspection unit in subgroup samples containing arbitrary numbers of units.
You can use options in the UCHART statement to
� specify the number of inspection units per subgroup
� compute control limits from the data based on a multiple of the standard errorof the plotted values or as probability limits
� tabulate subgroup summary statistics and control limits
� save control limits in an output data set
� save subgroup summary statistics in an output data set
� read preestablished control limits from a data set
� apply tests for special causes (also known as runs tests and Western Electricrules)
� specify a known (standard) value for the average number of nonconformitiesper inspection unit
� display distinct sets of control limits for data from successive time phases
� add block legends and symbol markers to reveal stratification in process data
� superimpose stars at points to represent related multivariate factors
� clip extreme points to make the chart more readable
� display vertical and horizontal reference lines
� control axis values and labels
� control layout and appearance of the chart
1419

Part 9. The CAPABILITY Procedure
Getting Started
This section introduces the UCHART statement with simple examples that illus-trate commonly used options. Complete syntax for the UCHART statement is pre-sented in the “Syntax” section on page 1430, and advanced examples are given in the“Examples” section on page 1449.
Creating u Charts from Defect Count Data
A textile company uses au chart to monitor the number of defects per square meterSee SHWUCHRin the SAS/QCSample Library
of fabric. The fabric is spooled onto rolls as it is inspected for defects. Each piece offabric is one meter wide and 30 meters in length. The following statements create aSAS data set named FABRIC, which contains the defect counts for 20 rolls:
data fabric;input roll defects @@;
datalines;1 12 2 11 3 9 4 155 7 6 6 7 5 8 109 8 10 8 11 14 12 5
13 9 14 13 15 7 16 517 8 18 11 19 7 20 12;
A partial listing of FABRIC is shown in Figure 41.1.
Number of Fabric Defects
roll defects
1 122 113 94 155 7. .. .. .
Figure 41.1. The Data Set FABRIC
There is a single observation per roll. The variable ROLL identifies the subgroupsample and is referred to as thesubgroup-variable. The variable DEFECTS con-tains the number of nonconformities (defect count) for each subgroup sample and isreferred to as theprocess variable(or processfor short).
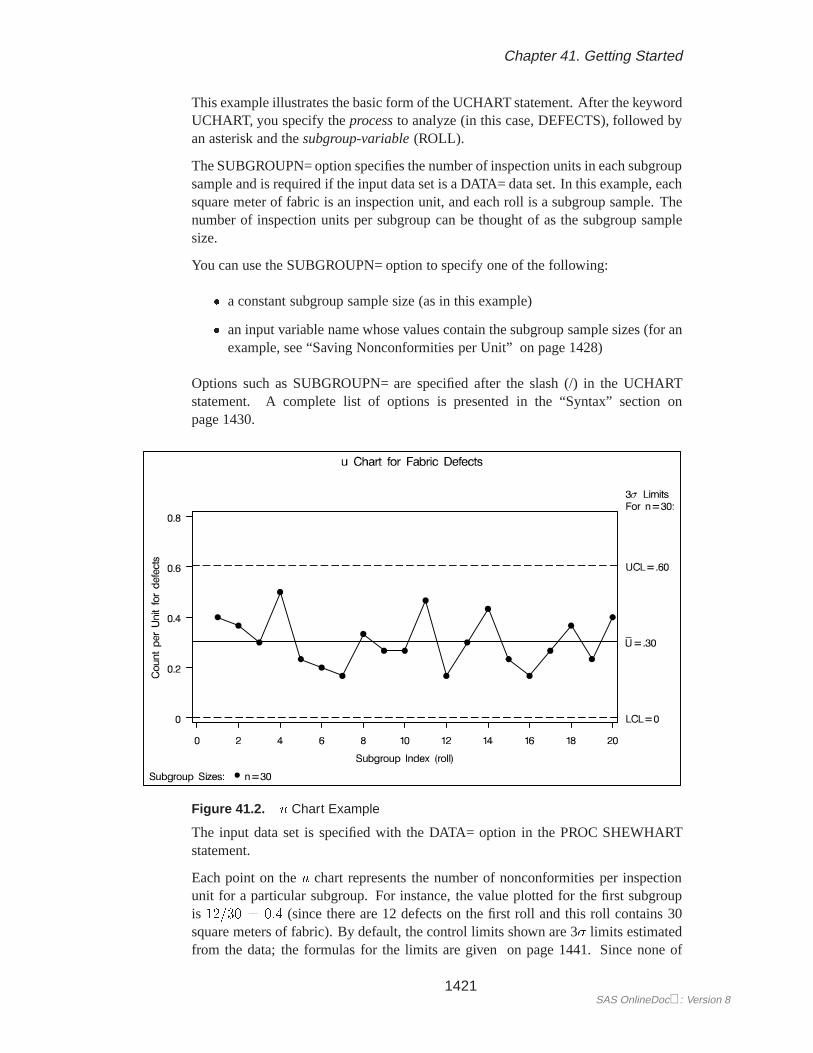
The following statements create theu chart shown in Figure 41.2:
title ’u Chart for Fabric Defects’;symbol v=dot;proc shewhart data=fabric;
uchart defects*roll / subgroupn=30;run;
SAS OnlineDoc: Version 81420
Chapter 41. Getting Started
This example illustrates the basic form of the UCHART statement. After the keywordUCHART, you specify theprocessto analyze (in this case, DEFECTS), followed byan asterisk and thesubgroup-variable(ROLL).
The SUBGROUPN= option specifies the number of inspection units in each subgroupsample and is required if the input data set is a DATA= data set. In this example, eachsquare meter of fabric is an inspection unit, and each roll is a subgroup sample. Thenumber of inspection units per subgroup can be thought of as the subgroup samplesize.
You can use the SUBGROUPN= option to specify one of the following:
� a constant subgroup sample size (as in this example)
� an input variable name whose values contain the subgroup sample sizes (for anexample, see “Saving Nonconformities per Unit” on page 1428)
Options such as SUBGROUPN= are specified after the slash (/) in the UCHARTstatement. A complete list of options is presented in the “Syntax” section onpage 1430.
Figure 41.2. u Chart Example
The input data set is specified with the DATA= option in the PROC SHEWHARTstatement.
Each point on theu chart represents the number of nonconformities per inspectionunit for a particular subgroup. For instance, the value plotted for the first subgroupis 12=30 = 0:4 (since there are 12 defects on the first roll and this roll contains 30square meters of fabric). By default, the control limits shown are 3� limits estimatedfrom the data; the formulas for the limits are given on page 1441. Since none of
1421SAS OnlineDoc: Version 8

Part 9. The CAPABILITY Procedure
the points exceed the3� limits, theu chart indicates that the fabric manufacturingprocess is in statistical control.
See “Constructing Charts for Nonconformities per Unit (u Charts)” on page 1440for details concerningu charts. For more details on reading defect count data, see“DATA= Data Set” on page 1445.
Saving Control Limits
You can save the control limits for au chart in a SAS data set; this enables you toSee SHWUCHRin the SAS/QCSample Library
apply the control limits to future data (see “Reading Preestablished Control Limits”on page 1424) or modify the limits with a DATA step program.
The following statements read defect counts from the data set FABRIC (seepage 1420) and save the control limits displayed in Figure 41.2 in a data set namedFABLIM:
title ’Control Limits Data Set FABLIM’;proc shewhart data=fabric;
uchart defects*roll / subgroupn=30outlimits=fablimnochart;
run;
The SUBGROUPN= option specifies the number of inspection units in each subgroupsample. The OUTLIMITS= option names the data set containing the control limits,and the NOCHART option suppresses the display of the chart. The data set FABLIMis listed in Figure 41.3.
Control Limits Data Set FABLIM_ _ _S L _ SU _ I A I _ _
_ B T M L G L UV G Y I P M C CA R P T H A L _ LR P E N A S U U U_ _ _ _ _ _ _ _ _
defects roll ESTIMATE 30 .002550178 3 .001671271 0.30333 0.60500
Figure 41.3. The Data Set FABLIM Containing Control Limit Information
The data set FABLIM contains one observation with the limits forprocessDEFECTS.The variables–LCLU– and–UCLU– contain the lower and upper control limits, andthe variable–U– contains the central line. The value of–LIMITN – is the nom-inal sample size associated with the control limits, and the value of–SIGMAS–is the multiple of� associated with the control limits. The variables–VAR– and
–SUBGRP– are bookkeeping variables that save theprocessandsubgroup-variable.The variable–TYPE– is a bookkeeping variable that indicates whether the value of
–U– is an estimate or standard value. For more information, see “OUTLIMITS=Data Set” on page 1442.
SAS OnlineDoc: Version 81422

Chapter 41. Getting Started
Alternatively, you can use the OUTTABLE= option to create an output data set thatsaves both the control limits and the subgroup statistics, as illustrated by the followingstatements:
title ’Number of Defects Per Square Meter and Control Limits’;proc shewhart data=fabric;
uchart defects*roll / subgroupn=30outtable=fabtabnochart;
run;
The data set FABTAB is listed in Figure 41.4.
Number of Defects Per Square Meter and Control Limits
_ _S L _I I _ _ _ _ E
_ G M S L S U XV r M I U C U C LA o A T B L B _ L IR l S N N U U U U M_ l _ _ _ _ _ _ _ _
defects 1 3 30 30 .001671271 0.40000 0.30333 0.60500defects 2 3 30 30 .001671271 0.36667 0.30333 0.60500defects 3 3 30 30 .001671271 0.30000 0.30333 0.60500defects 4 3 30 30 .001671271 0.50000 0.30333 0.60500defects 5 3 30 30 .001671271 0.23333 0.30333 0.60500defects 6 3 30 30 .001671271 0.20000 0.30333 0.60500defects 7 3 30 30 .001671271 0.16667 0.30333 0.60500defects 8 3 30 30 .001671271 0.33333 0.30333 0.60500defects 9 3 30 30 .001671271 0.26667 0.30333 0.60500defects 10 3 30 30 .001671271 0.26667 0.30333 0.60500defects 11 3 30 30 .001671271 0.46667 0.30333 0.60500defects 12 3 30 30 .001671271 0.16667 0.30333 0.60500defects 13 3 30 30 .001671271 0.30000 0.30333 0.60500defects 14 3 30 30 .001671271 0.43333 0.30333 0.60500defects 15 3 30 30 .001671271 0.23333 0.30333 0.60500defects 16 3 30 30 .001671271 0.16667 0.30333 0.60500defects 17 3 30 30 .001671271 0.26667 0.30333 0.60500defects 18 3 30 30 .001671271 0.36667 0.30333 0.60500defects 19 3 30 30 .001671271 0.23333 0.30333 0.60500defects 20 3 30 30 .001671271 0.40000 0.30333 0.60500
Figure 41.4. The Data Set FABTABThis data set contains one observation for each subgroup sample. The variables
–SUBU– and–SUBN– contain the number of nonconformities per unit in each sub-group and the number of inspection units per subgroup. The variables–LCLU– and
–UCLU– contain the lower and upper control limits, and the variable–U– containsthe central line. The variables–VAR– and ROLL contain theprocessname and val-ues of thesubgroup-variable, respectively. For more information, see “OUTTABLE=Data Set” on page 1444.
An OUTTABLE= data set can be read later as a TABLE= data set by the SHE-WHART procedure. For example, the following statements read FABTAB and dis-play au chart (not shown here) identical to the chart in Figure 41.2:
1423SAS OnlineDoc: Version 8

Part 9. The CAPABILITY Procedure
title ’u Chart for Fabric Defects’;proc shewhart table=fabtab;
uchart defects*roll / subgroupn=30;run;
Because the SHEWHART procedure simply displays the information in a TABLE=data set, you can use TABLE= data sets to create specialized control charts (see Chap-ter 49, “Specialized Control Charts”). For more information, see “TABLE= Data Set”on page 1447.
Reading Preestablished Control Limits
In the previous example, control limits were saved in a SAS data set named FABLIM.See SHWUCHRin the SAS/QCSample Library
This example shows how these limits can be applied to defect counts for an additional20 rolls of fabric, which are provided in the following data set:
data fabric2;input roll defects @@;datalines;
21 9 22 9 23 12 24 7 25 1426 5 27 4 28 13 29 6 30 731 11 32 10 33 7 34 11 35 836 8 37 3 38 10 39 9 40 13;
The following statements create au chart for the second group of rolls using thecontrol limits in FABLIM:
title ’u Chart for Fabric Defects’;proc shewhart data=fabric2 limits=fablim;
uchart defects*roll / subgroupn=30;run;
The chart is shown in Figure 41.5 and indicates that the process is in control.
SAS OnlineDoc: Version 81424

Chapter 41. Getting Started
Figure 41.5. A u Chart for Second Set of Fabric Rolls
The LIMITS= option in the PROC SHEWHART statement specifies the data set con-taining the control limits. By default,� this information is read from the first observa-tion in the LIMITS= data set for which
� the value of–VAR– matches theprocessDEFECTS� the value of–SUBGRP– matches thesubgroup-variablename ROLL
In this example, the LIMITS= data set was created in a previous run of the SHE-WHART procedure. You can also create a LIMITS= data set with the DATA step.See “LIMITS= Data Set” on page 1446 for details concerning the variables that youmust provide.
Creating u Charts from Nonconformities per Unit
In the previous example, the input data set provided the number of nonconformitiesSee SHWUCHRin the SAS/QCSample Library
for each subgroup sample. However, in some applications, as illustrated here, thedata provide the number of nonconformitiesper inspection unitfor each subgroup.
A clothing manufacturer ships shirts in boxes of ten. Prior to shipment, each shirtis inspected for flaws. Since the manufacturer is interested in the average numberof flaws per shirt, the number of flaws found in each box is divided by ten and thenrecorded. The following statements create a SAS data set named SHIRTS, whichcontains the average number of flaws per shirt for 25 boxes:
�In Release 6.09 and in earlier releases, it is also necessary to specify the READLIMITS option toread control limits from a LIMITS= data set.
1425SAS OnlineDoc: Version 8

Part 9. The CAPABILITY Procedure
data shirts;input box avgdefu @@;avgdefn=10;datalines;
1 0.4 2 0.7 3 0.5 4 1.0 5 0.36 0.2 7 0.0 8 0.4 9 0.4 10 0.6
11 0.2 12 0.7 13 0.3 14 0.1 15 0.316 0.6 17 0.6 18 0.3 19 0.7 20 0.321 0.0 22 0.1 23 0.5 24 0.6 25 0.4;
Note that this is the same data set used in “Getting Started” of Chapter 33, “CCHARTStatement.” A partial listing of SHIRTS is shown in Figure 41.6.
Average Number of Shirt Flaws
box avgdefu avgdefn
1 0.4 102 0.7 103 0.5 10. . .. . .. . .
Figure 41.6. The Data Set SHIRTS
The data set SHIRTS contains three variables: the box number (BOX), the av-erage number of flaws per shirt (AVGDEFU), and the number of shirts per box(AVGDEFN). Here, asubgroupis a box of shirts, and aninspection unitis an in-dividual shirt. Note that each subgroup contains ten inspection units.
To create au chart for the average number of flaws per shirt in each box, you canspecify SHIRTS as a HISTORY= data set.
title ’Total Flaws per Box of Shirts’;symbol v=dot;proc shewhart history=shirts;
uchart avgdef*box;run;
Note that AVGDEF isnot the name of a SAS variable in the data set but is, instead, thecommon prefix for the names of the SAS variables AVGDEFU and AVGDEFN. Thesuffix charactersU andN indicatenumber of nonconformities per unitandsamplesize, respectively. This naming convention enables you to specify two variables inthe HISTORY= data set with a single name, which is referred to as theprocess. Thename BOX, specified after the asterisk, is the name of thesubgroup-variable. Theuchart is shown in Figure 41.7.
SAS OnlineDoc: Version 81426

Chapter 41. Getting Started
Figure 41.7. A u Chart for Boxes of Shirts
In general, a HISTORY= input data set used with the UCHART statement must con-tain the following variables:
� subgroup variable� subgroup number of nonconformities per unit variable� subgroup sample size variable
Furthermore, the names of the nonconformities per unit and sample size variablesmust begin with theprocessname specified in the UCHART statement and end withthe special suffix charactersU andN, respectively. If the names do not follow thisconvention, you can use the RENAME option to rename the variables for the du-ration of the SHEWHART procedure step. Suppose that, instead of the variablesAVGDEFU and AVGDEFN, the data set SHIRTS contained the variables SHIRTDEFand SIZES. The following statements temporarily rename SHIRTDEF and SIZES toAVGDEFU and AVGDEFN:
proc shewharthistory=shirts (rename=(shirtdef = avgdefu
sizes = avgdefn ));uchart avgdef*box;
run;
For more information, see “HISTORY= Data Set” on page 1446.
1427SAS OnlineDoc: Version 8

Part 9. The CAPABILITY Procedure
Saving Nonconformities per Unit
In this example, the UCHART statement is used to create a summary data set con-See SHWUCHRin the SAS/QCSample Library
taining the number of nonconformities per unit. This data set can be read later by theSHEWHART procedure (as in the preceding example).
A department store receives boxes of shirts containing 10, 25, or 50 shirts. Eachbox is inspected, and the total number of defects per box is recorded. The followingstatements create a SAS data set named SHIRTS2, which contains the total defectsper box for 20 boxes:
data shirts2;input box flaws nshirts @@;datalines;
1 3 10 2 8 10 3 15 25 4 20 255 9 25 6 1 10 7 1 10 8 21 509 3 10 10 7 10 11 1 10 12 21 25
13 9 25 14 3 25 15 12 50 16 18 5017 7 10 18 4 10 19 8 10 20 4 10;
A partial listing of SHIRTS2 is shown in Figure 41.8.
Number of Shirt Flaws per Box
box avgdefu avgdefn
1 0.4 102 0.7 103 0.5 104 1.0 105 0.3 10. . .. . .. . .
Figure 41.8. The Data Set SHIRTS2
The variable BOX contains the box number, the variable FLAWS contains the numberof flaws in each box, and the variable NSHIRTS contains the number of shirts in eachbox. To evaluate the quality of the shirts, you should report the average number ofdefects per shirt. The following statements create a data set containing the number offlaws per shirt and the number of shirts per box:
title ’Average Defects Per Tee Shirt’;proc shewhart data=shirts2;
uchart flaws*box / subgroupn =nshirtsouthistory=shrthistnochart;
run;
SAS OnlineDoc: Version 81428

Chapter 41. Getting Started
The SUBGROUPN= option names the variable in the DATA= data set whose valuesspecify the number of inspection units per subgroup. The OUTHISTORY= optionnames an output data set containing the number of nonconformities per inspectionunit and the number of inspection units per subgroup. A partial listing of SHRTHISTis shown in Figure 41.9.
Average Defects Per Tee Shirt
box flawsU flawsN
1 0.30 102 0.80 103 0.60 254 0.80 255 0.36 25. . .. . .. . .
Figure 41.9. The Data Set SHRTHIST
There are three variables in the data set SHRTHIST.
� BOX contains the subgroup index.� FLAWSU contains the numbers of nonconformities per inspection unit.� FLAWSN contains the subgroup sample sizes.
Note that the variables containing the numbers of nonconformities per inspection unitand subgroup sample sizes are named by adding the suffix charactersU andN to theprocessFLAWS specified in the UCHART statement. In other words, the variablenaming convention for OUTHISTORY= data sets is the same as that for HISTORY=data sets.
For more information, see “OUTHISTORY= Data Set” on page 1443.
1429SAS OnlineDoc: Version 8

Part 9. The CAPABILITY Procedure
Syntax
The basic syntax for the UCHART statement is as follows:
UCHART process*subgroup-variable;
The general form of this syntax is as follows:
UCHART (processes)*subgroup-variable<(block-variables) >< =symbol-variablej =’character’ > < / options>;
You can use any number of UCHART statements in the SHEWHART procedure. Thecomponents of the UCHART statement are described as follows.
processprocesses
identify one or more processes to be analyzed. The specification ofprocessdependson the input data set specified in the PROC SHEWHART statement.
� If numbers of nonconformities per subgroup are read from a DATA= data set,processmust be the name of the variable containing the numbers of nonconfor-mities. For an example, see “Creating u Charts from Defect Count Data” onpage 1420.
� If numbers of nonconformities per unit and numbers of inspection units persubgroup are read from a HISTORY= data set,processmust be the commonprefix of the appropriate variables in the HISTORY= data set. For an example,see “Creating u Charts from Nonconformities per Unit” on page 1425.
� If numbers of nonconformities per item, numbers of inspection units per sub-group, and control limits are read from a TABLE= data set,processmust bethe value of the variable–VAR– in the TABLE= data set. For an example, see“Saving Control Limits” on page 1422.
A processis required. If you specify more than one process, enclose the list in paren-theses. For example, the following statements request distinctu charts for DEFECTSand FLAWS:
proc shewhart data=measures;uchart (defects flaws)*sample / subgroupn=50;
run;
Note that when data are read from a DATA= data set with the UCHART statement, theSUBGROUPN= option (which specifies the number of inspection units per subgroup)is required.
SAS OnlineDoc: Version 81430

Chapter 41. Syntax
subgroup-variableis the variable that identifies subgroups in the data. Thesubgroup-variableis re-quired. In the preceding UCHART statement, SAMPLE is the subgroup variable.For details, see “Subgroup Variables” on page 1534.
block-variablesare optional variables that group the data into blocks of consecutive subgroups. Theblocks are labeled in a legend, and eachblock-variableprovides one level of labels inthe legend. See “Displaying Stratification in Blocks of Observations” on page 1684for an example.
symbol-variableis an optional variable whose levels (unique values) determine the symbol marker orcharacter used to plot the number of nonconformities per unit.
� If you produce a chart on a line printer, an ‘A’ is displayed for the points cor-responding to the first level of thesymbol-variable, a ‘B’ is displayed for thepoints corresponding to the second level, and so on.
� If you produce a chart on a graphics device, distinct symbol markers are dis-played for points corresponding to the various levels of thesymbol-variable.You can specify the symbol markers with SYMBOLn statements. See “Dis-playing Stratification in Levels of a Classification Variable” on page 1683 foran example.
characterspecifies a plotting character for charts produced on line printers. For example, thefollowing statements create au chart using an asterisk (*) to plot the points:
proc shewhart data=values;uchart defects*sample=’*’ / subgroupn=100;
run;
optionsenhance the appearance of the chart, request additional analyses, save results in datasets, and so on. The “Summary of Options” section, which follows, lists all optionsby function. Chapter 46, “Dictionary of Options,” describes each option in detail.
1431SAS OnlineDoc: Version 8

Part 9. The CAPABILITY Procedure
Summary of Options
The following tables list the UCHART statement options by function. For completedescriptions, see Chapter 46, “Dictionary of Options.”
Table 41.1. Tabulation Options
TABLE creates a basic table of subgroup sample sizes, subgroup numbersof nonconformities per unit, and control limits
TABLEALL is equivalent to the options TABLE, TABLECENTRAL,TABLEID, TABLELEGEND, TABLEOUTLIM, andTABLETESTS
TABLECENTRAL augments basic table with values of central lines
TABLEID augments basic table with columns for ID variables
TABLELEGEND augments basic table with legend for tests for special causes
TABLEOUTLIM augments basic table with columns indicating control limitsexceeded
TABLETESTS augments basic table with a column indicating which tests forspecial causes are positive
Note that specifying (EXCEPTIONS) after a tabulation option creates a table forexceptional points only.
Table 41.2. Options for Specifying Tests for Special Causes
NO3SIGMACHECK allows tests to be applied with control limits other than3� limits
TESTS=value-listjcustomized-pattern-list
specifies tests for special causes
TEST2RUN=n specifies length of pattern for Test 2
TEST3RUN=n specifies length of pattern for Test 3
TESTACROSS applies tests acrossphaseboundaries
TESTLABEL=’label’ j(variable)jkeyword
provides labels for points where test is positive
TESTLABELn=’ label’ specifies label fornth test for special causes
TESTNMETHOD=STANDARDIZE
applies tests to standardized chart statistics
TESTOVERLAP performs tests on overlapping patterns of points
ZONELABELS adds labels A, B, and C to zone lines
ZONES adds lines delineating zones A, B, and C
ZONEVALPOS=n specifies position of ZONEVALUES labels
ZONEVALUES labels zone lines with their values
SAS OnlineDoc: Version 81432

Chapter 41. Syntax
Table 41.3. Graphical Options for Displaying Tests for Special Causes
CTESTS=colorjtest-color-list
specifies color for labels indicating points where test is positive
CZONES=color specifies color for lines and labels delineating zones A, B, and C
LABELFONT=font specifies software font for labels at points where test is positive(alias for the TESTFONT= option)
LABELHEIGHT=value specifies height of labels at points where test is positive (alias forthe TESTHEIGHT= option)
LTESTS=linetype specifies type of line connecting points where test is positive
LZONES=linetype specifies line type for lines delineating zones A, B, and C
TESTFONT=font specifies software font for labels at points where test is positive
TESTHEIGHT=value specifies height of labels at points where test is positive
Table 41.4. Line Printer Options for Displaying Tests for Special Causes
TESTCHAR=’character’ specifies character for line segments that connect any sequenceof points for which a test for special causes is positive
ZONECHAR=’character’ specifies character for lines that delineate zones for tests for spe-cial causes
Table 41.5. Reference Line Options
CHREF=color specifies color for lines requested by the HREF= option
CVREF=color specifies color for lines requested by the VREF= option
HREF=valuesjSAS-data-set
specifies position of reference lines perpendicular to horizontalaxis onu chart
HREFCHAR=’character’ specifies line character for HREF= lines
HREFDATA=SAS-data-set
specifies position of reference lines perpendicular to horizontalaxis onu chart
HREFLABELS=’label1’...’labeln’
specifies labels for HREF= lines
HREFLABPOS=n specifies position of HREFLABELS= labels
LHREF=linetype specifies line type for HREF= lines
LVREF=linetype specifies line type for VREF= lines
NOBYREF specifies that reference line information in a data set is to be ap-plied uniformly to charts created for all BY groups
VREF=valuesjSAS-data-set
specifies position of reference lines perpendicular to vertical axis
VREFCHAR=’character’ specifies line character for VREF= lines
VREFLABELS=’label1’...’labeln’
specifies labels for VREF= lines
VREFLABPOS=n specifies position of VREFLABELS= labels
1433SAS OnlineDoc: Version 8

Part 9. The CAPABILITY Procedure
Table 41.6. Clipping Options
CCLIP=color specifies color for plot symbol for clipped points
CLIPCHAR=’character’ specifies plot character for clipped points
CLIPFACTOR=value determines extent to which extreme points are clipped
CLIPLEGEND=’string’ specifies text for clipping legend
CLIPLEGPOS=keyword specifies position of clipping legend
CLIPSUBCHAR=’character’
specifies substitution character for CLIPLEGEND= text
CLIPSYMBOL=symbol specifies plot symbol for clipped points
CLIPSYMBOLHT=value specifies symbol marker height for clipped points
Table 41.7. Axis and Axis Label Options
CAXIS=color specifies color for axis lines and tick marks
CFRAME=colorj(color-list)
specifies fill colors for frame for plot area
CTEXT=color specifies color for tick mark values and axis labels
HAXIS=valuesjAXISn specifies major tick mark values for horizontal axis
HEIGHT=value specifies height of axis label and axis legend text
HMINOR=n specifies number of minor tick marks between major tick markson horizontal axis
HOFFSET=value specifies length of offset at both ends of horizontal axis
INTSTART=value specifies first major tick mark value for numeric horizontal axis
NOHLABEL suppresses label for horizontal axis
NOTICKREP specifies that only the first occurrence of repeated, adjacent sub-group values is to be labeled on horizontal axis
NOTRUNC suppresses vertical axis truncation at zero applied by default
NOVANGLE requests vertical axis labels that are strung out vertically
SKIPHLABELS=n specifies thinning factor for tick mark labels on horizontal axis
TURNHLABELS requests horizontal axis labels that are strung out vertically
VAXIS=valuesjAXISn specifies major tick mark values for vertical axis
VMINOR=n specifies number of minor tick marks between major tick markson vertical axis
VOFFSET=value specifies length of offset at both ends of vertical axis
VZERO forces origin to be included in vertical axis for primary chart
VZERO2 forces origin to be included in vertical axis for secondary chart
WAXIS=n specifies width of axis lines
SAS OnlineDoc: Version 81434

Chapter 41. Syntax
Table 41.8. Options for Specifying Control Limits
ALPHA=value requests probability limits for control charts
LIMITN= njVARYING specifies either nominal sample size for fixed control limits orvarying limits
NOREADLIMITS computes control limits for eachprocessfrom the data rather thanfrom a LIMITS= data set (Release 6.10 and later releases)
READALPHA reads the variable–ALPHA– instead of the variable–SIGMAS–from a LIMITS= data set
READINDEXES=ALLj’ label1’...’ labeln’
reads multiple sets of control limits for eachprocessfrom a LIM-ITS= data set
READLIMITS reads single set of control limits for eachprocessfrom a LIM-ITS= data set (Release 6.09 and earlier releases)
SIGMAS=k specifies width of control limits in terms of multiplek of standarderror of plotted statistic
Table 41.9. Options for Displaying Control Limits
CINFILL=color specifies color for area inside control limits
CLIMITS=color specifies color of control limits, central line, and related labels
LCLLABEL=’ label’ specifies label for lower control limit
LIMLABSUBCHAR=’character’
specifies a substitution character for labels provided as quotedstrings; the character is replaced with the value of the controllimit
LLIMITS= linetype specifies line type for control limits
NDECIMAL=n specifies number of digits to right of decimal place in defaultlabels for control limits and central line
NOCTL suppresses display of central line onu chart
NOLCL suppresses display of lower control limit
NOLIMITLABEL suppresses labels for control limits and central line
NOLIMITS suppresses display of control limits
NOLIMITSFRAME suppresses default frame around control limit information whenmultiple sets of control limits are read from a LIMITS= data set
NOLIMITSLEGEND suppresses legend for control limits
NOLIMIT0 suppresses display of zero lower control limit foru chart
NOUCL suppresses display of upper control limit
UCLLABEL=’ string’ specifies label for upper control limit
USYMBOL=’string’ jkeyword
specifies label for central line
WLIMITS=n specifies width for control limits and central line
1435SAS OnlineDoc: Version 8

Part 9. The CAPABILITY Procedure
Table 41.10. Grid Options
ENDGRID adds grid after last plotted point
GRID adds grid to control chart
LENDGRID=linetype specifies line type for grid requested with the ENDGRID option
LGRID=linetype specifies line type for grid requested with the GRID option
WGRID=n specifies width of grid lines
Table 41.11. Options for Plotting and Labeling Points
ALLLABEL=VALUE j(variable)
labels every point
CCONNECT=color specifies color for line segments that connect points on chart
CFRAMELAB=color specifies fill color for frame around labeled points
CNEEDLES=color specifies color for needles that connect points to central line
CONNECTCHAR=’character’
specifies character used to form line segments that connect pointson chart
COUT=color specifies color for portions of line segments that connect pointsoutside control limits
COUTFILL=color specifies color for shading areas between the connected pointsand control limits outside the limits
NEEDLES connects points to central line with vertical needles
NOCONNECT suppresses line segments that connect points on chart
OUTLABEL=VALUE j(variable)
labels points outside control limits
SYMBOLCHARS=’characters’
specifies characters indicatingsymbol-variable
SYMBOLLEGEND=NONEjname
specifies LEGEND statement for levels ofsymbol-variable
SYMBOLORDER=keyword
specifies order in which symbols are assigned for levels ofsymbol-variable
TURNALL jTURNOUT turns point labels so that they are strung out vertically
Table 41.12. Options for Interactive Control Charts
HTML=(variable) specifies a variable whose values are URLs to be associatedwith subgroups
HTML–LEGEND=(variable)
specifies a variable whose values are URLs to be associatedwith symbols in the symbol legend
TESTURLS=SAS-data-set associates URLs with tests for special causes
WEBOUT=SAS-data-set creates an OUTTABLE= data set with additional graphics co-ordinate data
SAS OnlineDoc: Version 81436

Chapter 41. Syntax
Table 41.13. Block Variable Legend Options
BLOCKLABELPOS=keyword
specifies position of label forblock-variablelegend
BLOCKLABTYPE=valuejkeyword
specifies text size ofblock-variablelegend
BLOCKPOS=n specifies vertical position ofblock-variablelegend
BLOCKREP repeats identical consecutive labels inblock-variablelegend
CBLOCKLAB=color specifies color for filling background inblock-variablelegend
CBLOCKVAR=variablej(variables)
specifies one or more variables whose values are colors for fillingbackground ofblock-variablelegend
Table 41.14. Phase Options
CPHASEBOX=color specifies color for box enclosing all plotted points for a phase
CPHASEBOX-CONNECT=color
specifies color for line segments connecting adjacent enclosingboxes
CPHASEBOXFILL=color specifies fill color for box enclosing all plotted points for a phase
CPHASELEG=color specifies text color forphaselegend
CPHASEMEAN-CONNECT=color
specifies color for line segments connecting average value pointswithin a phase
NOPHASEFRAME suppresses default frame forphaselegend
OUTPHASE=’string’ specifies value of the variable–PHASE– in theOUTHISTORY= data set
PHASEBREAK disconnects last point in aphasefrom first point in nextphase
PHASELABTYPE=valuejkeyword
specifies text size ofphaselegend
PHASELEGEND displaysphaselabels in a legend across top of chart
PHASELIMITS labels control limits for each phase, provided they are constantwithin that phase
PHASEMEANSYMBOL=symbol
specifies symbol marker for average of values within a phase
PHASEREF delineatesphaseswith vertical reference lines
READPHASES= ALLj’ label1’...’ labeln’
specifiesphasesto be read from an input data set
Table 41.15. Standard Value Options
TYPE=keyword identifies whether parameters are estimates or standard valuesand specifies value of the variable–TYPE– in the OUTLIMITS=data set
U0=value specifies known average number of nonconformities per unit
1437SAS OnlineDoc: Version 8

Part 9. The CAPABILITY Procedure
Table 41.16. Input Data Set Option
MISSBREAK specifies that observations with missing values are not to beprocessed
SUBGROUPN=njvariable
specifies subgroup sample sizes as constant numbern or as val-ues ofvariable in the DATA= data set
Table 41.17. Output Data Set Options
OUTHISTORY=SAS-data-set
creates output data set containing subgroup numbers of noncon-formities per unit and subgroup sample sizes
OUTINDEX=’string’ specifies value of the variable–INDEX– in the OUTLIMITS=data set
OUTLIMITS=SAS-data-set
creates output data set containing control limits
OUTTABLE=SAS-data-set
creates output data set containing subgroup numbers of noncon-formities per unit, subgroup sample sizes, and control limits
Table 41.18. Plot Layout Options
ALLN plots numbers of nonconformities per unit for all subgroups
BILEVEL creates control charts using half-screens and half-pages
EXCHART creates control charts for a process variable only when exceptionsoccur
INTERVAL=keyword specifies natural time interval between consecutive subgroup po-sitions when time, date, or datetime format is associated with anumeric subgroup variable
MAXPANELS=n specifies maximum number of pages or screens for chart
NMARKERS requests special markers for points corresponding to sample sizesnot equal to nominal sample size for fixed control limits
NOCHART suppresses creation of chart
NOFRAME suppresses frame for plot area
NOLEGEND suppresses legend for subgroup sample sizes
NPANELPOS=n specifies number of subgroup positions per panel on each chart
REPEAT repeats last subgroup position on panel as first subgroup positionof next panel
TOTPANELS=n specifies number of pages or screens to be used to display chart
ZEROSTD displaysu chart regardless of whether�̂ = 0
SAS OnlineDoc: Version 81438

Chapter 41. Syntax
Table 41.19. Graphical Enhancement Options
ANNOTATE=SAS-data-set
specifies annotate data set that adds features to chart
DESCRIPTION=’string’ specifies string that appears in the description field of the PROCGREPLAY master menu
FONT=font specifies software font for labels and legends on charts
NAME=’ string’ specifies name that appears in the name field of the PROCGREPLAY master menu
PAGENUM=’string’ specifies the form of the label used in pagination
PAGENUMPOS=keyword
specifies the position of the page number requested with thePAGENUM= option
Table 41.20. Star Options
CSTARCIRCLES=color specifies color for circles specified by the STARCIRCLES=option
CSTARFILL=colorj(variable)
specifies color for filling stars
CSTAROUT=color specifies outline color for stars exceeding inner or outer circles
CSTARS=colorj (variable) specifies color for outlines of stars
LSTARCIRCLES=linetypes
specifies line types STARCIRCLES= circles
LSTARS=linetypej(variable)
specifies line types for outlines of stars requested with theSTARVERTICES= option
STARBDRADIUS=value specifies radius of outer bound circle for vertices of stars
STARCIRCLES=value-list specifies reference circles for stars
STARINRADIUS=value specifies inner radius of stars
STARLABEL=keyword specifies vertices to be labeled
STARLEGEND=keyword specifies style of legend for star vertices
STARLEGENDLAB=’label’
specifies label for STARLEGEND= legend
STAROUTRADIUS=value specifies outer radius of stars
STARSPEC=valuejSAS-data-set
specifies method used to standardize vertex variables
STARSTART=value specifies angle for first vertex
STARTYPE=keyword specifies graphical style of star
STARVERTICES=variablej(variables)
superimposes star at each point on chart
WSTARCIRCLES=n specifies width of circles requested by the STARCIRCLES=option
WSTARS=n specifies width of stars requested by the STARVERTICES=option
1439SAS OnlineDoc: Version 8

Part 9. The CAPABILITY Procedure
Details
Constructing Charts for Nonconformities per Unit (u Charts)
The following notation is used in this section:
u expected number of nonconformities per unit produced by processui number of nonconformities per unit in theith subgroup. In general,ui = ci=ni.ci total number of nonconformities in theith subgroupni number of inspection units in theith subgroup�u average number of nonconformities per unit taken across subgroups. The quantity
�u is computed as a weighted average:
�u =n1u1 + � � � + nNuN
n1 + � � �+ nN=
c1 + � � �+ cNn1 + � � �+ nN
N number of subgroups�2� has a central�2 distribution with� degrees of freedom
Plotted PointsEach point on au chart indicates the number of nonconformities per unit (ui) ina subgroup. For example, Figure 41.10 displays three sections of pipeline that areinspected for defective welds (indicated by anX). Each section represents asubgroupcomposed of a number ofinspection units, which are 1000-foot-long sections. Thenumber of units in theith subgroup is denoted byni, which is the subgroup samplesize.
2.5 2 0.8
1.0 2
2.0 1 0.5
1000 feet n i c u ii
X
X X
X X
2.0
Subgroup 1
Subgroup 2
Subgroup 3
One unit =
Figure 41.10. Terminology for c Charts and u Charts
SAS OnlineDoc: Version 81440

Chapter 41. Details
Thenumber of nonconformitiesin the ith subgroup is denoted byci. Thenumber ofnonconformities per unitin the ith subgroup is denoted byui = ci=ni. In Figure41.10, the number of defective welds per unit in the third subgroup isu3 = 2=2:5 =
0:8.
A u chart plots the quantityui for theith subgroup. Ac chart plots the quantityci forthe ith subgroup (see Chapter 33, “CCHART Statement”). An advantage of au chartis that the value of the central line at theith subgroup does not depend onni. Thisis not the case for ac chart, and consequently, au chart is often preferred when thenumber of unitsni is not constant across subgroups.
Central LineOn au chart, the central line indicates an estimate ofu, which is computed as�u bydefault. If you specify a known value (u0) for u, the central line indicates the valueof u0.
Control LimitsYou can compute the limits in the following ways:
� as a specified multiple (k) of the standard error ofui above and below thecentral line. The default limits are computed withk = 3 (these are referred toas3� limits).
� as probability limits defined in terms of�, a specified probability thatui ex-ceeds the limits
The lower and upper control limits, LCLU and UCLU, respectively, are given by
LCLU = max��u� k
p�u=ni ; 0
�
UCLU = �u+ kp
�u=ni
The limits vary withni.
The upper probability limit UCLU forui can be determined using the fact that
Pfui > UCLUg = 1� Pfui � UCLUg= 1� Pfci � niUCLUg= 1� Pf�22(ni(UCLU+1)) � 2ni�ug
The limit UCLU is then calculated by setting
1� Pf�22(ni(UCLU+1)) � 2ni�ug = �=2
and solving for UCLU.
Likewise, the lower probability limit LCLC forui can be determined using the factthat
Pfui < LCLCg = Pfci < niLCLUg= Pf�22(ni(LCLC+1) > 2ni�ug
1441SAS OnlineDoc: Version 8

Part 9. The CAPABILITY Procedure
The limit LCLC is then calculated by setting
Pf�22(ni(LCLC+1) > 2ni�ug = �=2
and solving for LCLC. For more information, refer to Johnson, Kotz, and Kemp(1992). This assumes that the process is in statistical control and thatci has a Poissondistribution. Note that the probability limits vary withni and are asymmetric aroundthe central line. If a standard valueu0 is available foru, replace�u with u0 in theformulas for the control limits.
You can specify parameters for the limits as follows:
� Specify k with the SIGMAS= option or with the variable–SIGMAS– in aLIMITS= data set.
� Specify� with the ALPHA= option or with the variable–ALPHA– in a LIM-ITS= data set.
� Specify a constant nominal sample sizeni � n for the control limits with theLIMITN= option or with the variable–LIMITN – in a LIMITS= data set.
� Specifyu0 with the U0= option or with the variable–U– in a LIMITS= dataset.
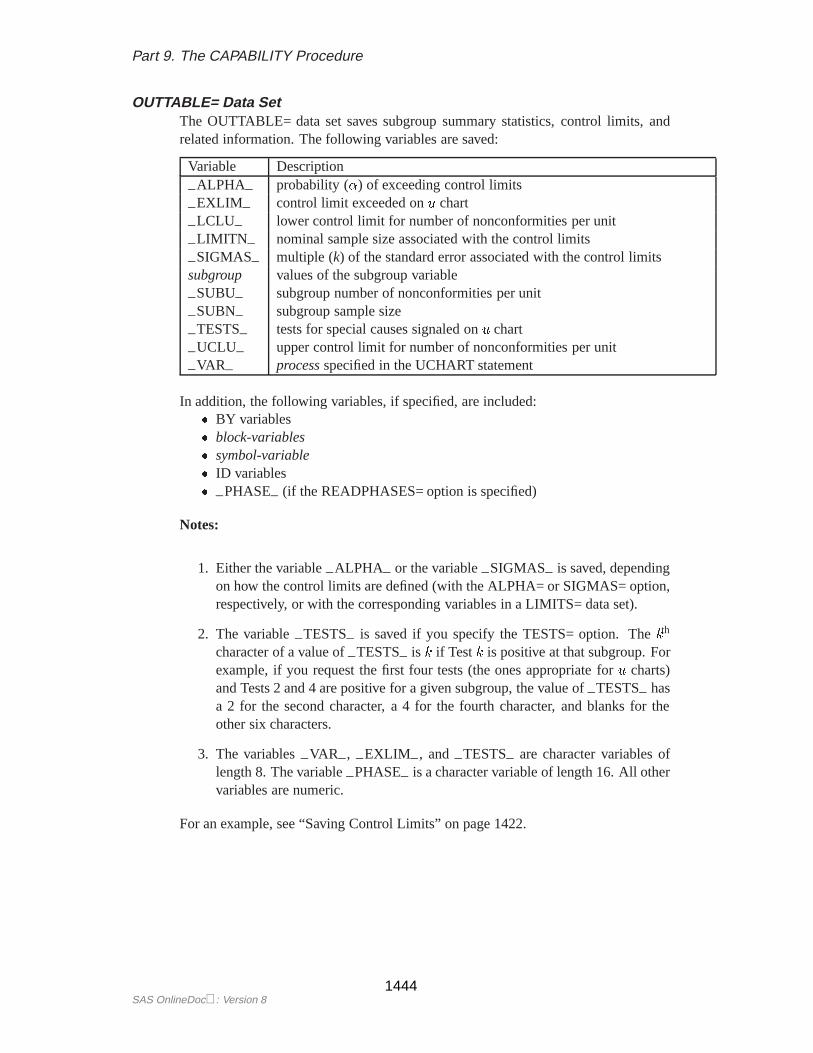
Output Data Sets
OUTLIMITS= Data SetThe OUTLIMITS= data set saves control limits and control limit parameters. Thefollowing variables can be saved:
Table 41.21. OUTLIMITS= Data Set
Variable Description
–ALPHA– probability (�) of exceeding limits
–INDEX– optional identifier for the control limits specified with theOUTINDEX= option
–LCLU– lower control limit for number of nonconformities per unit
–LIMITN – sample size associated with the control limits
–SIGMAS– multiple (k) of standard error ofui
–SUBGRP– subgroup-variablespecified in the UCHART statement
–TYPE– type (estimate or standard value) of–U––U– value of central line ofu chart (�u or u0)
–UCLU– upper control limit for number of nonconformities per unit
–VAR– processspecified in the UCHART statement
Notes:
1. If the control limits vary with subgroup sample size, the special missing valueV is assigned to the variables–LCLU–, –UCLU–, and–LIMITN –.
SAS OnlineDoc: Version 81442

Chapter 41. Details
2. If the limits are defined in terms of a multiplek of the standard error ofui, thevalue of–ALPHA– is computed asPfui < –LCLU–g+Pfui > –UCLU–g ,provided thatni is a constant. Otherwise,–ALPHA– is assigned the specialmissing valueV.
3. If the limits are probability limits, the value of–SIGMAS– is computed as(–UCLU– � –U–)=
p–U–=–LIMITN – , provided thatni is a constant. Oth-
erwise,–SIGMAS– is assigned the special missing valueV.
4. Optional BY variables are saved in the OUTLIMITS= data set.
The OUTLIMITS= data set contains one observation for eachprocessspecified in theUCHART statement. For an example, see “Saving Control Limits” on page 1422.
OUTHISTORY= Data SetThe OUTHISTORY= data set saves subgroup summary statistics. The followingvariables are saved:
� thesubgroup-variable
� a subgroup number of nonconformities per unit variable named byprocesssuf-fixed with U
� a subgroup sample size variable named byprocesssuffixed withN
Given aprocessname that contains eight characters, the procedure first shortens thename to its first four characters and its last three characters, and then it adds the suffix.For example, the procedure shortens theprocessNDEFECTS to NDEFCTS beforeadding the suffix.
Subgroup summary variables are created for eachprocessspecified in the UCHARTstatement. For example, consider the following statements:
proc shewhart data=fabric;uchart (flaws ndefects)*lot / outhistory=summary
subgroupn = 10;run;
The data set SUMMARY contains the variables LOT, FLAWSU, FLAWSN,NDEFCTSU, and NDEFCTSN.
Additionally, the following variables, if specified, are included:
� BY variables� block-variables� symbol-variable� ID variables� –PHASE– (if the OUTPHASE= option is specified)
For an example of an OUTHISTORY= data set, see “Saving Nonconformities perUnit” on page 1428. Note that an OUTHISTORY= data set created with theUCHART statement can be used as a HISTORY= data set by either the CCHARTstatement or the UCHART statement.
1443SAS OnlineDoc: Version 8
Part 9. The CAPABILITY Procedure
OUTTABLE= Data SetThe OUTTABLE= data set saves subgroup summary statistics, control limits, andrelated information. The following variables are saved:
Variable Description
–ALPHA– probability (�) of exceeding control limits
–EXLIM – control limit exceeded onu chart
–LCLU– lower control limit for number of nonconformities per unit
–LIMITN – nominal sample size associated with the control limits
–SIGMAS– multiple (k) of the standard error associated with the control limitssubgroup values of the subgroup variable
–SUBU– subgroup number of nonconformities per unit
–SUBN– subgroup sample size
–TESTS– tests for special causes signaled onu chart
–UCLU– upper control limit for number of nonconformities per unit
–VAR– processspecified in the UCHART statement
In addition, the following variables, if specified, are included:� BY variables� block-variables� symbol-variable� ID variables� –PHASE– (if the READPHASES= option is specified)
Notes:
1. Either the variable–ALPHA– or the variable–SIGMAS– is saved, dependingon how the control limits are defined (with the ALPHA= or SIGMAS= option,respectively, or with the corresponding variables in a LIMITS= data set).
2. The variable–TESTS– is saved if you specify the TESTS= option. Thekth
character of a value of–TESTS– is k if Testk is positive at that subgroup. Forexample, if you request the first four tests (the ones appropriate foru charts)and Tests 2 and 4 are positive for a given subgroup, the value of–TESTS– hasa 2 for the second character, a 4 for the fourth character, and blanks for theother six characters.
3. The variables–VAR–, –EXLIM –, and–TESTS– are character variables oflength 8. The variable–PHASE– is a character variable of length 16. All othervariables are numeric.
For an example, see “Saving Control Limits” on page 1422.
SAS OnlineDoc: Version 81444

Chapter 41. Details
ODS Tables
The following table summarizes the ODS tables that you can request with theUCHART statement.
Table 41.22. ODS Tables Produced with the UCHART Statement
Table Name Description OptionsUCHART u chart summary statistics TABLE, TABLEALL, TABLEC,
TABLEID, TABLELEG,TABLEOUT, TABLETESTS
Tests descriptions of tests forspecial causes requestedwith the TESTS= option forwhich at least one positivesignal is found
TABLEALL, TABLELEG
Input Data Sets
DATA= Data SetYou can read defect counts for subgroup samples from a DATA= data set specified inthe PROC SHEWHART statement. Eachprocessspecified in the UCHART statementmust be a SAS variable in the data set. This variable provides the defect count (num-ber of nonconformities) for subgroup samples indexed by thesubgroup-variable. Thesubgroup-variable, specified in the UCHART statement, must also be a SAS variablein the DATA= data set. Each observation in a DATA= data set must contain a valuefor eachprocessand a value for thesubgroup-variable. The data set should containone observation per subgroup. When you use a DATA= data set with the UCHARTstatement, the SUBGROUPN= option (which specifies the number of inspection unitsper subgroup) is required. Other variables that can be read from a DATA= data setinclude
� –PHASE– (if the READPHASES= option is specified)� block-variables� symbol-variable� BY variables� ID variables
By default, the SHEWHART procedure reads all of the observations in a DATA= dataset. However, if the data set includes the variable–PHASE–, you can read selectedgroups of observations (referred to asphases) with the READPHASES= option (foran example, see “Displaying Stratification in Phases” on page 1689).
For an example of a DATA= data set, see “Creating u Charts from Defect Count Data”on page 1420.
1445SAS OnlineDoc: Version 8

Part 9. The CAPABILITY Procedure
LIMITS= Data SetYou can read preestablished control limits (or parameters from which the control lim-its can be calculated) from a LIMITS= data set specified in the PROC SHEWHARTstatement. For example, the following statements read control limit information fromthe data set CONLIMS:�
proc shewhart data=info limits=conlims;uchart defects*lot / subgroupn = 10;
run;
The LIMITS= data set can be an OUTLIMITS= data set that was created in a previ-ous run of the SHEWHART procedure. Such data sets always contain the variablesrequired for a LIMITS= data set. The LIMITS= data set can also be created directlyusing a DATA step. When you create a LIMITS= data set, you must provide one ofthe following:
� the variables–LCLU–, –U–, and–UCLU–, which specify the control limits� the variable–U–, which is used to calculate the control limits (see page 1441)
In addition, note the following:
� The variables–VAR– and–SUBGRP– are required. These must be charactervariables of length 8.
� The variable–INDEX– is required if you specify the READINDEX= option;this must be a character variable of length 16.
� The variables–LIMITN –, –SIGMAS– (or –ALPHA–), and–TYPE– are op-tional, but they are recommended to maintain a complete set of control limitinformation. The variable–TYPE– must be a character variable of length 8;valid values areESTIMATEandSTANDARD.
� BY variables are required if specified with a BY statement.
For an example, see “Reading Preestablished Control Limits” on page 1424.
HISTORY= Data SetYou can read subgroup summary statistics from a HISTORY= data set specified inthe PROC SHEWHART statement. This allows you to reuse OUTHISTORY= datasets that have been created in previous runs of the SHEWHART procedure or to readoutput data sets created with SAS summarization procedures.
A HISTORY= data set used with the UCHART statement must contain the followingvariables:
� subgroup-variable� subgroup number of nonconformities per unit variable for eachprocess� subgroup sample size variable (number of units per subgroup) for eachprocess
The names of the variables containing the number of nonconformities per unit andsubgroup sample sizes must be theprocessname concatenated with the special suffixcharactersU andN , respectively. For example, consider the following statements:
�In Release 6.09 and in earlier releases, it is necessary to specify the READLIMITS option.
SAS OnlineDoc: Version 81446

Chapter 41. Details
proc shewhart history=summary;uchart (flaws ndefects)*lot;
run;
The data set SUMMARY must include the variables LOT, FLAWSU, FLAWSN,NDEFCTSU, and NDEFCTSN.
Note that if you specify aprocessname that contains eight characters, the names ofthe summary variables must be formed from the first four characters and the last threecharacters of theprocessname, suffixed with the appropriate character.
Other variables that can be read from a HISTORY= data set include
� –PHASE– (if the READPHASES= option is specified)� block-variables� symbol-variable� BY variables� ID variables
By default, the SHEWHART procedure reads all the observations in a HISTORY=data set. However, if the data set includes the variable–PHASE–, you can readselected groups of observations (referred to asphases) with the READPHASES=option (see “Displaying Stratification in Phases” on page 1689 for an example).
For an example of a HISTORY= data set, see “Creating u Charts from Nonconformi-ties per Unit” on page 1425.
TABLE= Data SetYou can read summary statistics and control limits from a TABLE= data set specifiedin the PROC SHEWHART statement. This enables you to reuse an OUTTABLE=data set created in a previous run of the SHEWHART procedure or to create yourown TABLE= data set. Because the SHEWHART procedure simply displays the in-formation read from a TABLE= data set, you can use TABLE= data sets to createspecialized control charts. Examples are provided in Chapter 49, “Specialized Con-trol Charts.”
The following table lists the variables required in a TABLE= data set used with theUCHART statement:
Table 41.23. Variables Required in a TABLE= Data Set
Variable Description
–LCLU– lower control limit for nonconformities per unit
–LIMITN – nominal sample size associated with the control limits
subgroup-variable values of thesubgroup-variable
–SUBN– subgroup sample size
–SUBU– subgroup number of nonconformities per unit
–U– average number of nonconformities per unit
–UCLU– upper control limit for nonconformities per unit
1447SAS OnlineDoc: Version 8

Part 9. The CAPABILITY Procedure
Other variables that can be read from a TABLE= data set include
� block-variables
� symbol-variable
� BY variables
� ID variables
� –PHASE– (if the READPHASES= option is specified). This variable must bea character variable of length 16.
� –TESTS– (if the TESTS= option is specified). This variable is used to flagtests for special causes and must be a character variable of length 8.
� –VAR–. This variable is required if more than oneprocessis specified or if thedata set contains information for more than oneprocess. This variable must bea character variable of length 8.
For an example of a TABLE= data set, see “Saving Control Limits” on page 1422.
Axis Labels
You can specify axis labels by assigning labels to particular variables in the input dataset, as summarized in the following table:
Axis Input Data Set VariableHorizontal all subgroup-variableVertical DATA= processVertical HISTORY= subgroup defects per unit variableVertical TABLE= –SUBU–
For an example, see “Labeling Axes” on page 1719.
Missing Values
An observation read from a DATA=, HISTORY=, or TABLE= data set is not analyzedif the value of the subgroup variable is missing. For a particular process variable, anobservation read from a DATA= data set is not analyzed if the value of the processvariable is missing. Missing values of process variables generally lead to unequalsubgroup sample sizes. For a particular process variable, an observation read froma HISTORY= or TABLE= data set is not analyzed if the values of any of the corre-sponding summary variables are missing.
SAS OnlineDoc: Version 81448

Chapter 41. Examples
Examples
This section provides advanced examples of the UCHART statement.
Example 41.1. Applying Tests for Special Causes
This example illustrates how you can apply tests for special causes to makeu charts See SHWUEX1in the SAS/QCSample Library
more sensitive to special causes of variation.
A textile company inspects rolls of fabric for defects. The rolls are one meter wideand 30 meters long. The following statements create a SAS data set named FABRIC3,which contains the number of fabric defects for 20 rolls of fabric:
data fabric3;input roll defects @@;datalines;
1 6 2 9 3 14 4 175 3 6 8 7 9 8 29 14 10 1 11 3 12 5
13 6 14 9 15 10 16 1217 11 18 4 19 9 20 4;
The following statements create au chart and tabulate the information on the chart.The chart and tables are shown in Output 41.1.1 and Output 41.1.2.
symbol v=dot;title1 ’u Chart for Fabric Defects’;title2 ’Tests=1 to 4’;proc shewhart data=fabric3;
uchart defects*roll / subgroupn=30tests =1 to 4ltests =20zonelabelstabletests;
run;
The TESTS= option requests Tests 1, 2, 3, and 4, which are described in Chap-ter 48, “Tests for Special Causes.” Only Tests 1, 2, 3, and 4 are recommended foru charts. The ZONELABELS option requests the zone lines, which are used todefine the tests, and displays labels for the zones. The LTESTS= option specifiesthe line type used to connect the points in a pattern for a test that is signaled. TheTABLETESTS option requests a table of the values ofui and the control limits, to-gether with a column indicating the subgroups at which the tests are positive.
Output 41.1.1 and Output 41.1.2 indicate that Test 1 is positive for Roll 4 and Test 3is positive at Roll 15.
1449SAS OnlineDoc: Version 8

Part 9. The CAPABILITY Procedure
Output 41.1.1. Tests for Special Causes Displayed on u Chart
Output 41.1.2. Tabular Form of u Chart
u Chart for Fabric DefectsTests=1 to 4
u Chart Summary for defects
-3 Sigma Limits with n=30 for Count per Unit-Subgroup Subgroup Special
Sample Lower Count Upper Testsroll Size Limit per Unit Limit Signaled
1 30.0000 0 0.20000000 0.539284802 30.0000 0 0.30000000 0.539284803 30.0000 0 0.46666667 0.539284804 30.0000 0 0.56666667 0.53928480 15 30.0000 0 0.10000000 0.539284806 30.0000 0 0.26666667 0.539284807 30.0000 0 0.30000000 0.539284808 30.0000 0 0.06666667 0.539284809 30.0000 0 0.46666667 0.53928480
10 30.0000 0 0.03333333 0.5392848011 30.0000 0 0.10000000 0.5392848012 30.0000 0 0.16666667 0.5392848013 30.0000 0 0.20000000 0.5392848014 30.0000 0 0.30000000 0.5392848015 30.0000 0 0.33333333 0.53928480 316 30.0000 0 0.40000000 0.5392848017 30.0000 0 0.36666667 0.5392848018 30.0000 0 0.13333333 0.5392848019 30.0000 0 0.30000000 0.5392848020 30.0000 0 0.13333333 0.53928480
SAS OnlineDoc: Version 81450
Chapter 41. Examples
Example 41.2. Specifying a Known Expected Number ofNonconformities
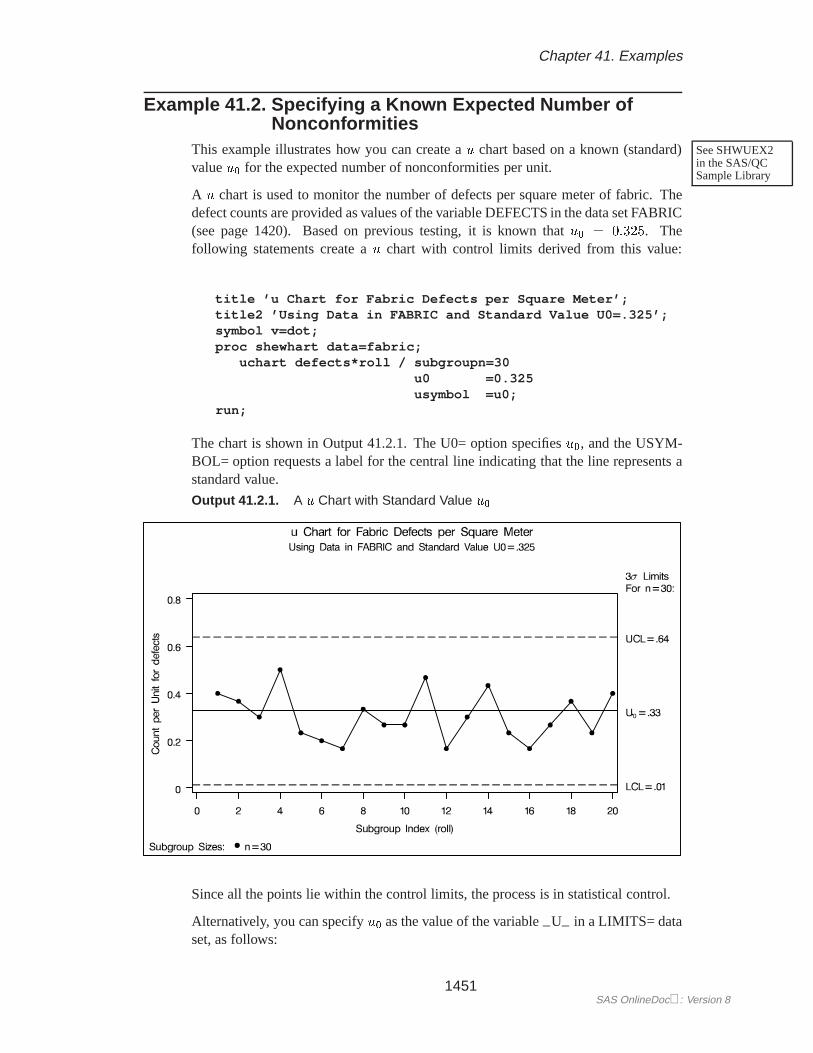
This example illustrates how you can create au chart based on a known (standard)See SHWUEX2in the SAS/QCSample Library
valueu0 for the expected number of nonconformities per unit.
A u chart is used to monitor the number of defects per square meter of fabric. Thedefect counts are provided as values of the variable DEFECTS in the data set FABRIC(see page 1420). Based on previous testing, it is known thatu0 = 0:325. Thefollowing statements create au chart with control limits derived from this value:
title ’u Chart for Fabric Defects per Square Meter’;title2 ’Using Data in FABRIC and Standard Value U0=.325’;symbol v=dot;proc shewhart data=fabric;
uchart defects*roll / subgroupn=30u0 =0.325usymbol =u0;
run;
The chart is shown in Output 41.2.1. The U0= option specifiesu0, and the USYM-BOL= option requests a label for the central line indicating that the line represents astandard value.
Output 41.2.1. A u Chart with Standard Value u0
Since all the points lie within the control limits, the process is in statistical control.
Alternatively, you can specifyu0 as the value of the variable–U– in a LIMITS= dataset, as follows:
1451SAS OnlineDoc: Version 8

Part 9. The CAPABILITY Procedure
data tlimits;length _subgrp_ _var_ _type_ $8;_u_ = .325;_limitn_ = 30;_type_ = ’STANDARD’;_subgrp_ = ’roll’;_var_ = ’defects’;
proc shewhart data=fabric limits=tlimits;uchart defects*roll / subgroupn=30
usymbol =u0;run;
The chart produced by these statements is identical to the one in Output 41.2.1. Forfurther details, see “LIMITS= Data Set” on page 1446.
Example 41.3. Creating u Charts for Varying Numbers ofUnits
In the fabric manufacturing process described in “Creating u Charts from DefectSee SHWUEX3in the SAS/QCSample Library
Count Data” on page 1420, each roll of fabric is 30 meters long, and an inspec-tion unit is defined as one square meter. Thus, there are 30 inspection units in eachsubgroup sample. Suppose now that the length of each piece of fabric varies. Thefollowing statements create a SAS data set (FABRICS2) that contains the number offabric defects and size (in square meters) of 25 pieces of fabric:
data fabrics2;input roll defects sqmeters @@;
datalines;1 7 30.0 2 11 27.6 3 15 30.4 4 6 34.8 5 11 26.06 15 28.6 7 5 28.0 8 10 30.2 9 8 28.2 10 3 31.4
11 3 30.3 12 14 27.8 13 3 27.0 14 9 30.0 15 7 32.116 6 34.8 17 7 26.5 18 5 30.0 19 14 31.3 20 13 31.621 11 29.4 22 6 28.6 23 6 27.5 24 9 32.6 25 11 31.7;
A partial listing of FABRICS2 is shown in Output 41.3.1.
Output 41.3.1. The Data Set FABRICS2
Number of Fabric Defects
roll defects sqmeters
1 7 30.02 11 27.63 15 30.4. . .. . .. . .
The variable ROLL contains the roll number, the variable DEFECTS contains thenumber of defects in each piece of fabric, and the variable SQMETERS contains thesize of each piece.
SAS OnlineDoc: Version 81452

Chapter 41. Examples
The following statements request au chart for the number of defects per square meter:
title ’u Chart for Fabric Defects per Square Meter’;symbol v=dot;proc shewhart data=fabrics2;
uchart defects*roll / subgroupn=sqmetersoutlimits=flimits;
run;
Theu chart is shown in Output 41.3.2, and the data set FLIMITS is listed in Out-put 41.3.3.
Output 41.3.2. A u Chart with Varying Number of Units per Subgroup
Note that the control limits vary with the number of units per subgroup (subgroupsample size). The legend in the lower left corner indicates the minimum and maxi-mum subgroup sample sizes.
Output 41.3.3. The Control Limits Data Set FLIMITS
Control Limits for Fabric Defects
_VAR_ _SUBGRP_ _TYPE_ _LIMITN_ _ALPHA_ _SIGMAS_ _LCLU_ _U_ _UCLU_
defects roll ESTIMATE V V 3 V 0.28805 V
Output 41.3.3 shows that the variables–LIMITN –, –ALPHA–, –LCLU–, and
–UCLU– have the special missing valueV, indicating that these variables vary withthe sample size.
The following statements request au chart with a fixed sample size of 30.0 for thecontrol limits. In other words, the control limits are computed as if each piece offabric were 30 meters long.
1453SAS OnlineDoc: Version 8

Part 9. The CAPABILITY Procedure
proc shewhart data=fabrics2;uchart defects*roll / subgroupn=sqmeters
outlimits=flimits2limitn =30allnnmarkers;
run;
The ALLN option specifies that points are to be displayed for all subgroups, regard-less of their sample size. By default, when you specify the LIMITN= option, onlypoints for subgroups whose sample size matches the LIMITN= value are displayed.The NMARKERS option requests special symbols that identify points for which thesubgroup sample size differs from the nominal sample size of 30. The chart is shownin Output 41.3.4.
Output 41.3.4. Control Limits Based on Fixed Subgroup Sample Size
In Output 41.3.4, no points lie outside the control limits, indicating that the processis in control. However, you should be careful when interpreting charts that use anominal sample size, since the fixed control limits based on this value are only anapproximation. Output 41.3.5 lists the data set FLIMITS2, which contains the fixedcontrol limits displayed in Output 41.3.4.
Output 41.3.5. The Fixed Control Limits Data Set FLIMITS2
Fixed Control Limits for Fabric Defects
_VAR_ _SUBGROUP_ _TYPE_ _LIMITN_ _ALPHA_ _SIGMAS_ _LCLU_ _U_ _UCLU_
defects roll ESTIMATE 30 .002621618 3 0 0.28805 0.58201
SAS OnlineDoc: Version 81454

The correct bibliographic citation for this manual is as follows: SAS Institute Inc.,SAS/QC ® User’s Guide, Version 8, Cary, NC: SAS Institute Inc., 1999. 1994 pp.
SAS/QC® User’s Guide, Version 8Copyright © 1999 SAS Institute Inc., Cary, NC, USA.ISBN 1–58025–493–4All rights reserved. Printed in the United States of America. No part of this publicationmay be reproduced, stored in a retrieval system, or transmitted, by any form or by anymeans, electronic, mechanical, photocopying, or otherwise, without the prior writtenpermission of the publisher, SAS Institute Inc.U.S. Government Restricted Rights Notice. Use, duplication, or disclosure of thesoftware by the government is subject to restrictions as set forth in FAR 52.227–19Commercial Computer Software-Restricted Rights (June 1987).SAS Institute Inc., SAS Campus Drive, Cary, North Carolina 27513.1st printing, October 1999SAS® and all other SAS Institute Inc. product or service names are registered trademarksor trademarks of SAS Institute in the USA and other countries.® indicates USAregistration.IBM®, ACF/VTAM®, AIX®, APPN®, MVS/ESA®, OS/2®, OS/390®, VM/ESA®, and VTAM®
are registered trademarks or trademarks of International Business Machines Corporation.® indicates USA registration.Other brand and product names are registered trademarks or trademarks of theirrespective companies.The Institute is a private company devoted to the support and further development of itssoftware and related services.