chapter 41 sample surveys in the real world. chapter 42 thought question when surveying students on...
Post on 18-Dec-2015
215 views
TRANSCRIPT
Chapter 4 1
Chapter 4
Sample Surveys in the Real World
Chapter 4 2
Thought Question
When surveying students on their opinions on their professor’s teaching methods, do you think it matters who conducts the interviews? Explain your answer with an example.
Chapter 4 3
Sources of Error in Surveys
Random sampling reduces bias in choosing a sample and allows control of variability.
Sampling in the real world is more complex and less reliable than we might hope for.
Confidence statements do not reflect all sources of error that are present in sampling.

Chapter 4 4
Sampling Errors – Errors that are caused by the act of taking a sample.
Random Sampling Error: the difference between a statistic and the population parameter it estimates; such an error results from chance sample fluctuations.
- Measured by the margin or error.
Nonsampling Errors – Errors that are not related to the act of taking a sample.
Example: Sample data that are incorrectly collected, recorded, or analyzed (such as using a defective instrument, or copying the data incorrectly).
Nonsampling errors can be much larger than the sampling errors.
Chapter 4 5
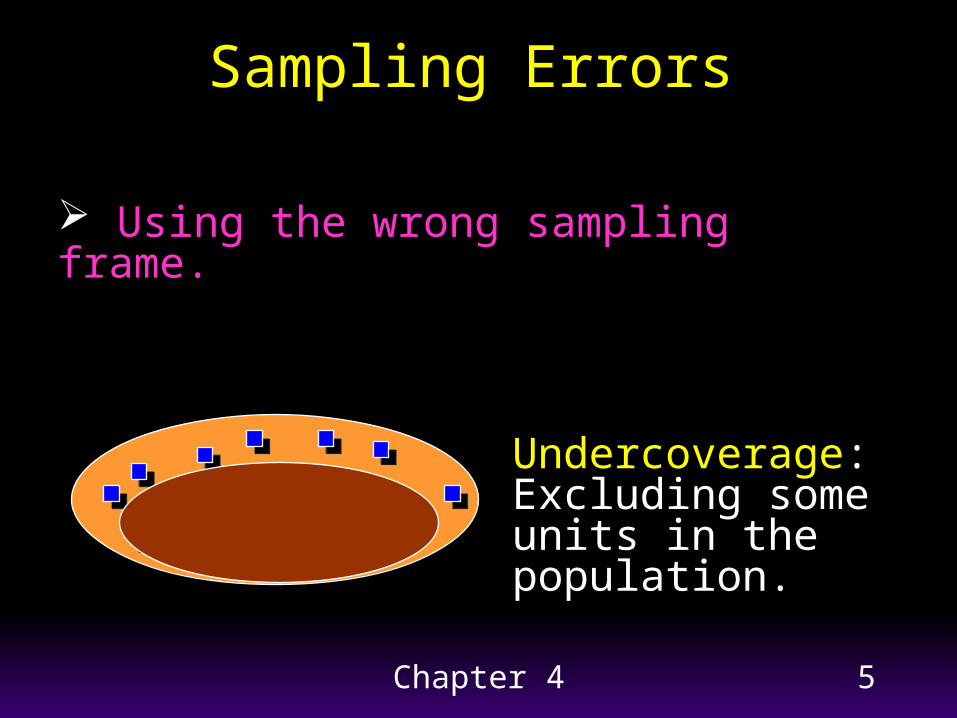
Sampling Errors
Using the wrong sampling frame.
Undercoverage: Excluding some units in the population.
Chapter 4 6
Sampling Errors
Disasters– Using voluntary response (self selection).
– Using a convenience or haphazard sample.
cannot extend results to the population of interest(need a broad cross-section of the population).
Chapter 4 7
Sources of Nonsampling Errors
Non-response bias: Cannot contact subjects or they do not respond.
- Nonrespondents often behave or think differently from
respondents. - low response rates can lead to huge biases.
- Can be as high as 75% to 80% (see page 58 of textbook).
Response Errors:
Incorrect answers by respondents.
Chapter 4 8
Nonsampling errors cont. Survey format effects:
Factors such as question order, questionnaire layout, self -administered questionnaire or interviewer, can affect the results.
Interviewer effects:Different interviewers asking the same questions can obtain different answers.
Processing Errors: Data that are incorrectly collected, recorded,
calculated etc.
Chapter 4 9
Concerns when Asking Survey Questions
Deliberate bias Unintentional bias Desire to please Asking the uninformed Unnecessary complexity Ordering of questions Confidentiality and anonymity
Chapter 4 10
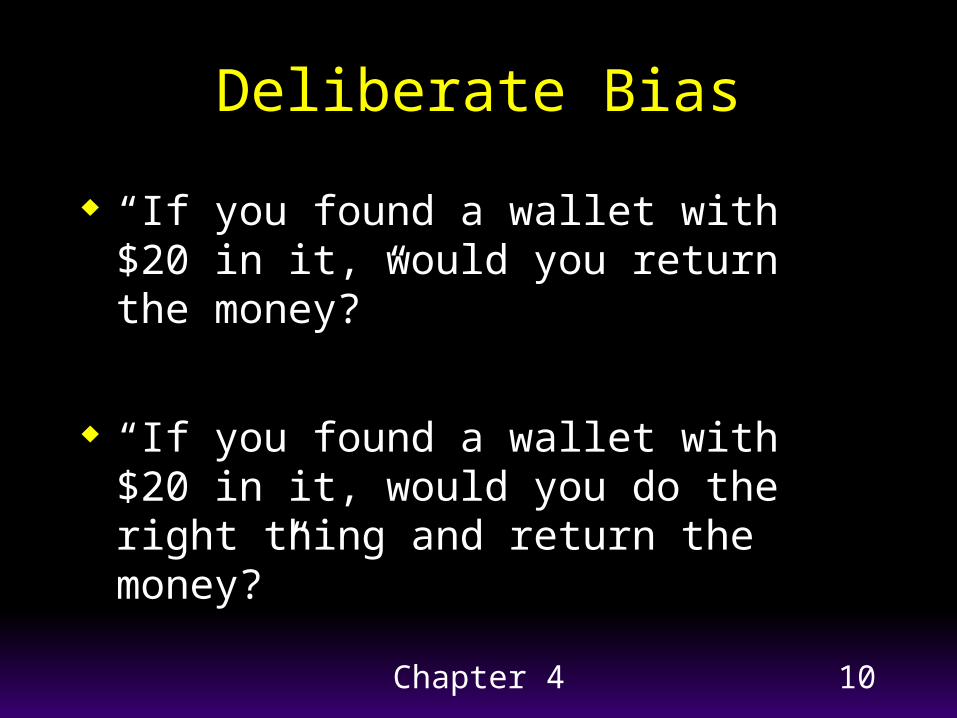
Deliberate Bias
“If you found a wallet with $20 in it, would you return the money?”
“If you found a wallet with $20 in it, would you do the right thing and return the money?”
Chapter 4 11
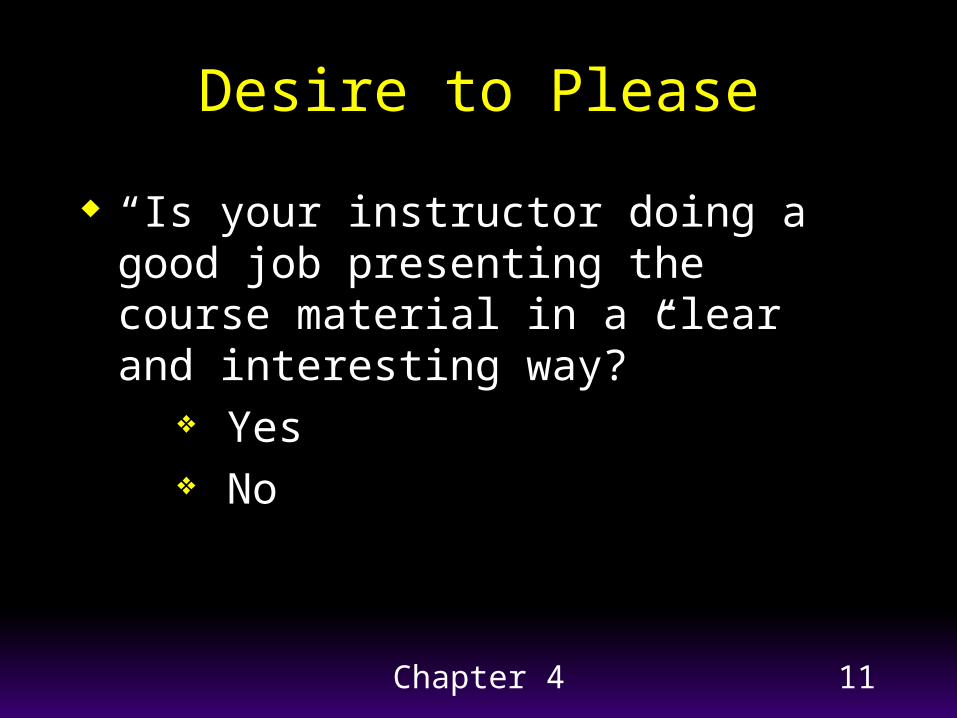
Desire to Please
“Is your instructor doing a good job presenting the course material in a clear and interesting way?”
Yes No
Chapter 4 12
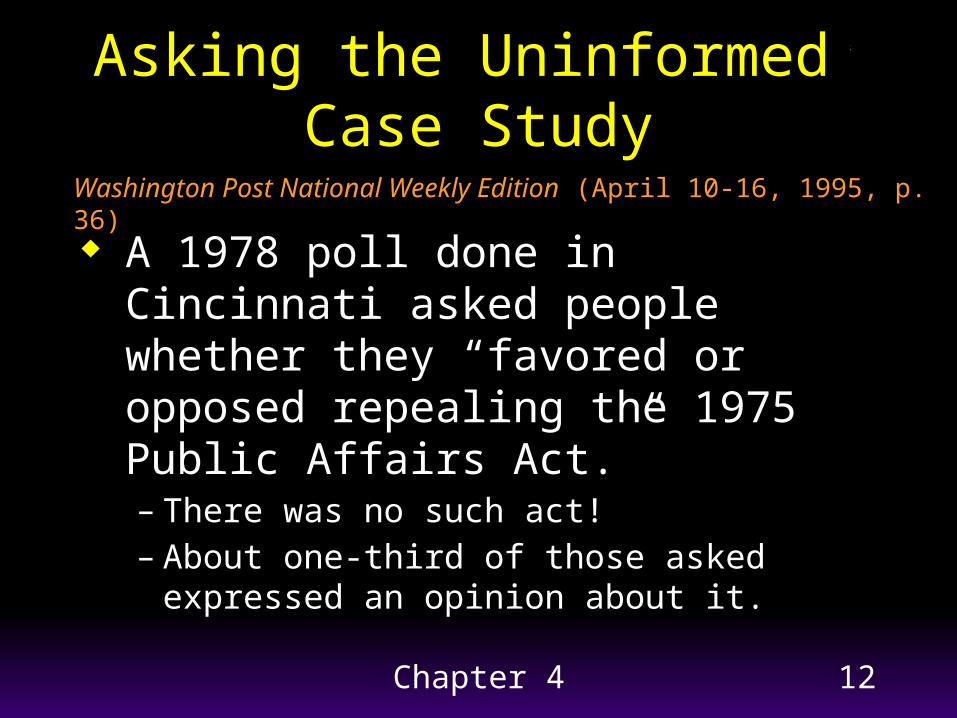
A 1978 poll done in Cincinnati asked people whether they “favored or opposed repealing the 1975 Public Affairs Act.”– There was no such act!– About one-third of those asked expressed
an opinion about it.
Washington Post National Weekly Edition (April 10-16, 1995, p. 36)
Asking the Uninformed:Case Study
Chapter 4 13
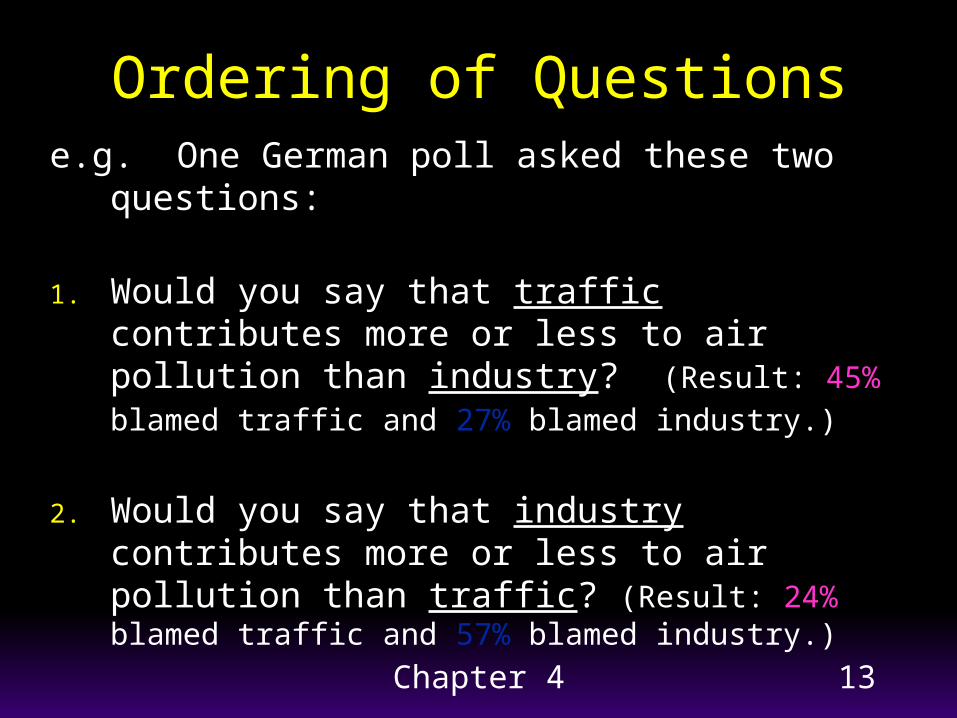
Ordering of Questionse.g. One German poll asked these two questions:
1. Would you say that traffic contributes more or less to air pollution than industry? (Result: 45%
blamed traffic and 27% blamed industry.)
2. Would you say that industry contributes more or less to air pollution than traffic? (Result: 24% blamed traffic and 57% blamed industry.)
Chapter 4 14
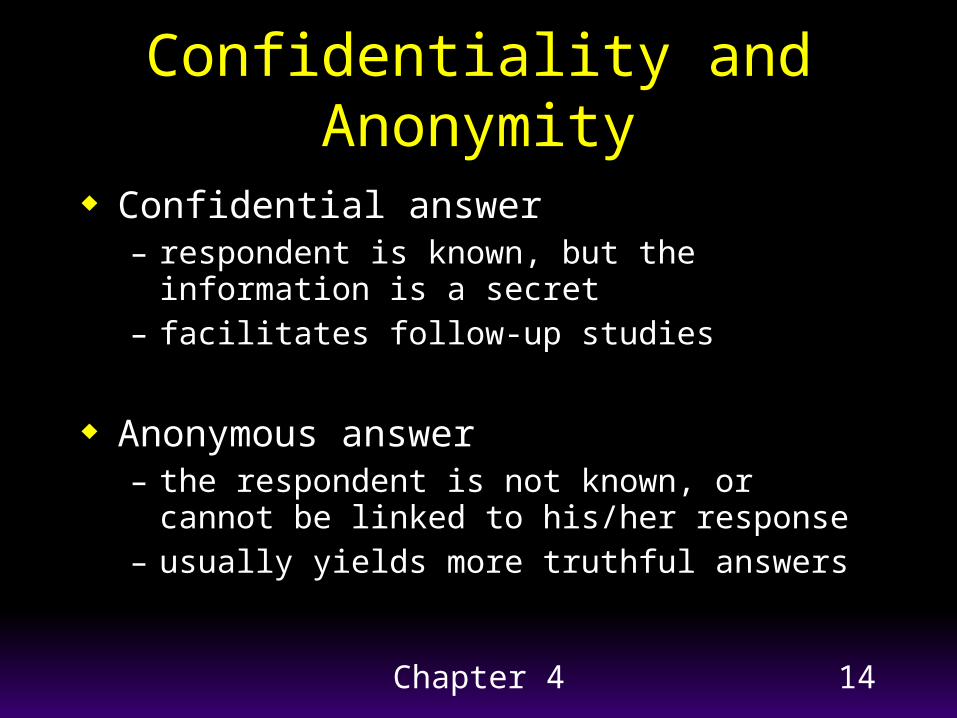
Confidentiality and Anonymity
Confidential answer– respondent is known, but the information is a
secret– facilitates follow-up studies
Anonymous answer– the respondent is not known, or cannot be linked
to his/her response– usually yields more truthful answers
Chapter 4 15
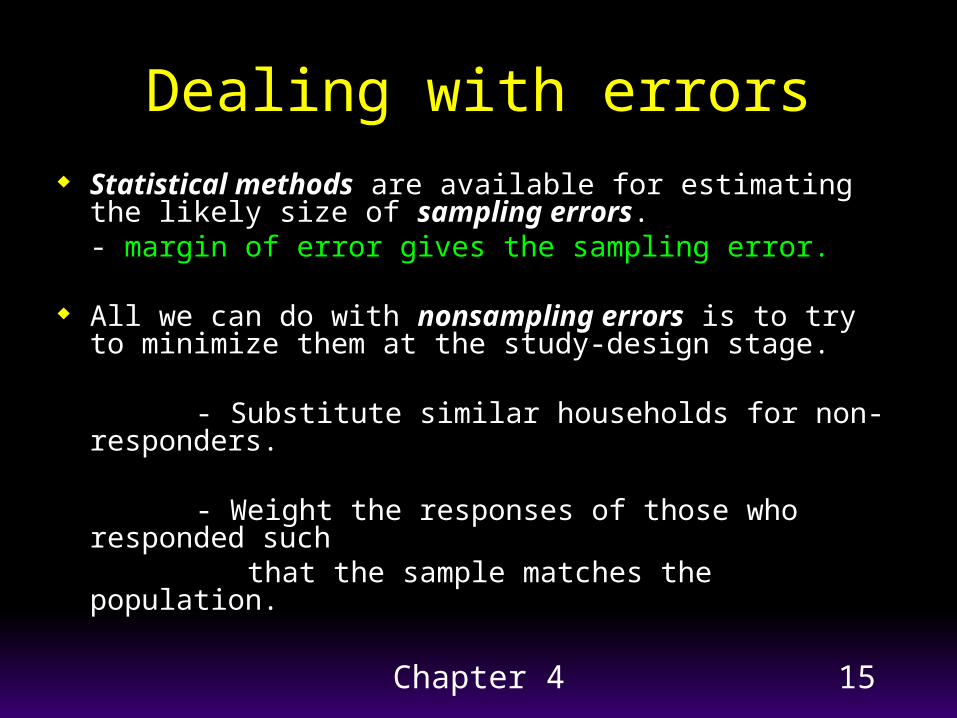
Dealing with errors Statistical methods are available for estimating the
likely size of sampling errors.- margin of error gives the sampling error.
All we can do with nonsampling errors is to try to minimize them at the study-design stage.
- Substitute similar households for non-responders.
- Weight the responses of those who responded such that the sample matches the population.
Chapter 4 16
Pilot Survey
One tests a survey on a relatively small group of people to try to identify any problems with the survey design before conducting the survey proper.
Chapter 4 17
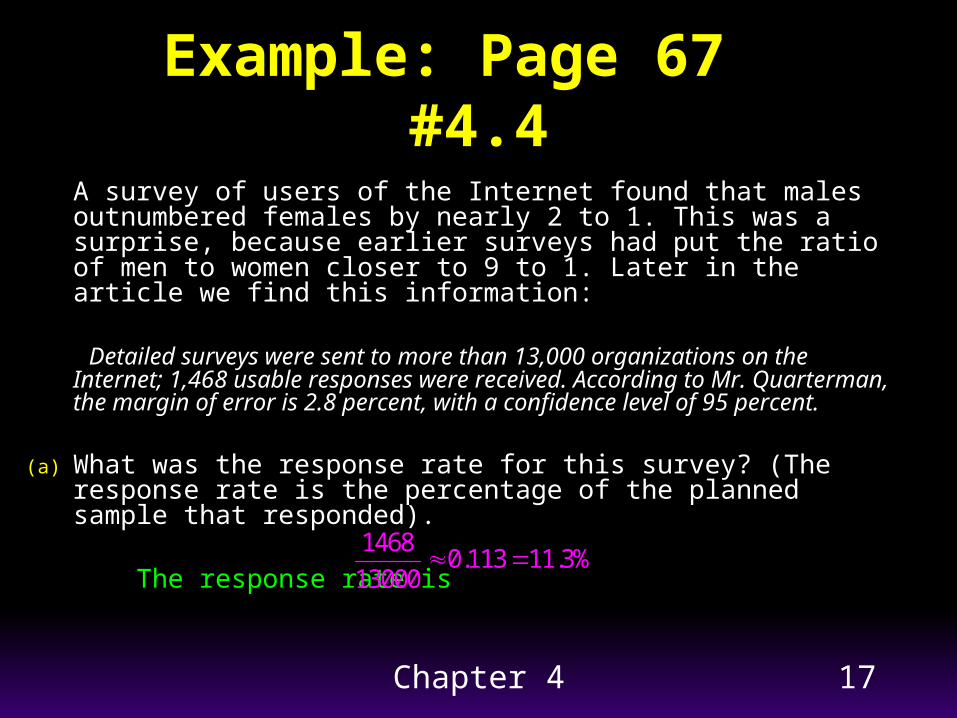
Example: Page 67 #4.4
A survey of users of the Internet found that males outnumbered females by nearly 2 to 1. This was a surprise, because earlier surveys had put the ratio of men to women closer to 9 to 1. Later in the article we find this information:
Detailed surveys were sent to more than 13,000 organizations on the Internet; 1,468 usable responses were received. According to Mr. Quarterman, the margin of error is 2.8 percent, with a confidence level of 95 percent.
(a) What was the response rate for this survey? (The response rate is the percentage of the planned sample that responded).
The response rate is 14680.113 11.3%
13000
Chapter 4 18
Example Cont.
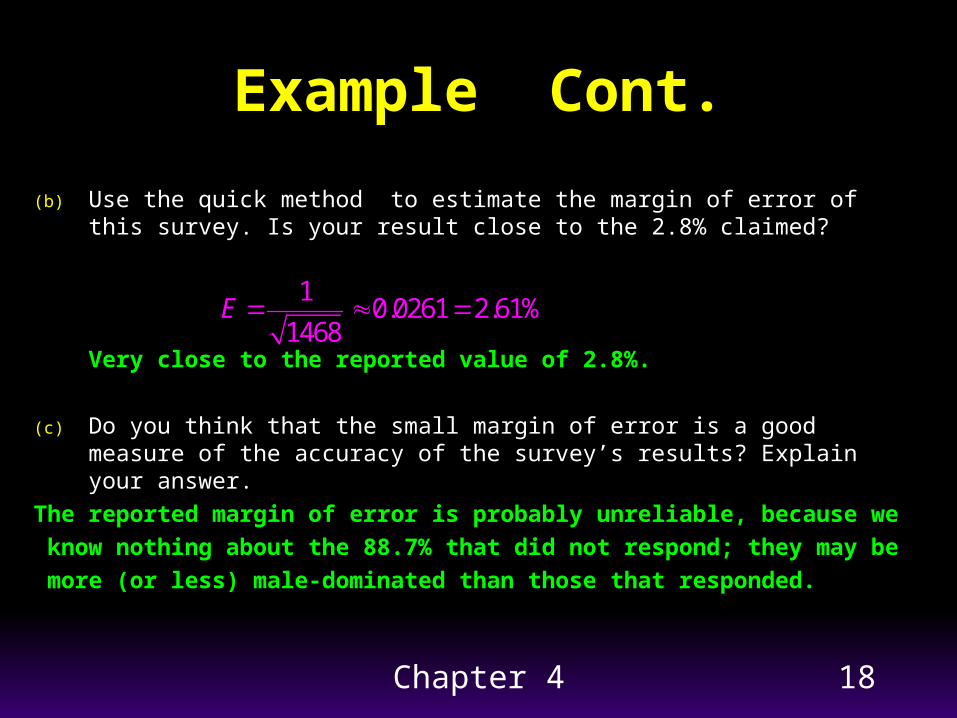
(b) Use the quick method to estimate the margin of error of this survey. Is your result close to the 2.8% claimed?
Very close to the reported value of 2.8%.
(c) Do you think that the small margin of error is a good measure of the accuracy of the survey’s results? Explain your answer.
The reported margin of error is probably unreliable, because we
know nothing about the 88.7% that did not respond; they may be
more (or less) male-dominated than those that responded.
10.0261 2.61%
1468E
Chapter 4 19
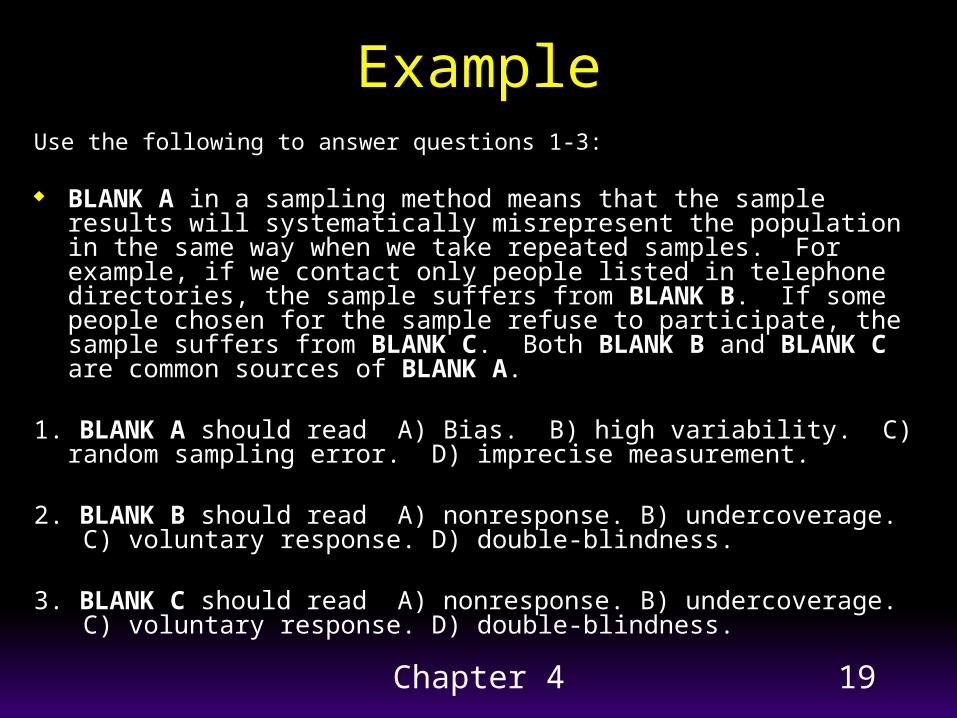
ExampleUse the following to answer questions 1-3:
BLANK A in a sampling method means that the sample results will systematically misrepresent the population in the same way when we take repeated samples. For example, if we contact only people listed in telephone directories, the sample suffers from BLANK B. If some people chosen for the sample refuse to participate, the sample suffers from BLANK C. Both BLANK B and BLANK C are common sources of BLANK A.
1. BLANK A should read A) Bias. B) high variability. C) random sampling error. D) imprecise measurement.
2. BLANK B should read A) nonresponse. B) undercoverage. C) voluntary response. D) double-blindness.
3. BLANK C should read A) nonresponse. B) undercoverage. C) voluntary response. D) double-blindness.
Chapter 4 20
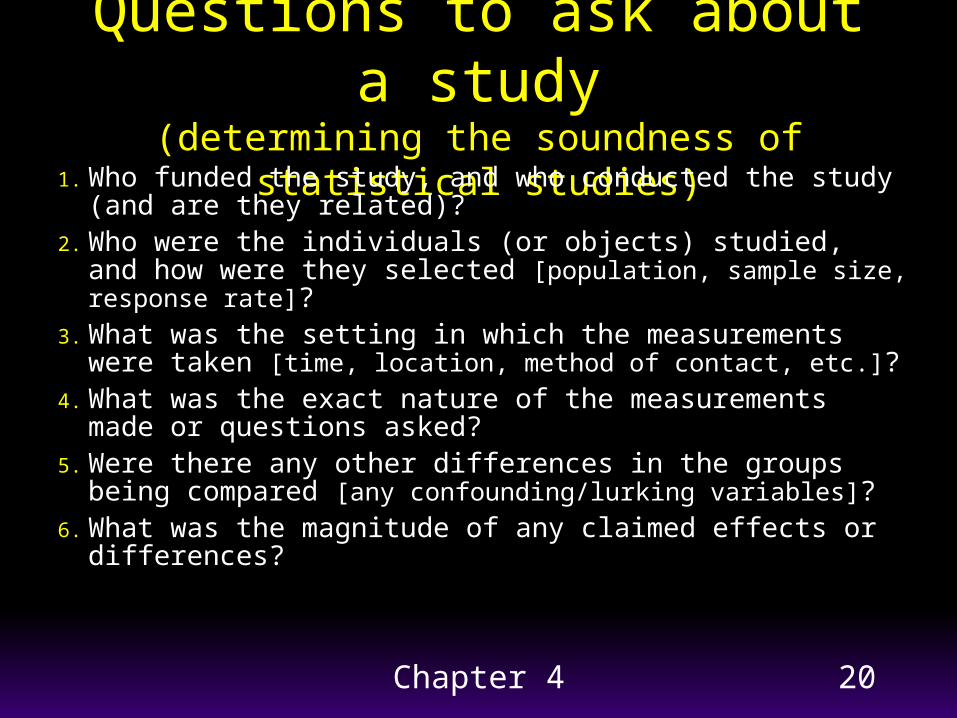
Questions to ask about a study(determining the soundness of statistical studies)
1. Who funded the study, and who conducted the study (and are they related)?
2. Who were the individuals (or objects) studied, and how were they selected [population, sample size, response rate]?
3. What was the setting in which the measurements were taken [time, location, method of contact, etc.]?
4. What was the exact nature of the measurements made or questions asked?
5. Were there any other differences in the groups being compared [any confounding/lurking variables]?
6. What was the magnitude of any claimed effects or differences?
Chapter 4 21
Brooks Shoes Brings Flawed Study to Court
reported in Statistical Reasoning in Law and Public Policy, Vol. 2, pp. 517-520
Case StudyQuestions to ask
Chapter 4 22
Questions to ask
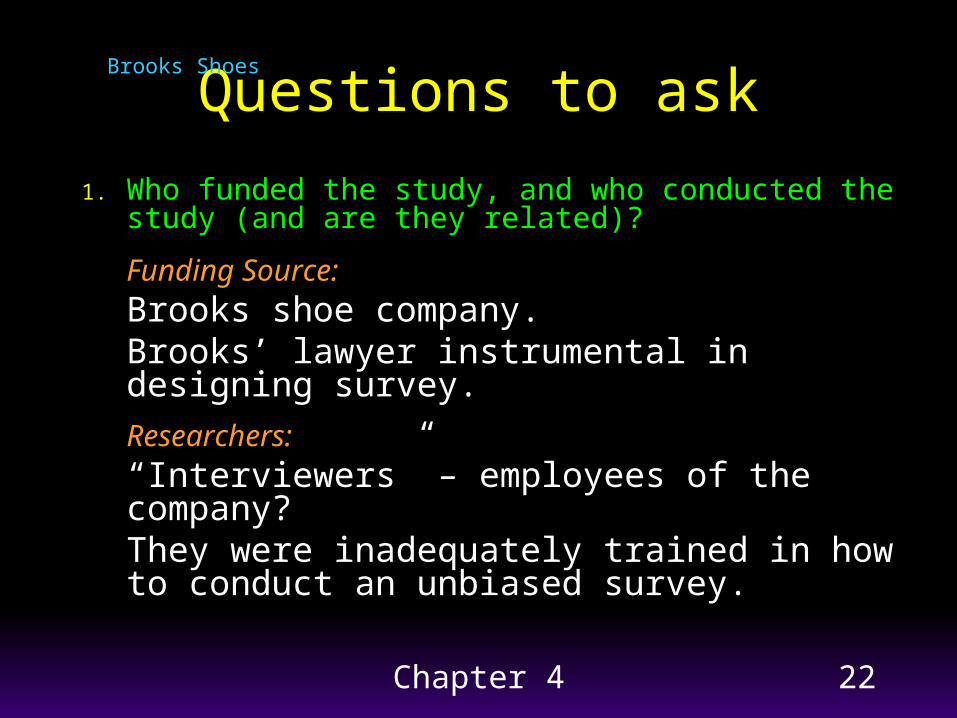
1. Who funded the study, and who conducted the study (and are they related)?
Funding Source:Brooks shoe company. Brooks’ lawyer instrumental in designing survey.
Researchers:“Interviewers” – employees of the company?They were inadequately trained in how to conduct an unbiased survey.
Brooks Shoes
Chapter 4 23
Questions to ask
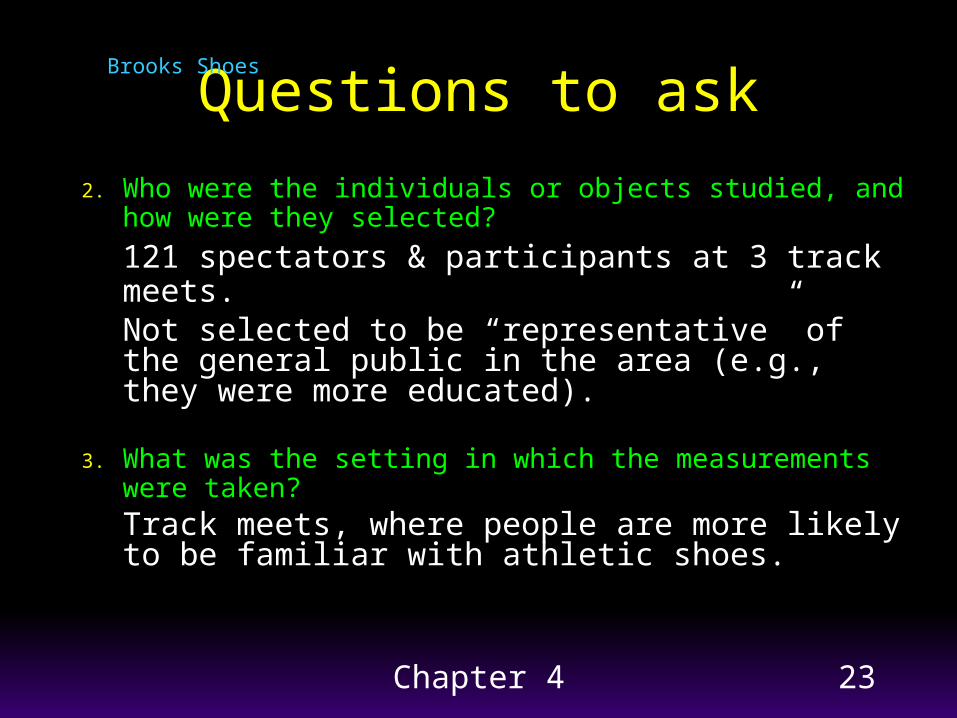
2. Who were the individuals or objects studied, and how were they selected?
121 spectators & participants at 3 track meets.Not selected to be “representative” of the general public in the area (e.g., they were more educated).
3. What was the setting in which the measurements were taken?
Track meets, where people are more likely to be familiar with athletic shoes.
Brooks Shoes
Chapter 4 24
Questions to ask
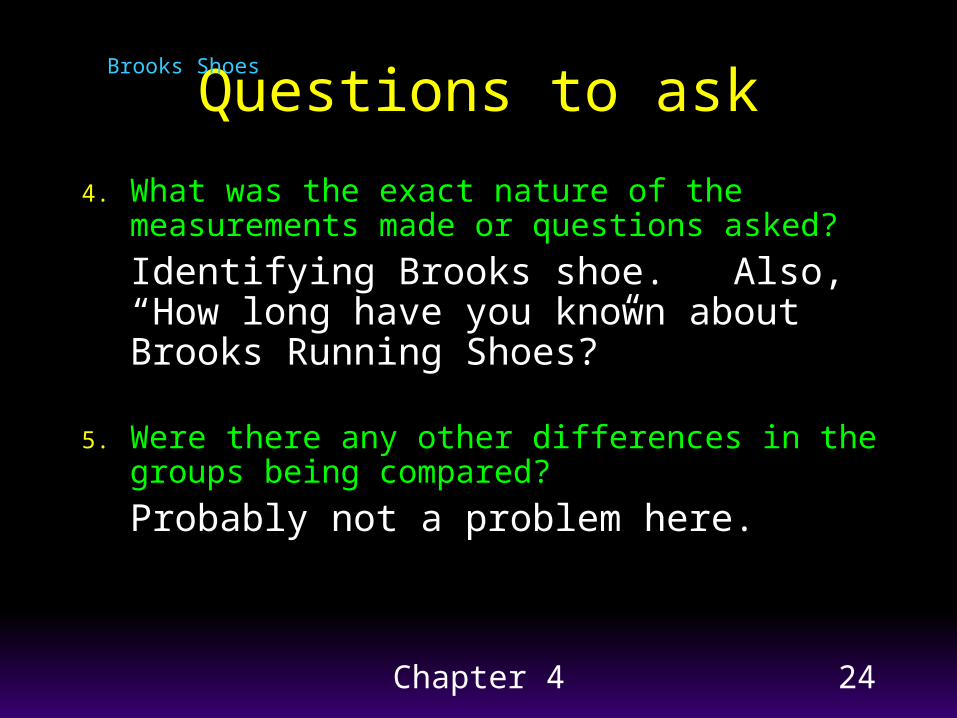
4. What was the exact nature of the measurements made or questions asked?
Identifying Brooks shoe. Also, “How long have you known about Brooks Running Shoes?”
5. Were there any other differences in the groups being compared?
Probably not a problem here.
Brooks Shoes

Chapter 4 25
Questions to ask
6. What was the magnitude of any claimed effects or differences?
• 71% recognized a Brooks shoe[33% of these due to the ‘V’ design]
• 39% thought Suave shoe was Brooks shoe [48% of these due to the ‘V’ design]
Brooks Shoes
Suave conducted a proper survey of 404 respondents and found that only 2.7% recognized a Brooks shoe from the ‘V’!
Chapter 4 26
Other Sampling Designs
We might want our sample to represent certain characteristics of the population (example: gender, race, age, etc.)
In practice, more complex (but easy to implement) sampling designs are used.
Chapter 4 27
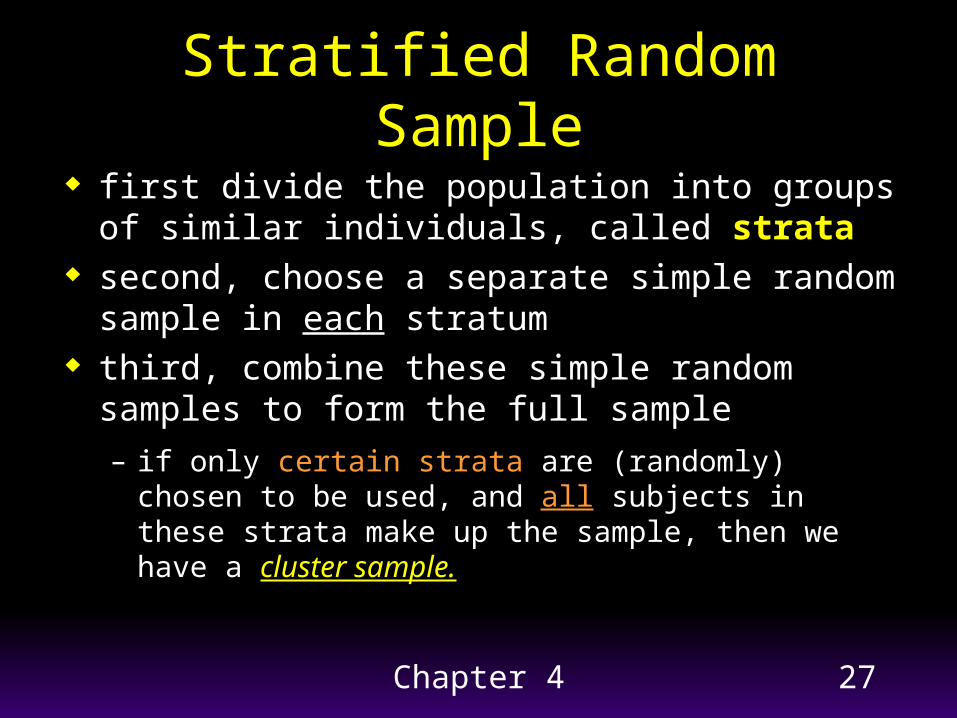
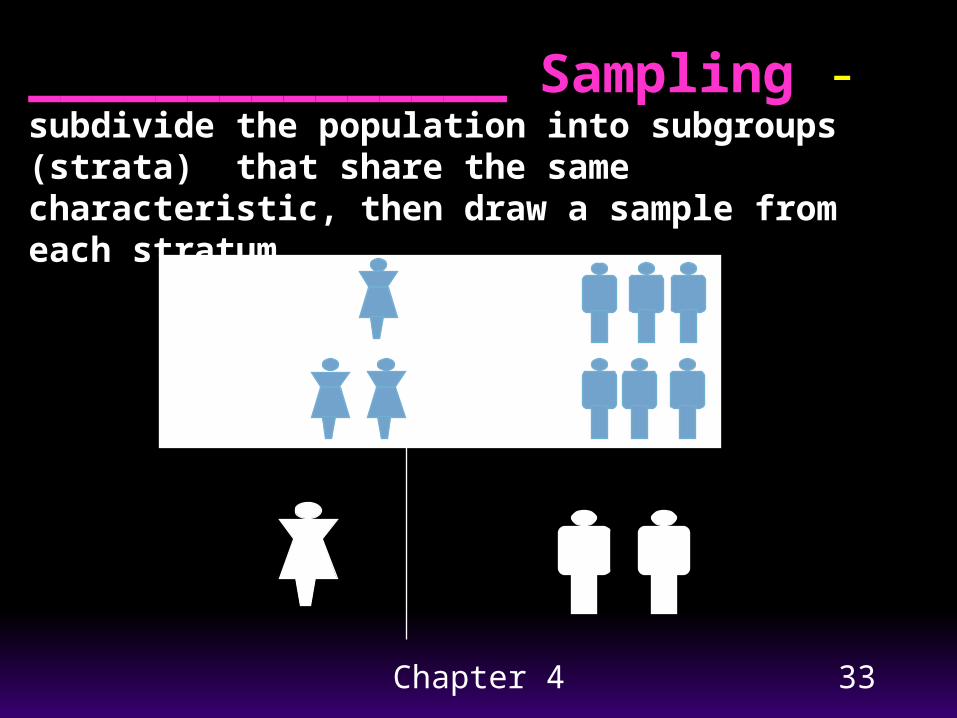
Stratified Random Sample
first divide the population into groups of similar individuals, called strata
second, choose a separate simple random sample in each stratum
third, combine these simple random samples to form the full sample
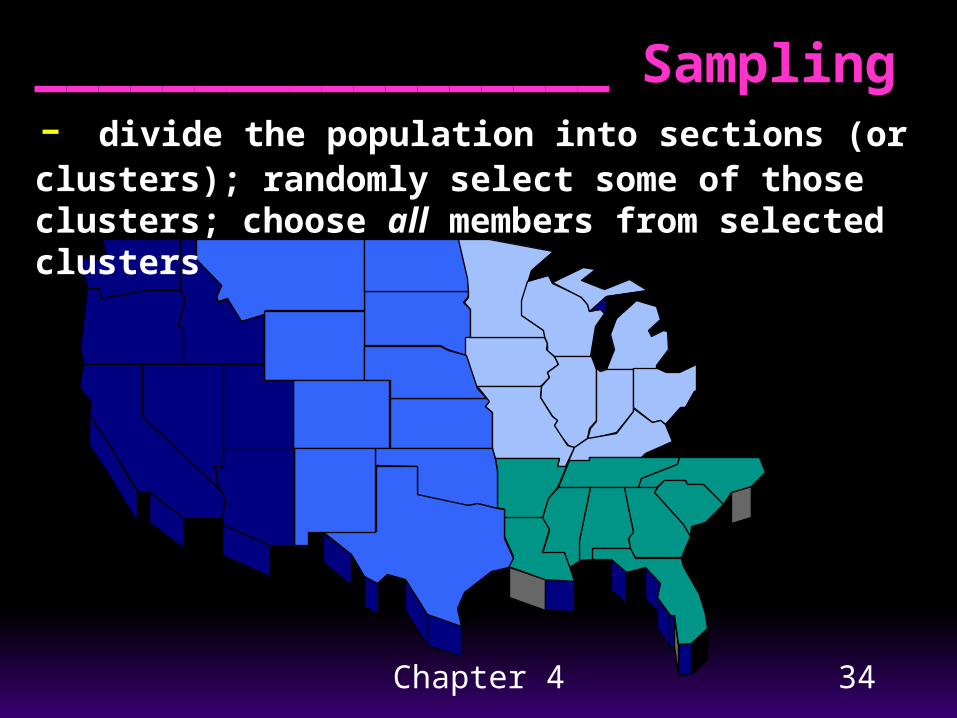
– if only certain strata are (randomly) chosen to be used, and all subjects in these strata make up the sample, then we have a cluster sample.
Chapter 4 28
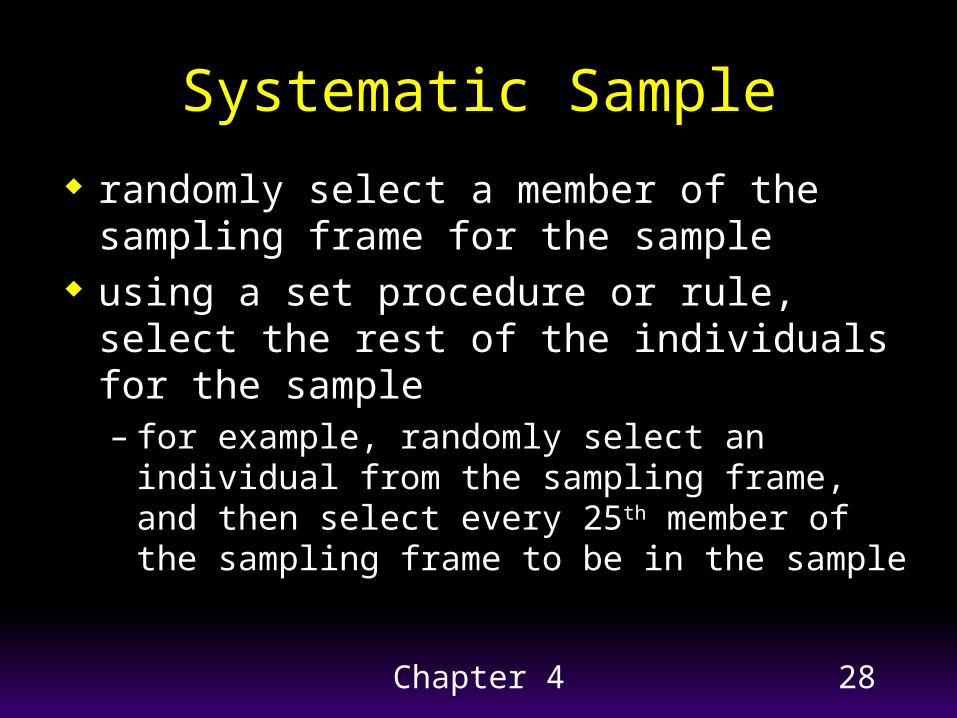
Systematic Sample
randomly select a member of the sampling frame for the sample
using a set procedure or rule, select the rest of the individuals for the sample– for example, randomly select an individual
from the sampling frame, and then select every 25th member of the sampling frame to be in the sample
Chapter 4 29
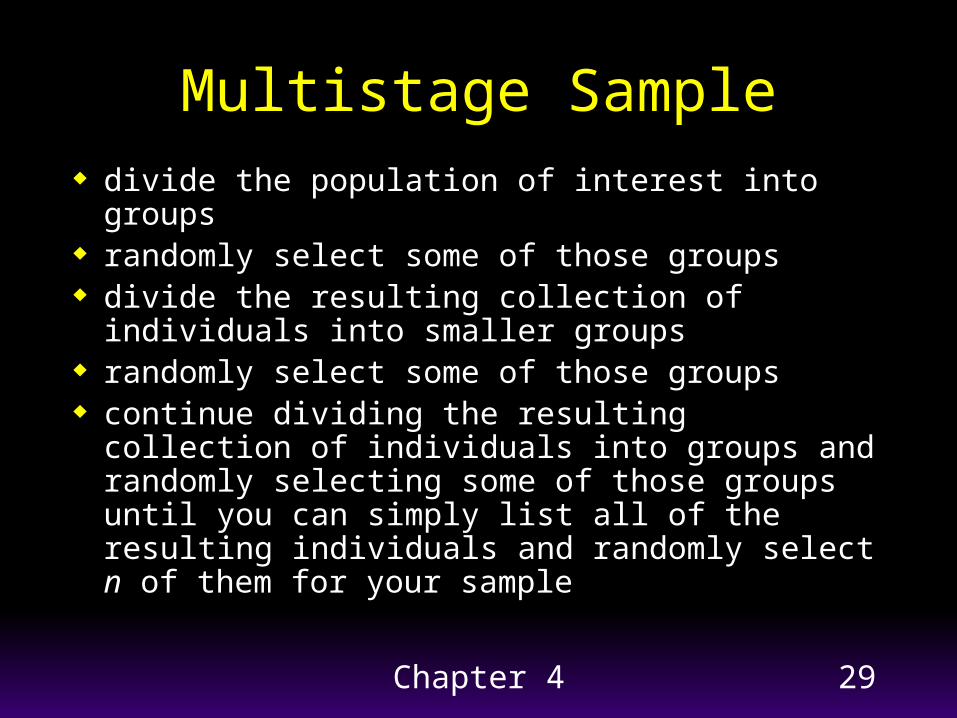
Multistage Sample divide the population of interest into groups randomly select some of those groups divide the resulting collection of individuals into
smaller groups randomly select some of those groups continue dividing the resulting collection of
individuals into groups and randomly selecting some of those groups until you can simply list all of the resulting individuals and randomly select n of them for your sample

Chapter 4 30
Probability Sampling Plans
A probability sample is a sample chosen by
chance.
Some probability samples (such as stratified sampling)
do not give an equal chance to all the samples they
allow – thus, they are not simple random samples.

Chapter 4 31
Probability Sampling Plans
Simple random sampling (SRS) Stratified random sampling Cluster sampling Systematic sampling Random digit dialing Multistage sampling
Chapter 4 32
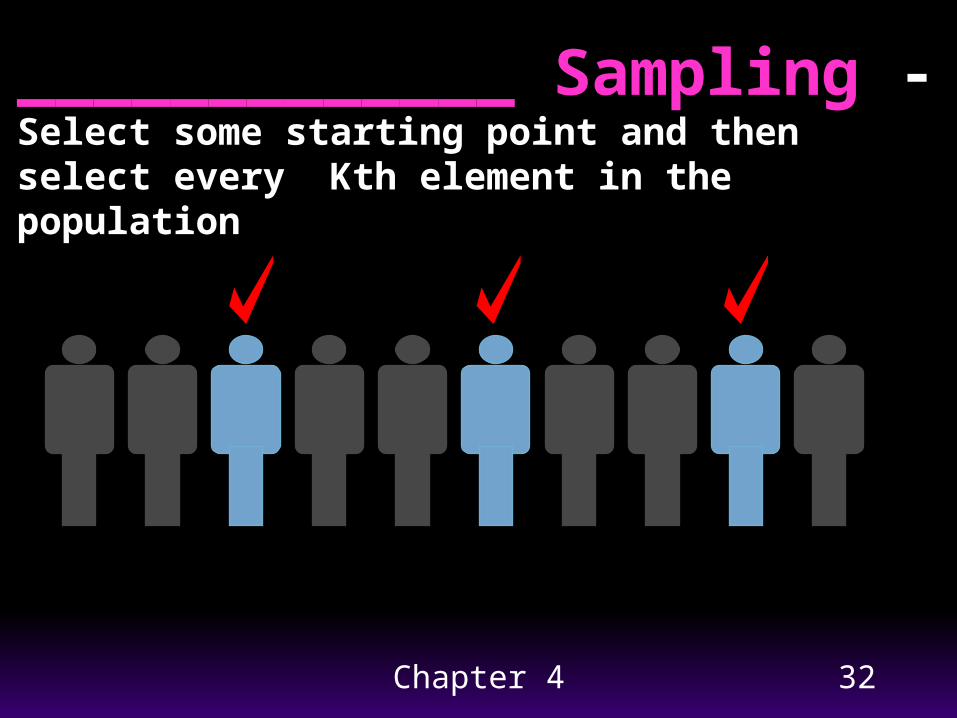
_____________ Sampling - Select some starting point and then select every Kth element in the population
Chapter 4 33
_______________ Sampling - subdivide the population into subgroups (strata) that share the same characteristic, then draw a sample from each stratum
Chapter 4 34
__________________ Sampling - divide the population into sections (or clusters); randomly select some of those clusters; choose all members from selected clusters
Chapter 4 35
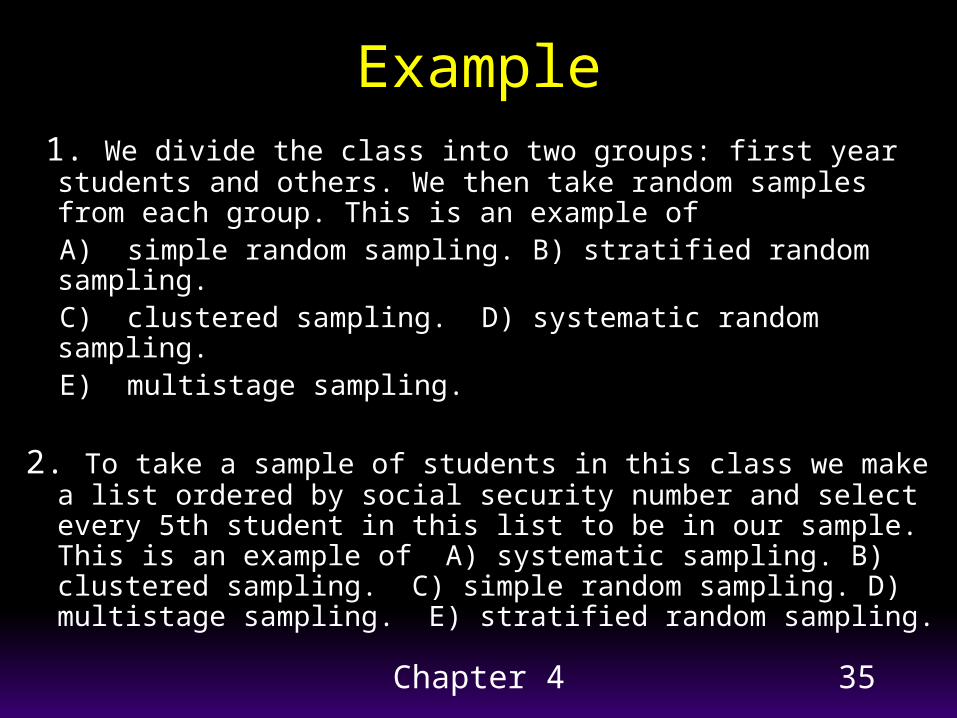
Example 1. We divide the class into two groups: first year students and
others. We then take random samples from each group. This is an example of
A) simple random sampling. B) stratified random sampling. C) clustered sampling. D) systematic random sampling. E) multistage sampling.
2. To take a sample of students in this class we make a list ordered by social security number and select every 5th student in this list to be in our sample. This is an example of A) systematic sampling. B) clustered sampling. C) simple random sampling. D) multistage sampling. E) stratified random sampling.
Chapter 4 36
Key Concepts Ask questions when you read about
studies.
Sampling & Nonsampling Errors.– Concerns when asking survey questions
Stratified Sampling, Cluster Sampling, Systematic Sampling, Multistage Sampling.
Chapter 4 37
Review
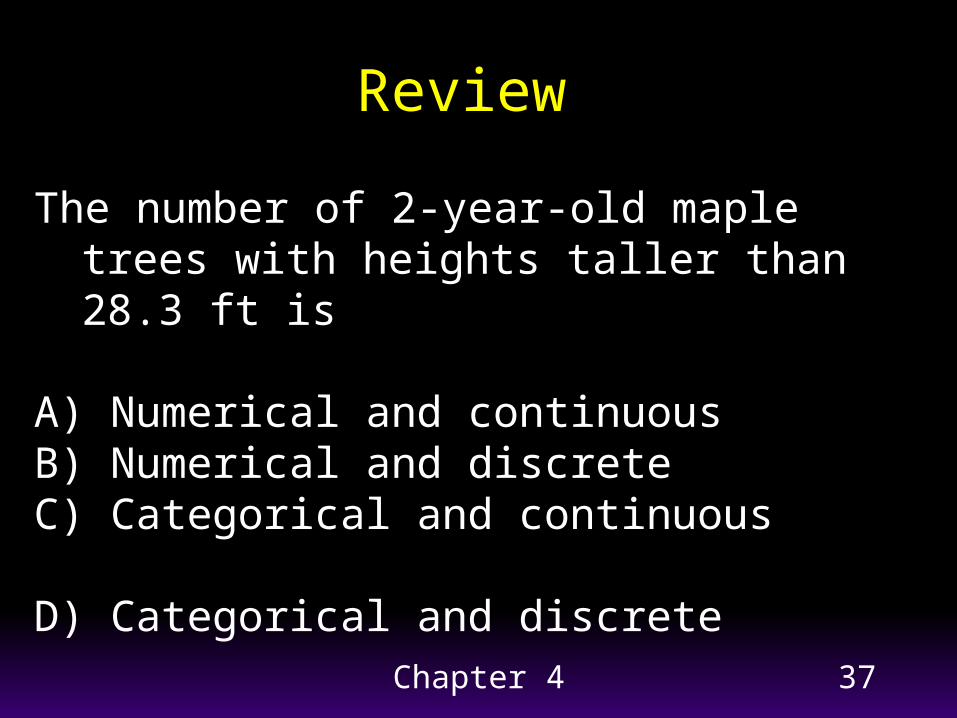
The number of 2-year-old maple trees with heights taller than 28.3 ft is
A) Numerical and continuousB) Numerical and discrete C) Categorical and continuous D) Categorical and discrete
Chapter 4 38
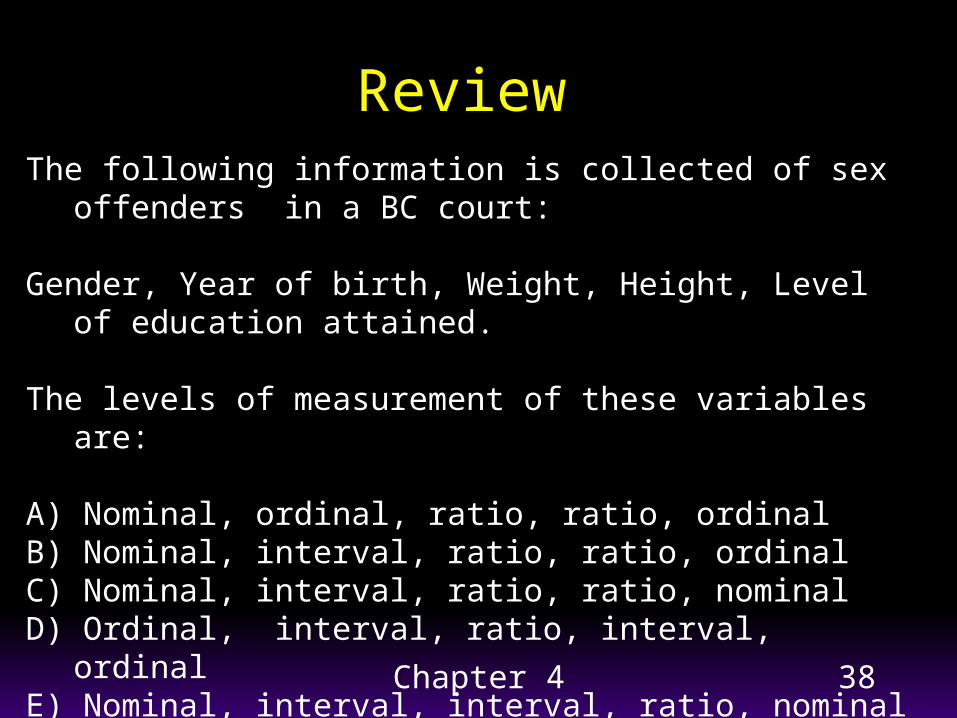
Review The following information is collected of sex offenders in a BC
court:
Gender, Year of birth, Weight, Height, Level of education attained.
The levels of measurement of these variables are:
A) Nominal, ordinal, ratio, ratio, ordinalB) Nominal, interval, ratio, ratio, ordinal C) Nominal, interval, ratio, ratio, nominal D) Ordinal, interval, ratio, interval, ordinalE) Nominal, interval, interval, ratio, nominal
Chapter 4 39
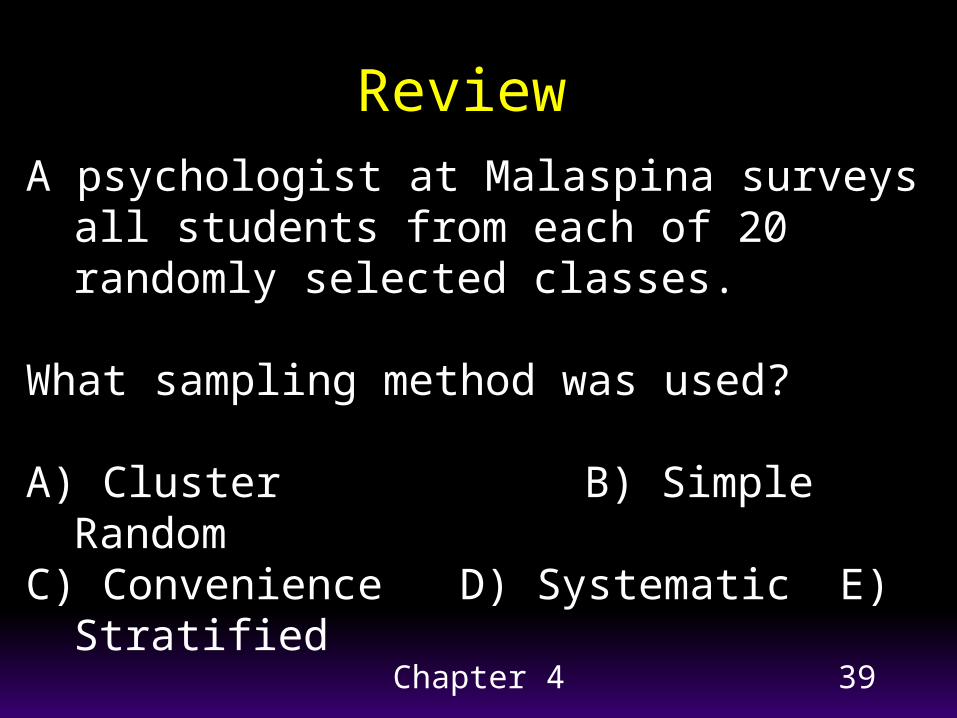
Review A psychologist at Malaspina surveys all
students from each of 20 randomly selected classes.
What sampling method was used?
A) Cluster B) Simple RandomC) Convenience D) Systematic E) Stratified
Chapter 4 40
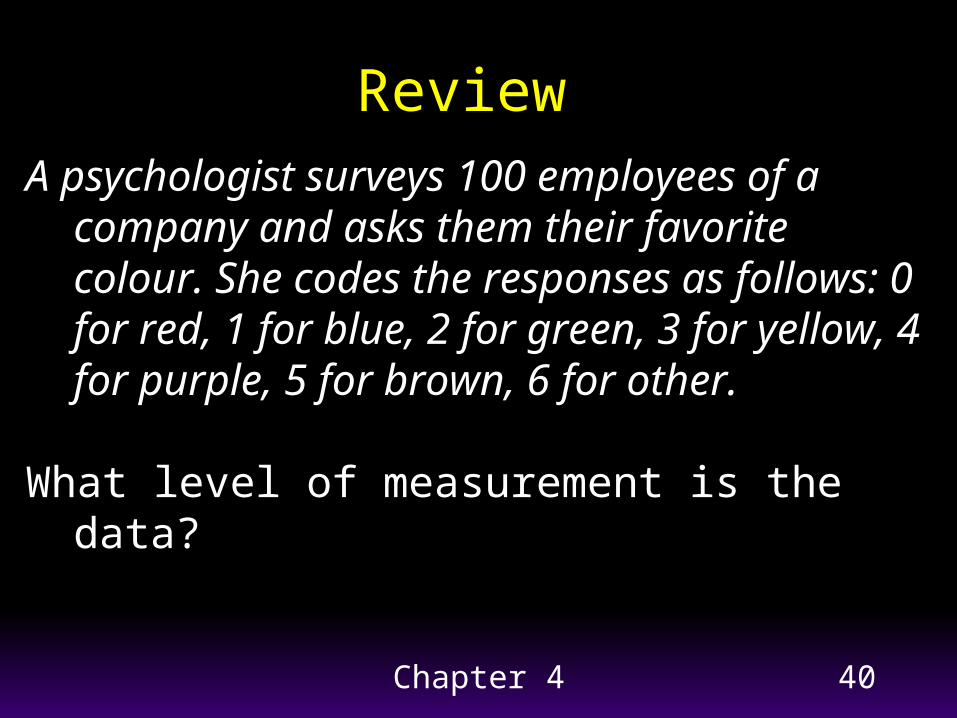
Review A psychologist surveys 100 employees of a
company and asks them their favorite colour. She codes the responses as follows: 0 for red, 1 for blue, 2 for green, 3 for yellow, 4 for purple, 5 for brown, 6 for other.
What level of measurement is the data?
Chapter 4 41
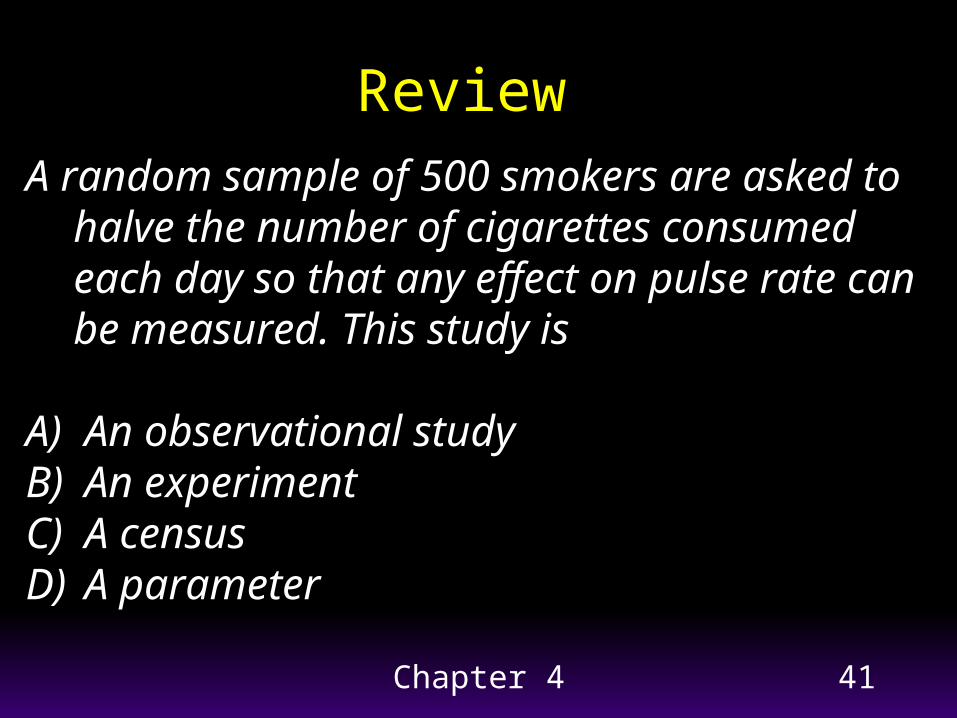
Review A random sample of 500 smokers are asked to
halve the number of cigarettes consumed each day so that any effect on pulse rate can be measured. This study is
A) An observational studyB) An experimentC) A censusD) A parameter
Chapter 4 42
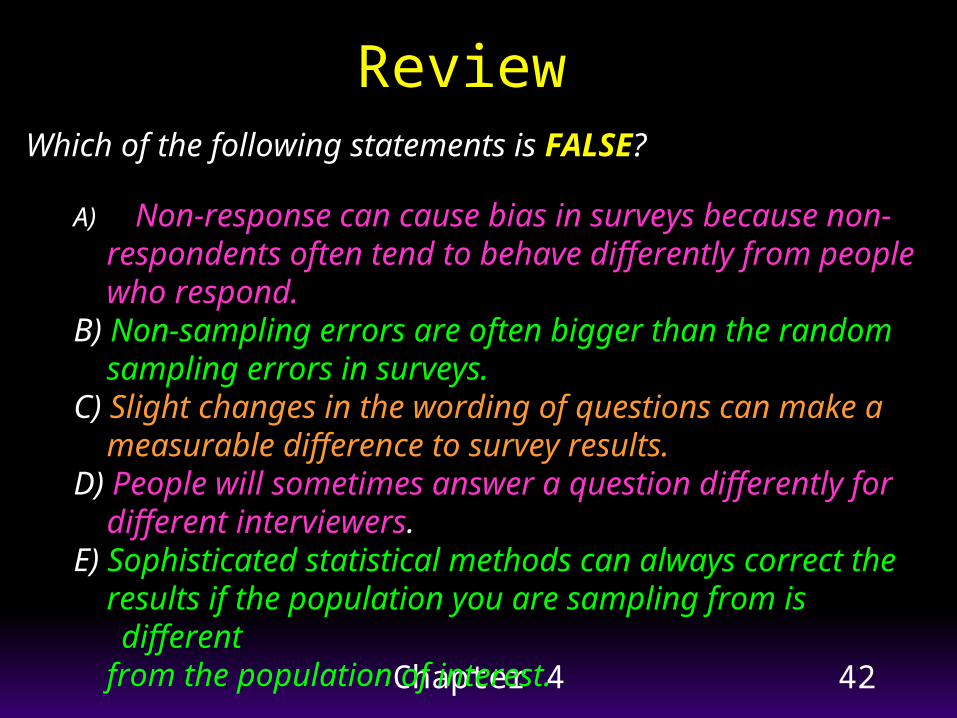
Review Which of the following statements is FALSE?
A) Non-response can cause bias in surveys because non- respondents often tend to behave differently from people who respond. B) Non-sampling errors are often bigger than the random sampling errors in surveys. C) Slight changes in the wording of questions can make a measurable difference to survey results. D) People will sometimes answer a question differently for different interviewers. E) Sophisticated statistical methods can always correct the results if the population you are sampling from is different from the population of interest.