chapter 4 urban facilities restoration and improvement
TRANSCRIPT
The Master Plan Study on Urban Facilities Restoration and Improvement in Monrovia in the Republic of Liberia
Final Report 4-1
CHAPTER 4 URBAN FACILITIES RESTORATION AND IMPROVEMENT PLAN (ROAD AND TRANSPORTATION SECTOR)
4.1 Policy and Strategy for Road and Transport Plan
4.1.1 General Urban Transport Enhancement Strategy
4.1.1.1 Road Network Development
Transport is an entitlement to the citizens of Greater Monrovia, and good transport networks have multiple benefits; socially, economically, environmentally and culturally. Equity is also important as transport should be affordable to all so that there is equal and affordable access to opportunities of employment, education and social inclusion. Furthermore, the paybacks in both direct and indirect terms are substantial and will contribute directly to improved economic performance, productivity and greatly reduce the negative stresses that citizens endure on a daily basis. The Government of Liberia(GoL)’s foremost objectives of road and transportation sectors are to quickly embark upon the rehabilitation of infrastructure and the rebuilding of systems to deliver basic services in order to create the conditions and linkages needed to achieve broad-based growth and poverty reduction. Rebuilding roads and transport service, in particular, is central to achieving all of the GoL’s other major objectives. Without adequate road and transportation infrastructure, the ability to create jobs, expand the rule of law and reduce poverty will be severely constrained, increasing the likelihood of returning to conflict.
4.1.1.2 Urban Transport Efficiency
Roads are the most predominant mode of transport in urban areas and especially in Monrovia. They interconnect production with consumption and market centers. Most of the roads in Monrovia can hardly cope with rapid increase in traffic volumes due to their bad state and insufficient road capacities. Other road related problems particularly in Monrovia include, inadequate stopping and parking spaces, lack of maintenance and room for future expansion, lack of modern terminal (bus/truck terminals), inadequate facilities for non-motorized traffic and pedestrian lanes and lack of road furniture. Furthermore, road capacity has been reduced by road side parking and public bus stops, street vending and pedestrians who are compelled to walk on the carriageways as most of the walkways are full of parked vehicles and petty businesses.
4.1.1.3 Traffic Flow Management and Accident Mitigation
There is a need to minimize traffic congestion in the major Central Business Districts as well as Red Light, Waterside, Duala and other places in Monrovia. There is serious traffic congestion in Monrovia particularly in the areas mentioned above due to rapid increase in car ownership and use. Apparently, the existing road capacity has not been able to cope with vehicle influx. Congestion has also been caused by lack of public education and awareness, lack of parking spaces, poor traffic management including inefficient traffic signals, poorly designed junctions, lack of signs and markings and laxity in traffic regulation enforcement. Furthermore, Greater Monrovia faced the problem of high rate of road traffic accidents, which resulted in significant economic damage.
The Master Plan Study on Urban Facilities Restoration and Improvement in Monrovia in the Republic of Liberia
Final Report 4-2
4.1.1.4 Public Transportation Service Implementation
The provision of transport services in urban centers like Monrovia is generally dominated by the private sector. At present, public transport share of the market in Monrovia is negligible, except private taxi service. In order to meet the transport service demand in urban areas in terms of customer safety, comfort and adequacy, the transportation planning strategy should consider to develop and operate modes of transport on the basis of economic savings on fuel use, operational efficiency including reducing traffic congestion, environmental protection and safety; to segregate public transport. In addition, bus transport should be confined to selected routes to speed up traffic flow; and to establish trucks/bus terminals near the main cities.
4.1.2 Strategy for Road and Transport Plan in Greater Monrovia
4.1.2.1 Overall Goals:
Analyzing the present road and transportation situation and reviewing the existing strategy in terms of road and transportation sectors, such as PRS and NTS, the strategy for road and transport planning in Greater Monrovia for this study is formulated as follows:
To recover and enhance the economic activity through improving the road infrastructure, keeping the stable transport network and reducing traffic congestion, mainly is achieved by road and bridge rehabilitation.
To reduce poverty and raise living standard through implementing the fundamental public transportation services and managing traffic control and safety.
4.1.2.2 Main Short Term Objectives (2008-2014) in the Road and Transport Sector
In the short term, the aim is to rehabilitate major roads and bridges, a critical component of infrastructure and basic services pillar, to facilitate economic activities and combat poverty. Without adequate road infrastructure, the ability to reduce poverty is severely hindered and increases the likelihood of returning to conflict. Massive road projects will provide thousands of jobs for the youth and will have substantial multiplier effects on the economy and poverty reduction, facilitating the enhancement of networking that spur rapid national development.
4.1.2.3 Main Objectives in the Medium Term (2015- 2019)
The main objective of road and transportation sector in the medium term is to restore the road network through maintenance of paved roads, upgrading of primary roads and rehabilitation of secondary and feeder roads in order to reduce traffic congestion. This is critical for getting product out to markets and for improving economic activities throughout the country.
4.1.2.4 Main Objectives in terms of Public Transportation and Traffic Management
The objectives of public transport and traffic management are to install fundamental public transportation service, to manage traffic flow efficiency and to reduce traffic accidents. This is another critical issue for improving economic activities and improving living standard throughout Greater Monrovia.
The policy and strategy of urban transportation planning stated above is summarized as a form of logical
The Master Plan Study on Urban Facilities Restoration and Improvement in Monrovia in the Republic of Liberia
Final Report 4-3
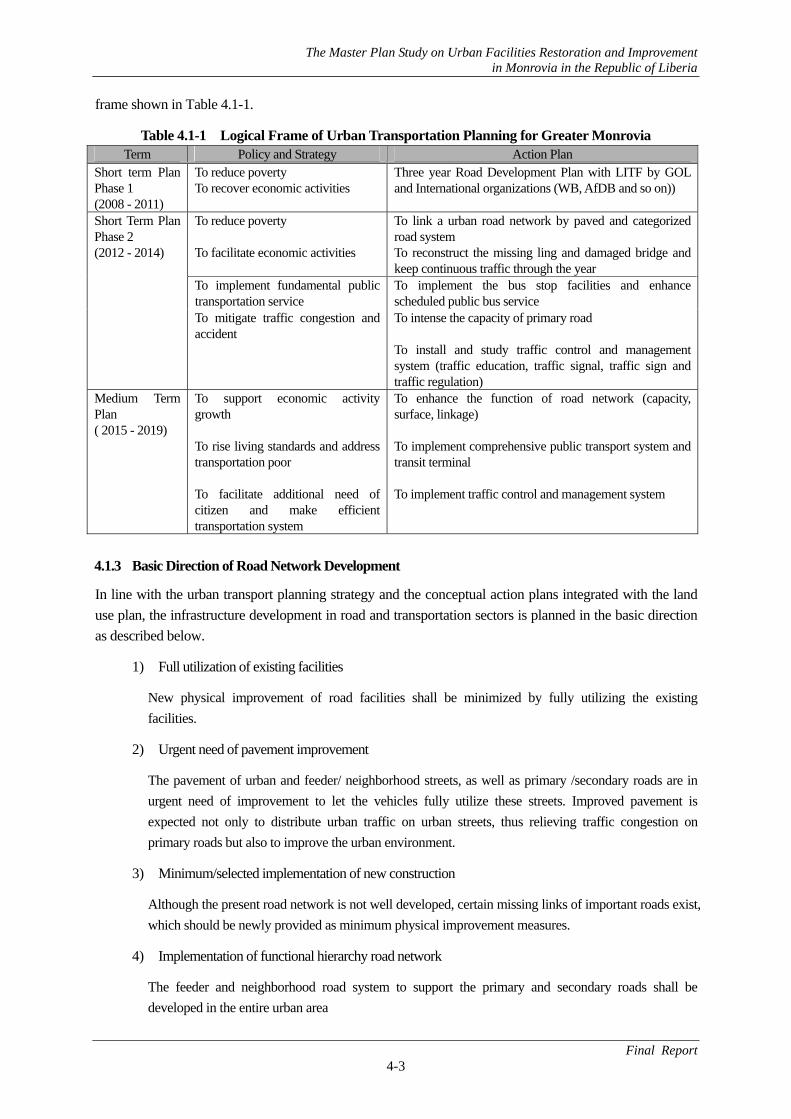
frame shown in Table 4.1-1.
Table 4.1-1 Logical Frame of Urban Transportation Planning for Greater Monrovia Term Policy and Strategy Action Plan
Short term Plan Phase 1 (2008 - 2011)
To reduce poverty To recover economic activities
Three year Road Development Plan with LITF by GOL and International organizations (WB, AfDB and so on))
To reduce poverty To facilitate economic activities
To link a urban road network by paved and categorized road system To reconstruct the missing ling and damaged bridge and keep continuous traffic through the year
To implement fundamental public transportation service
To implement the bus stop facilities and enhance scheduled public bus service
Short Term Plan Phase 2 (2012 - 2014)
To mitigate traffic congestion and accident
To intense the capacity of primary road To install and study traffic control and management system (traffic education, traffic signal, traffic sign and traffic regulation)
Medium Term Plan ( 2015 - 2019)
To support economic activity growth To rise living standards and address transportation poor To facilitate additional need of citizen and make efficient transportation system
To enhance the function of road network (capacity, surface, linkage) To implement comprehensive public transport system and transit terminal To implement traffic control and management system
4.1.3 Basic Direction of Road Network Development
In line with the urban transport planning strategy and the conceptual action plans integrated with the land use plan, the infrastructure development in road and transportation sectors is planned in the basic direction as described below.
1) Full utilization of existing facilities
New physical improvement of road facilities shall be minimized by fully utilizing the existing facilities.
2) Urgent need of pavement improvement
The pavement of urban and feeder/ neighborhood streets, as well as primary /secondary roads are in urgent need of improvement to let the vehicles fully utilize these streets. Improved pavement is expected not only to distribute urban traffic on urban streets, thus relieving traffic congestion on primary roads but also to improve the urban environment.
3) Minimum/selected implementation of new construction
Although the present road network is not well developed, certain missing links of important roads exist, which should be newly provided as minimum physical improvement measures.
4) Implementation of functional hierarchy road network
The feeder and neighborhood road system to support the primary and secondary roads shall be developed in the entire urban area
The Master Plan Study on Urban Facilities Restoration and Improvement in Monrovia in the Republic of Liberia
Final Report 4-4
5) Improvement of congested primary roads
The Primary roads in Monrovia are very congested because of concentration of traffic, and shall be improved by widening the existing roads or providing alternative, detourring roads.
6) Reconstruction of existing bridges and culverts
There exist many deteriorated or collapsed bridges and culverts along with existing feeder/ neighborhood roads, which are not usable, particularly during rainy seasons. The urgent reconstruction of these bridges shall be undertaken.
4.1.4 Road Hierarchy and Classification System
4.1.4.1 Necessity of Road Classification System
For the planning and management of road facilities, road classification system to assist with the coordination and planning of land use and transportation should be developed. The establishment of roadway classification system can help with the establishment of designated road right-of-way widths and design standards for access control, road cross-sections, pavement structure, drainage systems, sidewalks and boulevards and street lighting. It can assist with the establishment of traffic operations standards and guidelines for traffic control devices, pavement markings, on-street parking and stopping regulations, speed limits and pedestrian and cycling facilities.
Road classification aids the organization of data and information for road design and traffic operations. It can assist with the establishment of standards and guidelines for street cleaning and litter removal, and pavement, sidewalk and main roads reconstruction and maintenance. It can also be used in the development of guidelines for right-of-way management for the accommodation of utilities, potential advertising, vendors and banners and pennants. A road classification system not only provides a fundamental management tool for transportation staff. Road users as well as communities derive benefits from its existence and its consistent application. Formalized road classifications help residents, residents’ groups, business people, planning professionals and other stakeholders to have clear understanding of the function and characteristics of particular roads.
4.1.4.2 Characteristics of Road Classification System
Road classification is “the orderly grouping of roads into systems according to the type and degree of service they provide to the public.” Road classification system groups streets in a hierarchical manner by different groups which perform different functions each other. The hierarchy provides a variation in service. The highest order roads provide high traffic service levels and have little or no access to abutting properties. The lowest order roads (local roads) provide low traffic service levels but with full property access. Between these two extremes, arterial roads provide relatively high traffic service levels with some property access, while collector roads provide equal priority to traffic service and property access. Collector roads, as their name implies, serve to collect traffic from local roads and provide access to arterial roads, which then may connect to expressways or main highways. Collectors also can be thought of as distributors of traffic from the main roads to the minor roads. As would be expected, traffic volumes are typically higher on higher level roads than on lower level roads. Other characteristics of roads are dependent on road classification too. Speed limits and traffic operating speeds tend to be higher on higher level streets.
The Master Plan Study on Urban Facilities Restoration and Improvement in Monrovia in the Republic of Liberia
Final Report 4-5
Higher level roads are generally wider with more traffic lanes and bus and streetcar service is generally concentrated on arterial and collector roads. Because more pedestrians are likely to use roads of higher classification, sidewalks or shoulders are more important on these roads than on local streets with low volumes of motorized traffic traveling at low speeds. Cyclists will generally not need special facilities on local streets but are more likely to need bicycle lanes or shoulders on arterial roads, where competition for road space is more intense.
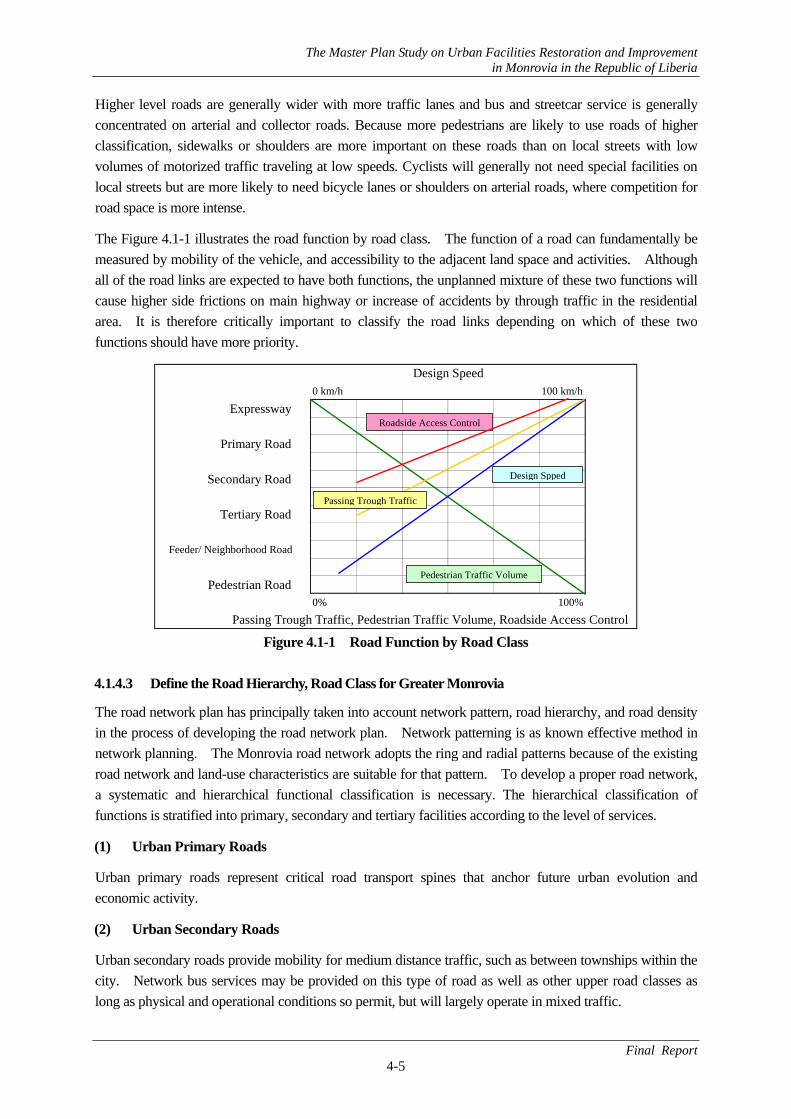
The Figure 4.1-1 illustrates the road function by road class. The function of a road can fundamentally be measured by mobility of the vehicle, and accessibility to the adjacent land space and activities. Although all of the road links are expected to have both functions, the unplanned mixture of these two functions will cause higher side frictions on main highway or increase of accidents by through traffic in the residential area. It is therefore critically important to classify the road links depending on which of these two functions should have more priority.
Figure 4.1-1 Road Function by Road Class
4.1.4.3 Define the Road Hierarchy, Road Class for Greater Monrovia
The road network plan has principally taken into account network pattern, road hierarchy, and road density in the process of developing the road network plan. Network patterning is as known effective method in network planning. The Monrovia road network adopts the ring and radial patterns because of the existing road network and land-use characteristics are suitable for that pattern. To develop a proper road network, a systematic and hierarchical functional classification is necessary. The hierarchical classification of functions is stratified into primary, secondary and tertiary facilities according to the level of services.
(1) Urban Primary Roads
Urban primary roads represent critical road transport spines that anchor future urban evolution and economic activity.
(2) Urban Secondary Roads
Urban secondary roads provide mobility for medium distance traffic, such as between townships within the city. Network bus services may be provided on this type of road as well as other upper road classes as long as physical and operational conditions so permit, but will largely operate in mixed traffic.
0 km/h 100 km/h
Expressway
Primary Road
Secondary Road
Tertiary Road
Feeder/ Neighborhood Road
Pedestrian Road0% 100%
Design Speed
Passing Trough Traffic, Pedestrian Traffic Volume, Roadside Access Control
Pedestrian Traffic Volume
Roadside Access Control
Design Spped
Passing Trough Traffic
The Master Plan Study on Urban Facilities Restoration and Improvement in Monrovia in the Republic of Liberia
Final Report 4-6
(3) Urban Tertiary Roads
Urban tertiary roads provide accessibility to defined geographical areas within the city, and are intended to provide linkage with other higher-order roads. Urban tertiary roads also provide accessibility to and/or between neighborhoods, communities and individual plots.
The main characteristics of each functional class are summarized in Table 4.1-2.
Table 4.1-2 Definition of Road Classification for Greater Monrovia Class Function
Urban Primary Road Link to national primary road outside of Monrovia From core metropolitan spines Accommodate longer trips Connect major trip generators Network Bus service provided
Urban Secondary Road
Link between township Accommodate travel demands between townships or major communities. Link to urban primary roads Network Bus service provided
Urban Tertiary Road (Feeder road, Neighborhood Road)
Link Between Community Provide circulation within as well as between townships and communities
4.1.4.4 Road Design Standards by Classification
The functional elements of the new system embody not only “traffic oriented” considerations, but also the broader aspect of mobility and connectivity between various elements of the urban fabric. For example, urban primary roads form the backbone of connectivity involving major urban precincts such as CBD or townships. Neighborhoods and communities, in turn, would have a higher reliance on urban secondary roads. This, in turn, implies various guidelines in terms of design speed, number of lanes, shoulder and sidewalk.
The proposed road design standards for the master plan basically follow the international standards, such as the American Association of State Highway and Transportation Officials (AASHTO) and Road Structure Guidelines, Japan Association of Road. The Table 4.1-3 explained the proposed road design standard by road class. In reality, however, it is often difficult to secure sufficient space for roads in urban areas due to resettlement problems and high compensation costs. Therefore, planning of road cross-sections must balance these constraints and the space requirements of roads according to function, because road space is not merely for vehicle traffic but also for pedestrian traffic, landscape improvement, and as space for various activities
Table 4.1-3 Proposed Design Standards by Road Class Classification Design Speed
(km/hr) Lane Wide
(m) Typical No.
of Lanes Shoulder
(m) Sidewalk
(m) Urban Primary Road 60 - 80 3.00 – 3.50 4 - 6 1.0 – 3.0 2.0 – 4.0 Urban Secondary Road 40 - 60 3.00 – 3.25 2 --4 1.0 – 2.0 1.0 – 3.0 Urban Tertiary Road 30 - 40 2.50 – 3.00 1 - 2 0.5 – 1.0 0.0 – 2.0
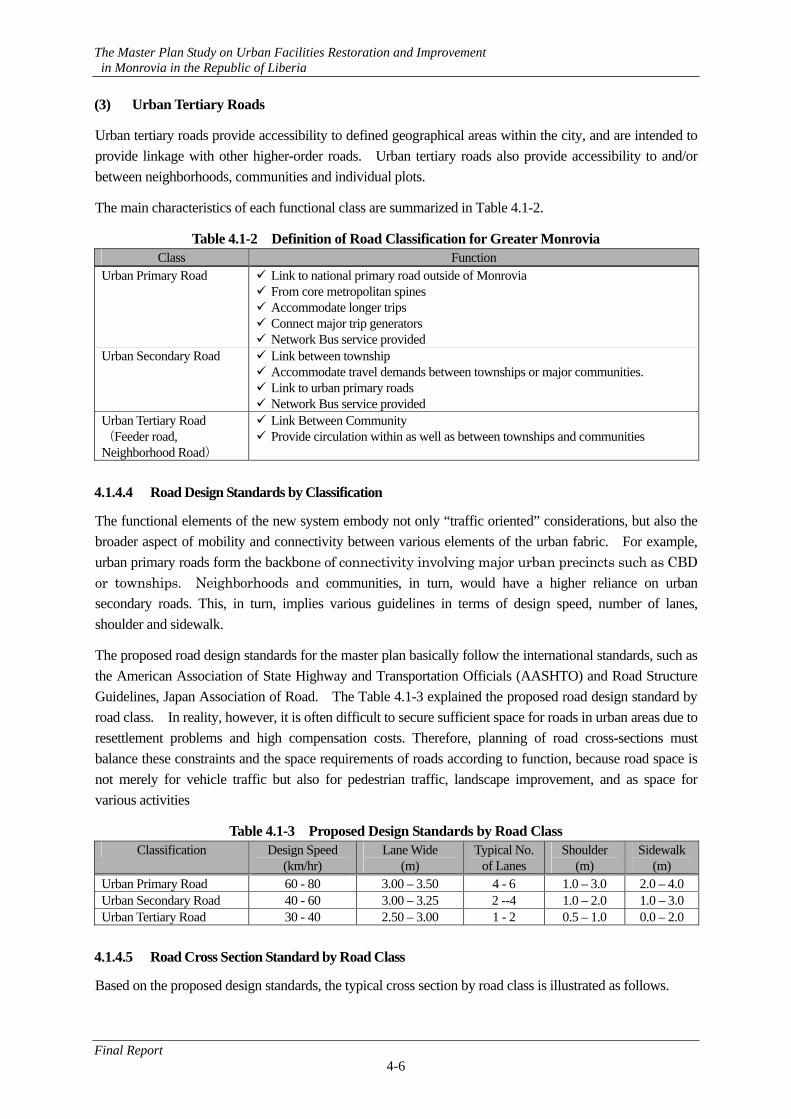
4.1.4.5 Road Cross Section Standard by Road Class
Based on the proposed design standards, the typical cross section by road class is illustrated as follows.
The Master Plan Study on Urban Facilities Restoration and Improvement in Monrovia in the Republic of Liberia
Final Report 4-7
Figu
re 4
.1-2
Ty
pica
l Cro
ss S
ectio
n by
Roa
d C
lass
The Master Plan Study on Urban Facilities Restoration and Improvement in Monrovia in the Republic of Liberia
Final Report 4-8
4.2 Traffic Demand Forecast
4.2.1 Methodology
4.2.1.1 Transportation Modeling
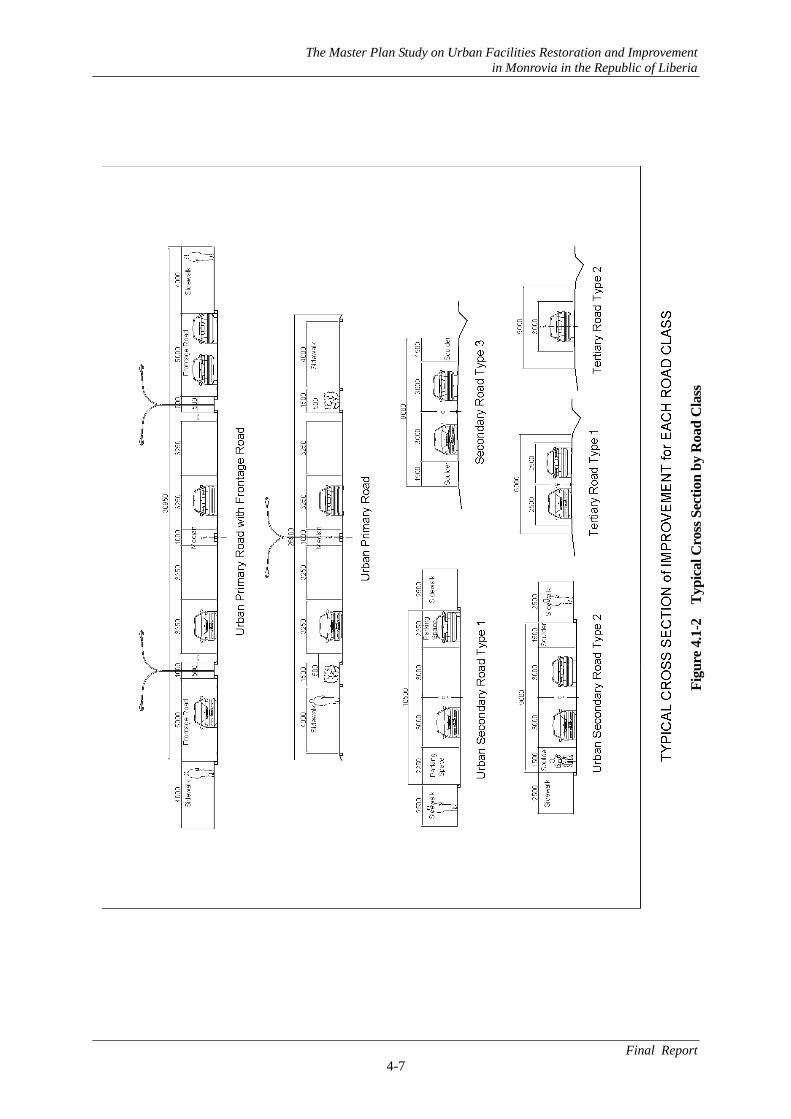
Consideration of the urban area throughout Greater Monrovia is necessary as a base to precisely determine transportation investment decisions regarding comprehensive, cooperative, and continuing transportation planning process. Significant element of the transportation planning process involves projecting future transportation demand. The most accepted method of projecting future transportation demand, and for evaluating investment strategies to serve the projected demand, is the use of travel demand and forecasting models. Transportation modeling is to find the relationship between urban situation and people's movements. In this case the models have utilized socio-economic data that was presented in Chapter 3 to estimate travel demand coupled with simulation of the transportation system to represent transportation supply. Together with this socio-economic data, the simulated transport network, and mathematical travel models simulate the ability of the transportation system to serve the estimated demand. Figure4.2-1 shows the flowchart of this stage.
Figure 4.2-1 Principle of Transportation Modeling
4.2.1.2 Four-step Approach
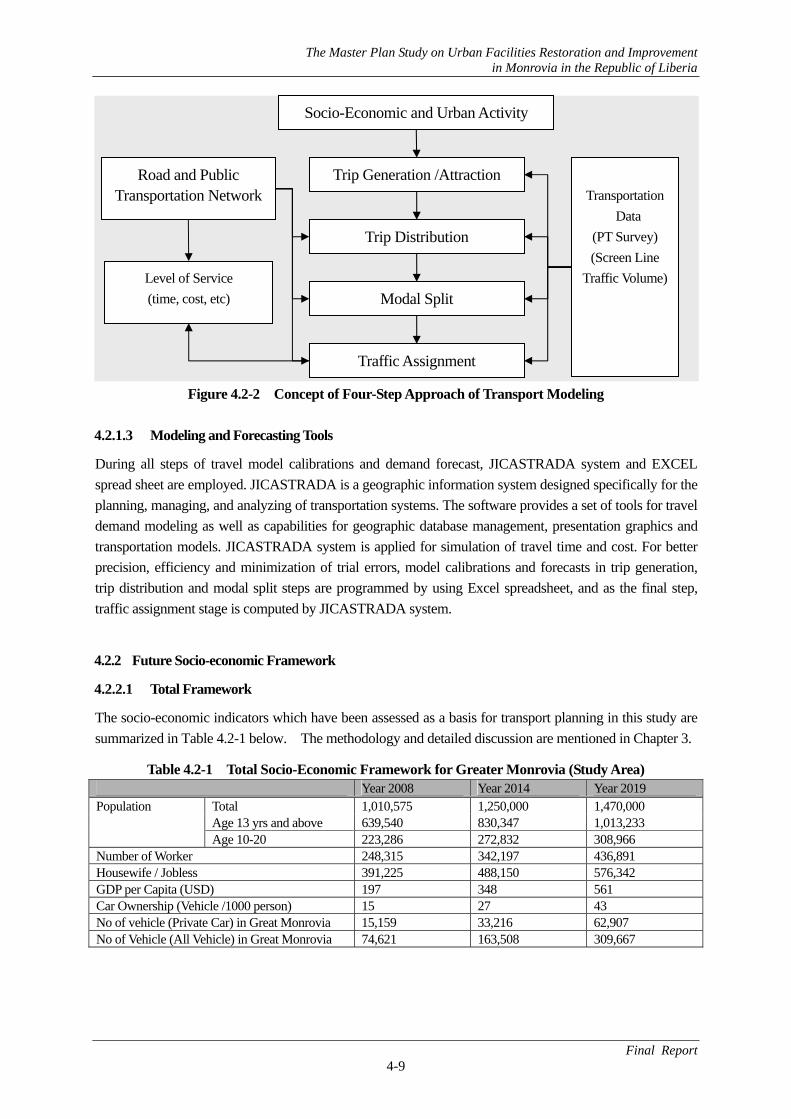
Travel models have been implemented by using a wide variety of model structures, computer software systems, and data sets. While it is rare to find two models that have identical model structures, software, and data sets, the majority of travel models applied in the world wide are similar in that context. The transport model framework uses a conventional 4 steps approach which has been well-tried and found to be effective in many cities around the world. The concept of the 4 steps approach is shown as Figure 4.2-2. It includes the following basic four steps or components:
• Trip Generation and Attraction Model: estimating the amount of travel and where it begins and finishes;
• Trip Distribution Model: linking the trip together to form trips between the origins and destinations; • Modal Split Model: accessing the modal shares of the available travel modes; and, • Assignment Model: usage of each segment of the road and public transport networks.
The main thrust of the model is targeted at representing the travel demand of the residents of the study area, and their usage of private and public transports such as private car, taxi, shared taxi, tram, bus metro and so on.
Resident, People
City Structure, Land Use Transportation System
Transportation Demand
Universal Rule (Scientific, Mathematical, Physical Relationship)
The Master Plan Study on Urban Facilities Restoration and Improvement in Monrovia in the Republic of Liberia
Final Report 4-9
Figure 4.2-2 Concept of Four-Step Approach of Transport Modeling
4.2.1.3 Modeling and Forecasting Tools
During all steps of travel model calibrations and demand forecast, JICASTRADA system and EXCEL spread sheet are employed. JICASTRADA is a geographic information system designed specifically for the planning, managing, and analyzing of transportation systems. The software provides a set of tools for travel demand modeling as well as capabilities for geographic database management, presentation graphics and transportation models. JICASTRADA system is applied for simulation of travel time and cost. For better precision, efficiency and minimization of trial errors, model calibrations and forecasts in trip generation, trip distribution and modal split steps are programmed by using Excel spreadsheet, and as the final step, traffic assignment stage is computed by JICASTRADA system.
4.2.2 Future Socio-economic Framework
4.2.2.1 Total Framework
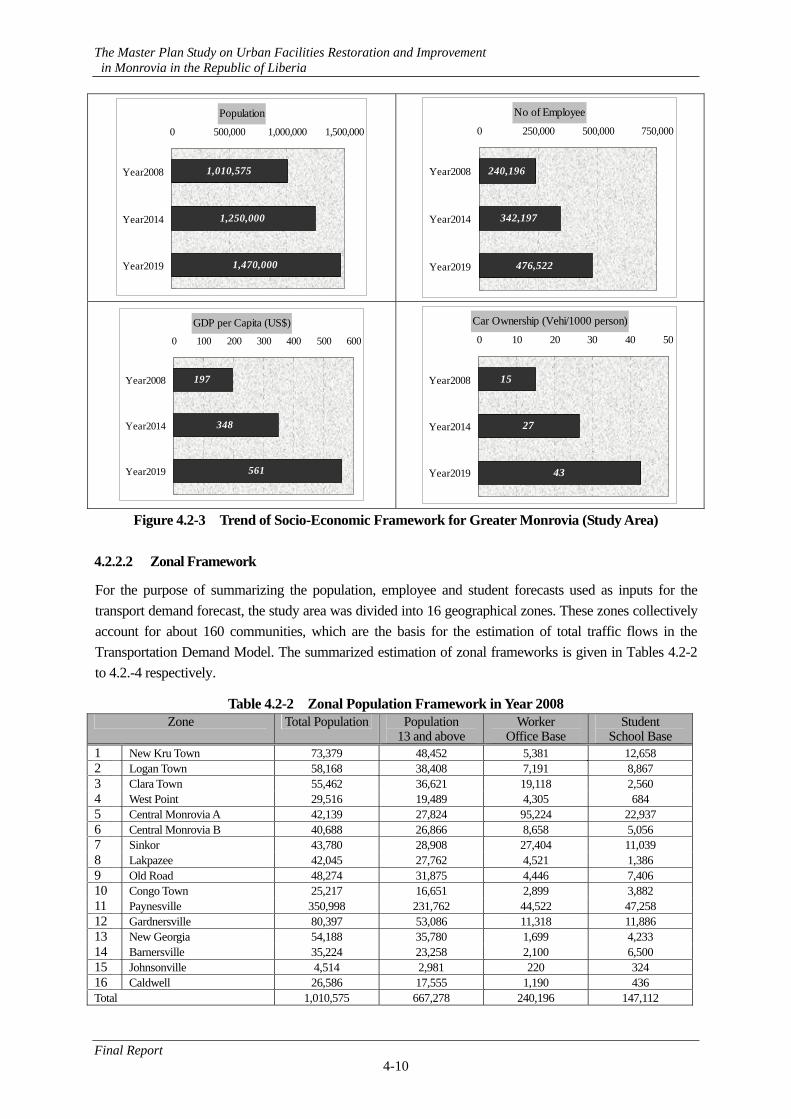
The socio-economic indicators which have been assessed as a basis for transport planning in this study are summarized in Table 4.2-1 below. The methodology and detailed discussion are mentioned in Chapter 3.
Table 4.2-1 Total Socio-Economic Framework for Greater Monrovia (Study Area) Year 2008 Year 2014 Year 2019
Total 1,010,575 1,250,000 1,470,000 Age 13 yrs and above 639,540 830,347 1,013,233
Population
Age 10-20 223,286 272,832 308,966 Number of Worker 248,315 342,197 436,891 Housewife / Jobless 391,225 488,150 576,342 GDP per Capita (USD) 197 348 561 Car Ownership (Vehicle /1000 person) 15 27 43 No of vehicle (Private Car) in Great Monrovia 15,159 33,216 62,907 No of Vehicle (All Vehicle) in Great Monrovia 74,621 163,508 309,667
Socio-Economic and Urban Activity
Traffic Assignment
Trip Generation /Attraction
Modal Split
Trip Distribution
Road and Public Transportation Network
Level of Service (time, cost, etc)
Transportation
Data (PT Survey) (Screen Line
Traffic Volume)
The Master Plan Study on Urban Facilities Restoration and Improvement in Monrovia in the Republic of Liberia
Final Report 4-10
Population
1,010,575
1,250,000
1,470,000
0 500,000 1,000,000 1,500,000
Year2008
Year2014
Year2019
No of Employee
240,196
342,197
476,522
0 250,000 500,000 750,000
Year2008
Year2014
Year2019
GDP per Capita (US$)
197
348
561
0 100 200 300 400 500 600
Year2008
Year2014
Year2019
Car Ownership (Vehi/1000 person)
15
27
43
0 10 20 30 40 50
Year2008
Year2014
Year2019
Figure 4.2-3 Trend of Socio-Economic Framework for Greater Monrovia (Study Area)
4.2.2.2 Zonal Framework
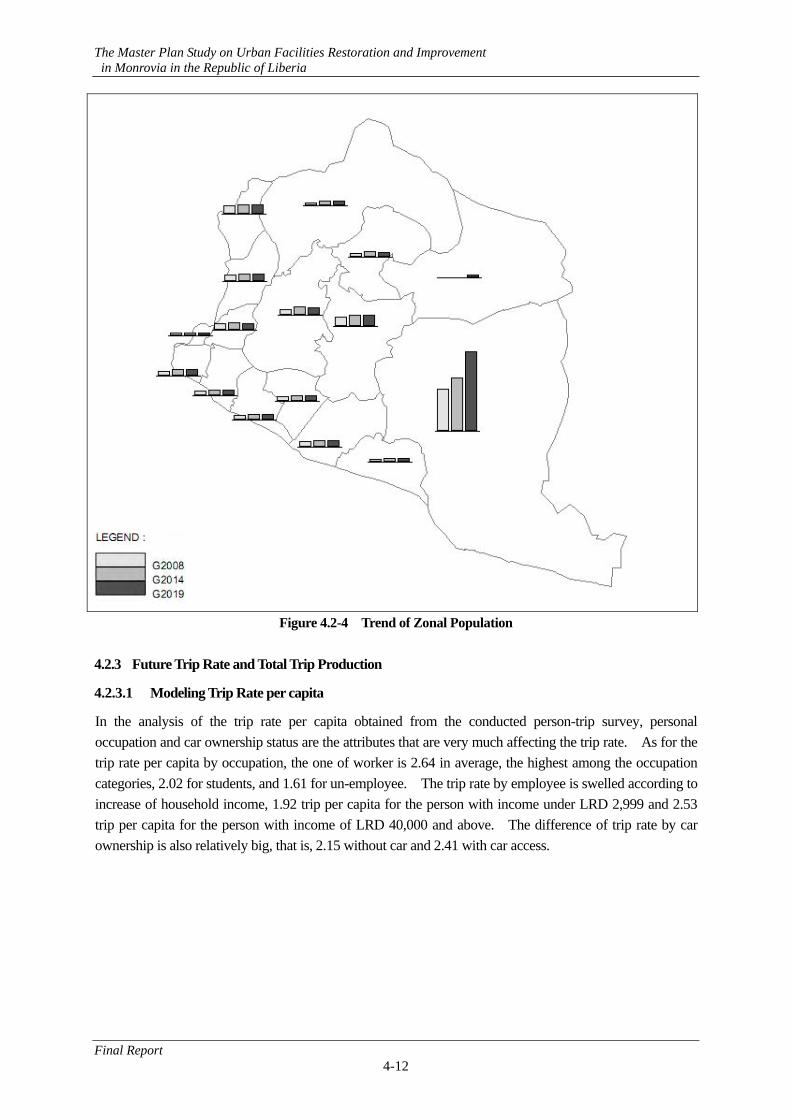
For the purpose of summarizing the population, employee and student forecasts used as inputs for the transport demand forecast, the study area was divided into 16 geographical zones. These zones collectively account for about 160 communities, which are the basis for the estimation of total traffic flows in the Transportation Demand Model. The summarized estimation of zonal frameworks is given in Tables 4.2-2 to 4.2.-4 respectively.
Table 4.2-2 Zonal Population Framework in Year 2008 Zone Total Population Population
13 and above Worker
Office Base Student
School Base 1 New Kru Town 73,379 48,452 5,381 12,658 2 Logan Town 58,168 38,408 7,191 8,867 3 Clara Town 55,462 36,621 19,118 2,560 4 West Point 29,516 19,489 4,305 684 5 Central Monrovia A 42,139 27,824 95,224 22,937 6 Central Monrovia B 40,688 26,866 8,658 5,056 7 Sinkor 43,780 28,908 27,404 11,039 8 Lakpazee 42,045 27,762 4,521 1,386 9 Old Road 48,274 31,875 4,446 7,406 10 Congo Town 25,217 16,651 2,899 3,882 11 Paynesville 350,998 231,762 44,522 47,258 12 Gardnersville 80,397 53,086 11,318 11,886 13 New Georgia 54,188 35,780 1,699 4,233 14 Barnersville 35,224 23,258 2,100 6,500 15 Johnsonville 4,514 2,981 220 324 16 Caldwell 26,586 17,555 1,190 436 Total 1,010,575 667,278 240,196 147,112
The Master Plan Study on Urban Facilities Restoration and Improvement in Monrovia in the Republic of Liberia
Final Report 4-11
Table 4.2-3 Zonal Population Framework in Year 2014 Zone Total Population Population
13 and above Worker
Office Base Student
School Base 1 New Kru Town 80,173 53,257 8,348 10,849 2 Logan Town 65,730 43,663 12,561 8,895 3 Clara Town 62,075 41,235 26,208 8,400 4 West Point 27,454 18,237 5,795 3,715 5 Central Monrovia A 59,163 39,300 108,142 26,006 6 Central Monrovia B 46,631 30,976 14,368 6,310 7 Sinkor 51,792 34,405 37,376 7,009 8 Lakpazee 49,559 32,921 6,118 6,706 9 Old Road 57,622 38,277 7,184 7,797 10 Congo Town 36,086 23,971 4,540 4,883 11 Paynesville 445,954 296,238 80,415 60,347 12 Gardnersville 99,431 66,050 19,594 13,455 13 New Georgia 70,162 46,607 2,451 9,494 14 Barnersville 46,588 30,947 2,872 6,304 15 Johnsonville 7,403 4,918 804 1,002 16 Caldwell 44,177 29,346 5,420 5,978 Total 1,250,000 830,347 342,197 187,152
Table 4.2-4 Zonal Population Framework in Year 2019 Zone Total Population Population
13 and above Worker
Office Base Student
School Base 1 New Kru Town 77,795 53,622 12,104 10,924 2 Logan Town 67,997 44,898 19,118 9,146 3 Clara Town 58,874 38,874 35,774 7,919 4 West Point 29,516 19,489 7,832 3,970 5 Central Monrovia A 60,723 40,095 131,275 26,168 6 Central Monrovia B 48,595 32,087 21,436 6,537 7 Sinkor 49,806 32,887 50,879 6,699 8 Lakpazee 46,905 30,971 8,292 6,309 9 Old Road 54,426 35,937 10,600 7,321 10 Congo Town 33,133 21,878 6,610 4,457 11 Paynesville 660,010 435,802 123,904 88,778 12 Gardnersville 100,389 66,286 29,720 13,503 13 New Georgia 63,975 42,242 3,435 8,605 14 Barnersville 45,736 30,199 3,915 6,152 15 Johnsonville 29,457 19,450 1,464 3,962 16 Caldwell 42,661 28,169 10,162 5,738 Total 1,470,000 1,013,233 476,522 211,938
The Master Plan Study on Urban Facilities Restoration and Improvement in Monrovia in the Republic of Liberia
Final Report 4-12
Figure 4.2-4 Trend of Zonal Population 4.2.3 Future Trip Rate and Total Trip Production
4.2.3.1 Modeling Trip Rate per capita
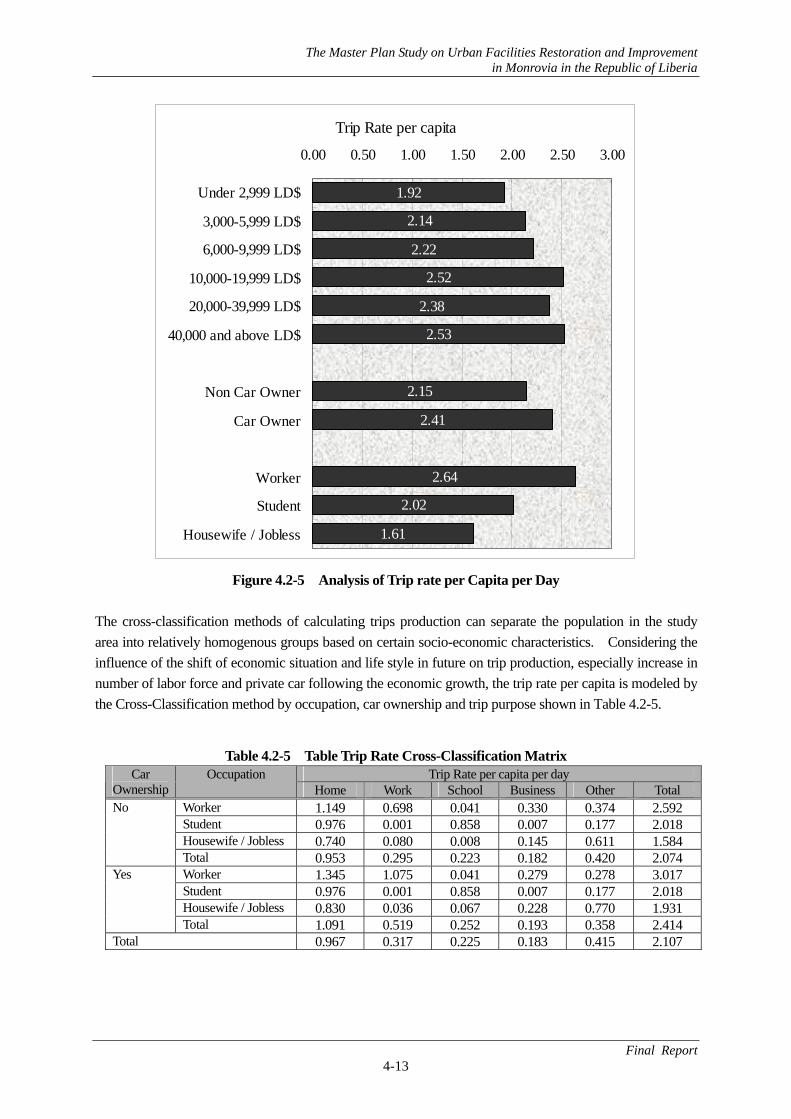
In the analysis of the trip rate per capita obtained from the conducted person-trip survey, personal occupation and car ownership status are the attributes that are very much affecting the trip rate. As for the trip rate per capita by occupation, the one of worker is 2.64 in average, the highest among the occupation categories, 2.02 for students, and 1.61 for un-employee. The trip rate by employee is swelled according to increase of household income, 1.92 trip per capita for the person with income under LRD 2,999 and 2.53 trip per capita for the person with income of LRD 40,000 and above. The difference of trip rate by car ownership is also relatively big, that is, 2.15 without car and 2.41 with car access.
The Master Plan Study on Urban Facilities Restoration and Improvement in Monrovia in the Republic of Liberia
Final Report 4-13
Trip Rate per capita
1.92
2.14
2.22
2.52
2.38
2.53
2.15
2.41
2.64
2.02
1.61
0.00 0.50 1.00 1.50 2.00 2.50 3.00
Under 2,999 LD$
3,000-5,999 LD$
6,000-9,999 LD$
10,000-19,999 LD$
20,000-39,999 LD$
40,000 and above LD$
Non Car Owner
Car Owner
Worker
Student
Housewife / Jobless
Figure 4.2-5 Analysis of Trip rate per Capita per Day The cross-classification methods of calculating trips production can separate the population in the study area into relatively homogenous groups based on certain socio-economic characteristics. Considering the influence of the shift of economic situation and life style in future on trip production, especially increase in number of labor force and private car following the economic growth, the trip rate per capita is modeled by the Cross-Classification method by occupation, car ownership and trip purpose shown in Table 4.2-5.
Table 4.2-5 Table Trip Rate Cross-Classification Matrix
Trip Rate per capita per day Car Ownership
Occupation Home Work School Business Other Total
Worker 1.149 0.698 0.041 0.330 0.374 2.592 Student 0.976 0.001 0.858 0.007 0.177 2.018 Housewife / Jobless 0.740 0.080 0.008 0.145 0.611 1.584
No
Total 0.953 0.295 0.223 0.182 0.420 2.074 Worker 1.345 1.075 0.041 0.279 0.278 3.017 Student 0.976 0.001 0.858 0.007 0.177 2.018 Housewife / Jobless 0.830 0.036 0.067 0.228 0.770 1.931
Yes
Total 1.091 0.519 0.252 0.193 0.358 2.414 Total 0.967 0.317 0.225 0.183 0.415 2.107
The Master Plan Study on Urban Facilities Restoration and Improvement in Monrovia in the Republic of Liberia
Final Report 4-14
4.2.3.2 Future Total Trip Generated from Greater Monrovia
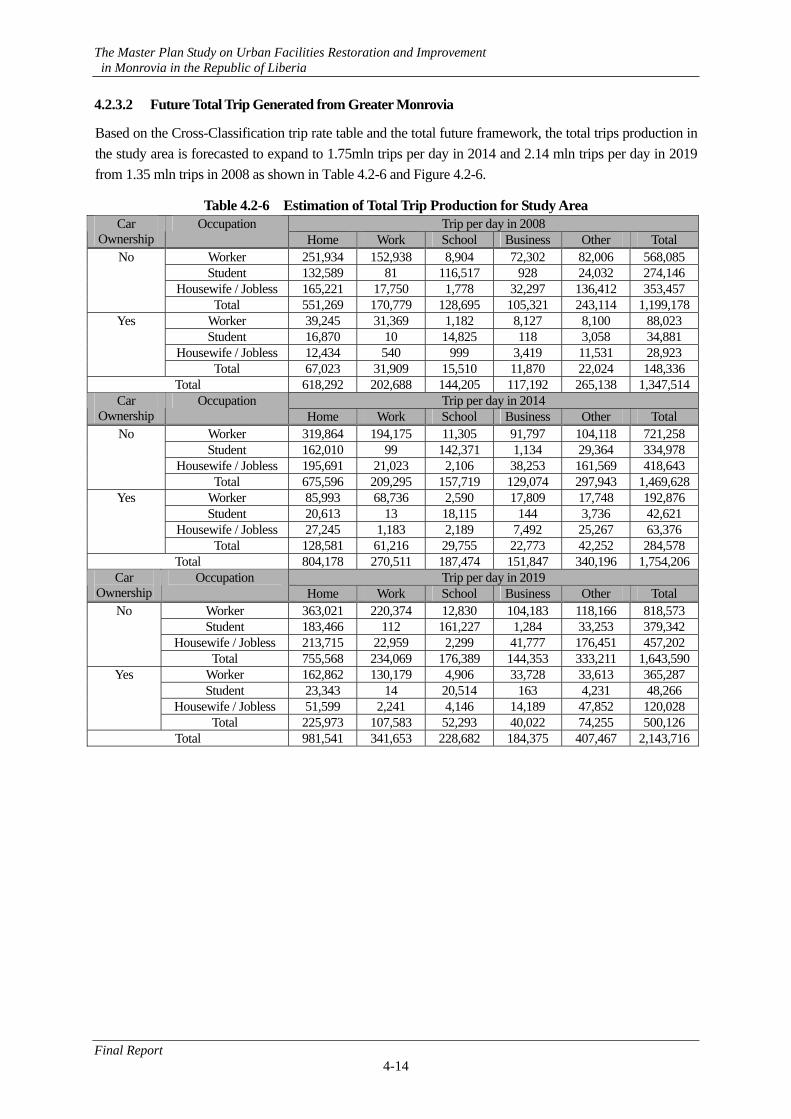
Based on the Cross-Classification trip rate table and the total future framework, the total trips production in the study area is forecasted to expand to 1.75mln trips per day in 2014 and 2.14 mln trips per day in 2019 from 1.35 mln trips in 2008 as shown in Table 4.2-6 and Figure 4.2-6.
Table 4.2-6 Estimation of Total Trip Production for Study Area Trip per day in 2008 Car
Ownership Occupation
Home Work School Business Other Total Worker 251,934 152,938 8,904 72,302 82,006 568,085 Student 132,589 81 116,517 928 24,032 274,146
Housewife / Jobless 165,221 17,750 1,778 32,297 136,412 353,457
No
Total 551,269 170,779 128,695 105,321 243,114 1,199,178Worker 39,245 31,369 1,182 8,127 8,100 88,023 Student 16,870 10 14,825 118 3,058 34,881
Housewife / Jobless 12,434 540 999 3,419 11,531 28,923
Yes
Total 67,023 31,909 15,510 11,870 22,024 148,336 Total 618,292 202,688 144,205 117,192 265,138 1,347,514
Trip per day in 2014 Car Ownership
Occupation Home Work School Business Other Total
Worker 319,864 194,175 11,305 91,797 104,118 721,258 Student 162,010 99 142,371 1,134 29,364 334,978
Housewife / Jobless 195,691 21,023 2,106 38,253 161,569 418,643
No
Total 675,596 209,295 157,719 129,074 297,943 1,469,628Worker 85,993 68,736 2,590 17,809 17,748 192,876 Student 20,613 13 18,115 144 3,736 42,621
Housewife / Jobless 27,245 1,183 2,189 7,492 25,267 63,376
Yes
Total 128,581 61,216 29,755 22,773 42,252 284,578 Total 804,178 270,511 187,474 151,847 340,196 1,754,206
Trip per day in 2019 Car Ownership
Occupation Home Work School Business Other Total
Worker 363,021 220,374 12,830 104,183 118,166 818,573 Student 183,466 112 161,227 1,284 33,253 379,342
Housewife / Jobless 213,715 22,959 2,299 41,777 176,451 457,202
No
Total 755,568 234,069 176,389 144,353 333,211 1,643,590Worker 162,862 130,179 4,906 33,728 33,613 365,287 Student 23,343 14 20,514 163 4,231 48,266
Housewife / Jobless 51,599 2,241 4,146 14,189 47,852 120,028
Yes
Total 225,973 107,583 52,293 40,022 74,255 500,126 Total 981,541 341,653 228,682 184,375 407,467 2,143,716
The Master Plan Study on Urban Facilities Restoration and Improvement in Monrovia in the Republic of Liberia
Final Report 4-15
0 500 1,000 1,500 2,000 2,500
Year2008
Year2014
Year2019
Trip per day ('000)
Home Work School Business Other
Figure 4.2-6 Trend of Number of Trips by Purpose 4.2.4 Future Trip Generation and Attraction
4.2.4.1 Modeling Trip Generation and Attraction by Zone
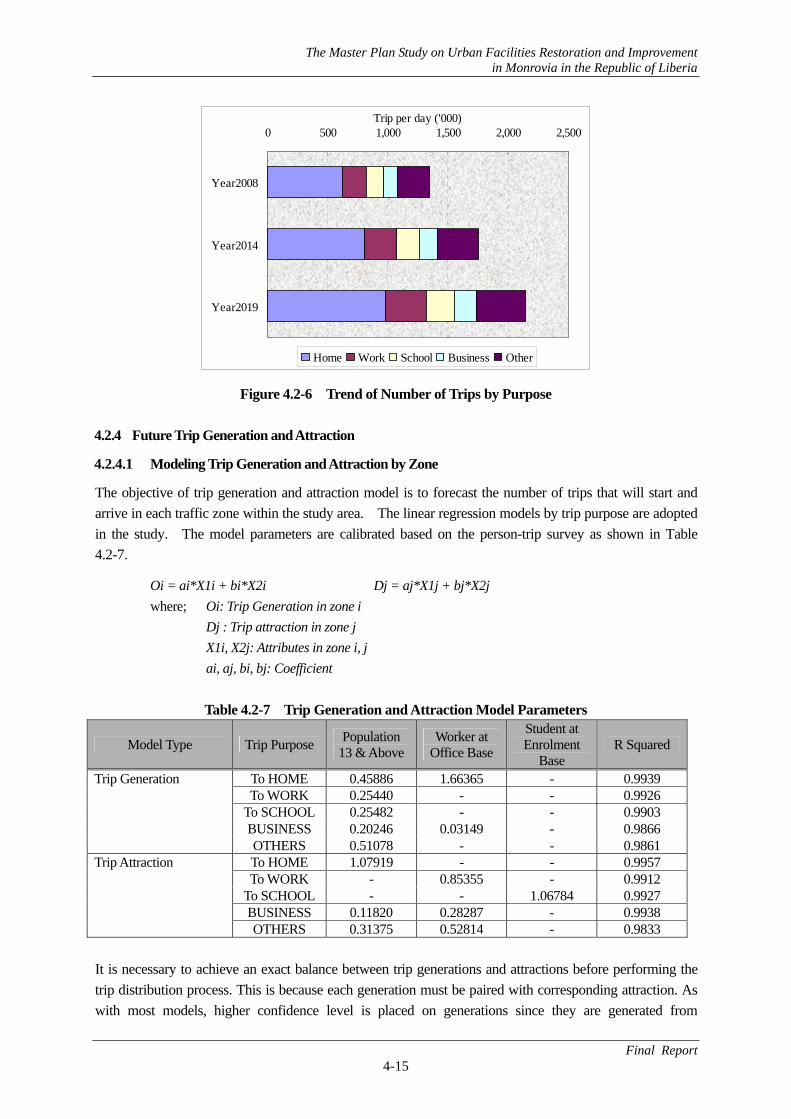
The objective of trip generation and attraction model is to forecast the number of trips that will start and arrive in each traffic zone within the study area. The linear regression models by trip purpose are adopted in the study. The model parameters are calibrated based on the person-trip survey as shown in Table 4.2-7.
Oi = ai*X1i + bi*X2i Dj = aj*X1j + bj*X2j where; Oi: Trip Generation in zone i
Dj : Trip attraction in zone j X1i, X2j: Attributes in zone i, j ai, aj, bi, bj: Coefficient
Table 4.2-7 Trip Generation and Attraction Model Parameters
Model Type Trip Purpose Population 13 & Above
Worker at Office Base
Student at Enrolment
Base R Squared
To HOME 0.45886 1.66365 - 0.9939 To WORK 0.25440 - - 0.9926
To SCHOOL 0.25482 - - 0.9903 BUSINESS 0.20246 0.03149 - 0.9866
Trip Generation
OTHERS 0.51078 - - 0.9861 To HOME 1.07919 - - 0.9957 To WORK - 0.85355 - 0.9912
To SCHOOL - - 1.06784 0.9927 BUSINESS 0.11820 0.28287 - 0.9938
Trip Attraction
OTHERS 0.31375 0.52814 - 0.9833 It is necessary to achieve an exact balance between trip generations and attractions before performing the trip distribution process. This is because each generation must be paired with corresponding attraction. As with most models, higher confidence level is placed on generations since they are generated from
The Master Plan Study on Urban Facilities Restoration and Improvement in Monrovia in the Republic of Liberia
Final Report 4-16
household data. Employment data is much more difficult to collect, hence, has a lower confidence level of accuracy. Consequently, using the total trip productions by purpose trip forecast, when applying the Cross-Classification trip rate as shown in the above Table 4.2-7, trip generations and attractions are balanced.
4.2.4.2 Future Trip Generation and Attraction
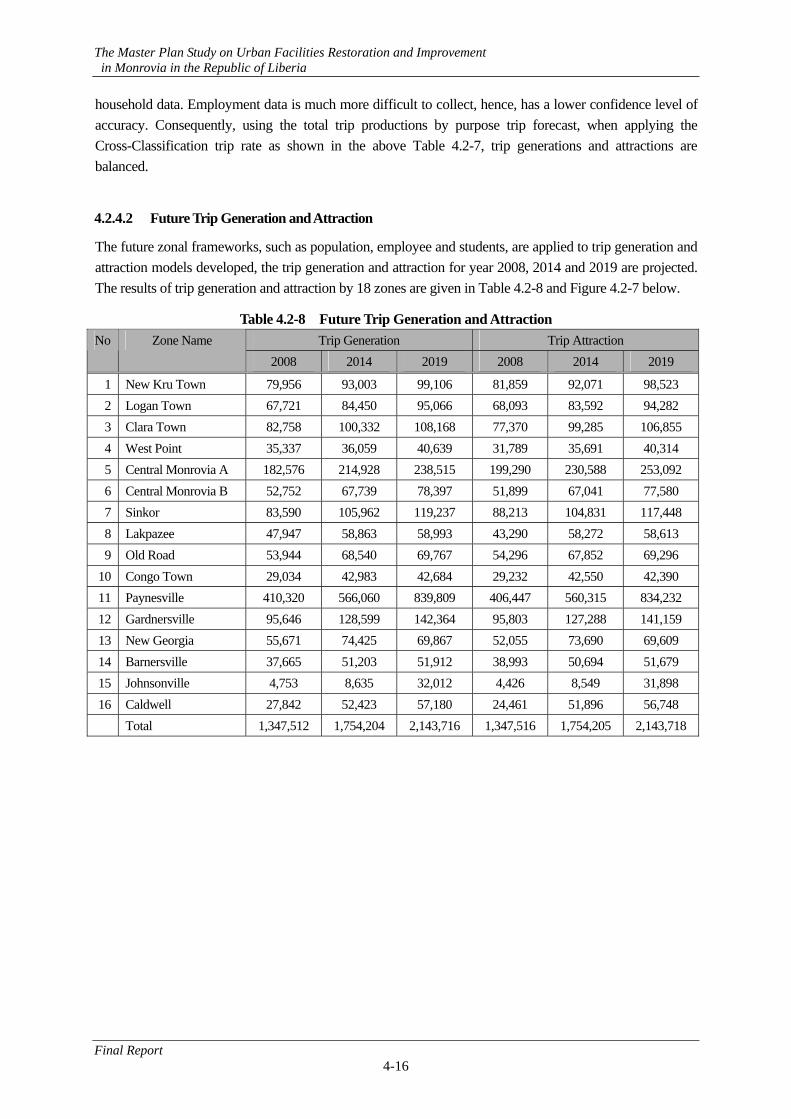
The future zonal frameworks, such as population, employee and students, are applied to trip generation and attraction models developed, the trip generation and attraction for year 2008, 2014 and 2019 are projected. The results of trip generation and attraction by 18 zones are given in Table 4.2-8 and Figure 4.2-7 below.
Table 4.2-8 Future Trip Generation and Attraction Trip Generation Trip Attraction No Zone Name
2008 2014 2019 2008 2014 2019
1 New Kru Town 79,956 93,003 99,106 81,859 92,071 98,523 2 Logan Town 67,721 84,450 95,066 68,093 83,592 94,282 3 Clara Town 82,758 100,332 108,168 77,370 99,285 106,855 4 West Point 35,337 36,059 40,639 31,789 35,691 40,314 5 Central Monrovia A 182,576 214,928 238,515 199,290 230,588 253,092 6 Central Monrovia B 52,752 67,739 78,397 51,899 67,041 77,580 7 Sinkor 83,590 105,962 119,237 88,213 104,831 117,448 8 Lakpazee 47,947 58,863 58,993 43,290 58,272 58,613 9 Old Road 53,944 68,540 69,767 54,296 67,852 69,296
10 Congo Town 29,034 42,983 42,684 29,232 42,550 42,390 11 Paynesville 410,320 566,060 839,809 406,447 560,315 834,232 12 Gardnersville 95,646 128,599 142,364 95,803 127,288 141,159 13 New Georgia 55,671 74,425 69,867 52,055 73,690 69,609 14 Barnersville 37,665 51,203 51,912 38,993 50,694 51,679 15 Johnsonville 4,753 8,635 32,012 4,426 8,549 31,898 16 Caldwell 27,842 52,423 57,180 24,461 51,896 56,748
Total 1,347,512 1,754,204 2,143,716 1,347,516 1,754,205 2,143,718
The Master Plan Study on Urban Facilities Restoration and Improvement in Monrovia in the Republic of Liberia
Final Report 4-17
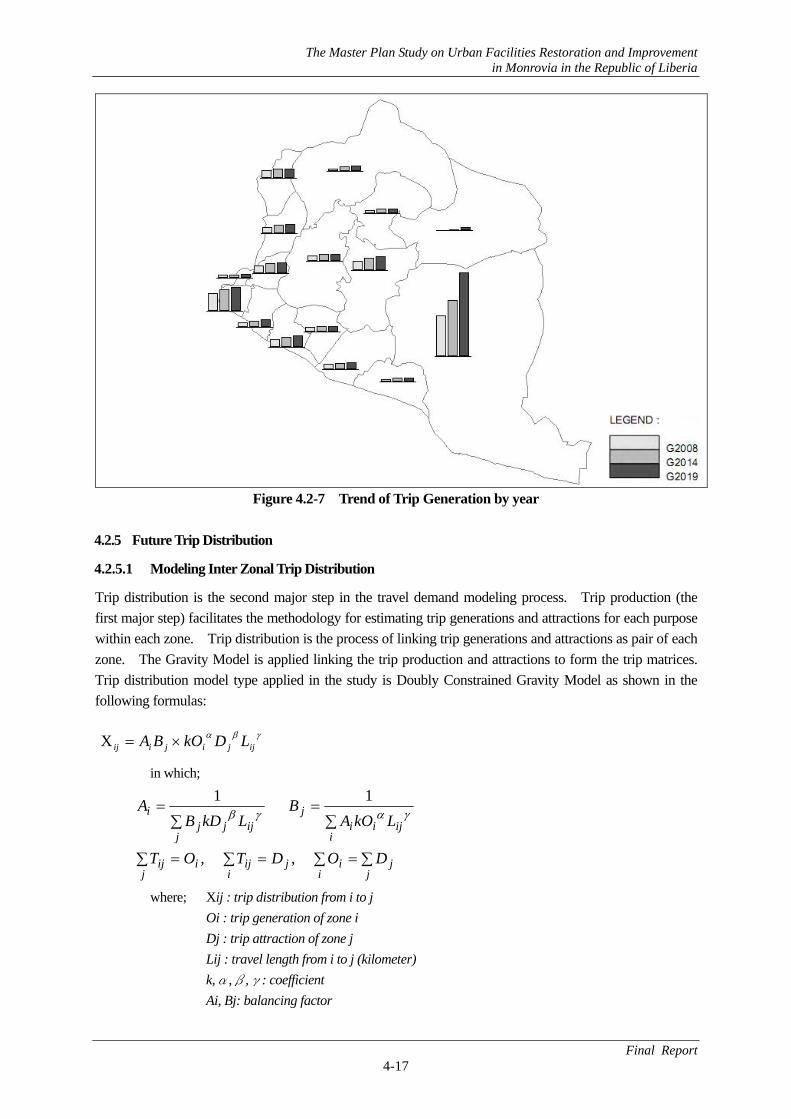
Figure 4.2-7 Trend of Trip Generation by year 4.2.5 Future Trip Distribution
4.2.5.1 Modeling Inter Zonal Trip Distribution
Trip distribution is the second major step in the travel demand modeling process. Trip production (the first major step) facilitates the methodology for estimating trip generations and attractions for each purpose within each zone. Trip distribution is the process of linking trip generations and attractions as pair of each zone. The Gravity Model is applied linking the trip production and attractions to form the trip matrices. Trip distribution model type applied in the study is Doubly Constrained Gravity Model as shown in the following formulas:
γβαijjijiij LDkOBA ×=X
in which;
∑=∑=∑=∑
∑=
∑=
jj
iij
iiji
jij
iijii
j
jijjj
i
DODTOT
LkOAB
LkDBA
, ,
1 1 γαγβ
where; Xij : trip distribution from i to j Oi : trip generation of zone i Dj : trip attraction of zone j Lij : travel length from i to j (kilometer) k,α,β,γ: coefficient Ai, Bj: balancing factor
The Master Plan Study on Urban Facilities Restoration and Improvement in Monrovia in the Republic of Liberia
Final Report 4-18
4.2.5.2 Modeling Intra Zonal Trip Distribution
Intra zonal trip rates of each zone are derived from the person-trip survey. These rates are applied for future demand forecasting, for intra zonal trips, and are assumed to be constant.
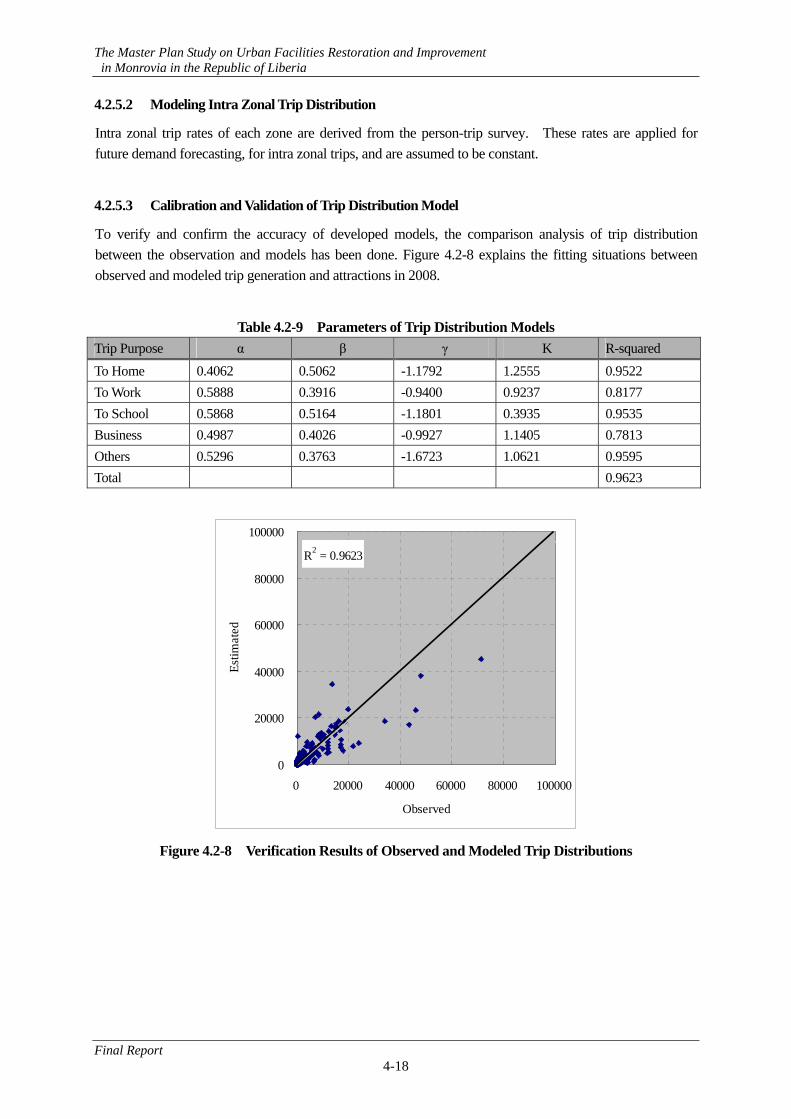
4.2.5.3 Calibration and Validation of Trip Distribution Model
To verify and confirm the accuracy of developed models, the comparison analysis of trip distribution between the observation and models has been done. Figure 4.2-8 explains the fitting situations between observed and modeled trip generation and attractions in 2008.
Table 4.2-9 Parameters of Trip Distribution Models
Trip Purpose α β γ K R-squared To Home 0.4062 0.5062 -1.1792 1.2555 0.9522 To Work 0.5888 0.3916 -0.9400 0.9237 0.8177 To School 0.5868 0.5164 -1.1801 0.3935 0.9535 Business 0.4987 0.4026 -0.9927 1.1405 0.7813 Others 0.5296 0.3763 -1.6723 1.0621 0.9595 Total 0.9623
R2 = 0.9623
0
20000
40000
60000
80000
100000
0 20000 40000 60000 80000 100000
Observed
Estim
ated
Figure 4.2-8 Verification Results of Observed and Modeled Trip Distributions
The Master Plan Study on Urban Facilities Restoration and Improvement in Monrovia in the Republic of Liberia
Final Report 4-19
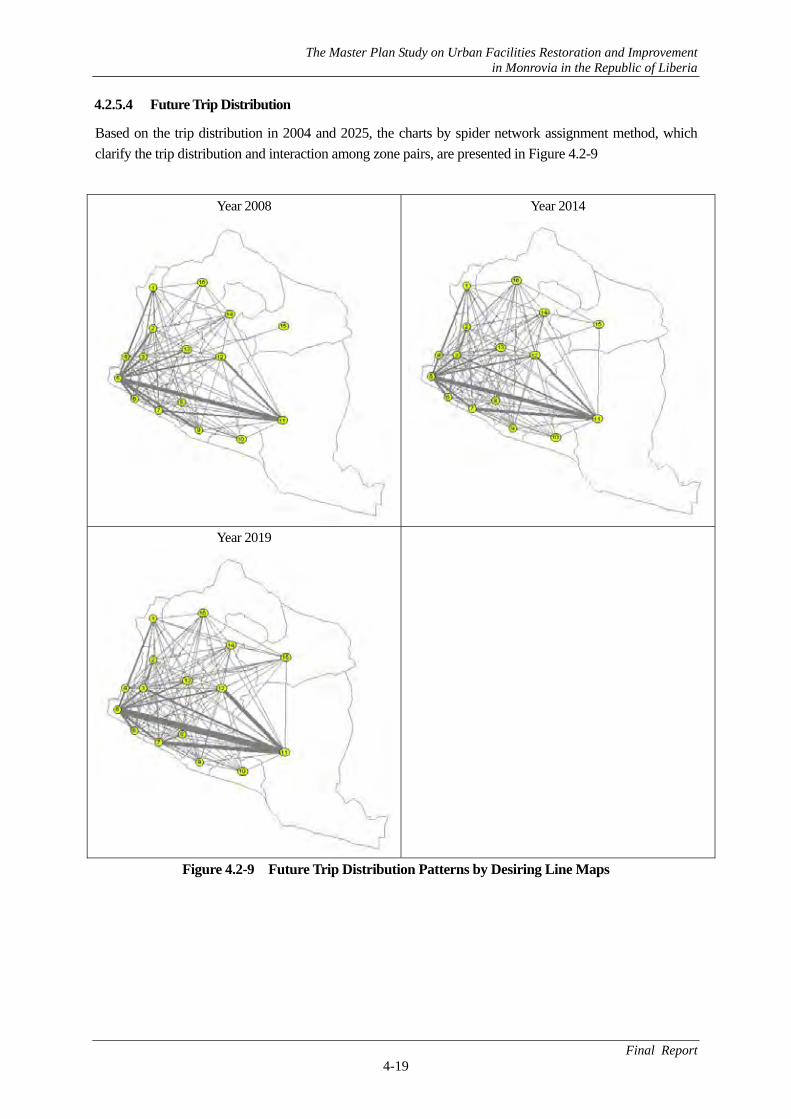
4.2.5.4 Future Trip Distribution
Based on the trip distribution in 2004 and 2025, the charts by spider network assignment method, which clarify the trip distribution and interaction among zone pairs, are presented in Figure 4.2-9
Year 2008 Year 2014
Year 2019
Figure 4.2-9 Future Trip Distribution Patterns by Desiring Line Maps
The Master Plan Study on Urban Facilities Restoration and Improvement in Monrovia in the Republic of Liberia
Final Report 4-20
4.2.6 Future Modal Split
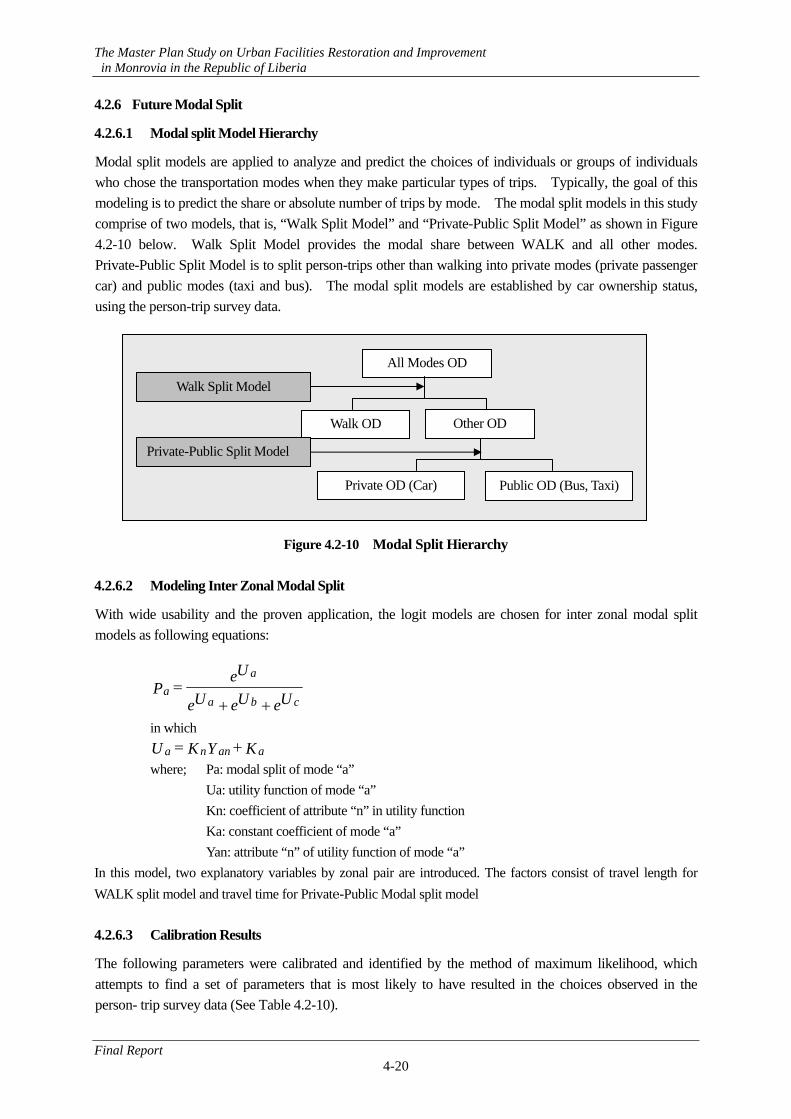
4.2.6.1 Modal split Model Hierarchy
Modal split models are applied to analyze and predict the choices of individuals or groups of individuals who chose the transportation modes when they make particular types of trips. Typically, the goal of this modeling is to predict the share or absolute number of trips by mode. The modal split models in this study comprise of two models, that is, “Walk Split Model” and “Private-Public Split Model” as shown in Figure 4.2-10 below. Walk Split Model provides the modal share between WALK and all other modes. Private-Public Split Model is to split person-trips other than walking into private modes (private passenger car) and public modes (taxi and bus). The modal split models are established by car ownership status, using the person-trip survey data.
Figure 4.2-10 Modal Split Hierarchy 4.2.6.2 Modeling Inter Zonal Modal Split
With wide usability and the proven application, the logit models are chosen for inter zonal modal split models as following equations:
UeUeUe
UeP
cba
aa
++=
in which
KYKU aanna += where; Pa: modal split of mode “a”
Ua: utility function of mode “a” Kn: coefficient of attribute “n” in utility function Ka: constant coefficient of mode “a” Yan: attribute “n” of utility function of mode “a”
In this model, two explanatory variables by zonal pair are introduced. The factors consist of travel length for WALK split model and travel time for Private-Public Modal split model 4.2.6.3 Calibration Results
The following parameters were calibrated and identified by the method of maximum likelihood, which attempts to find a set of parameters that is most likely to have resulted in the choices observed in the person- trip survey data (See Table 4.2-10).
All Modes OD
Walk OD
Private OD (Car) Public OD (Bus, Taxi)
Walk Split Model
Private-Public Split Model
Other OD
The Master Plan Study on Urban Facilities Restoration and Improvement in Monrovia in the Republic of Liberia
Final Report 4-21
Table 4.2-10 Parameters of Modal Split Models
Travel Length (km)
Travel Time (min)
Private Mode
Travel Time (min)
Public Mode R-Squared
WALK Split Model 0.45145 - - 0.99219 Private Public Model Non Car owner - 0.07342 0.00000 0.97942 Private Public Model Car owner - 0.00000 0.00228 0.81676 4.2.6.4 Modeling Intra Zonal Trip Distribution
Intra zonal modal split of each zone are derived from the person-trip survey. These shares are applied for future demand forecasting, for intra zonal modal share and are assumed to be constant in the future.
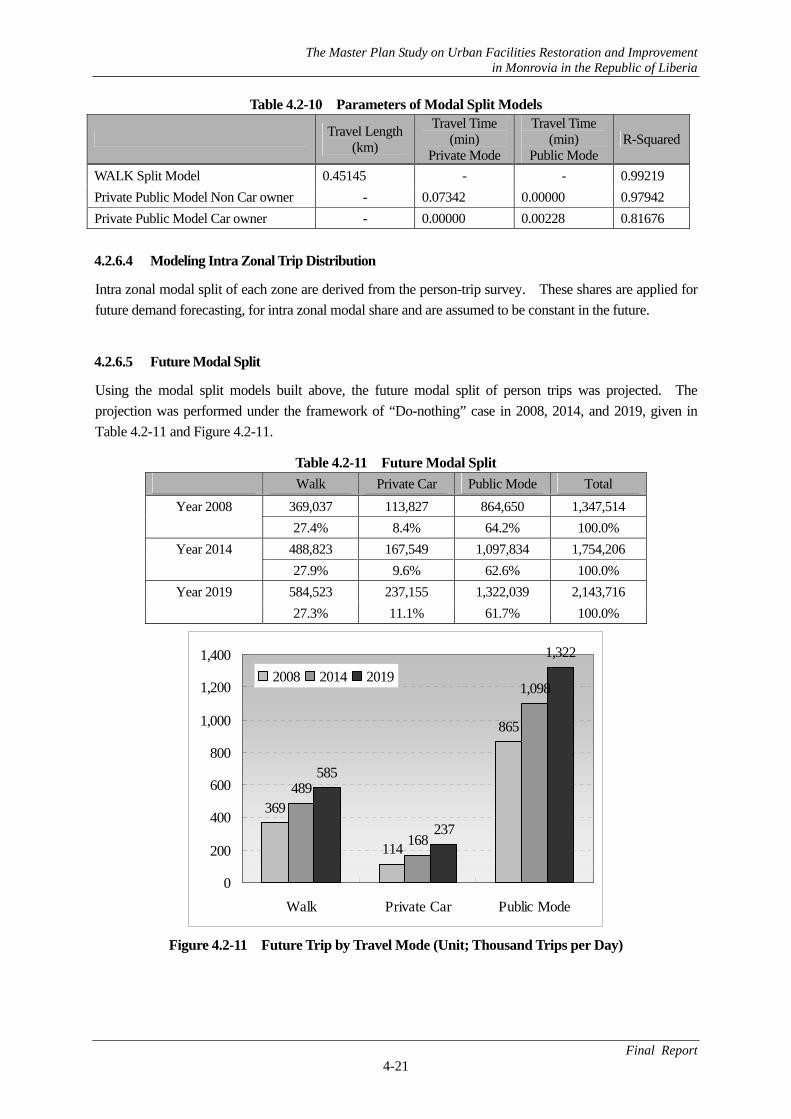
4.2.6.5 Future Modal Split
Using the modal split models built above, the future modal split of person trips was projected. The projection was performed under the framework of “Do-nothing” case in 2008, 2014, and 2019, given in Table 4.2-11 and Figure 4.2-11.
Table 4.2-11 Future Modal Split Walk Private Car Public Mode Total
369,037 113,827 864,650 1,347,514 Year 2008 27.4% 8.4% 64.2% 100.0%
488,823 167,549 1,097,834 1,754,206 Year 2014 27.9% 9.6% 62.6% 100.0%
584,523 237,155 1,322,039 2,143,716 Year 2019 27.3% 11.1% 61.7% 100.0%
369
114
865
489
168
1,098
585
237
1,322
0
200
400
600
800
1,000
1,200
1,400
Walk Private Car Public Mode
2008 2014 2019
Figure 4.2-11 Future Trip by Travel Mode (Unit; Thousand Trips per Day)
The Master Plan Study on Urban Facilities Restoration and Improvement in Monrovia in the Republic of Liberia
Final Report 4-22
4.2.7 Future Traffic Assignment
4.2.7.1 Traffic Assignment Model
Traffic assignment process allocates passenger traffic to individual transportation networks and links. This step takes as an input matrix that indicates the volume of passenger traffic between origin and destination pairs. By applying the traffic assignment stage, daily traffic volume for each road section is projected.
In this study, JICASTRADA assignment module is applied for vehicle-trip assignment models. JICASTRADA prepares three types of assignment modules; those are Incremental, User Equilibrium and Stochastic User Equilibrium Assignment Modules. Equilibrium means that any passenger can not reduce his travel time even if he selects any other routes, and changes to any other routes. In other words, equilibrium is to find the best balanced points between the demand and supply of the transportation reality. In this study, the incremental assignment module which is the most suitable for public mode assignment is selected.
4.2.7.2 External Zone Traffic Demand
Traffic demand related to external zones (outside Greater Monrovia) is classified into external-external, internal-external, external-internal trips. The existing demand obtained from the Cordon Line Survey is added to the Person-Trip Survey data. Future demands related to external zone were forecasted by the growth factor method based on the future private mode trip estimation. The growth rate of 2014 and 2019 against 2008 are 1.47 and 2.08 respectively.
4.2.7.3 Auto Occupancy Rate and Passenger Car Unit
Trips generated by travel mode during the trip generation step (and consequently through the trip distribution and modal split steps) are defined in person-trip base. Auto occupancy rates and passenger car units (PCU) are utilized to convert from person-trips to vehicle-trips prior to assigning the traffic to the roadway network. These factors which are obtained from the Screen Line Survey and the Cordon Line Survey are shown Table 4.2-12.
Table 4.2-12 Occupancy Rate and Passenger Car Unit
Passenger
Car Taxi Mini Bus Large Bus Truck Bike
Person Trip OD
3.33 4.94 13.45 28.57 2.67 1.74 Occupancy Rate
Cordon Line OD
4.72 5.06 13.45 21.63 4.47 1.60
PCU (Passenger Car Unit) 1.00 1.00 1.50 2.50 2.00 0.20 4.2.7.4 Estimation of Future Vehicle Trip by Vehicle Type
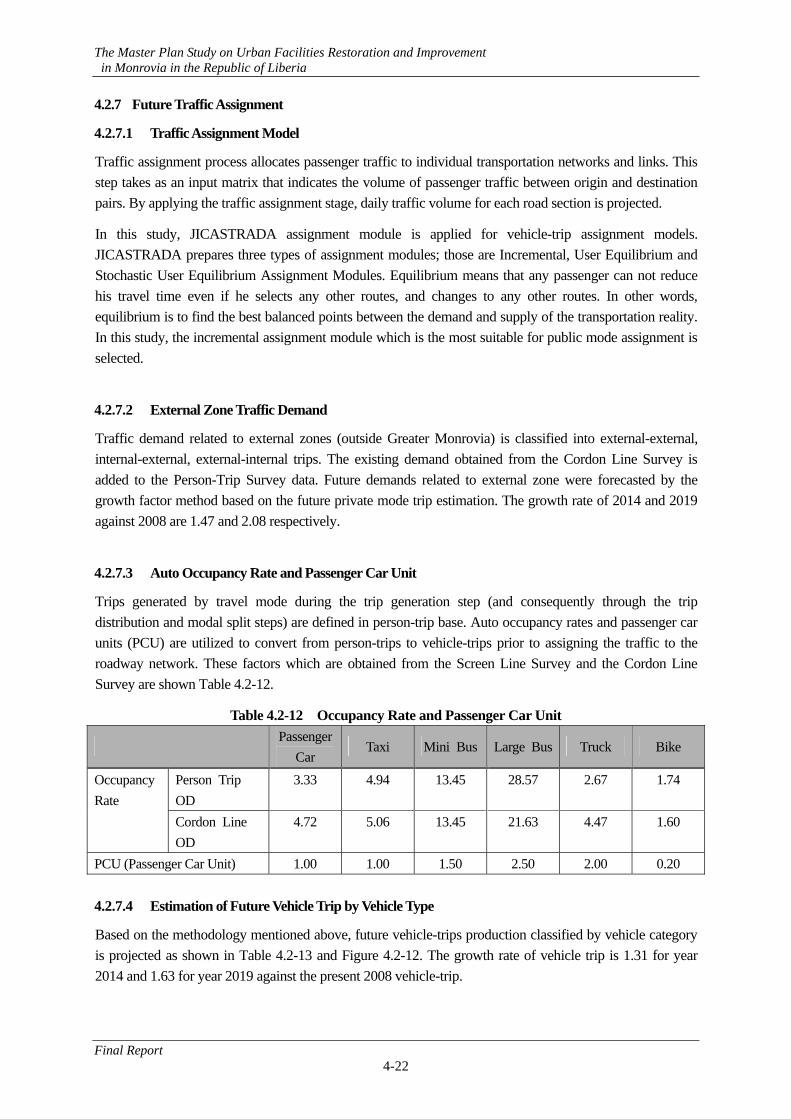
Based on the methodology mentioned above, future vehicle-trips production classified by vehicle category is projected as shown in Table 4.2-13 and Figure 4.2-12. The growth rate of vehicle trip is 1.31 for year 2014 and 1.63 for year 2019 against the present 2008 vehicle-trip.
The Master Plan Study on Urban Facilities Restoration and Improvement in Monrovia in the Republic of Liberia
Final Report 4-23
Table 4.2-13 Future Vehicle-Trips by Vehicle Category Year Pax. Car Taxi Mini Bus Large Bus Truck Bike Total 2008 36,457 157,192 8,609 726 10,536 34,763 248,282 2014 53,662 199,584 10,931 921 15,509 44,138 324,746 2019 75,945 240,349 13,165 1,099 21,950 53,151 405,659
Note; Pax Car = Passenger Car (Sedan or Pick up)
0 100,000 200,000 300,000 400,000 500,000
2008
2014
2019
Pax Taxi MiniBus LargeBus Truck Bike
Figure 4.2-12 Trend of Vehicle-Trips by Vehicle Category 4.2.7.5 Link Cost Function
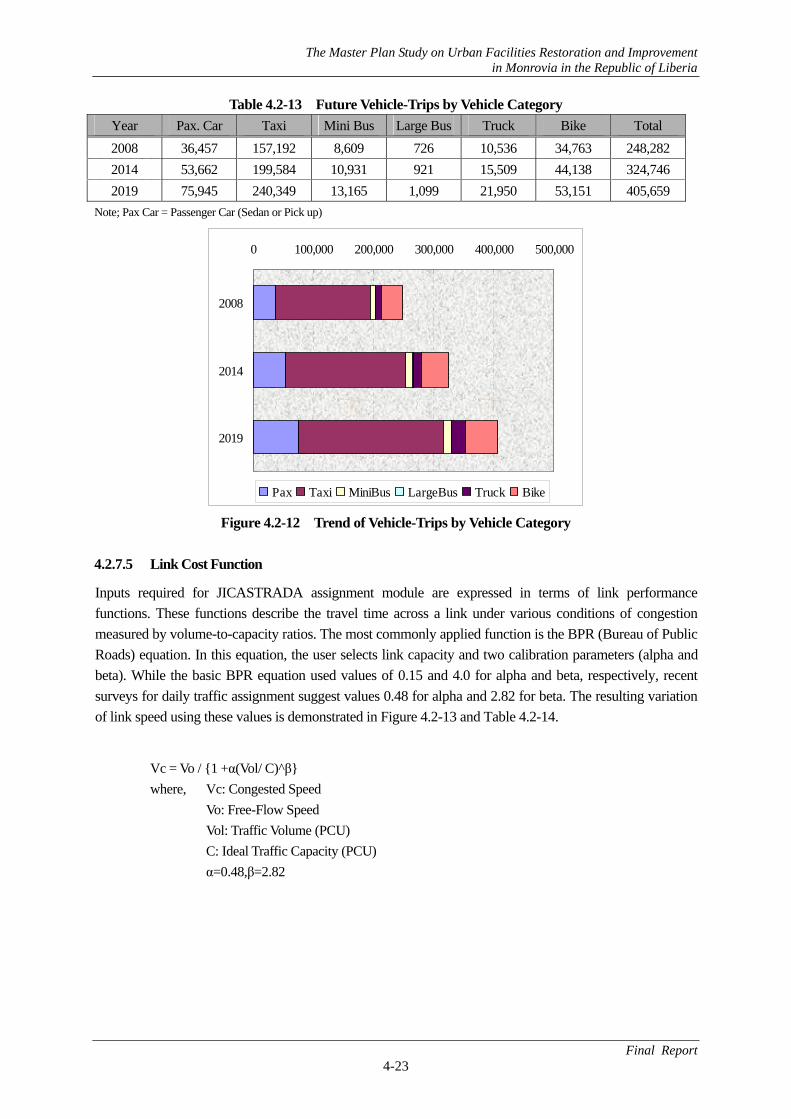
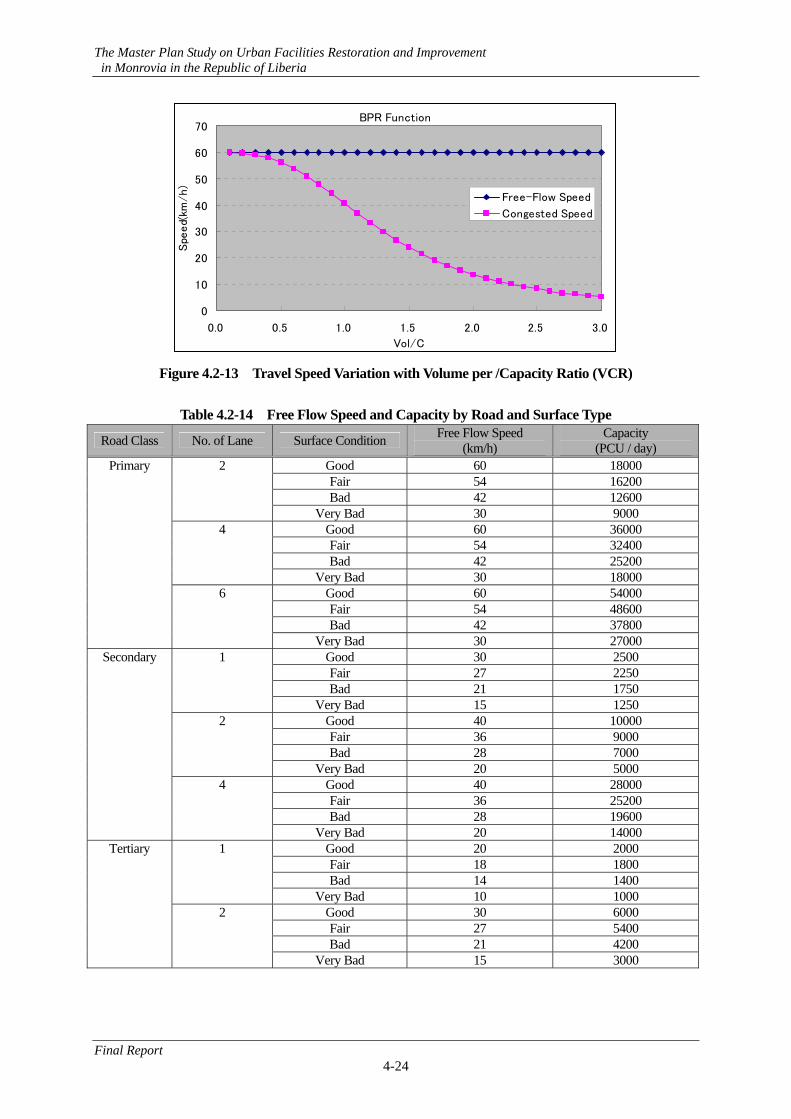
Inputs required for JICASTRADA assignment module are expressed in terms of link performance functions. These functions describe the travel time across a link under various conditions of congestion measured by volume-to-capacity ratios. The most commonly applied function is the BPR (Bureau of Public Roads) equation. In this equation, the user selects link capacity and two calibration parameters (alpha and beta). While the basic BPR equation used values of 0.15 and 4.0 for alpha and beta, respectively, recent surveys for daily traffic assignment suggest values 0.48 for alpha and 2.82 for beta. The resulting variation of link speed using these values is demonstrated in Figure 4.2-13 and Table 4.2-14.
Vc = Vo / {1 +α(Vol/ C)^β} where, Vc: Congested Speed
Vo: Free-Flow Speed Vol: Traffic Volume (PCU) C: Ideal Traffic Capacity (PCU) α=0.48,β=2.82
The Master Plan Study on Urban Facilities Restoration and Improvement in Monrovia in the Republic of Liberia
Final Report 4-24
BPR Function
0
10
20
30
40
50
60
70
0.0 0.5 1.0 1.5 2.0 2.5 3.0
Vol/C
Spe
ed(
km/h)
Free-Flow Speed
Congested Speed
Figure 4.2-13 Travel Speed Variation with Volume per /Capacity Ratio (VCR)
Table 4.2-14 Free Flow Speed and Capacity by Road and Surface Type
Road Class No. of Lane Surface Condition Free Flow Speed (km/h)
Capacity (PCU / day)
Good 60 18000 Fair 54 16200 Bad 42 12600
2
Very Bad 30 9000 Good 60 36000 Fair 54 32400 Bad 42 25200
4
Very Bad 30 18000 Good 60 54000 Fair 54 48600 Bad 42 37800
Primary
6
Very Bad 30 27000 Good 30 2500 Fair 27 2250 Bad 21 1750
1
Very Bad 15 1250 Good 40 10000 Fair 36 9000 Bad 28 7000
2
Very Bad 20 5000 Good 40 28000 Fair 36 25200 Bad 28 19600
Secondary
4
Very Bad 20 14000 Good 20 2000 Fair 18 1800 Bad 14 1400
1
Very Bad 10 1000 Good 30 6000 Fair 27 5400 Bad 21 4200
Tertiary
2
Very Bad 15 3000
The Master Plan Study on Urban Facilities Restoration and Improvement in Monrovia in the Republic of Liberia
Final Report 4-25
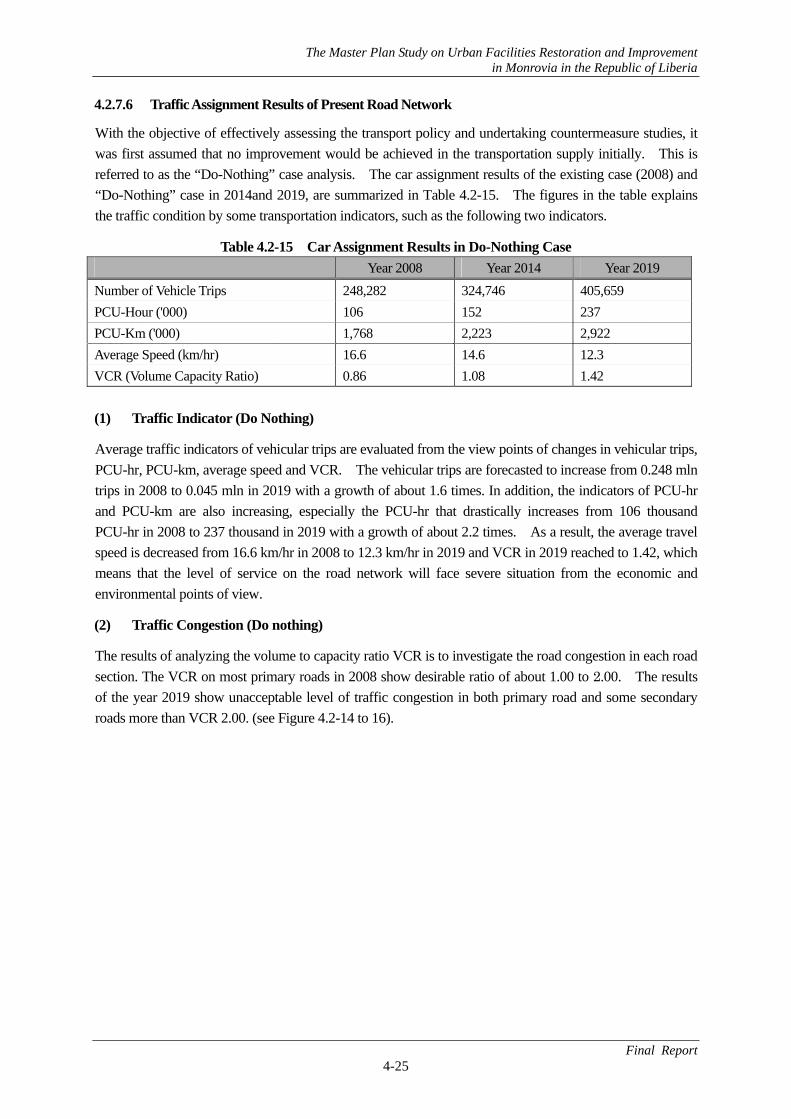
4.2.7.6 Traffic Assignment Results of Present Road Network
With the objective of effectively assessing the transport policy and undertaking countermeasure studies, it was first assumed that no improvement would be achieved in the transportation supply initially. This is referred to as the “Do-Nothing” case analysis. The car assignment results of the existing case (2008) and “Do-Nothing” case in 2014and 2019, are summarized in Table 4.2-15. The figures in the table explains the traffic condition by some transportation indicators, such as the following two indicators.
Table 4.2-15 Car Assignment Results in Do-Nothing Case Year 2008 Year 2014 Year 2019
Number of Vehicle Trips 248,282 324,746 405,659 PCU-Hour ('000) 106 152 237 PCU-Km ('000) 1,768 2,223 2,922 Average Speed (km/hr) 16.6 14.6 12.3 VCR (Volume Capacity Ratio) 0.86 1.08 1.42 (1) Traffic Indicator (Do Nothing)
Average traffic indicators of vehicular trips are evaluated from the view points of changes in vehicular trips, PCU-hr, PCU-km, average speed and VCR. The vehicular trips are forecasted to increase from 0.248 mln trips in 2008 to 0.045 mln in 2019 with a growth of about 1.6 times. In addition, the indicators of PCU-hr and PCU-km are also increasing, especially the PCU-hr that drastically increases from 106 thousand PCU-hr in 2008 to 237 thousand in 2019 with a growth of about 2.2 times. As a result, the average travel speed is decreased from 16.6 km/hr in 2008 to 12.3 km/hr in 2019 and VCR in 2019 reached to 1.42, which means that the level of service on the road network will face severe situation from the economic and environmental points of view.
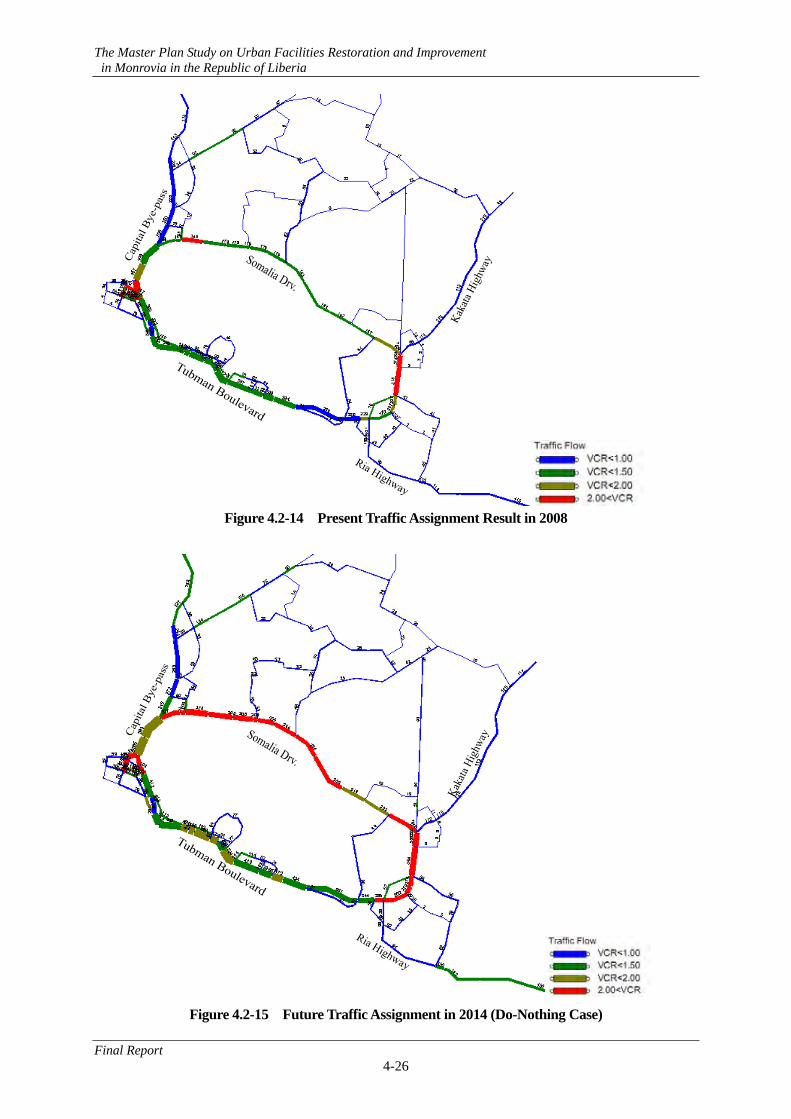
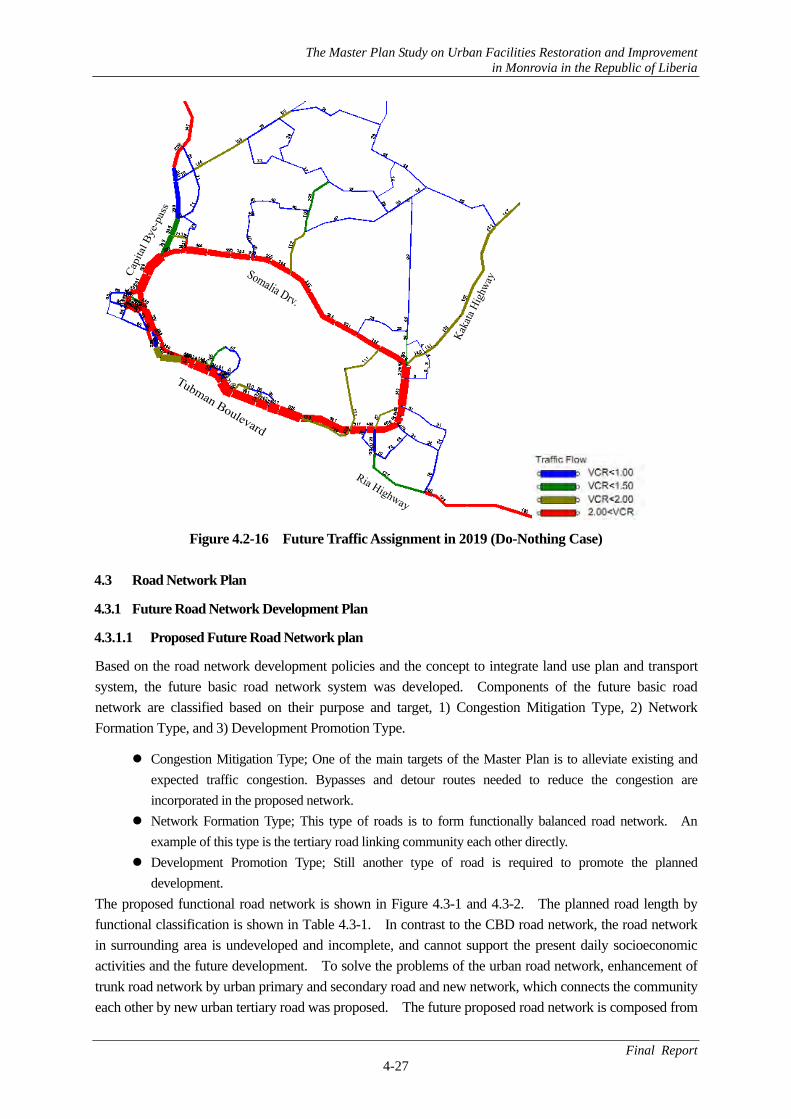
(2) Traffic Congestion (Do nothing)
The results of analyzing the volume to capacity ratio VCR is to investigate the road congestion in each road section. The VCR on most primary roads in 2008 show desirable ratio of about 1.00 to 2.00. The results of the year 2019 show unacceptable level of traffic congestion in both primary road and some secondary roads more than VCR 2.00. (see Figure 4.2-14 to 16).
The Master Plan Study on Urban Facilities Restoration and Improvement in Monrovia in the Republic of Liberia
Final Report 4-26
Figure 4.2-14 Present Traffic Assignment Result in 2008
Figure 4.2-15 Future Traffic Assignment in 2014 (Do-Nothing Case)
The Master Plan Study on Urban Facilities Restoration and Improvement in Monrovia in the Republic of Liberia
Final Report 4-27
Figure 4.2-16 Future Traffic Assignment in 2019 (Do-Nothing Case) 4.3 Road Network Plan
4.3.1 Future Road Network Development Plan
4.3.1.1 Proposed Future Road Network plan
Based on the road network development policies and the concept to integrate land use plan and transport system, the future basic road network system was developed. Components of the future basic road network are classified based on their purpose and target, 1) Congestion Mitigation Type, 2) Network Formation Type, and 3) Development Promotion Type.
Congestion Mitigation Type; One of the main targets of the Master Plan is to alleviate existing and expected traffic congestion. Bypasses and detour routes needed to reduce the congestion are incorporated in the proposed network.
Network Formation Type; This type of roads is to form functionally balanced road network. An example of this type is the tertiary road linking community each other directly.
Development Promotion Type; Still another type of road is required to promote the planned development.
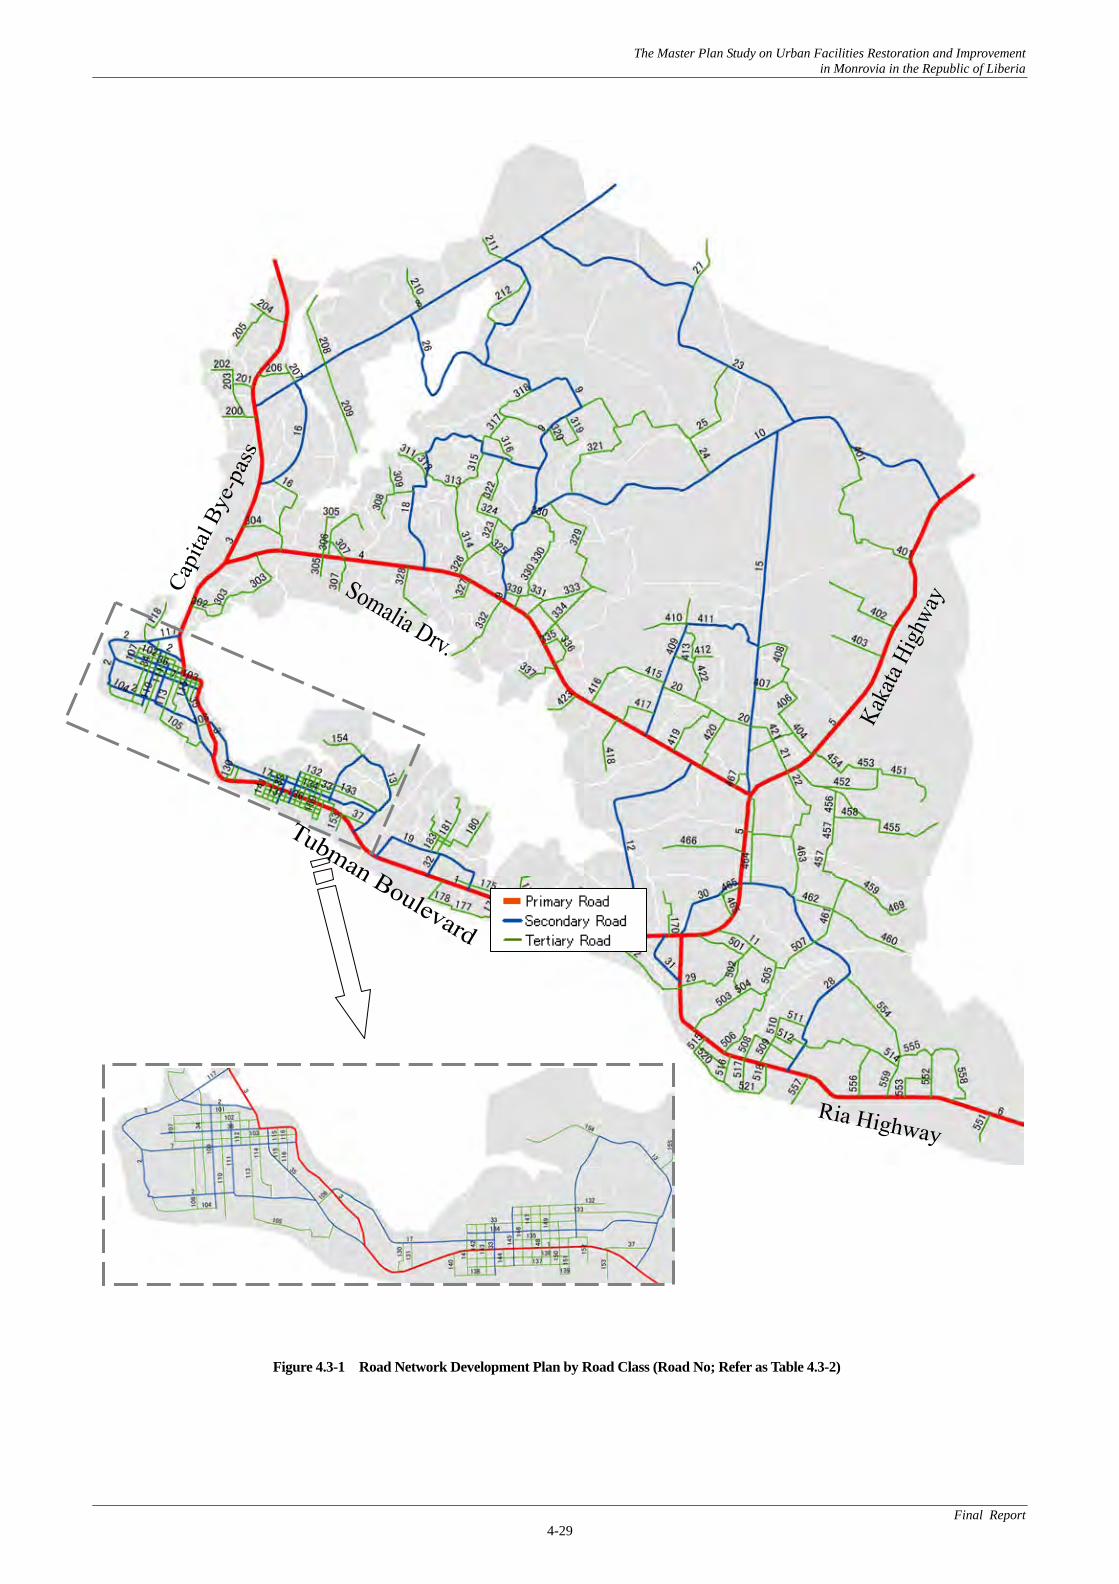
The proposed functional road network is shown in Figure 4.3-1 and 4.3-2. The planned road length by functional classification is shown in Table 4.3-1. In contrast to the CBD road network, the road network in surrounding area is undeveloped and incomplete, and cannot support the present daily socioeconomic activities and the future development. To solve the problems of the urban road network, enhancement of trunk road network by urban primary and secondary road and new network, which connects the community each other by new urban tertiary road was proposed. The future proposed road network is composed from
The Master Plan Study on Urban Facilities Restoration and Improvement in Monrovia in the Republic of Liberia
Final Report 4-28
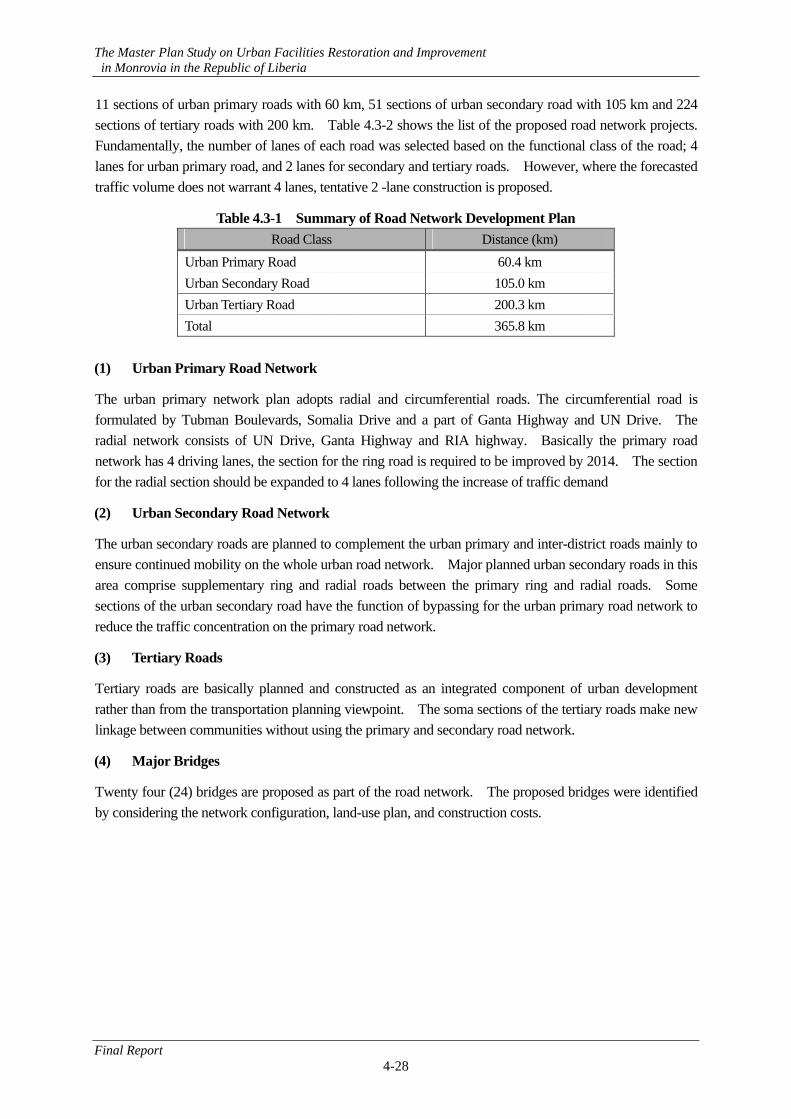
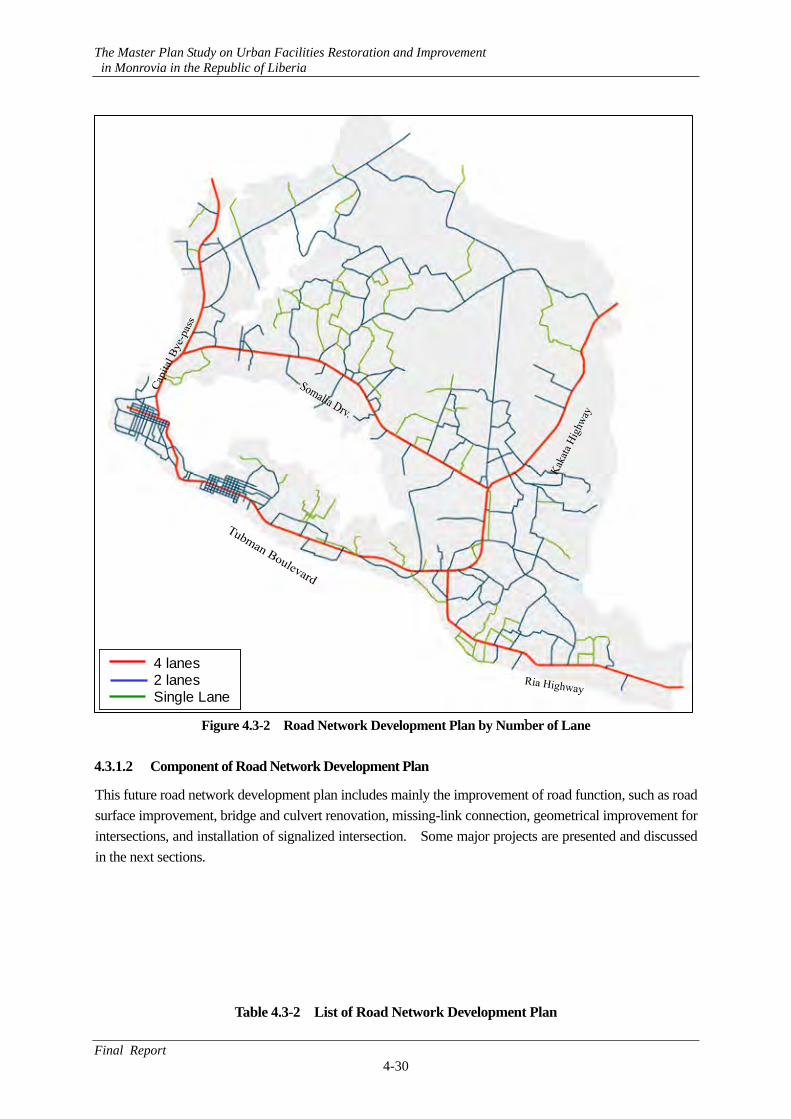
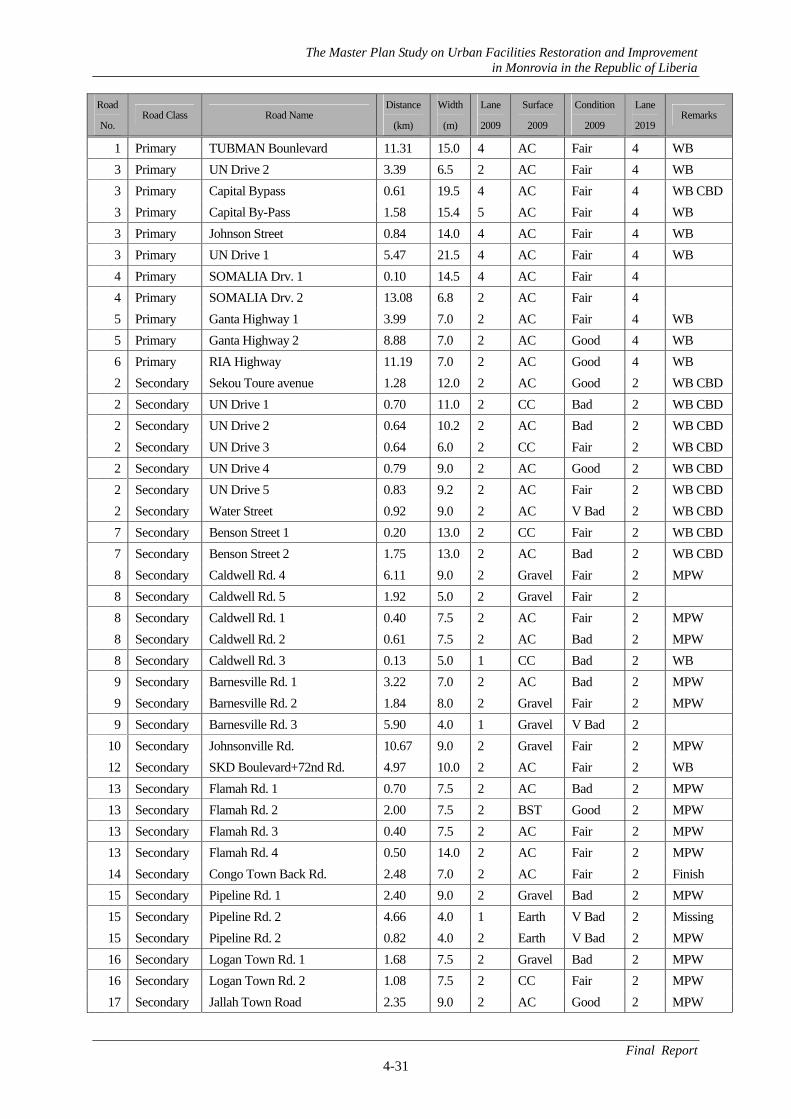
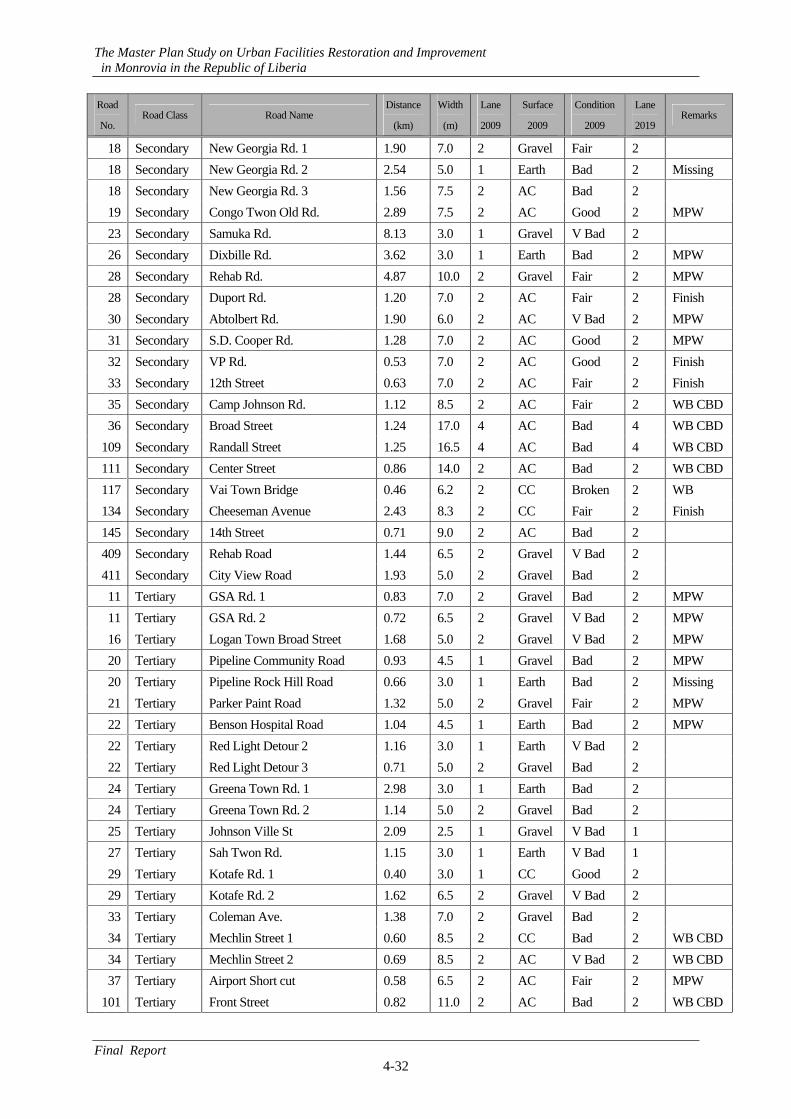
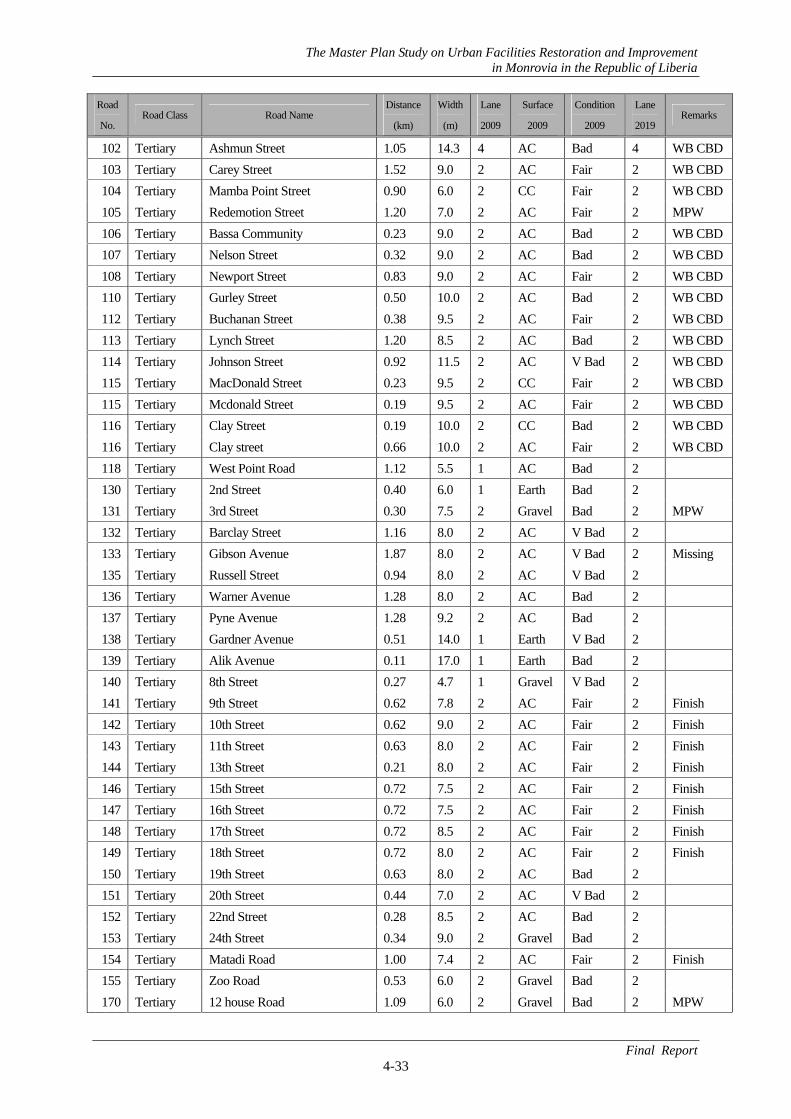
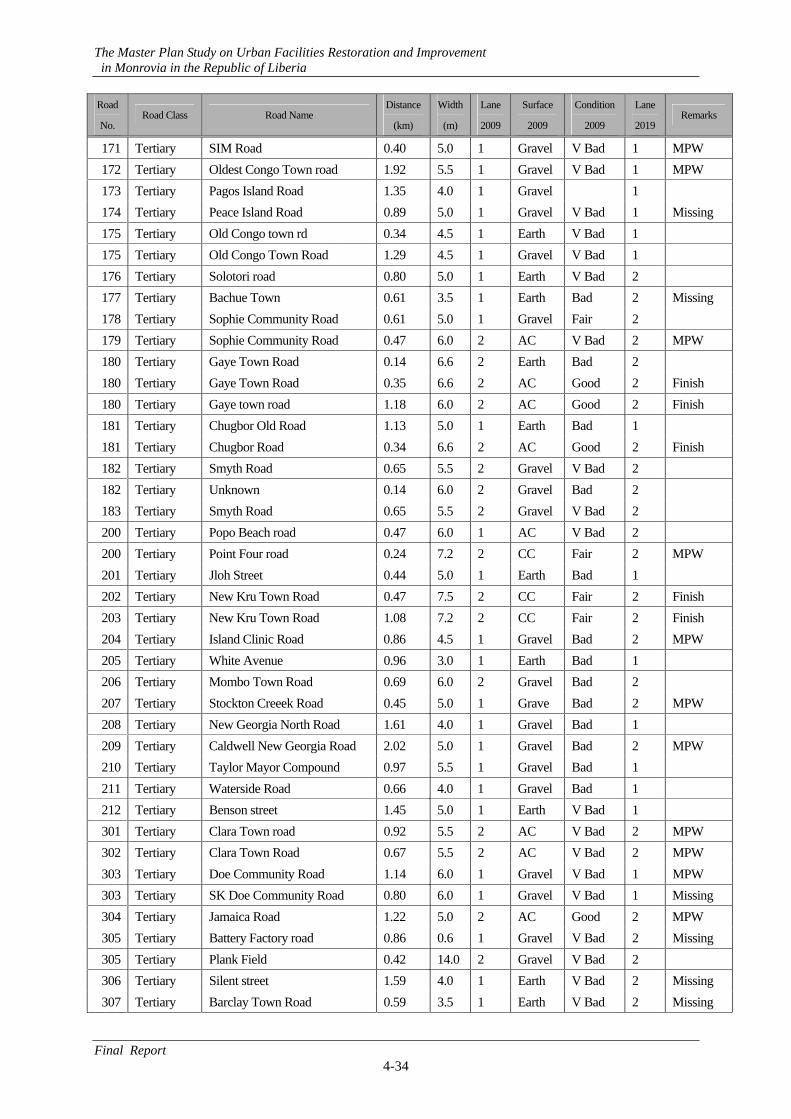
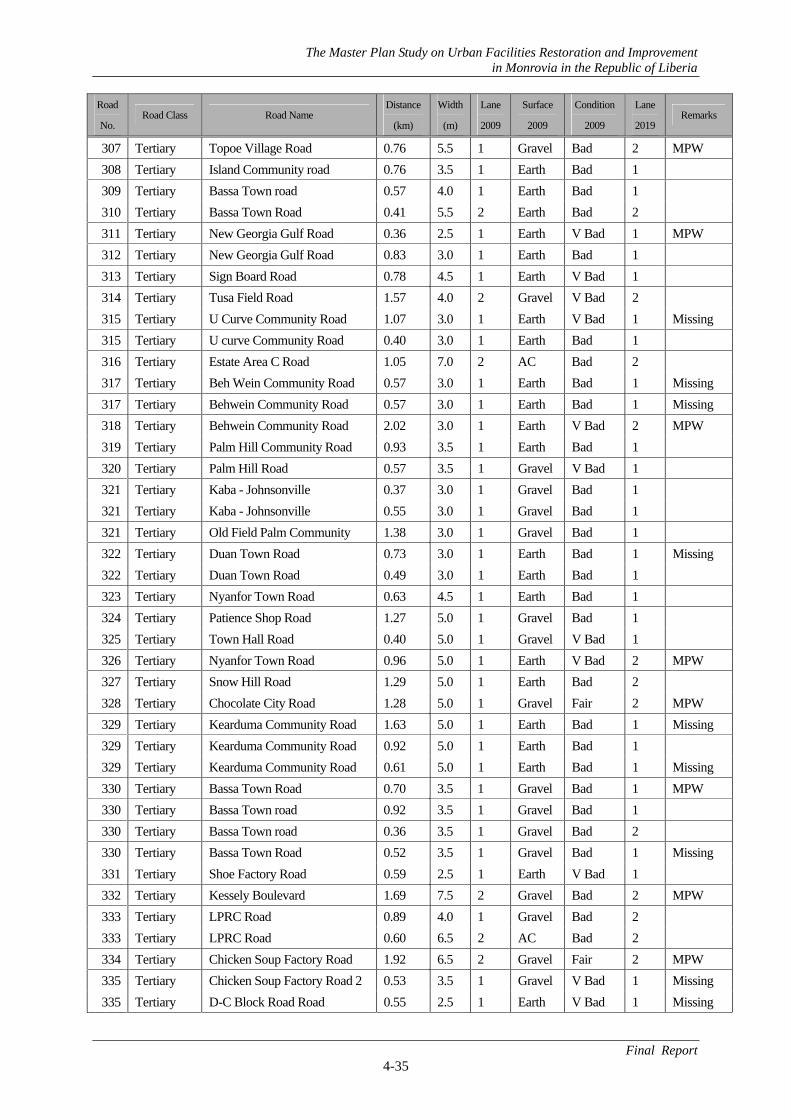
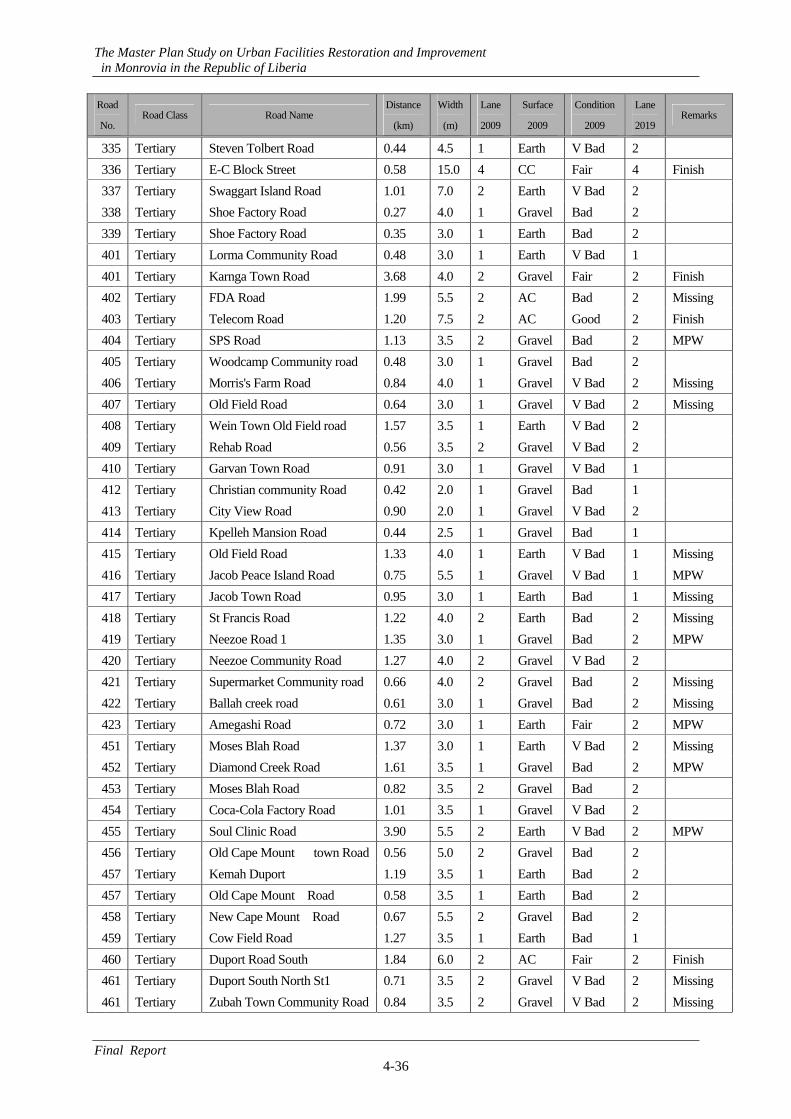
11 sections of urban primary roads with 60 km, 51 sections of urban secondary road with 105 km and 224 sections of tertiary roads with 200 km. Table 4.3-2 shows the list of the proposed road network projects. Fundamentally, the number of lanes of each road was selected based on the functional class of the road; 4 lanes for urban primary road, and 2 lanes for secondary and tertiary roads. However, where the forecasted traffic volume does not warrant 4 lanes, tentative 2 -lane construction is proposed.
Table 4.3-1 Summary of Road Network Development Plan Road Class Distance (km)
Urban Primary Road 60.4 km Urban Secondary Road 105.0 km Urban Tertiary Road 200.3 km Total 365.8 km
(1) Urban Primary Road Network
The urban primary network plan adopts radial and circumferential roads. The circumferential road is formulated by Tubman Boulevards, Somalia Drive and a part of Ganta Highway and UN Drive. The radial network consists of UN Drive, Ganta Highway and RIA highway. Basically the primary road network has 4 driving lanes, the section for the ring road is required to be improved by 2014. The section for the radial section should be expanded to 4 lanes following the increase of traffic demand
(2) Urban Secondary Road Network
The urban secondary roads are planned to complement the urban primary and inter-district roads mainly to ensure continued mobility on the whole urban road network. Major planned urban secondary roads in this area comprise supplementary ring and radial roads between the primary ring and radial roads. Some sections of the urban secondary road have the function of bypassing for the urban primary road network to reduce the traffic concentration on the primary road network.
(3) Tertiary Roads
Tertiary roads are basically planned and constructed as an integrated component of urban development rather than from the transportation planning viewpoint. The soma sections of the tertiary roads make new linkage between communities without using the primary and secondary road network.
(4) Major Bridges
Twenty four (24) bridges are proposed as part of the road network. The proposed bridges were identified by considering the network configuration, land-use plan, and construction costs.
The Master Plan Study on Urban Facilities Restoration and Improvement in Monrovia in the Republic of Liberia
Final Report 4-29
Figure 4.3-1 Road Network Development Plan by Road Class (Road No; Refer as Table 4.3-2)
The Master Plan Study on Urban Facilities Restoration and Improvement in Monrovia in the Republic of Liberia
Final Report 4-30
Figure 4.3-2 Road Network Development Plan by Number of Lane
4.3.1.2 Component of Road Network Development Plan
This future road network development plan includes mainly the improvement of road function, such as road surface improvement, bridge and culvert renovation, missing-link connection, geometrical improvement for intersections, and installation of signalized intersection. Some major projects are presented and discussed in the next sections.
Table 4.3-2 List of Road Network Development Plan
4 lanes2 lanesSingle Lane
4 lanes2 lanesSingle Lane
The Master Plan Study on Urban Facilities Restoration and Improvement in Monrovia in the Republic of Liberia
Final Report 4-31
Road
No. Road Class Road Name
Distance
(km)
Width
(m)
Lane
2009
Surface
2009
Condition
2009
Lane
2019 Remarks
1 Primary TUBMAN Bounlevard 11.31 15.0 4 AC Fair 4 WB 3 Primary UN Drive 2 3.39 6.5 2 AC Fair 4 WB 3 Primary Capital Bypass 0.61 19.5 4 AC Fair 4 WB CBD3 Primary Capital By-Pass 1.58 15.4 5 AC Fair 4 WB 3 Primary Johnson Street 0.84 14.0 4 AC Fair 4 WB 3 Primary UN Drive 1 5.47 21.5 4 AC Fair 4 WB 4 Primary SOMALIA Drv. 1 0.10 14.5 4 AC Fair 4 4 Primary SOMALIA Drv. 2 13.08 6.8 2 AC Fair 4 5 Primary Ganta Highway 1 3.99 7.0 2 AC Fair 4 WB 5 Primary Ganta Highway 2 8.88 7.0 2 AC Good 4 WB 6 Primary RIA Highway 11.19 7.0 2 AC Good 4 WB 2 Secondary Sekou Toure avenue 1.28 12.0 2 AC Good 2 WB CBD2 Secondary UN Drive 1 0.70 11.0 2 CC Bad 2 WB CBD2 Secondary UN Drive 2 0.64 10.2 2 AC Bad 2 WB CBD2 Secondary UN Drive 3 0.64 6.0 2 CC Fair 2 WB CBD2 Secondary UN Drive 4 0.79 9.0 2 AC Good 2 WB CBD2 Secondary UN Drive 5 0.83 9.2 2 AC Fair 2 WB CBD2 Secondary Water Street 0.92 9.0 2 AC V Bad 2 WB CBD7 Secondary Benson Street 1 0.20 13.0 2 CC Fair 2 WB CBD7 Secondary Benson Street 2 1.75 13.0 2 AC Bad 2 WB CBD8 Secondary Caldwell Rd. 4 6.11 9.0 2 Gravel Fair 2 MPW 8 Secondary Caldwell Rd. 5 1.92 5.0 2 Gravel Fair 2 8 Secondary Caldwell Rd. 1 0.40 7.5 2 AC Fair 2 MPW 8 Secondary Caldwell Rd. 2 0.61 7.5 2 AC Bad 2 MPW 8 Secondary Caldwell Rd. 3 0.13 5.0 1 CC Bad 2 WB 9 Secondary Barnesville Rd. 1 3.22 7.0 2 AC Bad 2 MPW 9 Secondary Barnesville Rd. 2 1.84 8.0 2 Gravel Fair 2 MPW 9 Secondary Barnesville Rd. 3 5.90 4.0 1 Gravel V Bad 2
10 Secondary Johnsonville Rd. 10.67 9.0 2 Gravel Fair 2 MPW 12 Secondary SKD Boulevard+72nd Rd. 4.97 10.0 2 AC Fair 2 WB 13 Secondary Flamah Rd. 1 0.70 7.5 2 AC Bad 2 MPW 13 Secondary Flamah Rd. 2 2.00 7.5 2 BST Good 2 MPW 13 Secondary Flamah Rd. 3 0.40 7.5 2 AC Fair 2 MPW 13 Secondary Flamah Rd. 4 0.50 14.0 2 AC Fair 2 MPW 14 Secondary Congo Town Back Rd. 2.48 7.0 2 AC Fair 2 Finish 15 Secondary Pipeline Rd. 1 2.40 9.0 2 Gravel Bad 2 MPW 15 Secondary Pipeline Rd. 2 4.66 4.0 1 Earth V Bad 2 Missing 15 Secondary Pipeline Rd. 2 0.82 4.0 2 Earth V Bad 2 MPW 16 Secondary Logan Town Rd. 1 1.68 7.5 2 Gravel Bad 2 MPW 16 Secondary Logan Town Rd. 2 1.08 7.5 2 CC Fair 2 MPW 17 Secondary Jallah Town Road 2.35 9.0 2 AC Good 2 MPW
The Master Plan Study on Urban Facilities Restoration and Improvement in Monrovia in the Republic of Liberia
Final Report 4-32
Road
No. Road Class Road Name
Distance
(km)
Width
(m)
Lane
2009
Surface
2009
Condition
2009
Lane
2019 Remarks
18 Secondary New Georgia Rd. 1 1.90 7.0 2 Gravel Fair 2 18 Secondary New Georgia Rd. 2 2.54 5.0 1 Earth Bad 2 Missing 18 Secondary New Georgia Rd. 3 1.56 7.5 2 AC Bad 2 19 Secondary Congo Twon Old Rd. 2.89 7.5 2 AC Good 2 MPW 23 Secondary Samuka Rd. 8.13 3.0 1 Gravel V Bad 2 26 Secondary Dixbille Rd. 3.62 3.0 1 Earth Bad 2 MPW 28 Secondary Rehab Rd. 4.87 10.0 2 Gravel Fair 2 MPW 28 Secondary Duport Rd. 1.20 7.0 2 AC Fair 2 Finish 30 Secondary Abtolbert Rd. 1.90 6.0 2 AC V Bad 2 MPW 31 Secondary S.D. Cooper Rd. 1.28 7.0 2 AC Good 2 MPW 32 Secondary VP Rd. 0.53 7.0 2 AC Good 2 Finish 33 Secondary 12th Street 0.63 7.0 2 AC Fair 2 Finish 35 Secondary Camp Johnson Rd. 1.12 8.5 2 AC Fair 2 WB CBD36 Secondary Broad Street 1.24 17.0 4 AC Bad 4 WB CBD
109 Secondary Randall Street 1.25 16.5 4 AC Bad 4 WB CBD111 Secondary Center Street 0.86 14.0 2 AC Bad 2 WB CBD117 Secondary Vai Town Bridge 0.46 6.2 2 CC Broken 2 WB 134 Secondary Cheeseman Avenue 2.43 8.3 2 CC Fair 2 Finish 145 Secondary 14th Street 0.71 9.0 2 AC Bad 2 409 Secondary Rehab Road 1.44 6.5 2 Gravel V Bad 2 411 Secondary City View Road 1.93 5.0 2 Gravel Bad 2 11 Tertiary GSA Rd. 1 0.83 7.0 2 Gravel Bad 2 MPW 11 Tertiary GSA Rd. 2 0.72 6.5 2 Gravel V Bad 2 MPW 16 Tertiary Logan Town Broad Street 1.68 5.0 2 Gravel V Bad 2 MPW 20 Tertiary Pipeline Community Road 0.93 4.5 1 Gravel Bad 2 MPW 20 Tertiary Pipeline Rock Hill Road 0.66 3.0 1 Earth Bad 2 Missing 21 Tertiary Parker Paint Road 1.32 5.0 2 Gravel Fair 2 MPW 22 Tertiary Benson Hospital Road 1.04 4.5 1 Earth Bad 2 MPW 22 Tertiary Red Light Detour 2 1.16 3.0 1 Earth V Bad 2 22 Tertiary Red Light Detour 3 0.71 5.0 2 Gravel Bad 2 24 Tertiary Greena Town Rd. 1 2.98 3.0 1 Earth Bad 2 24 Tertiary Greena Town Rd. 2 1.14 5.0 2 Gravel Bad 2 25 Tertiary Johnson Ville St 2.09 2.5 1 Gravel V Bad 1 27 Tertiary Sah Twon Rd. 1.15 3.0 1 Earth V Bad 1 29 Tertiary Kotafe Rd. 1 0.40 3.0 1 CC Good 2 29 Tertiary Kotafe Rd. 2 1.62 6.5 2 Gravel V Bad 2 33 Tertiary Coleman Ave. 1.38 7.0 2 Gravel Bad 2 34 Tertiary Mechlin Street 1 0.60 8.5 2 CC Bad 2 WB CBD34 Tertiary Mechlin Street 2 0.69 8.5 2 AC V Bad 2 WB CBD37 Tertiary Airport Short cut 0.58 6.5 2 AC Fair 2 MPW
101 Tertiary Front Street 0.82 11.0 2 AC Bad 2 WB CBD
The Master Plan Study on Urban Facilities Restoration and Improvement in Monrovia in the Republic of Liberia
Final Report 4-33
Road
No. Road Class Road Name
Distance
(km)
Width
(m)
Lane
2009
Surface
2009
Condition
2009
Lane
2019 Remarks
102 Tertiary Ashmun Street 1.05 14.3 4 AC Bad 4 WB CBD103 Tertiary Carey Street 1.52 9.0 2 AC Fair 2 WB CBD104 Tertiary Mamba Point Street 0.90 6.0 2 CC Fair 2 WB CBD105 Tertiary Redemotion Street 1.20 7.0 2 AC Fair 2 MPW 106 Tertiary Bassa Community 0.23 9.0 2 AC Bad 2 WB CBD107 Tertiary Nelson Street 0.32 9.0 2 AC Bad 2 WB CBD108 Tertiary Newport Street 0.83 9.0 2 AC Fair 2 WB CBD110 Tertiary Gurley Street 0.50 10.0 2 AC Bad 2 WB CBD112 Tertiary Buchanan Street 0.38 9.5 2 AC Fair 2 WB CBD113 Tertiary Lynch Street 1.20 8.5 2 AC Bad 2 WB CBD114 Tertiary Johnson Street 0.92 11.5 2 AC V Bad 2 WB CBD115 Tertiary MacDonald Street 0.23 9.5 2 CC Fair 2 WB CBD115 Tertiary Mcdonald Street 0.19 9.5 2 AC Fair 2 WB CBD116 Tertiary Clay Street 0.19 10.0 2 CC Bad 2 WB CBD116 Tertiary Clay street 0.66 10.0 2 AC Fair 2 WB CBD118 Tertiary West Point Road 1.12 5.5 1 AC Bad 2 130 Tertiary 2nd Street 0.40 6.0 1 Earth Bad 2 131 Tertiary 3rd Street 0.30 7.5 2 Gravel Bad 2 MPW 132 Tertiary Barclay Street 1.16 8.0 2 AC V Bad 2 133 Tertiary Gibson Avenue 1.87 8.0 2 AC V Bad 2 Missing 135 Tertiary Russell Street 0.94 8.0 2 AC V Bad 2 136 Tertiary Warner Avenue 1.28 8.0 2 AC Bad 2 137 Tertiary Pyne Avenue 1.28 9.2 2 AC Bad 2 138 Tertiary Gardner Avenue 0.51 14.0 1 Earth V Bad 2 139 Tertiary Alik Avenue 0.11 17.0 1 Earth Bad 2 140 Tertiary 8th Street 0.27 4.7 1 Gravel V Bad 2 141 Tertiary 9th Street 0.62 7.8 2 AC Fair 2 Finish 142 Tertiary 10th Street 0.62 9.0 2 AC Fair 2 Finish 143 Tertiary 11th Street 0.63 8.0 2 AC Fair 2 Finish 144 Tertiary 13th Street 0.21 8.0 2 AC Fair 2 Finish 146 Tertiary 15th Street 0.72 7.5 2 AC Fair 2 Finish 147 Tertiary 16th Street 0.72 7.5 2 AC Fair 2 Finish 148 Tertiary 17th Street 0.72 8.5 2 AC Fair 2 Finish 149 Tertiary 18th Street 0.72 8.0 2 AC Fair 2 Finish 150 Tertiary 19th Street 0.63 8.0 2 AC Bad 2 151 Tertiary 20th Street 0.44 7.0 2 AC V Bad 2 152 Tertiary 22nd Street 0.28 8.5 2 AC Bad 2 153 Tertiary 24th Street 0.34 9.0 2 Gravel Bad 2 154 Tertiary Matadi Road 1.00 7.4 2 AC Fair 2 Finish 155 Tertiary Zoo Road 0.53 6.0 2 Gravel Bad 2 170 Tertiary 12 house Road 1.09 6.0 2 Gravel Bad 2 MPW
The Master Plan Study on Urban Facilities Restoration and Improvement in Monrovia in the Republic of Liberia
Final Report 4-34
Road
No. Road Class Road Name
Distance
(km)
Width
(m)
Lane
2009
Surface
2009
Condition
2009
Lane
2019 Remarks
171 Tertiary SIM Road 0.40 5.0 1 Gravel V Bad 1 MPW 172 Tertiary Oldest Congo Town road 1.92 5.5 1 Gravel V Bad 1 MPW 173 Tertiary Pagos Island Road 1.35 4.0 1 Gravel 1 174 Tertiary Peace Island Road 0.89 5.0 1 Gravel V Bad 1 Missing 175 Tertiary Old Congo town rd 0.34 4.5 1 Earth V Bad 1 175 Tertiary Old Congo Town Road 1.29 4.5 1 Gravel V Bad 1 176 Tertiary Solotori road 0.80 5.0 1 Earth V Bad 2 177 Tertiary Bachue Town 0.61 3.5 1 Earth Bad 2 Missing 178 Tertiary Sophie Community Road 0.61 5.0 1 Gravel Fair 2 179 Tertiary Sophie Community Road 0.47 6.0 2 AC V Bad 2 MPW 180 Tertiary Gaye Town Road 0.14 6.6 2 Earth Bad 2 180 Tertiary Gaye Town Road 0.35 6.6 2 AC Good 2 Finish 180 Tertiary Gaye town road 1.18 6.0 2 AC Good 2 Finish 181 Tertiary Chugbor Old Road 1.13 5.0 1 Earth Bad 1 181 Tertiary Chugbor Road 0.34 6.6 2 AC Good 2 Finish 182 Tertiary Smyth Road 0.65 5.5 2 Gravel V Bad 2 182 Tertiary Unknown 0.14 6.0 2 Gravel Bad 2 183 Tertiary Smyth Road 0.65 5.5 2 Gravel V Bad 2 200 Tertiary Popo Beach road 0.47 6.0 1 AC V Bad 2 200 Tertiary Point Four road 0.24 7.2 2 CC Fair 2 MPW 201 Tertiary Jloh Street 0.44 5.0 1 Earth Bad 1 202 Tertiary New Kru Town Road 0.47 7.5 2 CC Fair 2 Finish 203 Tertiary New Kru Town Road 1.08 7.2 2 CC Fair 2 Finish 204 Tertiary Island Clinic Road 0.86 4.5 1 Gravel Bad 2 MPW 205 Tertiary White Avenue 0.96 3.0 1 Earth Bad 1 206 Tertiary Mombo Town Road 0.69 6.0 2 Gravel Bad 2 207 Tertiary Stockton Creeek Road 0.45 5.0 1 Grave Bad 2 MPW 208 Tertiary New Georgia North Road 1.61 4.0 1 Gravel Bad 1 209 Tertiary Caldwell New Georgia Road 2.02 5.0 1 Gravel Bad 2 MPW 210 Tertiary Taylor Mayor Compound 0.97 5.5 1 Gravel Bad 1 211 Tertiary Waterside Road 0.66 4.0 1 Gravel Bad 1 212 Tertiary Benson street 1.45 5.0 1 Earth V Bad 1 301 Tertiary Clara Town road 0.92 5.5 2 AC V Bad 2 MPW 302 Tertiary Clara Town Road 0.67 5.5 2 AC V Bad 2 MPW 303 Tertiary Doe Community Road 1.14 6.0 1 Gravel V Bad 1 MPW 303 Tertiary SK Doe Community Road 0.80 6.0 1 Gravel V Bad 1 Missing 304 Tertiary Jamaica Road 1.22 5.0 2 AC Good 2 MPW 305 Tertiary Battery Factory road 0.86 0.6 1 Gravel V Bad 2 Missing 305 Tertiary Plank Field 0.42 14.0 2 Gravel V Bad 2 306 Tertiary Silent street 1.59 4.0 1 Earth V Bad 2 Missing 307 Tertiary Barclay Town Road 0.59 3.5 1 Earth V Bad 2 Missing
The Master Plan Study on Urban Facilities Restoration and Improvement in Monrovia in the Republic of Liberia
Final Report 4-35
Road
No. Road Class Road Name
Distance
(km)
Width
(m)
Lane
2009
Surface
2009
Condition
2009
Lane
2019 Remarks
307 Tertiary Topoe Village Road 0.76 5.5 1 Gravel Bad 2 MPW 308 Tertiary Island Community road 0.76 3.5 1 Earth Bad 1 309 Tertiary Bassa Town road 0.57 4.0 1 Earth Bad 1 310 Tertiary Bassa Town Road 0.41 5.5 2 Earth Bad 2 311 Tertiary New Georgia Gulf Road 0.36 2.5 1 Earth V Bad 1 MPW 312 Tertiary New Georgia Gulf Road 0.83 3.0 1 Earth Bad 1 313 Tertiary Sign Board Road 0.78 4.5 1 Earth V Bad 1 314 Tertiary Tusa Field Road 1.57 4.0 2 Gravel V Bad 2 315 Tertiary U Curve Community Road 1.07 3.0 1 Earth V Bad 1 Missing 315 Tertiary U curve Community Road 0.40 3.0 1 Earth Bad 1 316 Tertiary Estate Area C Road 1.05 7.0 2 AC Bad 2 317 Tertiary Beh Wein Community Road 0.57 3.0 1 Earth Bad 1 Missing 317 Tertiary Behwein Community Road 0.57 3.0 1 Earth Bad 1 Missing 318 Tertiary Behwein Community Road 2.02 3.0 1 Earth V Bad 2 MPW 319 Tertiary Palm Hill Community Road 0.93 3.5 1 Earth Bad 1 320 Tertiary Palm Hill Road 0.57 3.5 1 Gravel V Bad 1 321 Tertiary Kaba - Johnsonville 0.37 3.0 1 Gravel Bad 1 321 Tertiary Kaba - Johnsonville 0.55 3.0 1 Gravel Bad 1 321 Tertiary Old Field Palm Community 1.38 3.0 1 Gravel Bad 1 322 Tertiary Duan Town Road 0.73 3.0 1 Earth Bad 1 Missing 322 Tertiary Duan Town Road 0.49 3.0 1 Earth Bad 1 323 Tertiary Nyanfor Town Road 0.63 4.5 1 Earth Bad 1 324 Tertiary Patience Shop Road 1.27 5.0 1 Gravel Bad 1 325 Tertiary Town Hall Road 0.40 5.0 1 Gravel V Bad 1 326 Tertiary Nyanfor Town Road 0.96 5.0 1 Earth V Bad 2 MPW 327 Tertiary Snow Hill Road 1.29 5.0 1 Earth Bad 2 328 Tertiary Chocolate City Road 1.28 5.0 1 Gravel Fair 2 MPW 329 Tertiary Kearduma Community Road 1.63 5.0 1 Earth Bad 1 Missing 329 Tertiary Kearduma Community Road 0.92 5.0 1 Earth Bad 1 329 Tertiary Kearduma Community Road 0.61 5.0 1 Earth Bad 1 Missing 330 Tertiary Bassa Town Road 0.70 3.5 1 Gravel Bad 1 MPW 330 Tertiary Bassa Town road 0.92 3.5 1 Gravel Bad 1 330 Tertiary Bassa Town road 0.36 3.5 1 Gravel Bad 2 330 Tertiary Bassa Town Road 0.52 3.5 1 Gravel Bad 1 Missing 331 Tertiary Shoe Factory Road 0.59 2.5 1 Earth V Bad 1 332 Tertiary Kessely Boulevard 1.69 7.5 2 Gravel Bad 2 MPW 333 Tertiary LPRC Road 0.89 4.0 1 Gravel Bad 2 333 Tertiary LPRC Road 0.60 6.5 2 AC Bad 2 334 Tertiary Chicken Soup Factory Road 1.92 6.5 2 Gravel Fair 2 MPW 335 Tertiary Chicken Soup Factory Road 2 0.53 3.5 1 Gravel V Bad 1 Missing 335 Tertiary D-C Block Road Road 0.55 2.5 1 Earth V Bad 1 Missing
The Master Plan Study on Urban Facilities Restoration and Improvement in Monrovia in the Republic of Liberia
Final Report 4-36
Road
No. Road Class Road Name
Distance
(km)
Width
(m)
Lane
2009
Surface
2009
Condition
2009
Lane
2019 Remarks
335 Tertiary Steven Tolbert Road 0.44 4.5 1 Earth V Bad 2 336 Tertiary E-C Block Street 0.58 15.0 4 CC Fair 4 Finish 337 Tertiary Swaggart Island Road 1.01 7.0 2 Earth V Bad 2 338 Tertiary Shoe Factory Road 0.27 4.0 1 Gravel Bad 2 339 Tertiary Shoe Factory Road 0.35 3.0 1 Earth Bad 2 401 Tertiary Lorma Community Road 0.48 3.0 1 Earth V Bad 1 401 Tertiary Karnga Town Road 3.68 4.0 2 Gravel Fair 2 Finish 402 Tertiary FDA Road 1.99 5.5 2 AC Bad 2 Missing 403 Tertiary Telecom Road 1.20 7.5 2 AC Good 2 Finish 404 Tertiary SPS Road 1.13 3.5 2 Gravel Bad 2 MPW 405 Tertiary Woodcamp Community road 0.48 3.0 1 Gravel Bad 2 406 Tertiary Morris's Farm Road 0.84 4.0 1 Gravel V Bad 2 Missing 407 Tertiary Old Field Road 0.64 3.0 1 Gravel V Bad 2 Missing 408 Tertiary Wein Town Old Field road 1.57 3.5 1 Earth V Bad 2 409 Tertiary Rehab Road 0.56 3.5 2 Gravel V Bad 2 410 Tertiary Garvan Town Road 0.91 3.0 1 Gravel V Bad 1 412 Tertiary Christian community Road 0.42 2.0 1 Gravel Bad 1 413 Tertiary City View Road 0.90 2.0 1 Gravel V Bad 2 414 Tertiary Kpelleh Mansion Road 0.44 2.5 1 Gravel Bad 1 415 Tertiary Old Field Road 1.33 4.0 1 Earth V Bad 1 Missing 416 Tertiary Jacob Peace Island Road 0.75 5.5 1 Gravel V Bad 1 MPW 417 Tertiary Jacob Town Road 0.95 3.0 1 Earth Bad 1 Missing 418 Tertiary St Francis Road 1.22 4.0 2 Earth Bad 2 Missing 419 Tertiary Neezoe Road 1 1.35 3.0 1 Gravel Bad 2 MPW 420 Tertiary Neezoe Community Road 1.27 4.0 2 Gravel V Bad 2 421 Tertiary Supermarket Community road 0.66 4.0 2 Gravel Bad 2 Missing 422 Tertiary Ballah creek road 0.61 3.0 1 Gravel Bad 2 Missing 423 Tertiary Amegashi Road 0.72 3.0 1 Earth Fair 2 MPW 451 Tertiary Moses Blah Road 1.37 3.0 1 Earth V Bad 2 Missing 452 Tertiary Diamond Creek Road 1.61 3.5 1 Gravel Bad 2 MPW 453 Tertiary Moses Blah Road 0.82 3.5 2 Gravel Bad 2 454 Tertiary Coca-Cola Factory Road 1.01 3.5 1 Gravel V Bad 2 455 Tertiary Soul Clinic Road 3.90 5.5 2 Earth V Bad 2 MPW 456 Tertiary Old Cape Mount town Road 0.56 5.0 2 Gravel Bad 2 457 Tertiary Kemah Duport 1.19 3.5 1 Earth Bad 2 457 Tertiary Old Cape Mount Road 0.58 3.5 1 Earth Bad 2 458 Tertiary New Cape Mount Road 0.67 5.5 2 Gravel Bad 2 459 Tertiary Cow Field Road 1.27 3.5 1 Earth Bad 1 460 Tertiary Duport Road South 1.84 6.0 2 AC Fair 2 Finish 461 Tertiary Duport South North St1 0.71 3.5 2 Gravel V Bad 2 Missing 461 Tertiary Zubah Town Community Road 0.84 3.5 2 Gravel V Bad 2 Missing
The Master Plan Study on Urban Facilities Restoration and Improvement in Monrovia in the Republic of Liberia
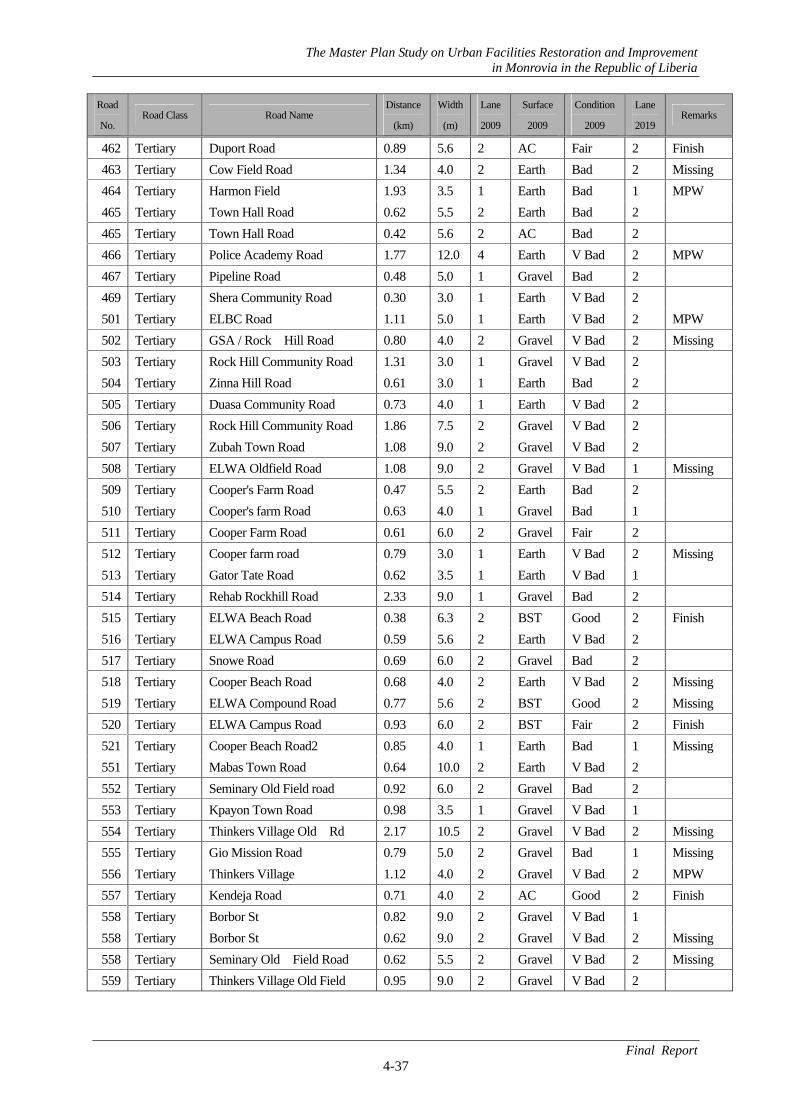
Final Report 4-37
Road
No. Road Class Road Name
Distance
(km)
Width
(m)
Lane
2009
Surface
2009
Condition
2009
Lane
2019 Remarks
462 Tertiary Duport Road 0.89 5.6 2 AC Fair 2 Finish 463 Tertiary Cow Field Road 1.34 4.0 2 Earth Bad 2 Missing 464 Tertiary Harmon Field 1.93 3.5 1 Earth Bad 1 MPW 465 Tertiary Town Hall Road 0.62 5.5 2 Earth Bad 2 465 Tertiary Town Hall Road 0.42 5.6 2 AC Bad 2 466 Tertiary Police Academy Road 1.77 12.0 4 Earth V Bad 2 MPW 467 Tertiary Pipeline Road 0.48 5.0 1 Gravel Bad 2 469 Tertiary Shera Community Road 0.30 3.0 1 Earth V Bad 2 501 Tertiary ELBC Road 1.11 5.0 1 Earth V Bad 2 MPW 502 Tertiary GSA / Rock Hill Road 0.80 4.0 2 Gravel V Bad 2 Missing 503 Tertiary Rock Hill Community Road 1.31 3.0 1 Gravel V Bad 2 504 Tertiary Zinna Hill Road 0.61 3.0 1 Earth Bad 2 505 Tertiary Duasa Community Road 0.73 4.0 1 Earth V Bad 2 506 Tertiary Rock Hill Community Road 1.86 7.5 2 Gravel V Bad 2 507 Tertiary Zubah Town Road 1.08 9.0 2 Gravel V Bad 2 508 Tertiary ELWA Oldfield Road 1.08 9.0 2 Gravel V Bad 1 Missing 509 Tertiary Cooper's Farm Road 0.47 5.5 2 Earth Bad 2 510 Tertiary Cooper's farm Road 0.63 4.0 1 Gravel Bad 1 511 Tertiary Cooper Farm Road 0.61 6.0 2 Gravel Fair 2 512 Tertiary Cooper farm road 0.79 3.0 1 Earth V Bad 2 Missing 513 Tertiary Gator Tate Road 0.62 3.5 1 Earth V Bad 1 514 Tertiary Rehab Rockhill Road 2.33 9.0 1 Gravel Bad 2 515 Tertiary ELWA Beach Road 0.38 6.3 2 BST Good 2 Finish 516 Tertiary ELWA Campus Road 0.59 5.6 2 Earth V Bad 2 517 Tertiary Snowe Road 0.69 6.0 2 Gravel Bad 2 518 Tertiary Cooper Beach Road 0.68 4.0 2 Earth V Bad 2 Missing 519 Tertiary ELWA Compound Road 0.77 5.6 2 BST Good 2 Missing 520 Tertiary ELWA Campus Road 0.93 6.0 2 BST Fair 2 Finish 521 Tertiary Cooper Beach Road2 0.85 4.0 1 Earth Bad 1 Missing 551 Tertiary Mabas Town Road 0.64 10.0 2 Earth V Bad 2 552 Tertiary Seminary Old Field road 0.92 6.0 2 Gravel Bad 2 553 Tertiary Kpayon Town Road 0.98 3.5 1 Gravel V Bad 1 554 Tertiary Thinkers Village Old Rd 2.17 10.5 2 Gravel V Bad 2 Missing 555 Tertiary Gio Mission Road 0.79 5.0 2 Gravel Bad 1 Missing 556 Tertiary Thinkers Village 1.12 4.0 2 Gravel V Bad 2 MPW 557 Tertiary Kendeja Road 0.71 4.0 2 AC Good 2 Finish 558 Tertiary Borbor St 0.82 9.0 2 Gravel V Bad 1 558 Tertiary Borbor St 0.62 9.0 2 Gravel V Bad 2 Missing 558 Tertiary Seminary Old Field Road 0.62 5.5 2 Gravel V Bad 2 Missing 559 Tertiary Thinkers Village Old Field 0.95 9.0 2 Gravel V Bad 2
The Master Plan Study on Urban Facilities Restoration and Improvement in Monrovia in the Republic of Liberia
Final Report 4-38
4.3.2 Johnson Street Improvement Project
4.3.2.1 Background
The existing bridge is located at the entrance of Central Monrovia, the most developed Central Business District (CBD). The access to CBD is only allowed through UN Drive from northern area and Tubman Boulevard from eastern area. Both approaching roads of the bridge have multi-lanes for one direction, but the bridge does not have enough width for multi-lane operation, so the carriageway is divided to provide one lane for one direction. This narrowed section is the bottleneck of the traffic. Another bridge, called Vai Town Bridge located on UN Drive, for access to CBD collapsed in 2006. The reconstruction project is scheduled to complete in 2010. Although new bridge would be provided, the capacity of bridges is insufficient according to the traffic forecast. The traffic congestion of the roads on both sides of bridge will be worse near future.
4.3.2.2 Existing and Future Traffic Situation of Johnson Street Bridge
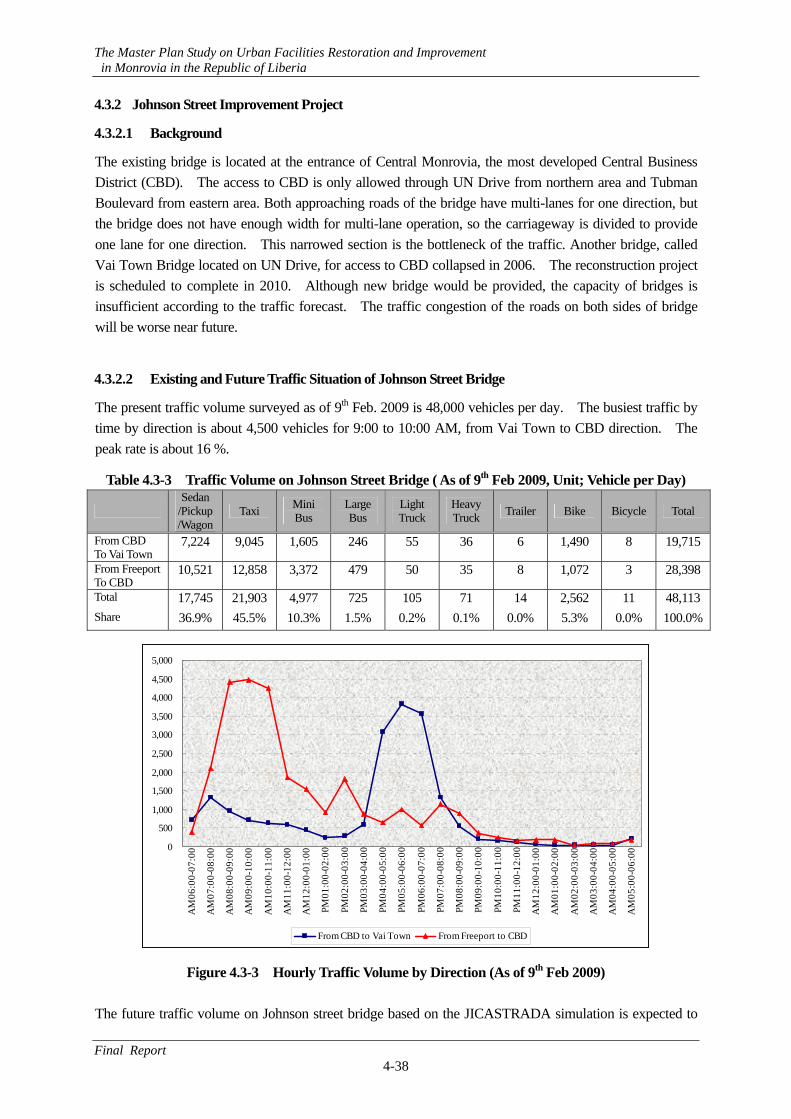
The present traffic volume surveyed as of 9th Feb. 2009 is 48,000 vehicles per day. The busiest traffic by time by direction is about 4,500 vehicles for 9:00 to 10:00 AM, from Vai Town to CBD direction. The peak rate is about 16 %.
Table 4.3-3 Traffic Volume on Johnson Street Bridge ( As of 9th Feb 2009, Unit; Vehicle per Day)
Sedan
/Pickup /Wagon
Taxi Mini Bus
Large Bus
Light Truck
Heavy Truck Trailer Bike Bicycle Total
From CBD To Vai Town
7,224 9,045 1,605 246 55 36 6 1,490 8 19,715
From Freeport To CBD
10,521 12,858 3,372 479 50 35 8 1,072 3 28,398
Total 17,745 21,903 4,977 725 105 71 14 2,562 11 48,113Share 36.9% 45.5% 10.3% 1.5% 0.2% 0.1% 0.0% 5.3% 0.0% 100.0%
0
500
1,000
1,500
2,000
2,500
3,000
3,500
4,000
4,500
5,000
AM
06:0
0-07
:00
AM
07:0
0-08
:00
AM
08:0
0-09
:00
AM
09:0
0-10
:00
AM
10:0
0-11
:00
AM
11:0
0-12
:00
AM
12:0
0-01
:00
PM01
:00-
02:0
0
PM02
:00-
03:0
0
PM03
:00-
04:0
0
PM04
:00-
05:0
0
PM05
:00-
06:0
0
PM
06:0
0-07
:00
PM
07:0
0-08
:00
PM
08:0
0-09
:00
PM
09:0
0-10
:00
PM10
:00-
11:0
0
PM11
:00-
12:0
0
AM
12:0
0-01
:00
AM
01:0
0-02
:00
AM
02:0
0-03
:00
AM
03:0
0-04
:00
AM
04:0
0-05
:00
AM
05:0
0-06
:00
From CBD to Vai Town From Freeport to CBD
Figure 4.3-3 Hourly Traffic Volume by Direction (As of 9th Feb 2009) The future traffic volume on Johnson street bridge based on the JICASTRADA simulation is expected to
The Master Plan Study on Urban Facilities Restoration and Improvement in Monrovia in the Republic of Liberia
Final Report 4-39
be 54,800 vehicles at year 2014 and 66,600 vehicles at year 2019. The traffic volume for new Vai Town Bridge on the same simulation results is expected to be 21,900 vehicles for 2014 and 29,700 vehicles for 2019 respectively.
4.3.2.3 Objectives of the Project
To mitigate the traffic congestion To provide favorable and acceptable road service at crossroads of Mesurado marshland
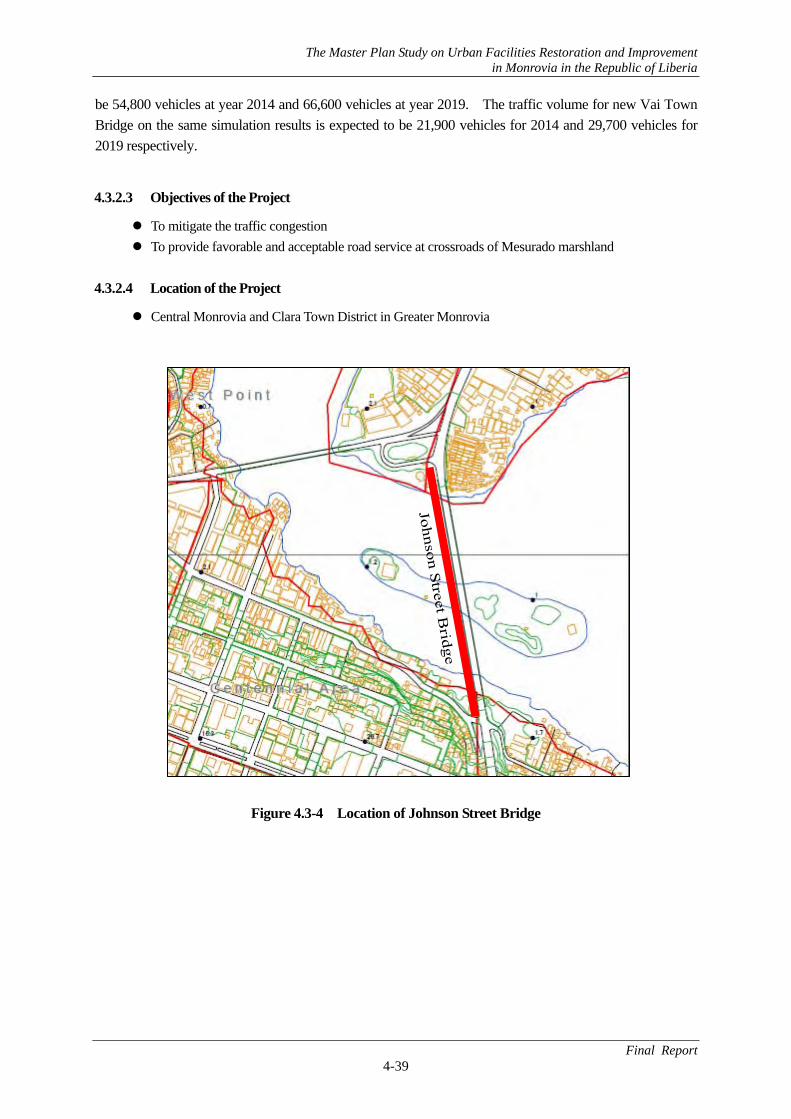
4.3.2.4 Location of the Project
Central Monrovia and Clara Town District in Greater Monrovia
Figure 4.3-4 Location of Johnson Street Bridge
The Master Plan Study on Urban Facilities Restoration and Improvement in Monrovia in the Republic of Liberia
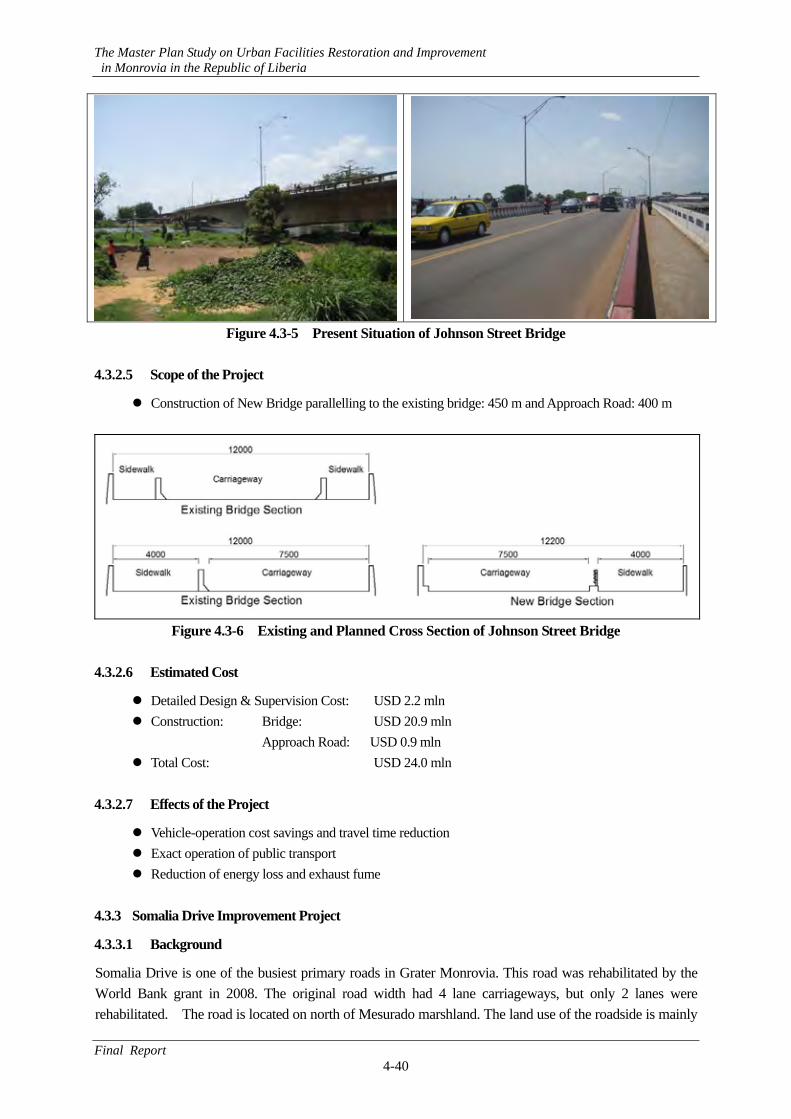
Final Report 4-40
Figure 4.3-5 Present Situation of Johnson Street Bridge 4.3.2.5 Scope of the Project
Construction of New Bridge parallelling to the existing bridge: 450 m and Approach Road: 400 m
Figure 4.3-6 Existing and Planned Cross Section of Johnson Street Bridge
4.3.2.6 Estimated Cost
Detailed Design & Supervision Cost: USD 2.2 mln Construction: Bridge: USD 20.9 mln
Approach Road: USD 0.9 mln Total Cost: USD 24.0 mln
4.3.2.7 Effects of the Project
Vehicle-operation cost savings and travel time reduction Exact operation of public transport Reduction of energy loss and exhaust fume
4.3.3 Somalia Drive Improvement Project
4.3.3.1 Background
Somalia Drive is one of the busiest primary roads in Grater Monrovia. This road was rehabilitated by the World Bank grant in 2008. The original road width had 4 lane carriageways, but only 2 lanes were rehabilitated. The road is located on north of Mesurado marshland. The land use of the roadside is mainly
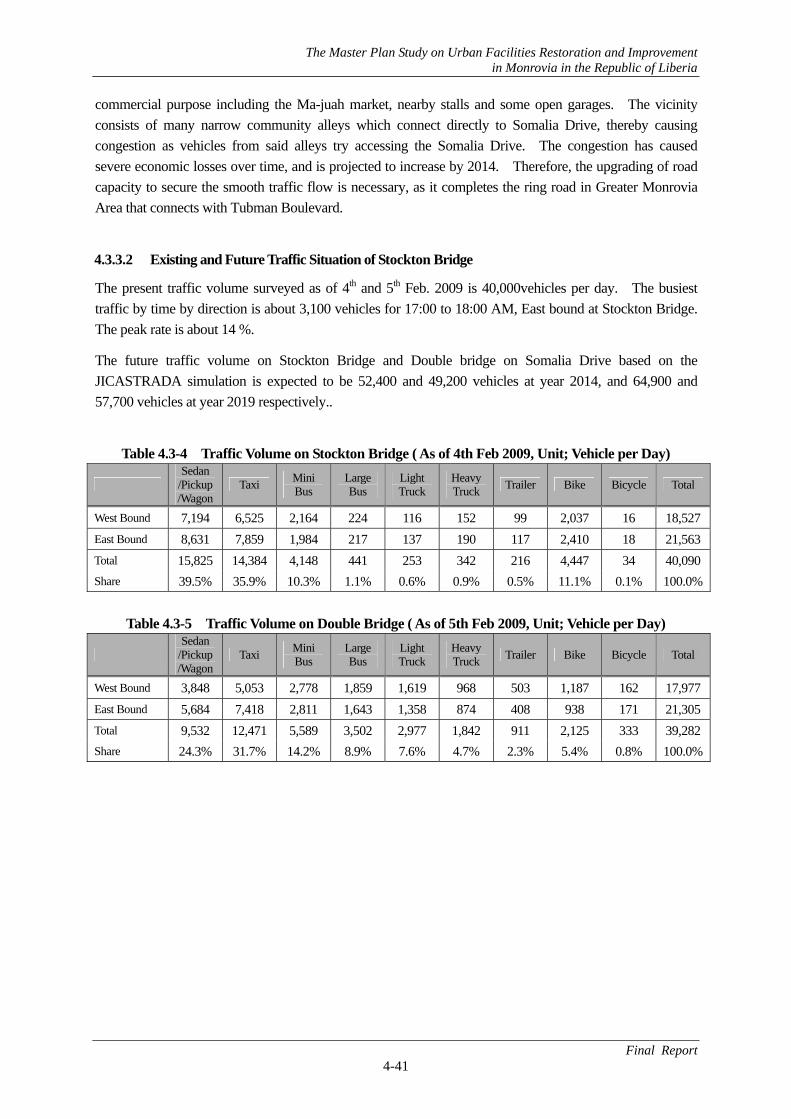
The Master Plan Study on Urban Facilities Restoration and Improvement in Monrovia in the Republic of Liberia
Final Report 4-41
commercial purpose including the Ma-juah market, nearby stalls and some open garages. The vicinity consists of many narrow community alleys which connect directly to Somalia Drive, thereby causing congestion as vehicles from said alleys try accessing the Somalia Drive. The congestion has caused severe economic losses over time, and is projected to increase by 2014. Therefore, the upgrading of road capacity to secure the smooth traffic flow is necessary, as it completes the ring road in Greater Monrovia Area that connects with Tubman Boulevard.
4.3.3.2 Existing and Future Traffic Situation of Stockton Bridge
The present traffic volume surveyed as of 4th and 5th Feb. 2009 is 40,000vehicles per day. The busiest traffic by time by direction is about 3,100 vehicles for 17:00 to 18:00 AM, East bound at Stockton Bridge. The peak rate is about 14 %.
The future traffic volume on Stockton Bridge and Double bridge on Somalia Drive based on the JICASTRADA simulation is expected to be 52,400 and 49,200 vehicles at year 2014, and 64,900 and 57,700 vehicles at year 2019 respectively..
Table 4.3-4 Traffic Volume on Stockton Bridge ( As of 4th Feb 2009, Unit; Vehicle per Day)
Sedan
/Pickup /Wagon
Taxi Mini Bus
Large Bus
Light Truck
Heavy Truck Trailer Bike Bicycle Total
West Bound 7,194 6,525 2,164 224 116 152 99 2,037 16 18,527East Bound 8,631 7,859 1,984 217 137 190 117 2,410 18 21,563Total 15,825 14,384 4,148 441 253 342 216 4,447 34 40,090Share 39.5% 35.9% 10.3% 1.1% 0.6% 0.9% 0.5% 11.1% 0.1% 100.0%
Table 4.3-5 Traffic Volume on Double Bridge ( As of 5th Feb 2009, Unit; Vehicle per Day)
Sedan
/Pickup /Wagon
Taxi Mini Bus
Large Bus
Light Truck
Heavy Truck Trailer Bike Bicycle Total
West Bound 3,848 5,053 2,778 1,859 1,619 968 503 1,187 162 17,977East Bound 5,684 7,418 2,811 1,643 1,358 874 408 938 171 21,305Total 9,532 12,471 5,589 3,502 2,977 1,842 911 2,125 333 39,282Share 24.3% 31.7% 14.2% 8.9% 7.6% 4.7% 2.3% 5.4% 0.8% 100.0%
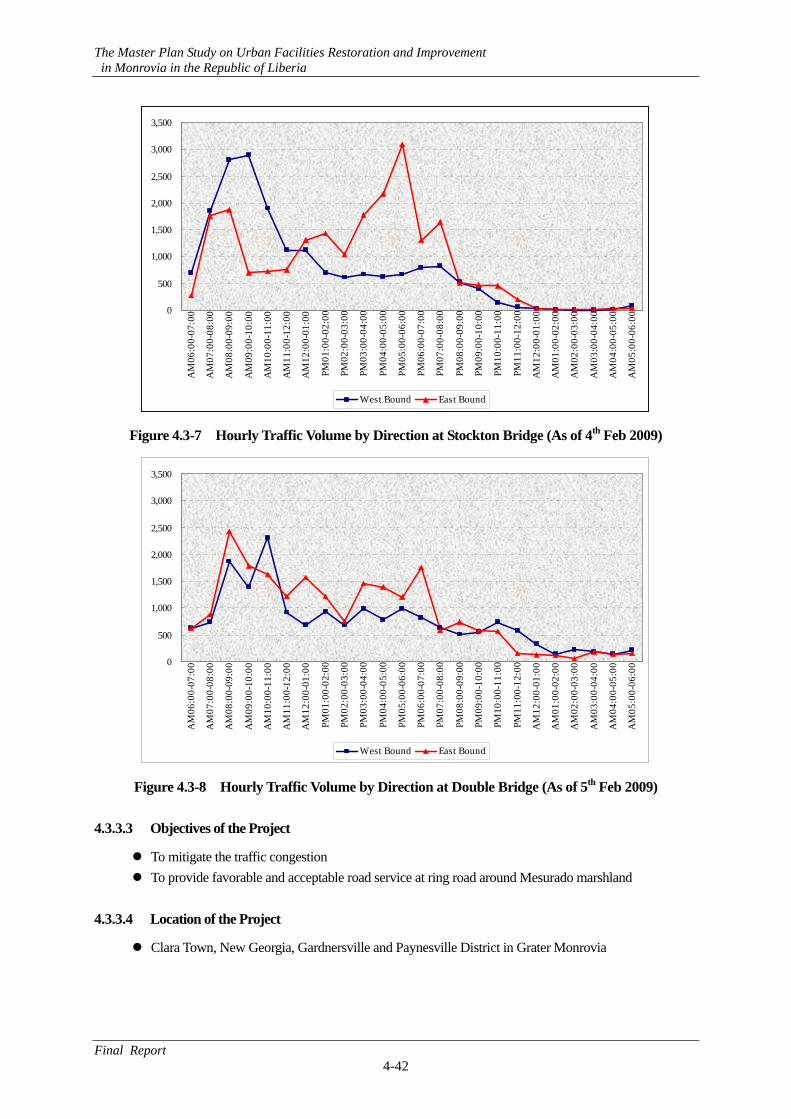
The Master Plan Study on Urban Facilities Restoration and Improvement in Monrovia in the Republic of Liberia
Final Report 4-42
0
500
1,000
1,500
2,000
2,500
3,000
3,500
AM
06:0
0-07
:00
AM
07:0
0-08
:00
AM
08:0
0-09
:00
AM
09:0
0-10
:00
AM
10:0
0-11
:00
AM
11:0
0-12
:00
AM
12:0
0-01
:00
PM01
:00-
02:0
0
PM02
:00-
03:0
0
PM03
:00-
04:0
0
PM04
:00-
05:0
0
PM05
:00-
06:0
0
PM
06:0
0-07
:00
PM
07:0
0-08
:00
PM
08:0
0-09
:00
PM
09:0
0-10
:00
PM10
:00-
11:0
0
PM11
:00-
12:0
0
AM
12:0
0-01
:00
AM
01:0
0-02
:00
AM
02:0
0-03
:00
AM
03:0
0-04
:00
AM
04:0
0-05
:00
AM
05:0
0-06
:00
West Bound East Bound
Figure 4.3-7 Hourly Traffic Volume by Direction at Stockton Bridge (As of 4th Feb 2009)
0
500
1,000
1,500
2,000
2,500
3,000
3,500
AM
06:0
0-07
:00
AM
07:0
0-08
:00
AM
08:0
0-09
:00
AM
09:0
0-10
:00
AM
10:0
0-11
:00
AM
11:0
0-12
:00
AM
12:0
0-01
:00
PM01
:00-
02:0
0
PM02
:00-
03:0
0
PM03
:00-
04:0
0
PM04
:00-
05:0
0
PM05
:00-
06:0
0
PM
06:0
0-07
:00
PM
07:0
0-08
:00
PM
08:0
0-09
:00
PM
09:0
0-10
:00
PM10
:00-
11:0
0
PM11
:00-
12:0
0
AM
12:0
0-01
:00
AM
01:0
0-02
:00
AM
02:0
0-03
:00
AM
03:0
0-04
:00
AM
04:0
0-05
:00
AM
05:0
0-06
:00
West Bound East Bound
Figure 4.3-8 Hourly Traffic Volume by Direction at Double Bridge (As of 5th Feb 2009) 4.3.3.3 Objectives of the Project
To mitigate the traffic congestion To provide favorable and acceptable road service at ring road around Mesurado marshland
4.3.3.4 Location of the Project
Clara Town, New Georgia, Gardnersville and Paynesville District in Grater Monrovia
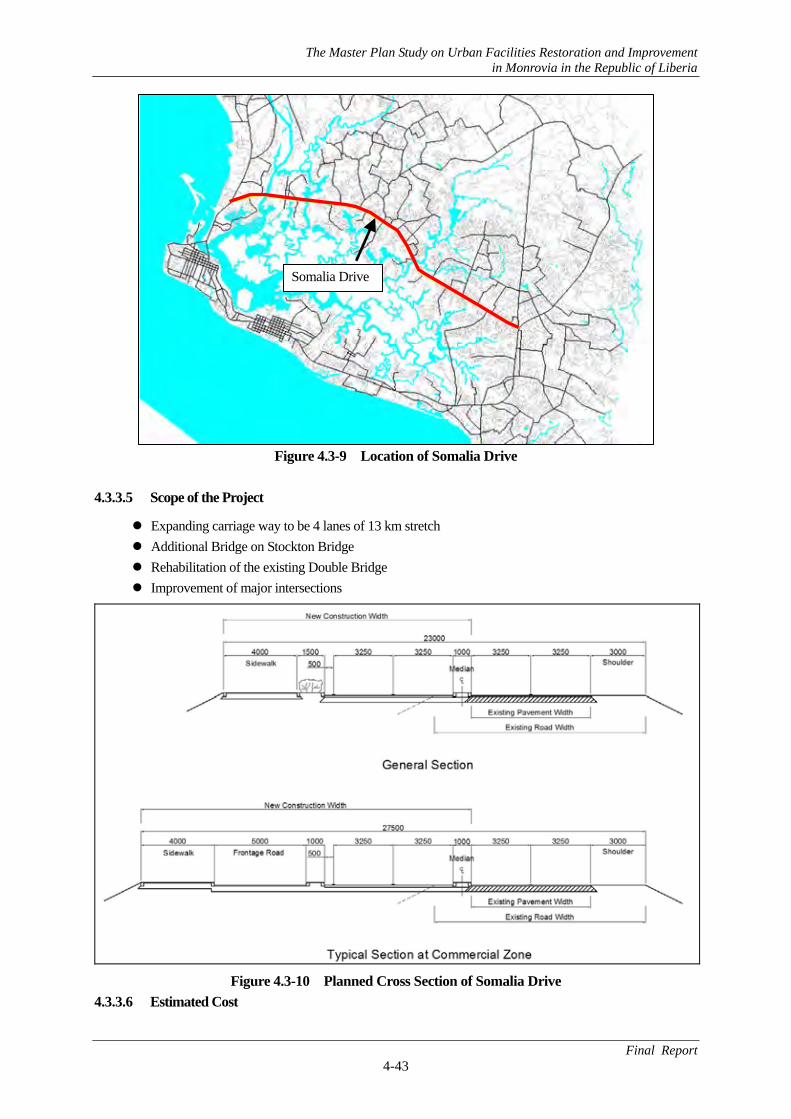
The Master Plan Study on Urban Facilities Restoration and Improvement in Monrovia in the Republic of Liberia
Final Report 4-43
Figure 4.3-9 Location of Somalia Drive
4.3.3.5 Scope of the Project
Expanding carriage way to be 4 lanes of 13 km stretch Additional Bridge on Stockton Bridge Rehabilitation of the existing Double Bridge Improvement of major intersections
Figure 4.3-10 Planned Cross Section of Somalia Drive
4.3.3.6 Estimated Cost
Somalia Drive
The Master Plan Study on Urban Facilities Restoration and Improvement in Monrovia in the Republic of Liberia
Final Report 4-44
Detailed Design & Supervision Cost: USD 1.91 mln Construction:
Earth Work: USD 2.285 mln Pavement: USD 9.790 mln Road Facilities: USD 3.515 mln Bridge: USD 3.600 mln
Total Cost: USD 21.100 mln
4.3.3.7 Effects of the Project
Vehicle operation cost savings and travel time reduction Exact operation of public transport Reduction of energy loss and exhaust fume
4.3.4 Bridge on Missing Link Improvement Project
4.3.4.1 Existing Condition of Bridge and Culverts
Based on the survey by aerial photo, 487 bridges and culverts exist for Greater Monrovia. Presently, MPW and the international donor are going to have restoration projects for road network including bridge and culverts renovations. But the comprehensive and area drainage system is not planned so far, the concept of the on-going project is to keep the traffic for severe damaged and important sections.
This MPW project is using Liberia Infrastructure Trust Fund, but the limitation of budget because of lack of fund source results in the delay of improvement for the costly section or minor road linking the community each other. In rainy season, some communities have lost the access way to other communities and cities.
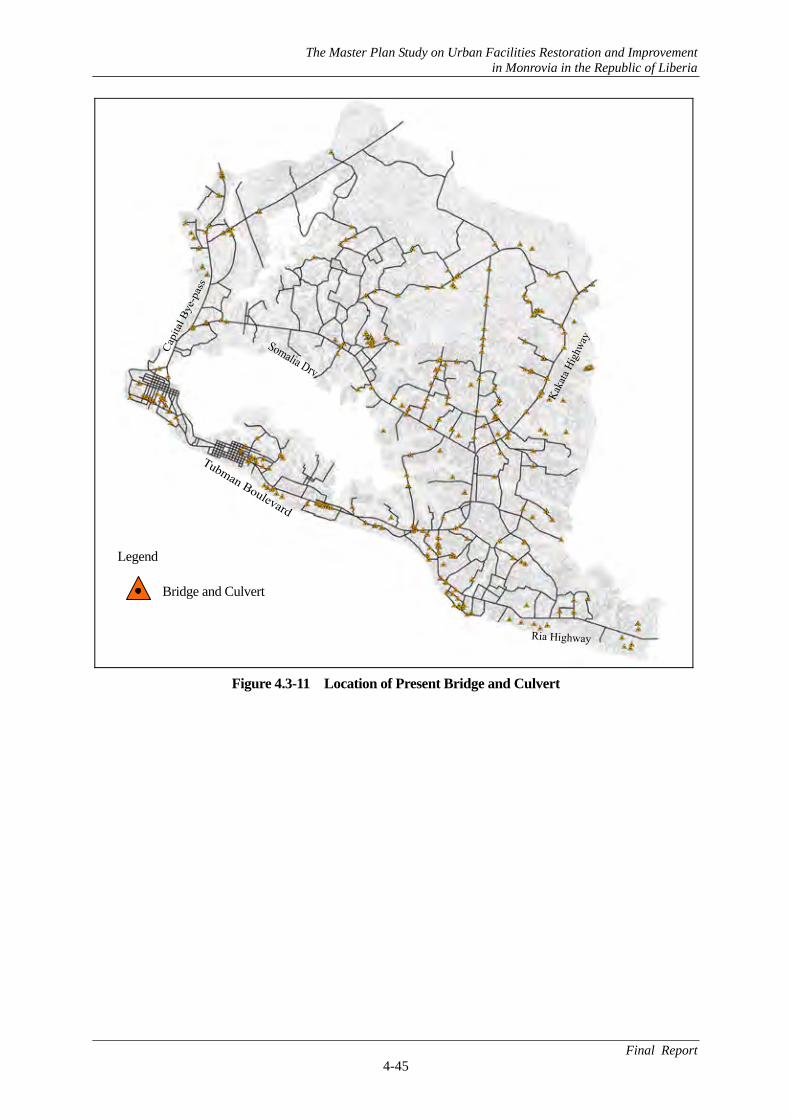
The Master Plan Study on Urban Facilities Restoration and Improvement in Monrovia in the Republic of Liberia
Final Report 4-45
Figure 4.3-11 Location of Present Bridge and Culvert
Legend
Bridge and Culvert
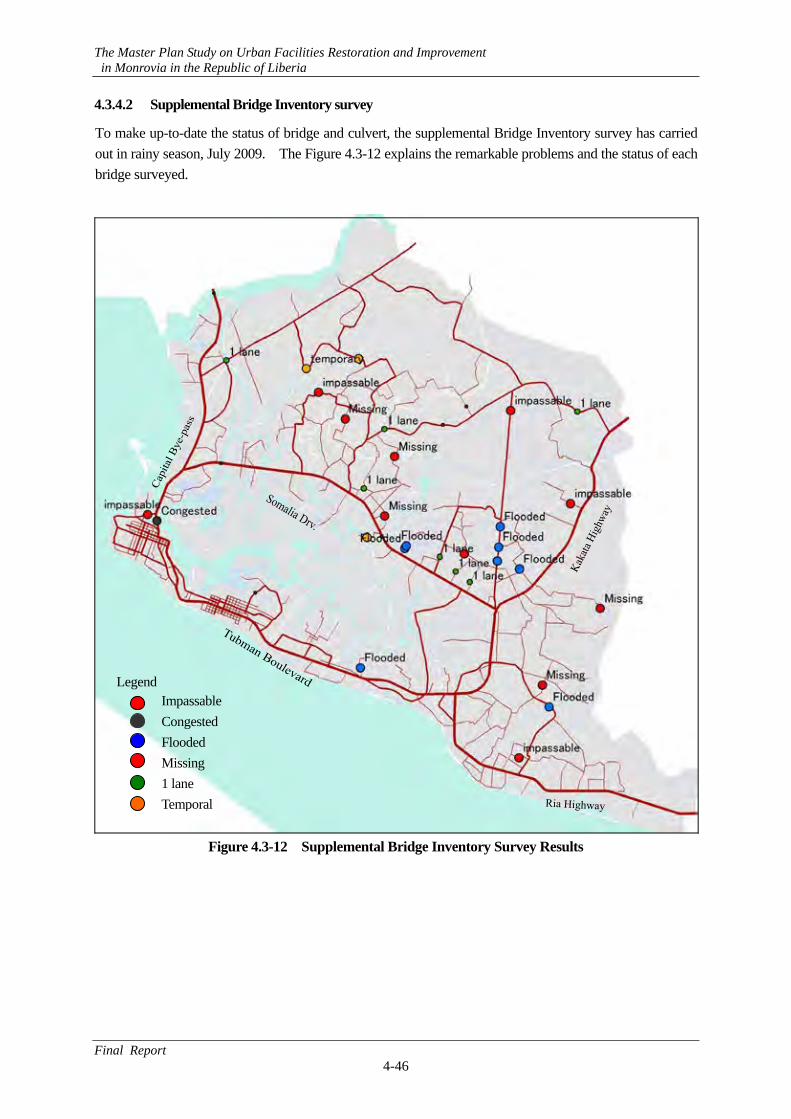
The Master Plan Study on Urban Facilities Restoration and Improvement in Monrovia in the Republic of Liberia
Final Report 4-46
4.3.4.2 Supplemental Bridge Inventory survey
To make up-to-date the status of bridge and culvert, the supplemental Bridge Inventory survey has carried out in rainy season, July 2009. The Figure 4.3-12 explains the remarkable problems and the status of each bridge surveyed.
Figure 4.3-12 Supplemental Bridge Inventory Survey Results
Legend Impassable Congested Flooded Missing 1 lane Temporal
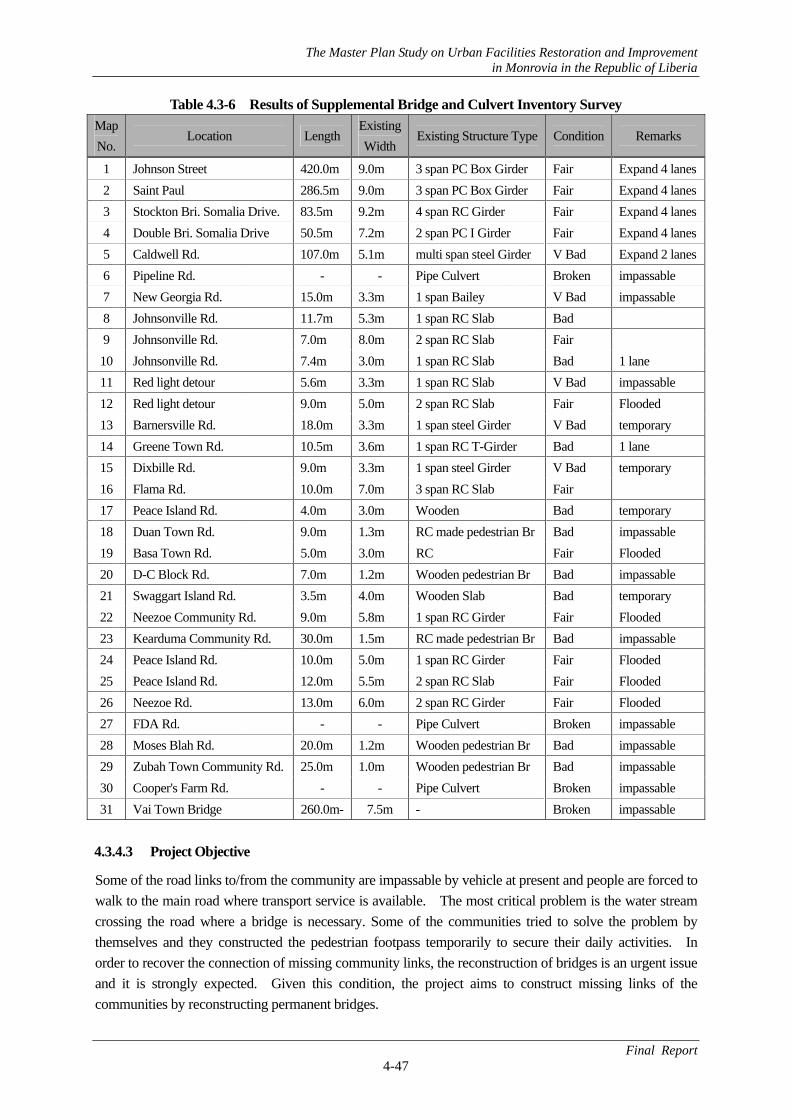
The Master Plan Study on Urban Facilities Restoration and Improvement in Monrovia in the Republic of Liberia
Final Report 4-47
Table 4.3-6 Results of Supplemental Bridge and Culvert Inventory Survey Map No.
Location LengthExistingWidth
Existing Structure Type Condition Remarks
1 Johnson Street 420.0m 9.0m 3 span PC Box Girder Fair Expand 4 lanes2 Saint Paul 286.5m 9.0m 3 span PC Box Girder Fair Expand 4 lanes3 Stockton Bri. Somalia Drive. 83.5m 9.2m 4 span RC Girder Fair Expand 4 lanes4 Double Bri. Somalia Drive 50.5m 7.2m 2 span PC I Girder Fair Expand 4 lanes5 Caldwell Rd. 107.0m 5.1m multi span steel Girder V Bad Expand 2 lanes6 Pipeline Rd. - - Pipe Culvert Broken impassable 7 New Georgia Rd. 15.0m 3.3m 1 span Bailey V Bad impassable 8 Johnsonville Rd. 11.7m 5.3m 1 span RC Slab Bad 9 Johnsonville Rd. 7.0m 8.0m 2 span RC Slab Fair 10 Johnsonville Rd. 7.4m 3.0m 1 span RC Slab Bad 1 lane 11 Red light detour 5.6m 3.3m 1 span RC Slab V Bad impassable 12 Red light detour 9.0m 5.0m 2 span RC Slab Fair Flooded 13 Barnersville Rd. 18.0m 3.3m 1 span steel Girder V Bad temporary 14 Greene Town Rd. 10.5m 3.6m 1 span RC T-Girder Bad 1 lane 15 Dixbille Rd. 9.0m 3.3m 1 span steel Girder V Bad temporary 16 Flama Rd. 10.0m 7.0m 3 span RC Slab Fair 17 Peace Island Rd. 4.0m 3.0m Wooden Bad temporary 18 Duan Town Rd. 9.0m 1.3m RC made pedestrian Br Bad impassable 19 Basa Town Rd. 5.0m 3.0m RC Fair Flooded 20 D-C Block Rd. 7.0m 1.2m Wooden pedestrian Br Bad impassable 21 Swaggart Island Rd. 3.5m 4.0m Wooden Slab Bad temporary 22 Neezoe Community Rd. 9.0m 5.8m 1 span RC Girder Fair Flooded 23 Kearduma Community Rd. 30.0m 1.5m RC made pedestrian Br Bad impassable 24 Peace Island Rd. 10.0m 5.0m 1 span RC Girder Fair Flooded 25 Peace Island Rd. 12.0m 5.5m 2 span RC Slab Fair Flooded 26 Neezoe Rd. 13.0m 6.0m 2 span RC Girder Fair Flooded 27 FDA Rd. - - Pipe Culvert Broken impassable 28 Moses Blah Rd. 20.0m 1.2m Wooden pedestrian Br Bad impassable 29 Zubah Town Community Rd. 25.0m 1.0m Wooden pedestrian Br Bad impassable 30 Cooper's Farm Rd. - - Pipe Culvert Broken impassable 31 Vai Town Bridge 260.0m- 7.5m - Broken impassable
4.3.4.3 Project Objective
Some of the road links to/from the community are impassable by vehicle at present and people are forced to walk to the main road where transport service is available. The most critical problem is the water stream crossing the road where a bridge is necessary. Some of the communities tried to solve the problem by themselves and they constructed the pedestrian footpass temporarily to secure their daily activities. In order to recover the connection of missing community links, the reconstruction of bridges is an urgent issue and it is strongly expected. Given this condition, the project aims to construct missing links of the communities by reconstructing permanent bridges.
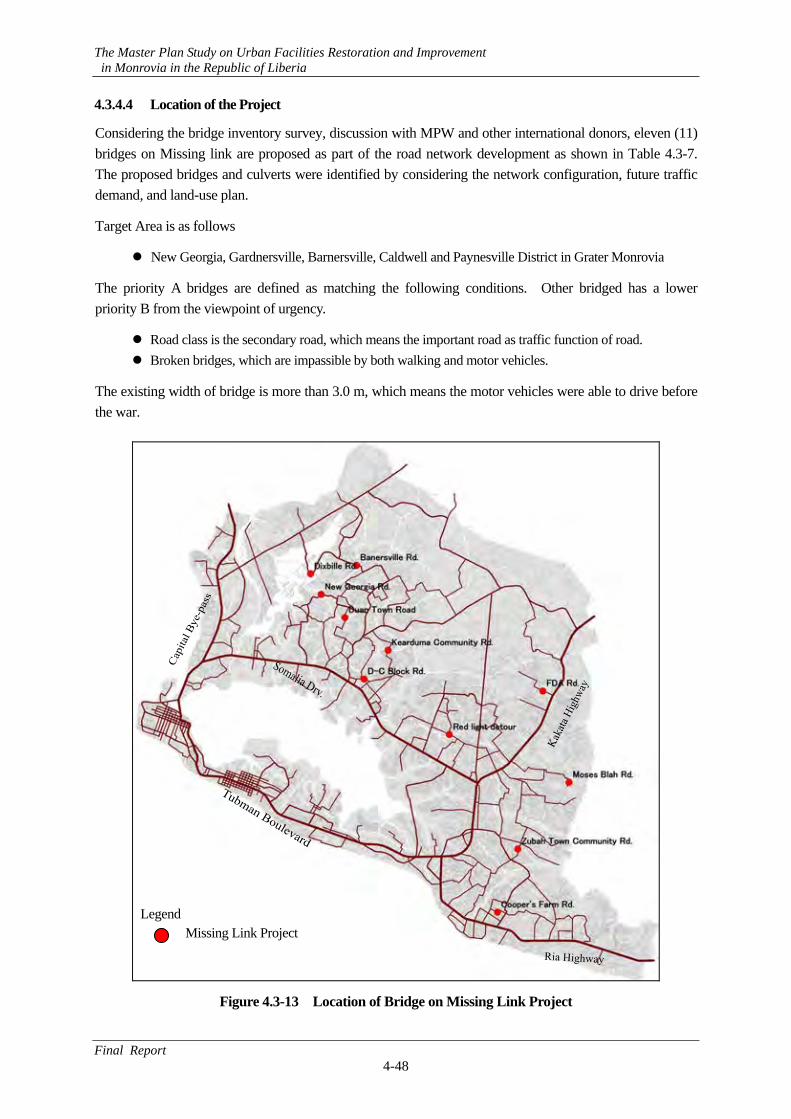
The Master Plan Study on Urban Facilities Restoration and Improvement in Monrovia in the Republic of Liberia
Final Report 4-48
4.3.4.4 Location of the Project
Considering the bridge inventory survey, discussion with MPW and other international donors, eleven (11) bridges on Missing link are proposed as part of the road network development as shown in Table 4.3-7. The proposed bridges and culverts were identified by considering the network configuration, future traffic demand, and land-use plan.
Target Area is as follows
New Georgia, Gardnersville, Barnersville, Caldwell and Paynesville District in Grater Monrovia
The priority A bridges are defined as matching the following conditions. Other bridged has a lower priority B from the viewpoint of urgency.
Road class is the secondary road, which means the important road as traffic function of road. Broken bridges, which are impassible by both walking and motor vehicles.
The existing width of bridge is more than 3.0 m, which means the motor vehicles were able to drive before the war.
Figure 4.3-13 Location of Bridge on Missing Link Project
Legend Missing Link Project
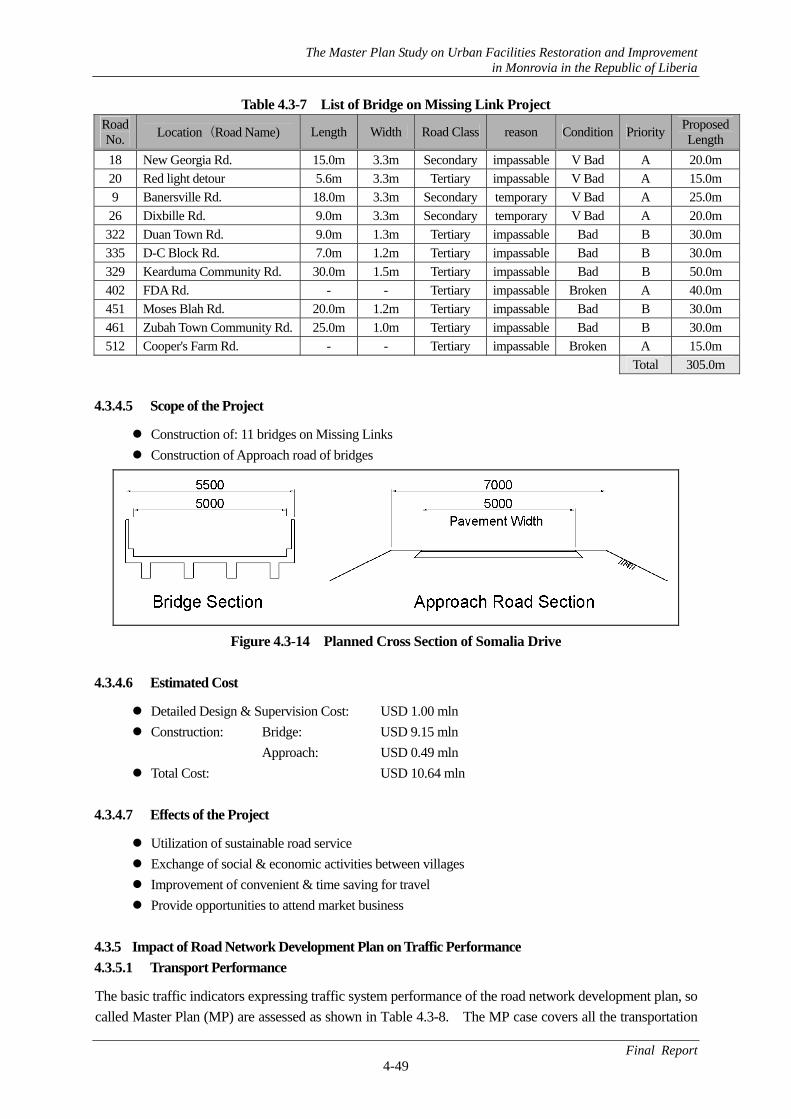
The Master Plan Study on Urban Facilities Restoration and Improvement in Monrovia in the Republic of Liberia
Final Report 4-49
Table 4.3-7 List of Bridge on Missing Link Project Road No. Location(Road Name) Length Width Road Class reason Condition Priority Proposed
Length 18 New Georgia Rd. 15.0m 3.3m Secondary impassable V Bad A 20.0m 20 Red light detour 5.6m 3.3m Tertiary impassable V Bad A 15.0m 9 Banersville Rd. 18.0m 3.3m Secondary temporary V Bad A 25.0m 26 Dixbille Rd. 9.0m 3.3m Secondary temporary V Bad A 20.0m 322 Duan Town Rd. 9.0m 1.3m Tertiary impassable Bad B 30.0m 335 D-C Block Rd. 7.0m 1.2m Tertiary impassable Bad B 30.0m 329 Kearduma Community Rd. 30.0m 1.5m Tertiary impassable Bad B 50.0m 402 FDA Rd. - - Tertiary impassable Broken A 40.0m 451 Moses Blah Rd. 20.0m 1.2m Tertiary impassable Bad B 30.0m 461 Zubah Town Community Rd. 25.0m 1.0m Tertiary impassable Bad B 30.0m 512 Cooper's Farm Rd. - - Tertiary impassable Broken A 15.0m
Total 305.0m 4.3.4.5 Scope of the Project
Construction of: 11 bridges on Missing Links Construction of Approach road of bridges
Figure 4.3-14 Planned Cross Section of Somalia Drive
4.3.4.6 Estimated Cost
Detailed Design & Supervision Cost: USD 1.00 mln Construction: Bridge: USD 9.15 mln
Approach: USD 0.49 mln Total Cost: USD 10.64 mln
4.3.4.7 Effects of the Project
Utilization of sustainable road service Exchange of social & economic activities between villages Improvement of convenient & time saving for travel Provide opportunities to attend market business
4.3.5 Impact of Road Network Development Plan on Traffic Performance 4.3.5.1 Transport Performance
The basic traffic indicators expressing traffic system performance of the road network development plan, so called Master Plan (MP) are assessed as shown in Table 4.3-8. The MP case covers all the transportation
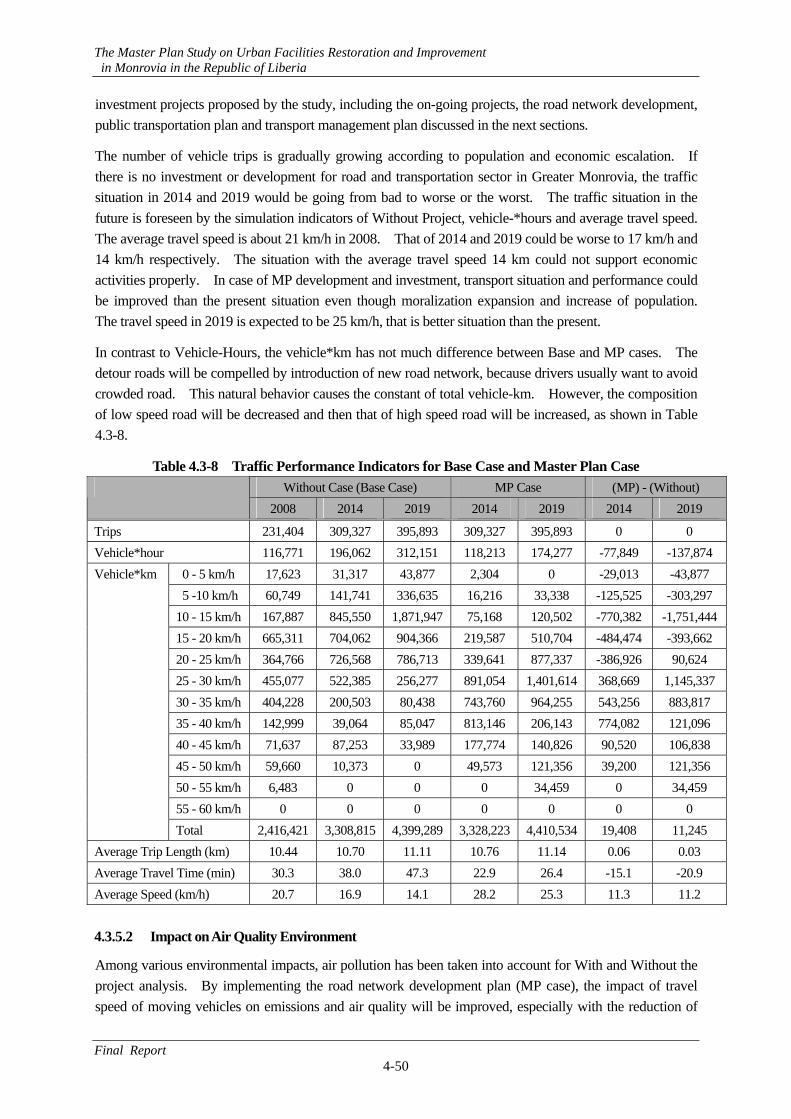
The Master Plan Study on Urban Facilities Restoration and Improvement in Monrovia in the Republic of Liberia
Final Report 4-50
investment projects proposed by the study, including the on-going projects, the road network development, public transportation plan and transport management plan discussed in the next sections.
The number of vehicle trips is gradually growing according to population and economic escalation. If there is no investment or development for road and transportation sector in Greater Monrovia, the traffic situation in 2014 and 2019 would be going from bad to worse or the worst. The traffic situation in the future is foreseen by the simulation indicators of Without Project, vehicle-*hours and average travel speed. The average travel speed is about 21 km/h in 2008. That of 2014 and 2019 could be worse to 17 km/h and 14 km/h respectively. The situation with the average travel speed 14 km could not support economic activities properly. In case of MP development and investment, transport situation and performance could be improved than the present situation even though moralization expansion and increase of population. The travel speed in 2019 is expected to be 25 km/h, that is better situation than the present.
In contrast to Vehicle-Hours, the vehicle*km has not much difference between Base and MP cases. The detour roads will be compelled by introduction of new road network, because drivers usually want to avoid crowded road. This natural behavior causes the constant of total vehicle-km. However, the composition of low speed road will be decreased and then that of high speed road will be increased, as shown in Table 4.3-8.
Table 4.3-8 Traffic Performance Indicators for Base Case and Master Plan Case Without Case (Base Case) MP Case (MP) - (Without)
2008 2014 2019 2014 2019 2014 2019
Trips 231,404 309,327 395,893 309,327 395,893 0 0 Vehicle*hour 116,771 196,062 312,151 118,213 174,277 -77,849 -137,874
0 - 5 km/h 17,623 31,317 43,877 2,304 0 -29,013 -43,877 5 -10 km/h 60,749 141,741 336,635 16,216 33,338 -125,525 -303,297 10 - 15 km/h 167,887 845,550 1,871,947 75,168 120,502 -770,382 -1,751,44415 - 20 km/h 665,311 704,062 904,366 219,587 510,704 -484,474 -393,662 20 - 25 km/h 364,766 726,568 786,713 339,641 877,337 -386,926 90,624 25 - 30 km/h 455,077 522,385 256,277 891,054 1,401,614 368,669 1,145,33730 - 35 km/h 404,228 200,503 80,438 743,760 964,255 543,256 883,817 35 - 40 km/h 142,999 39,064 85,047 813,146 206,143 774,082 121,096 40 - 45 km/h 71,637 87,253 33,989 177,774 140,826 90,520 106,838 45 - 50 km/h 59,660 10,373 0 49,573 121,356 39,200 121,356 50 - 55 km/h 6,483 0 0 0 34,459 0 34,459 55 - 60 km/h 0 0 0 0 0 0 0
Vehicle*km
Total 2,416,421 3,308,815 4,399,289 3,328,223 4,410,534 19,408 11,245 Average Trip Length (km) 10.44 10.70 11.11 10.76 11.14 0.06 0.03 Average Travel Time (min) 30.3 38.0 47.3 22.9 26.4 -15.1 -20.9 Average Speed (km/h) 20.7 16.9 14.1 28.2 25.3 11.3 11.2 4.3.5.2 Impact on Air Quality Environment
Among various environmental impacts, air pollution has been taken into account for With and Without the project analysis. By implementing the road network development plan (MP case), the impact of travel speed of moving vehicles on emissions and air quality will be improved, especially with the reduction of
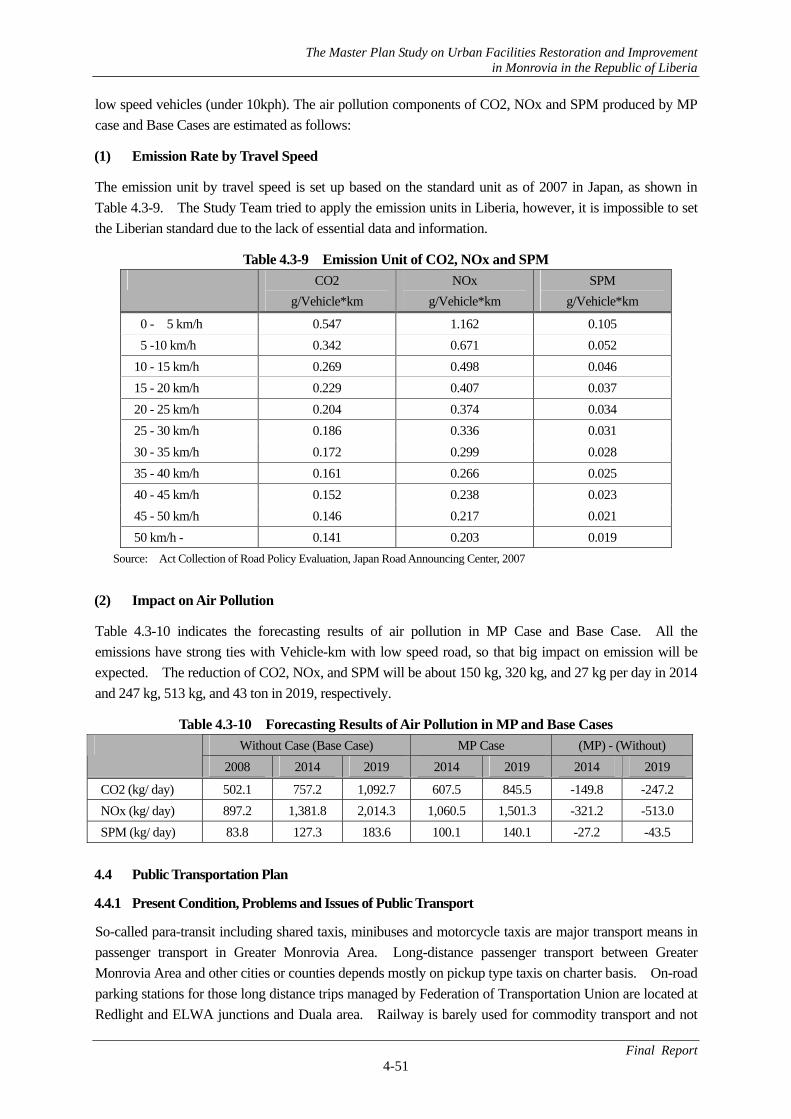
The Master Plan Study on Urban Facilities Restoration and Improvement in Monrovia in the Republic of Liberia
Final Report 4-51
low speed vehicles (under 10kph). The air pollution components of CO2, NOx and SPM produced by MP case and Base Cases are estimated as follows:
(1) Emission Rate by Travel Speed
The emission unit by travel speed is set up based on the standard unit as of 2007 in Japan, as shown in Table 4.3-9. The Study Team tried to apply the emission units in Liberia, however, it is impossible to set the Liberian standard due to the lack of essential data and information.
Table 4.3-9 Emission Unit of CO2, NOx and SPM CO2
g/Vehicle*km NOx
g/Vehicle*km SPM
g/Vehicle*km
0 - 5 km/h 0.547 1.162 0.105 5 -10 km/h 0.342 0.671 0.052 10 - 15 km/h 0.269 0.498 0.046 15 - 20 km/h 0.229 0.407 0.037 20 - 25 km/h 0.204 0.374 0.034 25 - 30 km/h 0.186 0.336 0.031 30 - 35 km/h 0.172 0.299 0.028 35 - 40 km/h 0.161 0.266 0.025 40 - 45 km/h 0.152 0.238 0.023 45 - 50 km/h 0.146 0.217 0.021 50 km/h - 0.141 0.203 0.019
Source: Act Collection of Road Policy Evaluation, Japan Road Announcing Center, 2007
(2) Impact on Air Pollution
Table 4.3-10 indicates the forecasting results of air pollution in MP Case and Base Case. All the emissions have strong ties with Vehicle-km with low speed road, so that big impact on emission will be expected. The reduction of CO2, NOx, and SPM will be about 150 kg, 320 kg, and 27 kg per day in 2014 and 247 kg, 513 kg, and 43 ton in 2019, respectively.
Table 4.3-10 Forecasting Results of Air Pollution in MP and Base Cases Without Case (Base Case) MP Case (MP) - (Without)
2008 2014 2019 2014 2019 2014 2019
CO2 (kg/ day) 502.1 757.2 1,092.7 607.5 845.5 -149.8 -247.2 NOx (kg/ day) 897.2 1,381.8 2,014.3 1,060.5 1,501.3 -321.2 -513.0 SPM (kg/ day) 83.8 127.3 183.6 100.1 140.1 -27.2 -43.5 4.4 Public Transportation Plan
4.4.1 Present Condition, Problems and Issues of Public Transport
So-called para-transit including shared taxis, minibuses and motorcycle taxis are major transport means in passenger transport in Greater Monrovia Area. Long-distance passenger transport between Greater Monrovia Area and other cities or counties depends mostly on pickup type taxis on charter basis. On-road parking stations for those long distance trips managed by Federation of Transportation Union are located at Redlight and ELWA junctions and Duala area. Railway is barely used for commodity transport and not
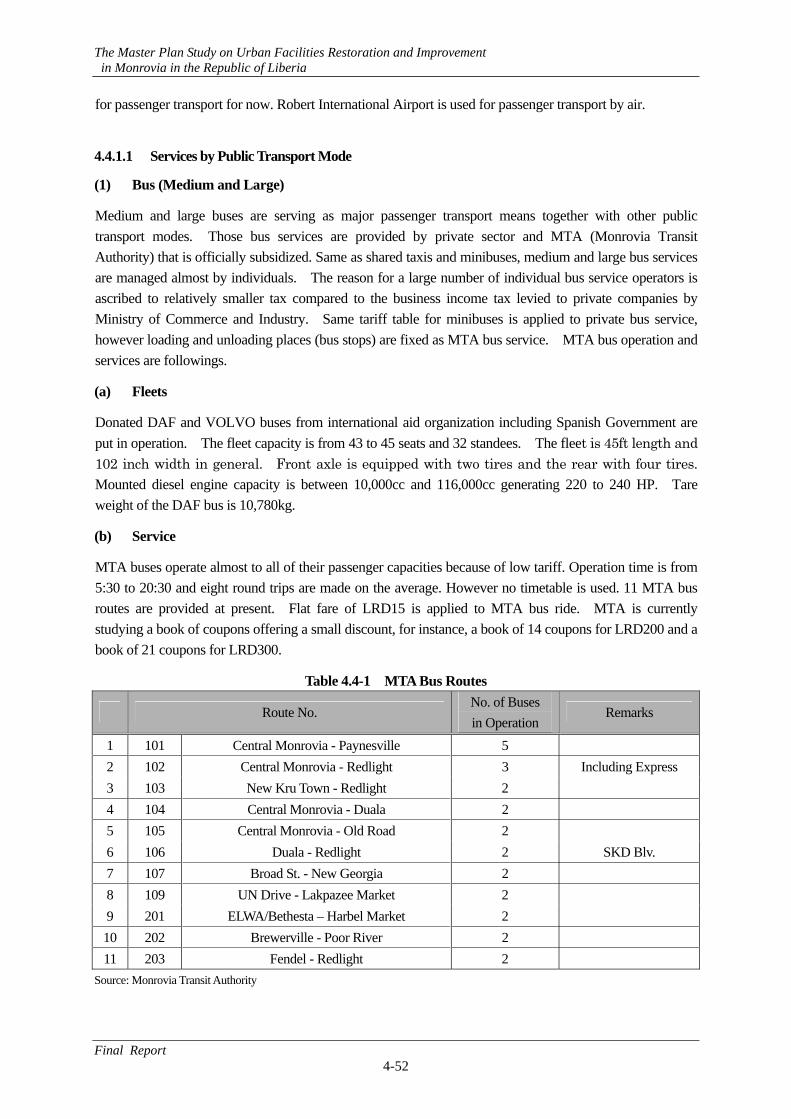
The Master Plan Study on Urban Facilities Restoration and Improvement in Monrovia in the Republic of Liberia
Final Report 4-52
for passenger transport for now. Robert International Airport is used for passenger transport by air.
4.4.1.1 Services by Public Transport Mode
(1) Bus (Medium and Large)
Medium and large buses are serving as major passenger transport means together with other public transport modes. Those bus services are provided by private sector and MTA (Monrovia Transit Authority) that is officially subsidized. Same as shared taxis and minibuses, medium and large bus services are managed almost by individuals. The reason for a large number of individual bus service operators is ascribed to relatively smaller tax compared to the business income tax levied to private companies by Ministry of Commerce and Industry. Same tariff table for minibuses is applied to private bus service, however loading and unloading places (bus stops) are fixed as MTA bus service. MTA bus operation and services are followings.
(a) Fleets
Donated DAF and VOLVO buses from international aid organization including Spanish Government are put in operation. The fleet capacity is from 43 to 45 seats and 32 standees. The fleet is 45ft length and 102 inch width in general. Front axle is equipped with two tires and the rear with four tires. Mounted diesel engine capacity is between 10,000cc and 116,000cc generating 220 to 240 HP. Tare weight of the DAF bus is 10,780kg.
(b) Service
MTA buses operate almost to all of their passenger capacities because of low tariff. Operation time is from 5:30 to 20:30 and eight round trips are made on the average. However no timetable is used. 11 MTA bus routes are provided at present. Flat fare of LRD15 is applied to MTA bus ride. MTA is currently studying a book of coupons offering a small discount, for instance, a book of 14 coupons for LRD200 and a book of 21 coupons for LRD300.
Table 4.4-1 MTA Bus Routes
Route No. No. of Buses in Operation
Remarks
1 101 Central Monrovia - Paynesville 5 2 102 Central Monrovia - Redlight 3 Including Express 3 103 New Kru Town - Redlight 2 4 104 Central Monrovia - Duala 2 5 105 Central Monrovia - Old Road 2 6 106 Duala - Redlight 2 SKD Blv. 7 107 Broad St. - New Georgia 2 8 109 UN Drive - Lakpazee Market 2 9 201 ELWA/Bethesta – Harbel Market 2 10 202 Brewerville - Poor River 2 11 203 Fendel - Redlight 2
Source: Monrovia Transit Authority
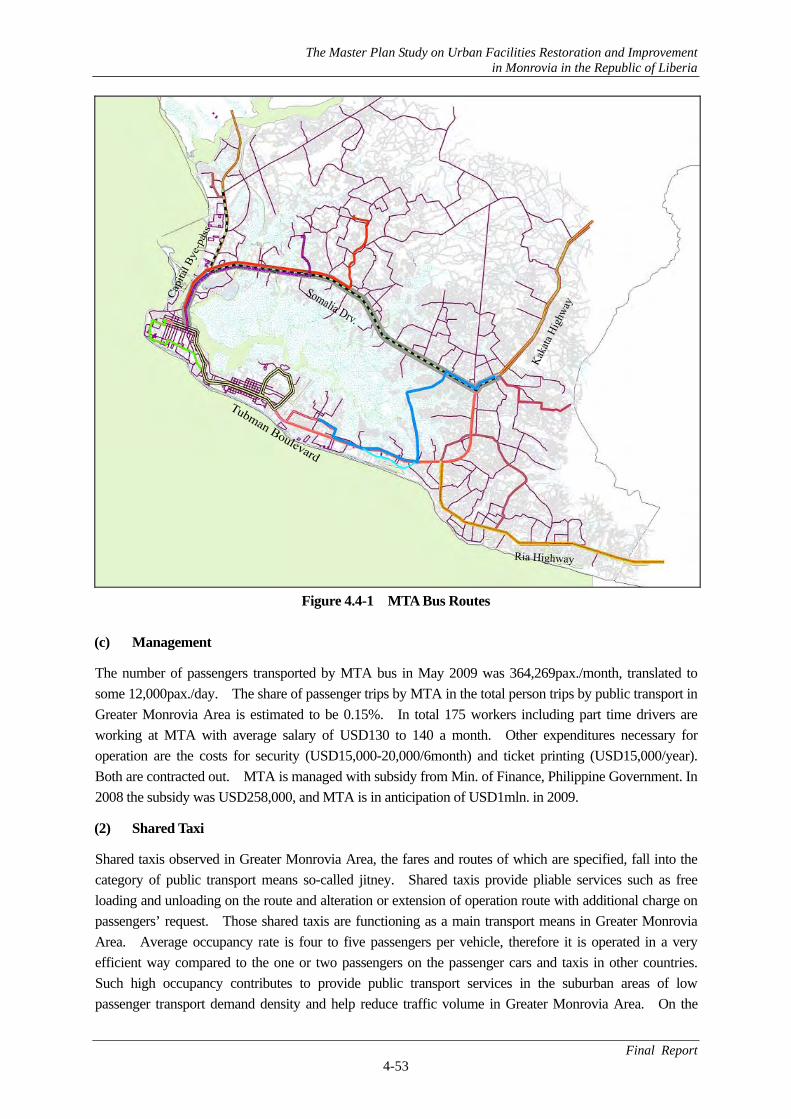
The Master Plan Study on Urban Facilities Restoration and Improvement in Monrovia in the Republic of Liberia
Final Report 4-53
Figure 4.4-1 MTA Bus Routes
(c) Management
The number of passengers transported by MTA bus in May 2009 was 364,269pax./month, translated to some 12,000pax./day. The share of passenger trips by MTA in the total person trips by public transport in Greater Monrovia Area is estimated to be 0.15%. In total 175 workers including part time drivers are working at MTA with average salary of USD130 to 140 a month. Other expenditures necessary for operation are the costs for security (USD15,000-20,000/6month) and ticket printing (USD15,000/year). Both are contracted out. MTA is managed with subsidy from Min. of Finance, Philippine Government. In 2008 the subsidy was USD258,000, and MTA is in anticipation of USD1mln. in 2009.
(2) Shared Taxi
Shared taxis observed in Greater Monrovia Area, the fares and routes of which are specified, fall into the category of public transport means so-called jitney. Shared taxis provide pliable services such as free loading and unloading on the route and alteration or extension of operation route with additional charge on passengers’ request. Those shared taxis are functioning as a main transport means in Greater Monrovia Area. Average occupancy rate is four to five passengers per vehicle, therefore it is operated in a very efficient way compared to the one or two passengers on the passenger cars and taxis in other countries. Such high occupancy contributes to provide public transport services in the suburban areas of low passenger transport demand density and help reduce traffic volume in Greater Monrovia Area. On the

The Master Plan Study on Urban Facilities Restoration and Improvement in Monrovia in the Republic of Liberia
Final Report 4-54
contrary, compared with route bus (medium and large) transport efficiency of shared taxis is low in high passenger transport demand density areas such as central business and commercial areas, causing large traffic volume.
(a) Fleets
Imported secondhand small size TOYOTA or NISSAN sedan cars with engine capacity of some 1,600cc are commonly used. Though the capacity of those vehicles is five, usually it transports five passengers, one on front seat an four on rear seats.
(b) Service
Shared taxi fares fall into the range between LRD10 and LRD45 per passenger. Distance related tariff table prepared by Min. of Transport is applied for shared taxis. The fare is about LRD3 to 3.5 per passenger-km. Each passenger is obliged to bear same fare. Operators are not bound to register shared taxi routes and are able to determine routes at their will. Usually shared taxi waits for passengers at origin and starts after it becomes full. Passengers can freely get in and get off at any point on the route. Moreover it accommodates passenger’s request to alter or extend operation route with additional charge.
Table 4.4-2 Table Major Shared Taxi Routes
Route No. No. of Taxis in Operation
Remarks
1 Central Monrovia - Paynesville >1,000 Individual Owners (No Regulation) 2 Central Monrovia - Redlight >1,500 Including Express 3 New Kru Town - Redlight >1,000 4 Central Monrovia - Duala >1,000 5 Central Monrovia - Old Road >2,000 6 Duala - Redlight >2,000 SKD Blv. 7 Broad St. - New Georgia >700 8 UN Drive - Lakpazee Market >500
Source: JICA Study Team based on MOT hearing
(c) Management
Shared taxi shares 53% of total person trips made in 2009 in Greater Monrovia Region, and some 71% of the total person trips excluding those by walk. Almost all service providers are individuals. Individuals and companies to enter shared taxi business ought to have permission of Min. of Transport and register. The registration is required every year and the registration fee is USD125 a year. Though the permission for business is prerequisite, entry into shared taxi business is almost free and high growth rate of shared taxis are observed recently.
(3) Minibus
In Greater Monrovia Area minibus with some 15 passenger capacity remodeled from coach type vehicle is used as shared taxi stated above on the fixed route.
(a) Fleets
Imported secondhand TOYOTA coach type vehicles are commonly used. The fleet is remodeled into minibus with some 15 passenger capacity. In case of TOYOTA Hi-Ace, diesel engine is used and its capacity is 3,600cc. (b) Service
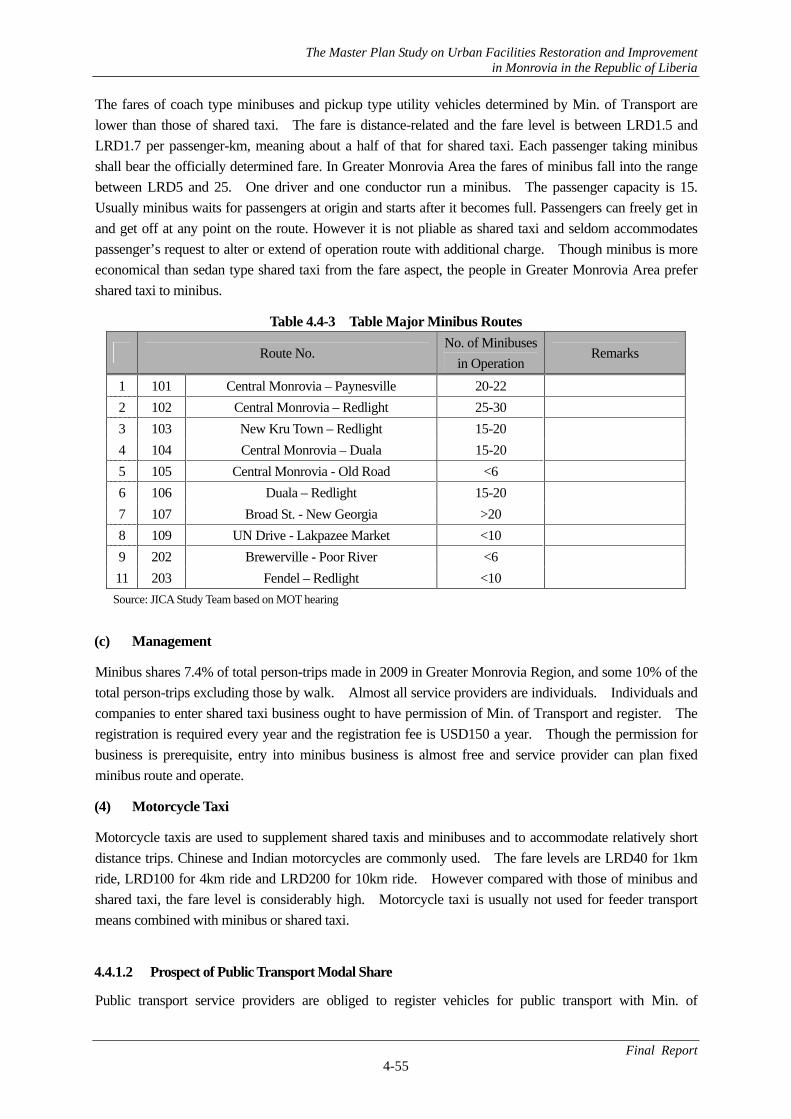
The Master Plan Study on Urban Facilities Restoration and Improvement in Monrovia in the Republic of Liberia
Final Report 4-55
The fares of coach type minibuses and pickup type utility vehicles determined by Min. of Transport are lower than those of shared taxi. The fare is distance-related and the fare level is between LRD1.5 and LRD1.7 per passenger-km, meaning about a half of that for shared taxi. Each passenger taking minibus shall bear the officially determined fare. In Greater Monrovia Area the fares of minibus fall into the range between LRD5 and 25. One driver and one conductor run a minibus. The passenger capacity is 15. Usually minibus waits for passengers at origin and starts after it becomes full. Passengers can freely get in and get off at any point on the route. However it is not pliable as shared taxi and seldom accommodates passenger’s request to alter or extend of operation route with additional charge. Though minibus is more economical than sedan type shared taxi from the fare aspect, the people in Greater Monrovia Area prefer shared taxi to minibus.
Table 4.4-3 Table Major Minibus Routes
Route No. No. of Minibuses
in Operation Remarks
1 101 Central Monrovia – Paynesville 20-22 2 102 Central Monrovia – Redlight 25-30 3 103 New Kru Town – Redlight 15-20 4 104 Central Monrovia – Duala 15-20 5 105 Central Monrovia - Old Road <6 6 106 Duala – Redlight 15-20 7 107 Broad St. - New Georgia >20 8 109 UN Drive - Lakpazee Market <10 9 202 Brewerville - Poor River <6 11 203 Fendel – Redlight <10 Source: JICA Study Team based on MOT hearing
(c) Management
Minibus shares 7.4% of total person-trips made in 2009 in Greater Monrovia Region, and some 10% of the total person-trips excluding those by walk. Almost all service providers are individuals. Individuals and companies to enter shared taxi business ought to have permission of Min. of Transport and register. The registration is required every year and the registration fee is USD150 a year. Though the permission for business is prerequisite, entry into minibus business is almost free and service provider can plan fixed minibus route and operate.
(4) Motorcycle Taxi
Motorcycle taxis are used to supplement shared taxis and minibuses and to accommodate relatively short distance trips. Chinese and Indian motorcycles are commonly used. The fare levels are LRD40 for 1km ride, LRD100 for 4km ride and LRD200 for 10km ride. However compared with those of minibus and shared taxi, the fare level is considerably high. Motorcycle taxi is usually not used for feeder transport means combined with minibus or shared taxi.
4.4.1.2 Prospect of Public Transport Modal Share
Public transport service providers are obliged to register vehicles for public transport with Min. of
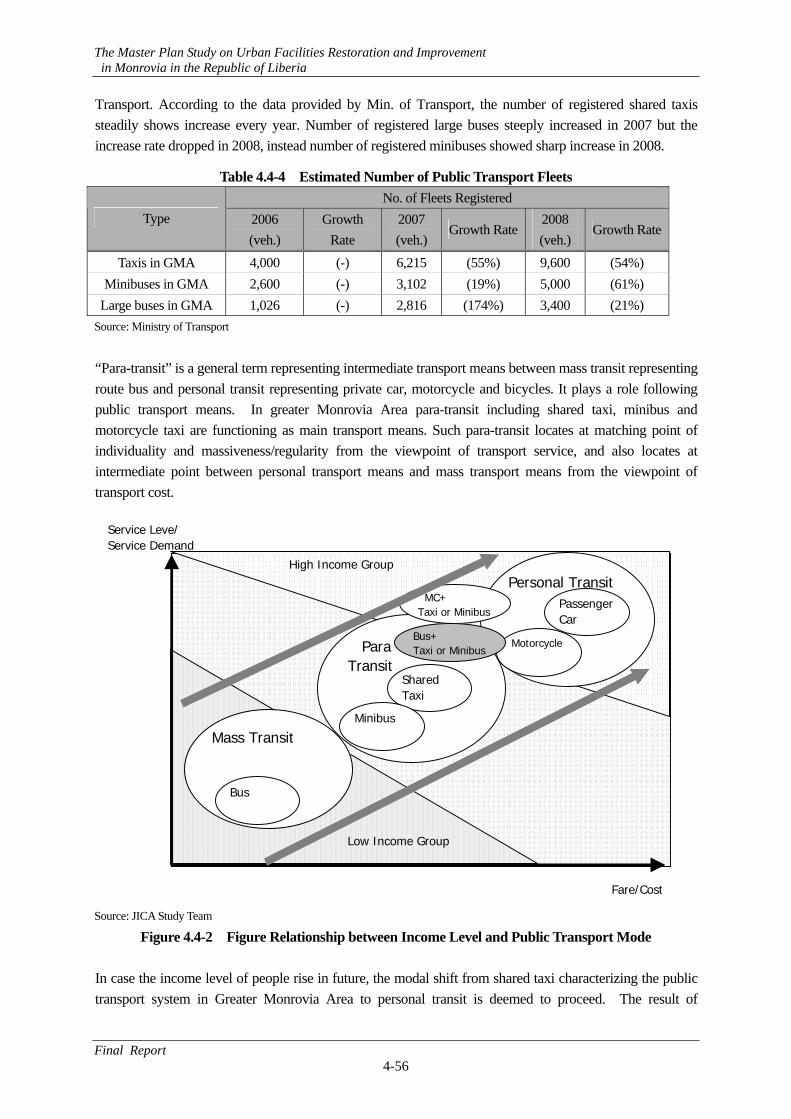
The Master Plan Study on Urban Facilities Restoration and Improvement in Monrovia in the Republic of Liberia
Final Report 4-56
Transport. According to the data provided by Min. of Transport, the number of registered shared taxis steadily shows increase every year. Number of registered large buses steeply increased in 2007 but the increase rate dropped in 2008, instead number of registered minibuses showed sharp increase in 2008.
Table 4.4-4 Estimated Number of Public Transport Fleets No. of Fleets Registered
Type 2006 (veh.)
Growth Rate
2007 (veh.)
Growth Rate2008 (veh.)
Growth Rate
Taxis in GMA 4,000 (-) 6,215 (55%) 9,600 (54%) Minibuses in GMA 2,600 (-) 3,102 (19%) 5,000 (61%)
Large buses in GMA 1,026 (-) 2,816 (174%) 3,400 (21%) Source: Ministry of Transport
“Para-transit” is a general term representing intermediate transport means between mass transit representing route bus and personal transit representing private car, motorcycle and bicycles. It plays a role following public transport means. In greater Monrovia Area para-transit including shared taxi, minibus and motorcycle taxi are functioning as main transport means. Such para-transit locates at matching point of individuality and massiveness/regularity from the viewpoint of transport service, and also locates at intermediate point between personal transport means and mass transport means from the viewpoint of transport cost.
Service Leve/Service Demand
Fare/Cost
Personal Transit
Mass Transit
Bus
ParaTransit
Motorcycle
PassengerCar
SharedTaxi
Minibus
MC+Taxi or Minibus
Bus+Taxi or Minibus
Low Income Group
High Income Group
Source: JICA Study Team
Figure 4.4-2 Figure Relationship between Income Level and Public Transport Mode In case the income level of people rise in future, the modal shift from shared taxi characterizing the public transport system in Greater Monrovia Area to personal transit is deemed to proceed. The result of
The Master Plan Study on Urban Facilities Restoration and Improvement in Monrovia in the Republic of Liberia
Final Report 4-57
interview with residents that they prefer shared taxi to minibus endorses such conjecture. Flat fare at LRD15 is applied to MTA buses. Detailed tariff table for taxi (TX), bus/pickup (TB)/(TP) is provided by Min. of Transport in and around Monrovia.
0.0
10.0
20.0
30.0
40.0
50.0
60.0
70.0
80.0
1 2 3 4 5 6 7 8 9 102
70
60
50
40
30
20
10
0
LRD
Taxi Mini bus
MTA
4 6 8 10 12 14 16 18 20km
Source: JICA Study Team based on MOT Data
Figure 4.4-3 Relationship between Distance and Fare by Public Transport Mode As distance-related fare is applied to shared taxi, fare of shared taxi service after 4 or 5 km ride becomes higher than the one of MTA bus service. Comparing public transport operation costs per passenger capacity, MTA bus operation cost is the lowest, then those of minibus, shared taxi, and motorcycle follow in this order.
Table 4.4-5 Table Public Transport Operation Cost per Passenger Capacity (Unit; USD)
Motorcycle Taxi Shared Taxi (PC)Shared Taxi (minibus)
MTA Bus
Vehicle Operating Cost/100veh.km/head)
13.811 3.302 1.235 0.734
Source: JICA Study Team
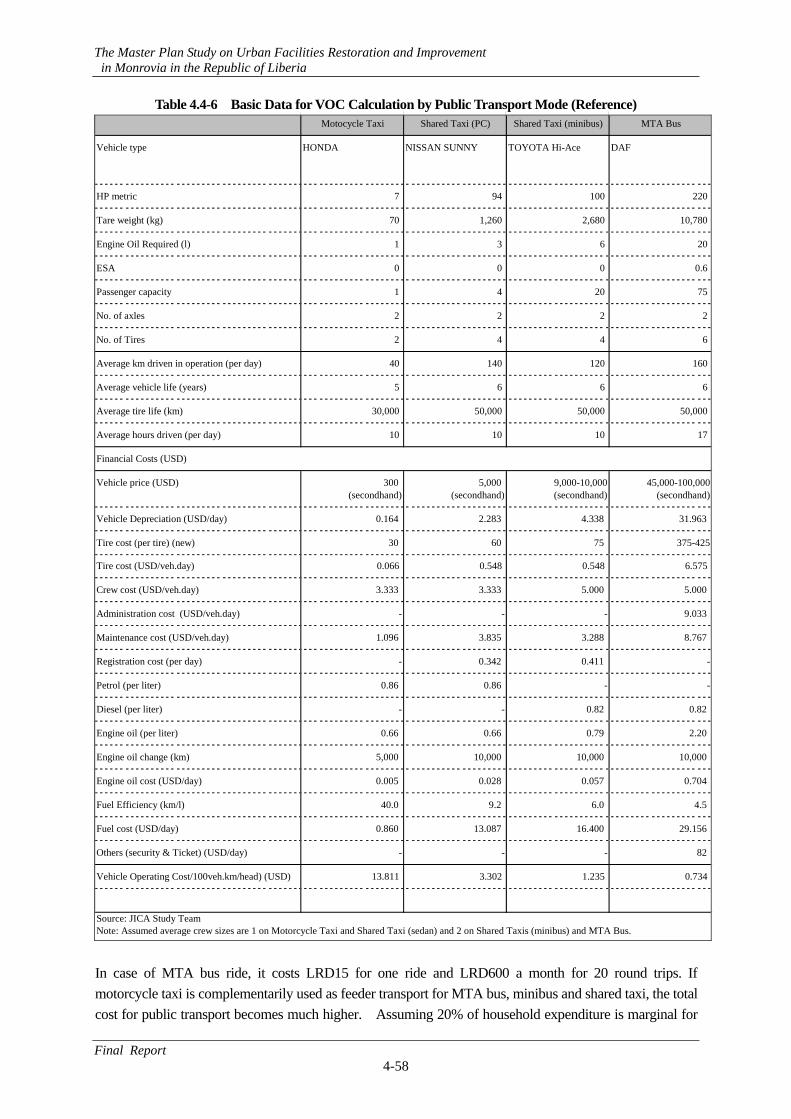
The Master Plan Study on Urban Facilities Restoration and Improvement in Monrovia in the Republic of Liberia
Final Report 4-58
Table 4.4-6 Basic Data for VOC Calculation by Public Transport Mode (Reference) Motocycle Taxi Shared Taxi (PC) Shared Taxi (minibus) MTA Bus
Vehicle type HONDA NISSAN SUNNY TOYOTA Hi-Ace DAF
HP metric 7 94 100 220
Tare weight (kg) 70 1,260 2,680 10,780
Engine Oil Required (l) 1 3 6 20
ESA 0 0 0 0.6
Passenger capacity 1 4 20 75
No. of axles 2 2 2 2
No. of Tires 2 4 4 6
Average km driven in operation (per day) 40 140 120 160
Average vehicle life (years) 5 6 6 6
Average tire life (km) 30,000 50,000 50,000 50,000
Average hours driven (per day) 10 10 10 17
Financial Costs (USD)
Vehicle price (USD) 300 5,000 9,000-10,000 45,000-100,000(secondhand) (secondhand) (secondhand) (secondhand)
Vehicle Depreciation (USD/day) 0.164 2.283 4.338 31.963
Tire cost (per tire) (new) 30 60 75 375-425
Tire cost (USD/veh.day) 0.066 0.548 0.548 6.575
Crew cost (USD/veh.day) 3.333 3.333 5.000 5.000
Administration cost (USD/veh.day) - - - 9.033
Maintenance cost (USD/veh.day) 1.096 3.835 3.288 8.767
Registration cost (per day) - 0.342 0.411 -
Petrol (per liter) 0.86 0.86 - -
Diesel (per liter) - - 0.82 0.82
Engine oil (per liter) 0.66 0.66 0.79 2.20
Engine oil change (km) 5,000 10,000 10,000 10,000
Engine oil cost (USD/day) 0.005 0.028 0.057 0.704
Fuel Efficiency (km/l) 40.0 9.2 6.0 4.5
Fuel cost (USD/day) 0.860 13.087 16.400 29.156
Others (security & Ticket) (USD/day) - - - 82
Vehicle Operating Cost/100veh.km/head) (USD) 13.811 3.302 1.235 0.734
Source: JICA Study TeamNote: Assumed average crew sizes are 1 on Motorcycle Taxi and Shared Taxi (sedan) and 2 on Shared Taxis (minibus) and MTA Bus. In case of MTA bus ride, it costs LRD15 for one ride and LRD600 a month for 20 round trips. If motorcycle taxi is complementarily used as feeder transport for MTA bus, minibus and shared taxi, the total cost for public transport becomes much higher. Assuming 20% of household expenditure is marginal for
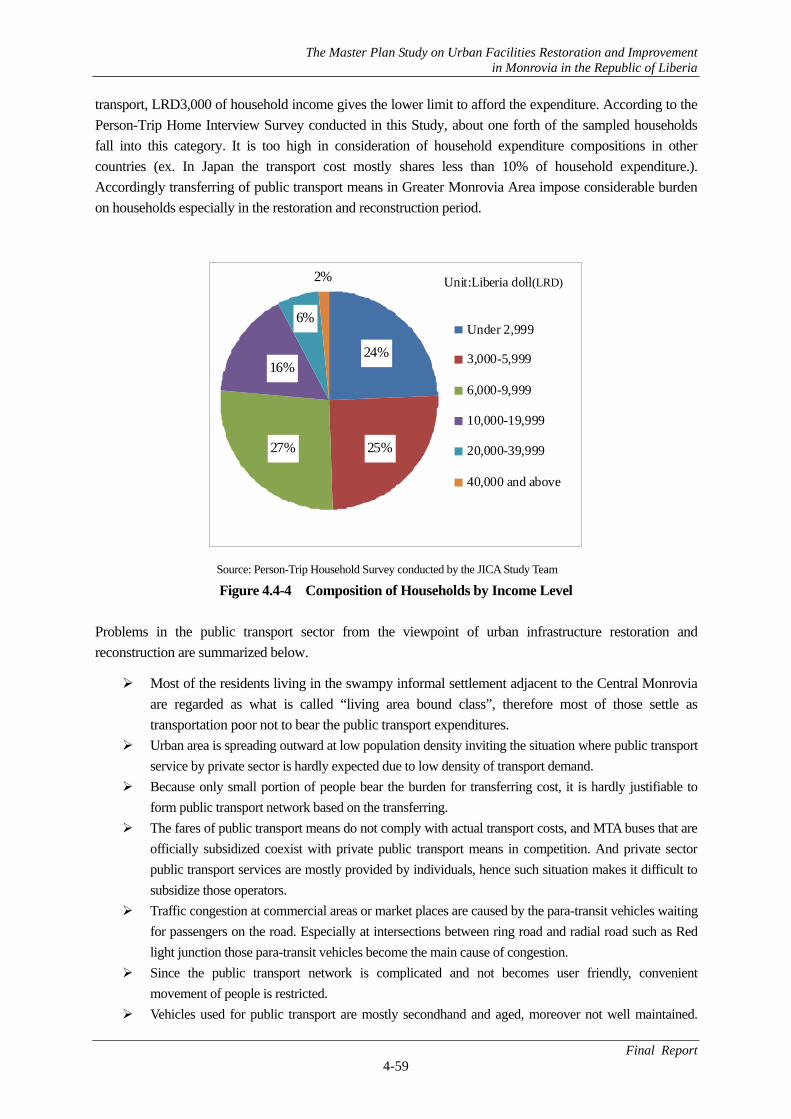
The Master Plan Study on Urban Facilities Restoration and Improvement in Monrovia in the Republic of Liberia
Final Report 4-59
transport, LRD3,000 of household income gives the lower limit to afford the expenditure. According to the Person-Trip Home Interview Survey conducted in this Study, about one forth of the sampled households fall into this category. It is too high in consideration of household expenditure compositions in other countries (ex. In Japan the transport cost mostly shares less than 10% of household expenditure.). Accordingly transferring of public transport means in Greater Monrovia Area impose considerable burden on households especially in the restoration and reconstruction period.
Unit:Liberia doll(L$)2%
24%
25%27%
16%
6%Under 2,999
3,000-5,999
6,000-9,999
10,000-19,999
20,000-39,999
40,000 and above
Source: Person-Trip Household Survey conducted by the JICA Study Team
Figure 4.4-4 Composition of Households by Income Level Problems in the public transport sector from the viewpoint of urban infrastructure restoration and reconstruction are summarized below.
Most of the residents living in the swampy informal settlement adjacent to the Central Monrovia are regarded as what is called “living area bound class”, therefore most of those settle as transportation poor not to bear the public transport expenditures.
Urban area is spreading outward at low population density inviting the situation where public transport service by private sector is hardly expected due to low density of transport demand.
Because only small portion of people bear the burden for transferring cost, it is hardly justifiable to form public transport network based on the transferring.
The fares of public transport means do not comply with actual transport costs, and MTA buses that are officially subsidized coexist with private public transport means in competition. And private sector public transport services are mostly provided by individuals, hence such situation makes it difficult to subsidize those operators.
Traffic congestion at commercial areas or market places are caused by the para-transit vehicles waiting for passengers on the road. Especially at intersections between ring road and radial road such as Red light junction those para-transit vehicles become the main cause of congestion.
Since the public transport network is complicated and not becomes user friendly, convenient movement of people is restricted.
Vehicles used for public transport are mostly secondhand and aged, moreover not well maintained.
(LRD)
The Master Plan Study on Urban Facilities Restoration and Improvement in Monrovia in the Republic of Liberia
Final Report 4-60
Accordingly such public transport vehicles emerge NOx and COx emission on a massive scale and noise leading to the environmental degradation
4.4.2 Public Transport Policy
4.4.2.1 Policy and Strategy by Upper Plan
The Government’s policy directions of land transportation is to improve the supply of largely private sector-led transportation services, without compromising customer accessibility, safety and comfort. Public transport policies in Liberia are summarized below.
(1) “Poverty Reduction Strategy”, Apr. 2008, Republic of Liberia
In the “Poverty Reduction Strategy”, Apr. 2008, Republic of Liberia, the goals in the transport sector are shown in the abstract expression. Goal: ‘To improve the Liberian transport sector through policy, systems and infrastructure development that create access to reliable, affordable and efficient services’
Strategic objective in the transport sector of Greater Monrovia Area is shown in following sentence.
Strategic objective 2: To improve urban transit in Monrovia and its environs
Restoration of buses, purchasing buses, and arrangement of three bus stations (ELWA, Fendel and Brewersville) are included in the PRS.
Note: Above three bus stations are coincident with MTA (Monrovia Transit Authority) ‘s concept.
(2) “National Transport Policy and Strategy & Investment Plan”, Aug. 2008, MPW
Following directions are shown in consideration of appropriateness of transport means, passenger safety and comfort.
Increase private sector participation in the provision of transport and alternative transport services;
Develop and operate modes of transport on the basis of economic savings on fuel use, operational efficiency including reducing traffic congestion, environmental protection and safety;
Segregate public transport and in particular bus transport should be confined to the selected routes to speed up traffic flow;
Have in place strong operator union(s) and forums for efficient and effective transport services; Streamline regulatory functions; Encourage use of non-motorized transport and possibly mass passenger transport as alternative to
ever growing traffic demand; Establish trucks/bus terminals near the main cities.
(3) “An Act to Authorize the Establishment of the National Transit Authority”, Mar. 2009
An Act to establish the National Transit Authority (NTA) approved in Mar. 2009 is prepared to realize a reliable and safe movement of people and goods within and without the country at affordable cost, subject to regulations of the Ministry of Transport through establishment of NTA.
The Master Plan Study on Urban Facilities Restoration and Improvement in Monrovia in the Republic of Liberia
Final Report 4-61
4.4.2.2 Public Transportation Policy for this Study
Based on the above governmental transport policies following public transport policies for Greater Monrovia Area are proposed.
(1) Direction of Public Transport Modal Shift
(a) Esteem of Para-Transit
Though bus is advantageous with respect not only to fare/cost but also to socio-environment, it can only provide limited services for individual transport demands. Para-transit, currently regarded as major public transport mode, is advantageous with respect to passenger convenience, fare/cost, and socio-environment to some extent. Therefore, it should remain as a main protagonist in future in the public transport sector by applying countermeasures to reduce demerits such as improvement of transferring, bay construction to remove para-transit vehicles’ parking on road, and arrangement of public transport terminals.
(b) Promotion of Shift to Mass Transit in the High Transport Demand Density Areas
However, as bus has advantages in fare/cost and socio-environment, conversion from para-transit to bus as a mass transit shall be promoted in the areas with high transport demand density. Especially it shall positively accommodate the transport demand in the line hall reach within the urban area.
(c) Improvement of Interrelation between Mass Transit (bus) and Para-Transit
Although better public transport service is expected, the combination of mass transit/para-transit with para-transit as a feeder transport is not realistic for now, due to the increase in fares for two rides or more. However interrelation between mass transit (bus) and para-transit shall be improved through rerouting of present public transport routes to restrain vehicle traffic volume increase in urban area and improve public transport passenger convenience. To this end subsidization to public transport to compete with personal transit regarding cost shall be reconsidered by deliberate measures, for instance, imposing burden on personal transit passengers and allocating those to the socio-environmental cost.
Present motorcycle taxis is not likely to be a major feeder public transport mode in the long horizon due to its safety problem and high operating cost. Instead it should be adequately conceived that NMT would bear the role of motorcycle taxi.
(2) Direction of Governmental Subsidization
(a) Improvement of Public Transport Service Efficiency through Competition in the Market
Improvement of efficiency in public transport system though public transport market shall be pursued in principle, in other word, optimum allocation of resources shall be pursued.
(b) Governmental Subsidization
Governmental subsidization shall positively apply as a measure for transportation poor and civil minimum measures to provide public transport services in the areas where transport demand density is too small for private sector to make profits. Subsidy to public transport operators and household, and tax exemption or reduction are the recommendable examples of concrete such measures. Direct subsidization to household is said to be effective for transport poor. Spontaneous market formation near the residential areas is considerably attributed to the transport cost of each household.
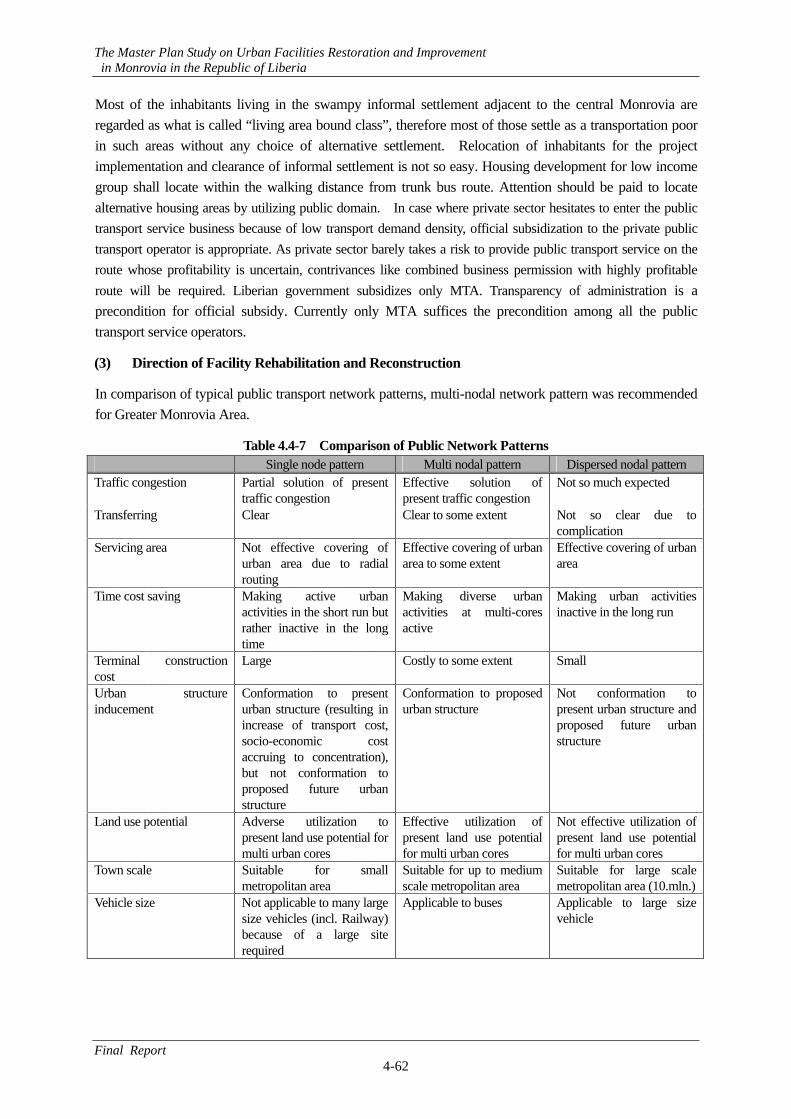
The Master Plan Study on Urban Facilities Restoration and Improvement in Monrovia in the Republic of Liberia
Final Report 4-62
Most of the inhabitants living in the swampy informal settlement adjacent to the central Monrovia are regarded as what is called “living area bound class”, therefore most of those settle as a transportation poor in such areas without any choice of alternative settlement. Relocation of inhabitants for the project implementation and clearance of informal settlement is not so easy. Housing development for low income group shall locate within the walking distance from trunk bus route. Attention should be paid to locate alternative housing areas by utilizing public domain. In case where private sector hesitates to enter the public transport service business because of low transport demand density, official subsidization to the private public transport operator is appropriate. As private sector barely takes a risk to provide public transport service on the route whose profitability is uncertain, contrivances like combined business permission with highly profitable route will be required. Liberian government subsidizes only MTA. Transparency of administration is a precondition for official subsidy. Currently only MTA suffices the precondition among all the public transport service operators.
(3) Direction of Facility Rehabilitation and Reconstruction
In comparison of typical public transport network patterns, multi-nodal network pattern was recommended for Greater Monrovia Area.
Table 4.4-7 Comparison of Public Network Patterns Single node pattern Multi nodal pattern Dispersed nodal pattern
Traffic congestion Partial solution of present traffic congestion
Effective solution of present traffic congestion
Not so much expected
Transferring Clear Clear to some extent Not so clear due to complication
Servicing area Not effective covering of urban area due to radial routing
Effective covering of urban area to some extent
Effective covering of urban area
Time cost saving
Making active urban activities in the short run but rather inactive in the long time
Making diverse urban activities at multi-cores active
Making urban activities inactive in the long run
Terminal construction cost
Large Costly to some extent Small
Urban structure inducement
Conformation to present urban structure (resulting in increase of transport cost, socio-economic cost accruing to concentration), but not conformation to proposed future urban structure
Conformation to proposed urban structure
Not conformation to present urban structure and proposed future urban structure
Land use potential
Adverse utilization to present land use potential for multi urban cores
Effective utilization of present land use potential for multi urban cores
Not effective utilization of present land use potential for multi urban cores
Town scale Suitable for small metropolitan area
Suitable for up to medium scale metropolitan area
Suitable for large scale metropolitan area (10.mln.)
Vehicle size Not applicable to many large size vehicles (incl. Railway) because of a large site required
Applicable to buses Applicable to large size vehicle
The Master Plan Study on Urban Facilities Restoration and Improvement in Monrovia in the Republic of Liberia
Final Report 4-63
(a) Intensification of Interrelated Network by Terminal
Para-transit vehicle is not free from waiting for passengers from business aspect. Such para-transit vehicles parking on road waiting for passengers are the main cause of the traffic congestion. Therefore para-transit vehicles waiting for passengers on road shall be relocated from the carriageway of the road. Intensification of interrelated network and traffic fluidity are expected by arrangement of public transport terminal function at the nodal points of ring road comprising Somalia Drive and Tubman Boulevard and radial trunk roads, UN Drive, RIA Highway and Ganta Highway. Attention shall be paid to followings.
- Terminal arrangement shall accommodate to the present para-transit pattern that meet residents’ transport demand and operators’ cost for operation.
- Terminals shall have the function to mitigate present traffic congestions at junctions of Redlight, ELWA, and Freeport/Somalia Drive.
- In consideration of the residents’ solvency, arrangement of terminal shall avoid as much as possible the increase of transfer.
- In the Central Monrovia area terminal shall be linear type along streets since it is difficult to secure the large tract of land. The linear type terminal shall be composed of dispersed bays by direction to give the parking/stoppage spaces for para-transit vehicles and buses.
This measure is expected to have a great positive effect to mitigate present heavy traffic congestion at Redlight and Somalia Drive junction with Freeport Road.
(b) Promotion of Shifting to Circular Route Pattern
Public transport routes shall shift from a shuttle pattern to a circular pattern for the purposes of expansion of service area and avoidance of concentration of routes on the specific reach of the roads. Along with the shift of operation pattern, public utility vehicles shall wait for passengers at terminal in principle to eliminate public utility vehicles waiting for passengers on road.
(c) Conformation of Public Transport Service Area to Urbanization Promotion Area
Urbanization Promotion Area was proposed in the former section on future urban structure. Public transport service area shall be provided within UPA based on the future urban structure.
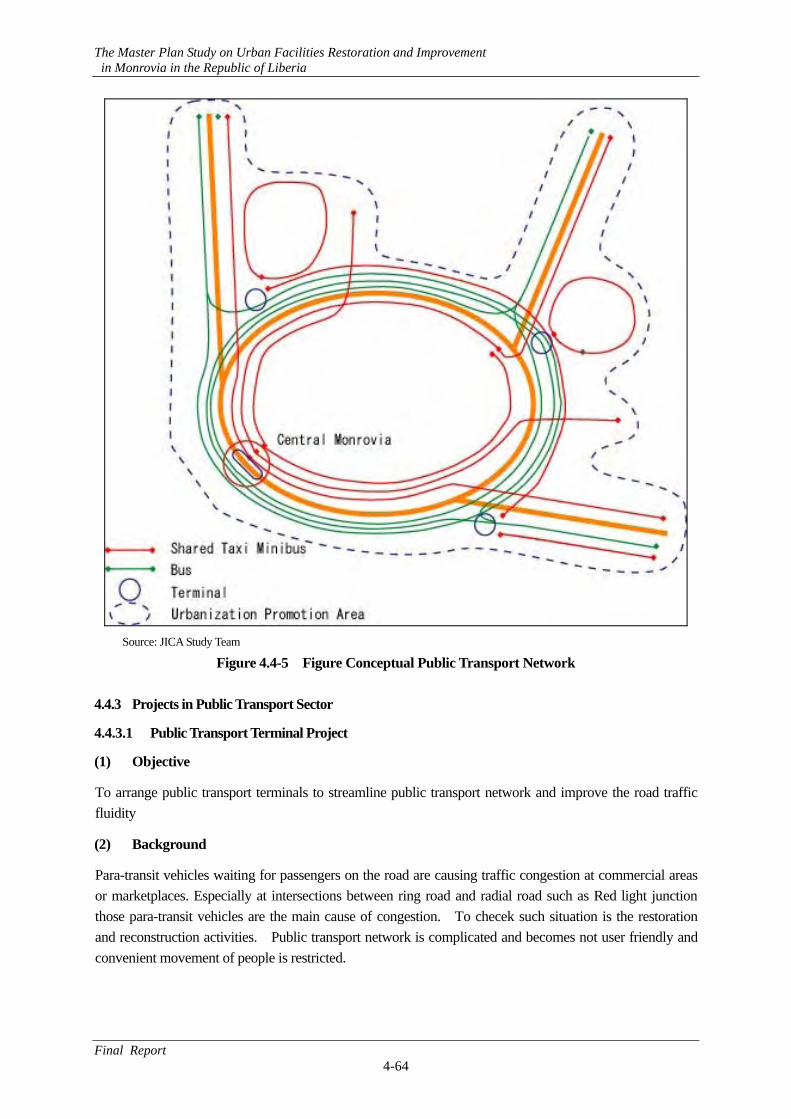
The Master Plan Study on Urban Facilities Restoration and Improvement in Monrovia in the Republic of Liberia
Final Report 4-64
Source: JICA Study Team
Figure 4.4-5 Figure Conceptual Public Transport Network 4.4.3 Projects in Public Transport Sector
4.4.3.1 Public Transport Terminal Project
(1) Objective
To arrange public transport terminals to streamline public transport network and improve the road traffic fluidity
(2) Background
Para-transit vehicles waiting for passengers on the road are causing traffic congestion at commercial areas or marketplaces. Especially at intersections between ring road and radial road such as Red light junction those para-transit vehicles are the main cause of congestion. To checek such situation is the restoration and reconstruction activities. Public transport network is complicated and becomes not user friendly and convenient movement of people is restricted.
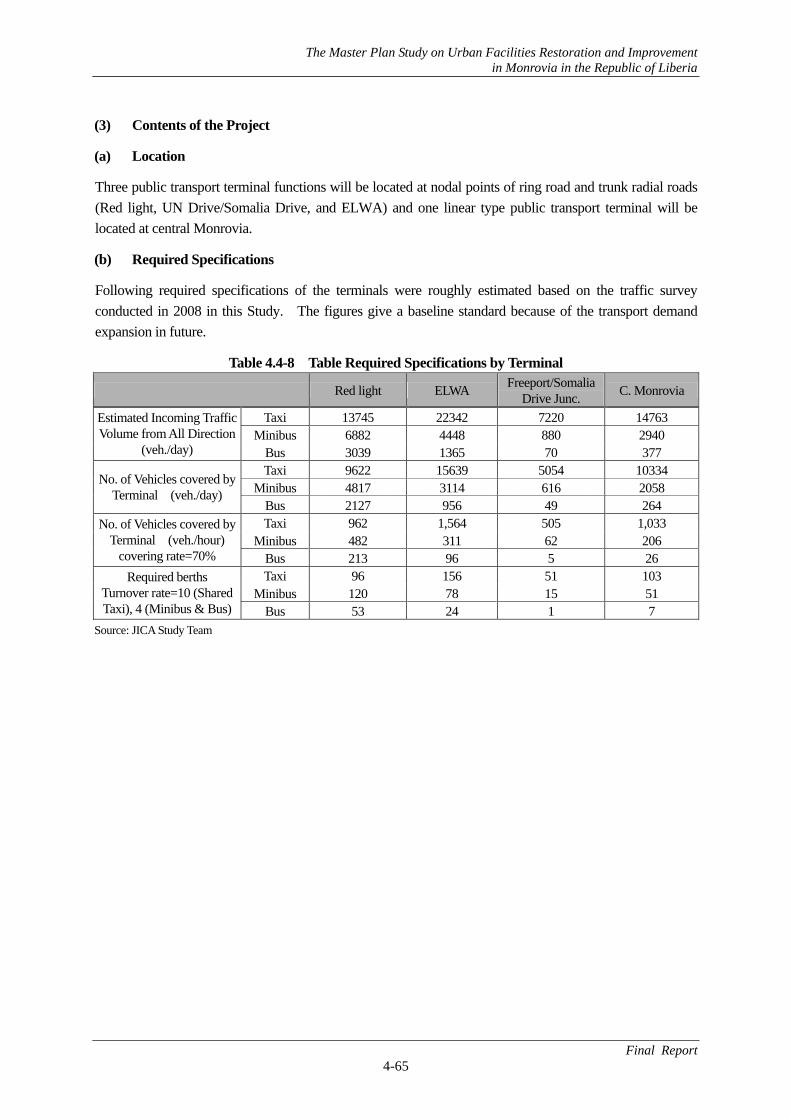
The Master Plan Study on Urban Facilities Restoration and Improvement in Monrovia in the Republic of Liberia
Final Report 4-65
(3) Contents of the Project
(a) Location
Three public transport terminal functions will be located at nodal points of ring road and trunk radial roads (Red light, UN Drive/Somalia Drive, and ELWA) and one linear type public transport terminal will be located at central Monrovia.
(b) Required Specifications
Following required specifications of the terminals were roughly estimated based on the traffic survey conducted in 2008 in this Study. The figures give a baseline standard because of the transport demand expansion in future.
Table 4.4-8 Table Required Specifications by Terminal
Red light ELWA Freeport/Somalia Drive Junc. C. Monrovia
Taxi 13745 22342 7220 14763 Minibus 6882 4448 880 2940
Estimated Incoming Traffic Volume from All Direction
(veh./day) Bus 3039 1365 70 377 Taxi 9622 15639 5054 10334
Minibus 4817 3114 616 2058 No. of Vehicles covered by
Terminal (veh./day) Bus 2127 956 49 264 Taxi 962 1,564 505 1,033
Minibus 482 311 62 206 No. of Vehicles covered by
Terminal (veh./hour) covering rate=70% Bus 213 96 5 26
Taxi 96 156 51 103 Minibus 120 78 15 51
Required berths Turnover rate=10 (Shared Taxi), 4 (Minibus & Bus) Bus 53 24 1 7
Source: JICA Study Team

The Master Plan Study on Urban Facilities Restoration and Improvement in Monrovia in the Republic of Liberia
Final Report 4-66
Figure 4.4-6 Typical Design of Transit Terminal 4.4.3.2 Para-Transit Bay Construction Project
(1) Objective
To construct para-transit bays in the reaches of the trunk roads where traffic congestion often occurs
(2) Background
Para-transit vehicles waiting for passengers on the road are causing traffic congestion at commercial areas, though parking of para-transit waiting for passengers until it becomes full is inevitable from its business aspect. To check such situation is the restoration and reconstruction activities. Therefore para-transit vehicles waiting for passengers on the road shall be relocated from the carriageway of the road for smooth traffic flow.
(3) Contents of the Project
Considering the existing and future scheduled bus network, the future bus stops have been planned
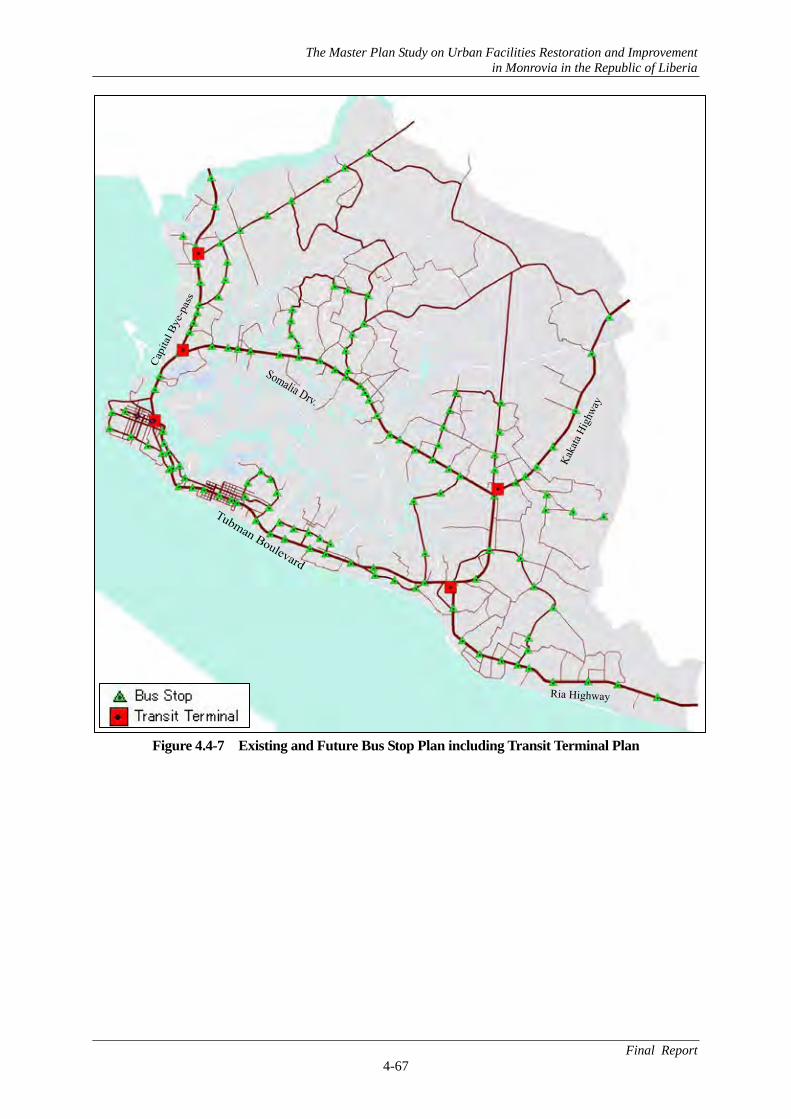
The Master Plan Study on Urban Facilities Restoration and Improvement in Monrovia in the Republic of Liberia
Final Report 4-67
Figure 4.4-7 Existing and Future Bus Stop Plan including Transit Terminal Plan
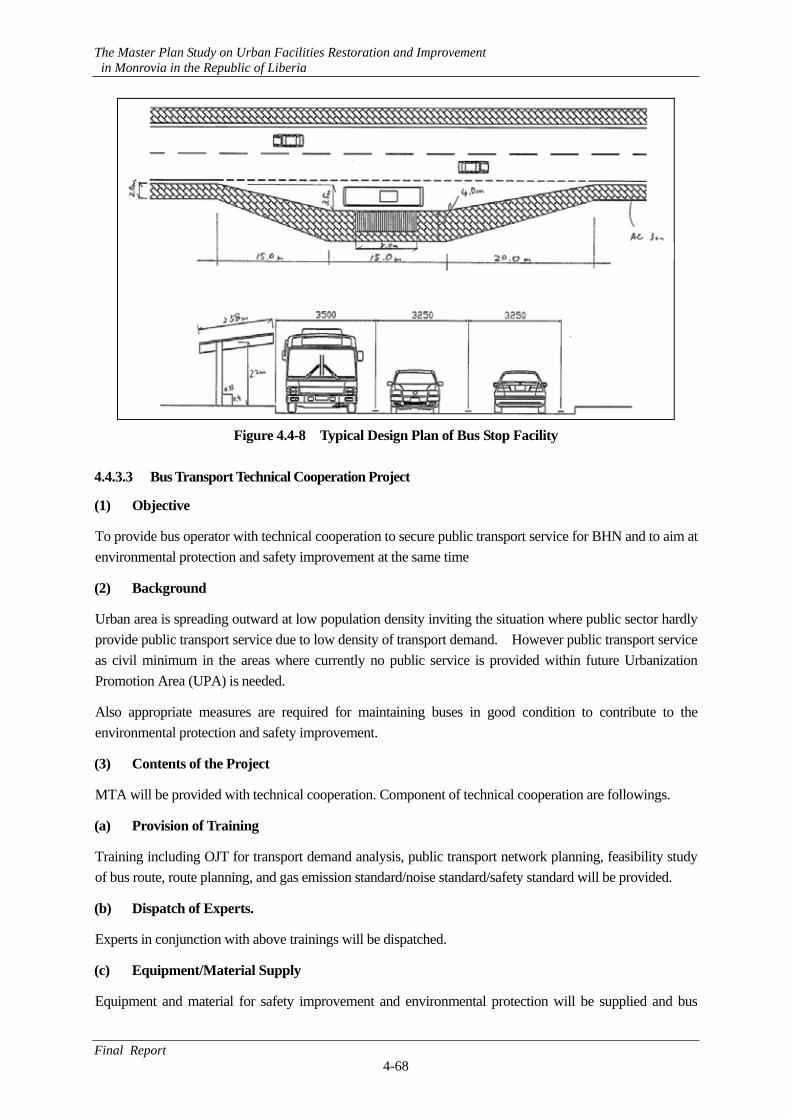
The Master Plan Study on Urban Facilities Restoration and Improvement in Monrovia in the Republic of Liberia
Final Report 4-68
Figure 4.4-8 Typical Design Plan of Bus Stop Facility
4.4.3.3 Bus Transport Technical Cooperation Project
(1) Objective
To provide bus operator with technical cooperation to secure public transport service for BHN and to aim at environmental protection and safety improvement at the same time
(2) Background
Urban area is spreading outward at low population density inviting the situation where public sector hardly provide public transport service due to low density of transport demand. However public transport service as civil minimum in the areas where currently no public service is provided within future Urbanization Promotion Area (UPA) is needed.
Also appropriate measures are required for maintaining buses in good condition to contribute to the environmental protection and safety improvement.
(3) Contents of the Project
MTA will be provided with technical cooperation. Component of technical cooperation are followings.
(a) Provision of Training
Training including OJT for transport demand analysis, public transport network planning, feasibility study of bus route, route planning, and gas emission standard/noise standard/safety standard will be provided.
(b) Dispatch of Experts.
Experts in conjunction with above trainings will be dispatched.
(c) Equipment/Material Supply
Equipment and material for safety improvement and environmental protection will be supplied and bus
The Master Plan Study on Urban Facilities Restoration and Improvement in Monrovia in the Republic of Liberia
Final Report 4-69
acquisition by MTA will be assisted. Since the latter has civil minimum characteristics and lacks profitability, therefore close coordination with MOT for official subsidization and permission of operation routes combined with profitable routes shall be performed.
4.5 Traffic Management System Plan
4.5.1 Objectives of Traffic Management System Plan
4.5.1.1 Planning Concept
One of the advantages of traffic management is to implement various countermeasures in the short /medium term and at low cost in order to alleviate the various transportation problems. The necessity for traffic management can be summarized as follows.
Existing traffic facilities in the study area are not used effectively. If the traffic management and operation was improved, these would contribute to the effective use of existing facilities and the traffic capacity would increase substantially.
Traffic management in the study area such as road facilities, traffic operation, and traffic safety plan, is still in the developing stage. Modernization of traffic management and operation is necessary so that the city will become an international city in near future.
An aim of traffic management is to assure safe, comfortable and speedy traffic movement. Among these aims, traffic safety is the fundamental requirement of the Monrovia citizens.
4.5.1.2 Objective of Traffic Management Plan
Objectives of the traffic management plan are to prepare comprehensive measures to achieve a safe, smooth and comfortable traffic environment for road users. The measures should be prepared based on a careful study of the traffic problems which are currently occurring, and are expected to occur, in the future in order to cope with these problems.
4.5.2 Basic Direction of Traffic Management Measures
Traffic problems have been becoming more pronounced year after year. Implementation of remedial measures is an urgent task. In particular, implementation of balanced 3-E measures (Traffic Engineering, Education and Enforcement) is a key factor. The 3-E concept applied to the Study Area is summarized below.
4.5.2.1 Measures of Traffic Engineering
(1) Improvement of Intersection and Road Section
It is important to increase traffic capacity by improving intersections since the most serious factors to disrupt main traffic flow are the small traffic capacities of intersections. In addition, improving traffic facilities and the traffic operation system of roads are necessary so that the obstructions to traffic flow are eliminated and smooth traffic flow can be achieved.
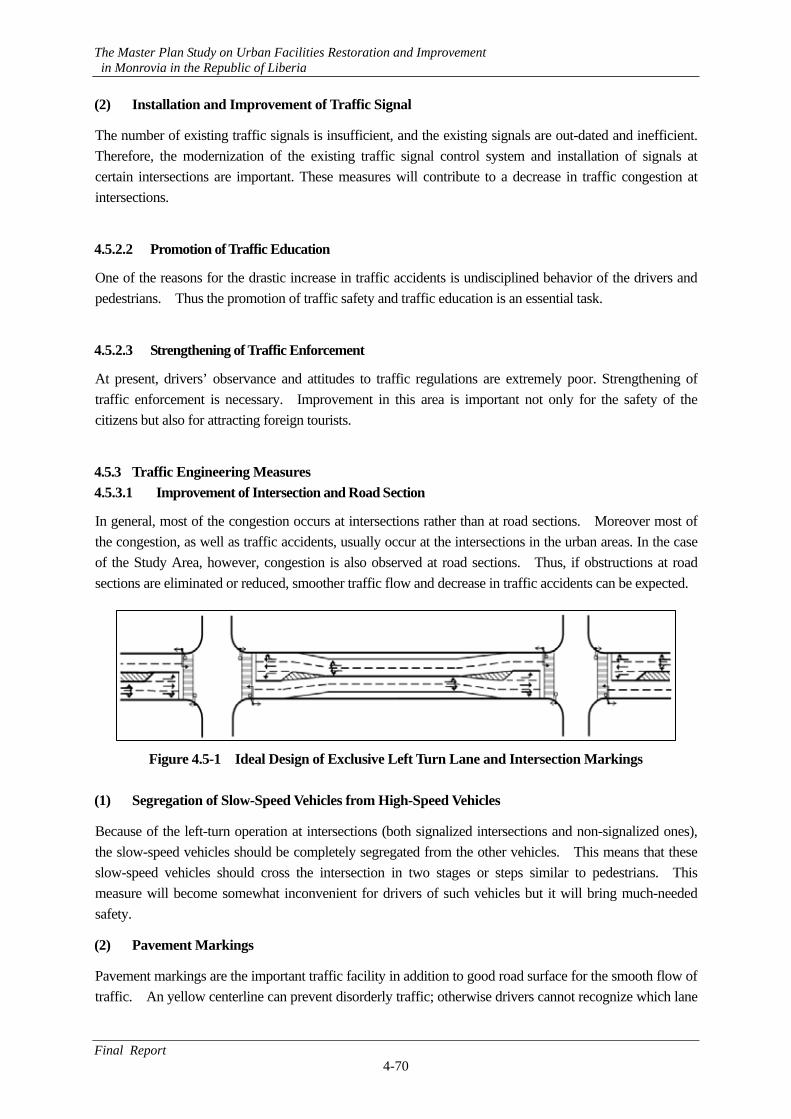
The Master Plan Study on Urban Facilities Restoration and Improvement in Monrovia in the Republic of Liberia
Final Report 4-70
(2) Installation and Improvement of Traffic Signal
The number of existing traffic signals is insufficient, and the existing signals are out-dated and inefficient. Therefore, the modernization of the existing traffic signal control system and installation of signals at certain intersections are important. These measures will contribute to a decrease in traffic congestion at intersections.
4.5.2.2 Promotion of Traffic Education
One of the reasons for the drastic increase in traffic accidents is undisciplined behavior of the drivers and pedestrians. Thus the promotion of traffic safety and traffic education is an essential task.
4.5.2.3 Strengthening of Traffic Enforcement
At present, drivers’ observance and attitudes to traffic regulations are extremely poor. Strengthening of traffic enforcement is necessary. Improvement in this area is important not only for the safety of the citizens but also for attracting foreign tourists.
4.5.3 Traffic Engineering Measures 4.5.3.1 Improvement of Intersection and Road Section
In general, most of the congestion occurs at intersections rather than at road sections. Moreover most of the congestion, as well as traffic accidents, usually occur at the intersections in the urban areas. In the case of the Study Area, however, congestion is also observed at road sections. Thus, if obstructions at road sections are eliminated or reduced, smoother traffic flow and decrease in traffic accidents can be expected.
Figure 4.5-1 Ideal Design of Exclusive Left Turn Lane and Intersection Markings
(1) Segregation of Slow-Speed Vehicles from High-Speed Vehicles
Because of the left-turn operation at intersections (both signalized intersections and non-signalized ones), the slow-speed vehicles should be completely segregated from the other vehicles. This means that these slow-speed vehicles should cross the intersection in two stages or steps similar to pedestrians. This measure will become somewhat inconvenient for drivers of such vehicles but it will bring much-needed safety.
(2) Pavement Markings
Pavement markings are the important traffic facility in addition to good road surface for the smooth flow of traffic. An yellow centerline can prevent disorderly traffic; otherwise drivers cannot recognize which lane
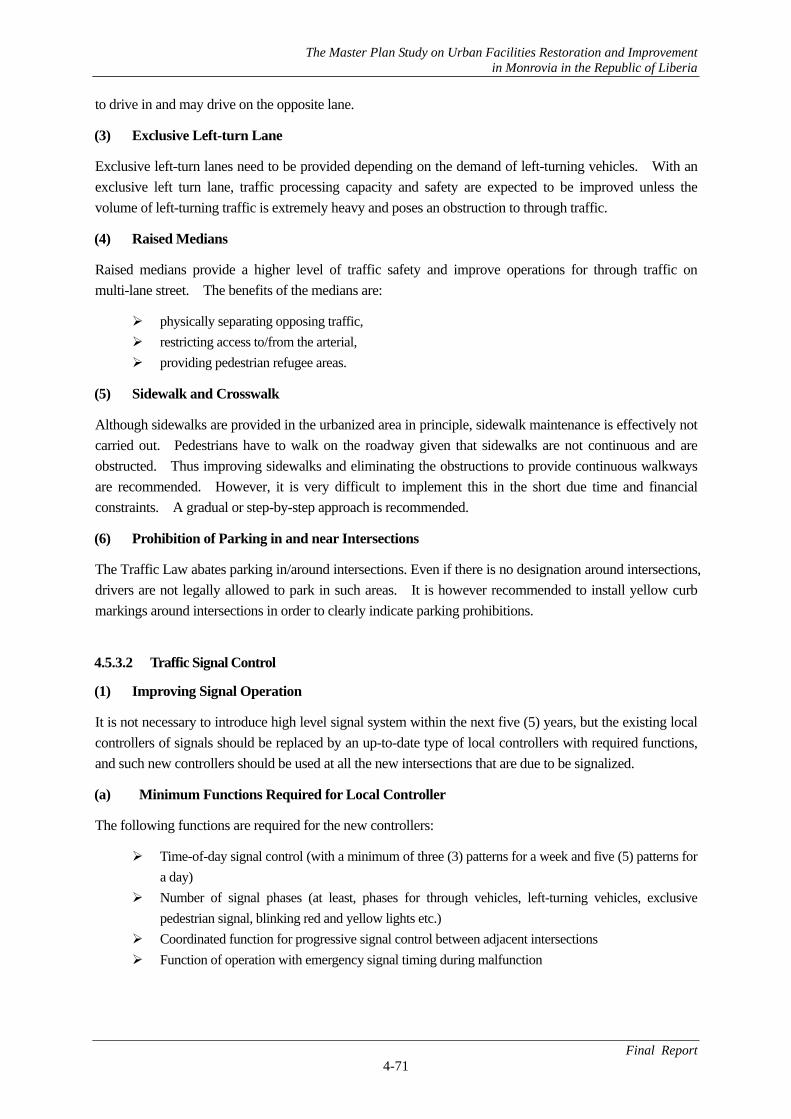
The Master Plan Study on Urban Facilities Restoration and Improvement in Monrovia in the Republic of Liberia
Final Report 4-71
to drive in and may drive on the opposite lane.
(3) Exclusive Left-turn Lane
Exclusive left-turn lanes need to be provided depending on the demand of left-turning vehicles. With an exclusive left turn lane, traffic processing capacity and safety are expected to be improved unless the volume of left-turning traffic is extremely heavy and poses an obstruction to through traffic.
(4) Raised Medians
Raised medians provide a higher level of traffic safety and improve operations for through traffic on multi-lane street. The benefits of the medians are:
physically separating opposing traffic, restricting access to/from the arterial, providing pedestrian refugee areas.
(5) Sidewalk and Crosswalk
Although sidewalks are provided in the urbanized area in principle, sidewalk maintenance is effectively not carried out. Pedestrians have to walk on the roadway given that sidewalks are not continuous and are obstructed. Thus improving sidewalks and eliminating the obstructions to provide continuous walkways are recommended. However, it is very difficult to implement this in the short due time and financial constraints. A gradual or step-by-step approach is recommended.
(6) Prohibition of Parking in and near Intersections
The Traffic Law abates parking in/around intersections. Even if there is no designation around intersections, drivers are not legally allowed to park in such areas. It is however recommended to install yellow curb markings around intersections in order to clearly indicate parking prohibitions.
4.5.3.2 Traffic Signal Control
(1) Improving Signal Operation
It is not necessary to introduce high level signal system within the next five (5) years, but the existing local controllers of signals should be replaced by an up-to-date type of local controllers with required functions, and such new controllers should be used at all the new intersections that are due to be signalized.
(a) Minimum Functions Required for Local Controller
The following functions are required for the new controllers:
Time-of-day signal control (with a minimum of three (3) patterns for a week and five (5) patterns for a day)
Number of signal phases (at least, phases for through vehicles, left-turning vehicles, exclusive pedestrian signal, blinking red and yellow lights etc.)
Coordinated function for progressive signal control between adjacent intersections Function of operation with emergency signal timing during malfunction
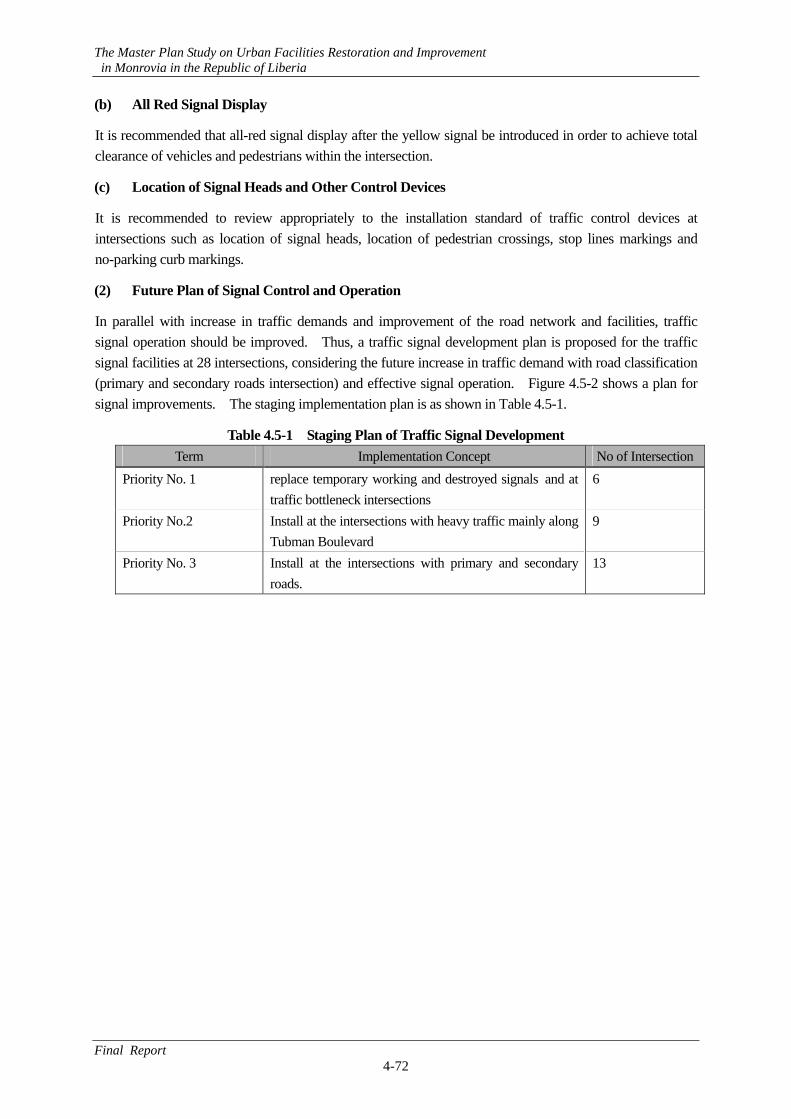
The Master Plan Study on Urban Facilities Restoration and Improvement in Monrovia in the Republic of Liberia
Final Report 4-72
(b) All Red Signal Display
It is recommended that all-red signal display after the yellow signal be introduced in order to achieve total clearance of vehicles and pedestrians within the intersection.
(c) Location of Signal Heads and Other Control Devices
It is recommended to review appropriately to the installation standard of traffic control devices at intersections such as location of signal heads, location of pedestrian crossings, stop lines markings and no-parking curb markings.
(2) Future Plan of Signal Control and Operation
In parallel with increase in traffic demands and improvement of the road network and facilities, traffic signal operation should be improved. Thus, a traffic signal development plan is proposed for the traffic signal facilities at 28 intersections, considering the future increase in traffic demand with road classification (primary and secondary roads intersection) and effective signal operation. Figure 4.5-2 shows a plan for signal improvements. The staging implementation plan is as shown in Table 4.5-1.
Table 4.5-1 Staging Plan of Traffic Signal Development Term Implementation Concept No of Intersection
Priority No. 1 replace temporary working and destroyed signals and at traffic bottleneck intersections
6
Priority No.2 Install at the intersections with heavy traffic mainly along Tubman Boulevard
9
Priority No. 3 Install at the intersections with primary and secondary roads.
13
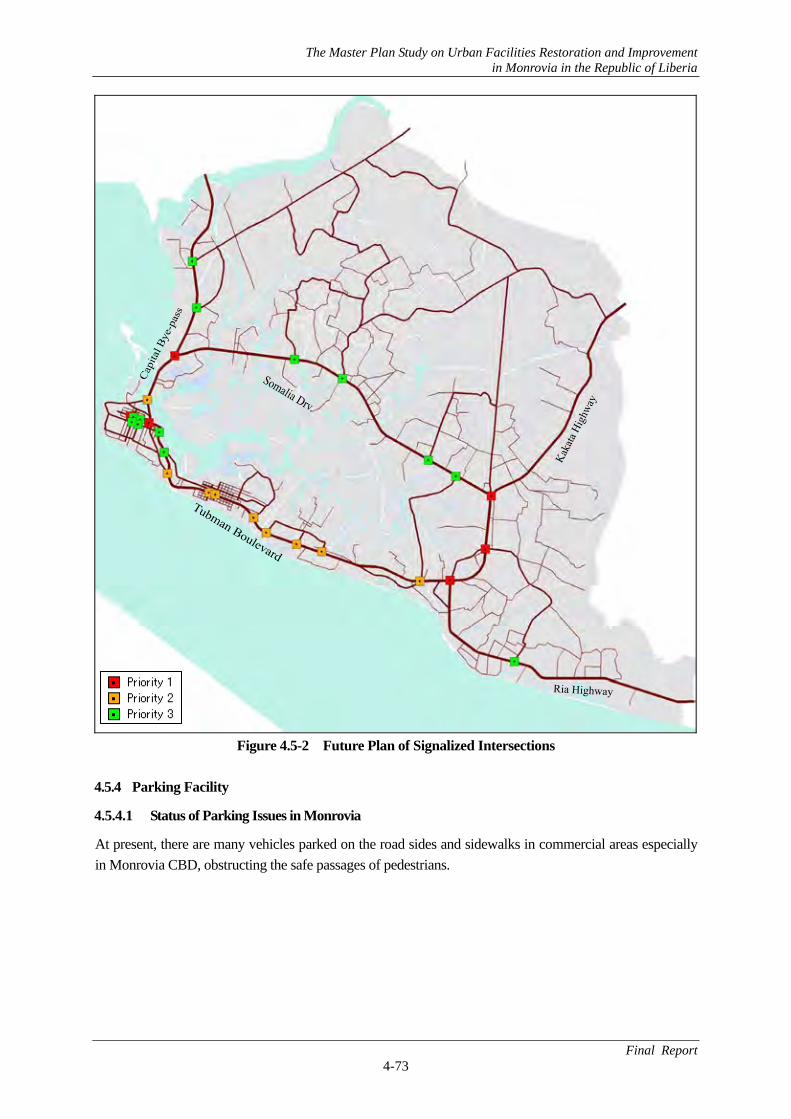
The Master Plan Study on Urban Facilities Restoration and Improvement in Monrovia in the Republic of Liberia
Final Report 4-73
Figure 4.5-2 Future Plan of Signalized Intersections
4.5.4 Parking Facility
4.5.4.1 Status of Parking Issues in Monrovia
At present, there are many vehicles parked on the road sides and sidewalks in commercial areas especially in Monrovia CBD, obstructing the safe passages of pedestrians.
The Master Plan Study on Urban Facilities Restoration and Improvement in Monrovia in the Republic of Liberia
Final Report 4-74
Figure 4.5-3 Roadside Parking Status in Monrovia CBD
The study team had carried out parking survey for Monrovia CBD area in May 2009, so as to evaluate the existing parking situation. Based on the survey, total number of parked vehicles is 3,457 vehicles at 30 km roadside length. As of parking by vehicle type, the major vehicle type is Passenger car with 68%, followed by Pick up with 8%. The parking density on average is about 11.6 vehicles per 100m. The location with parking density more than 30 vehicles per 100m, which means most of roadside is occupied by parked car, located on Randall street, Broad street, Gurley street, Center street, UN drive, Benson street, Carey street, Ashmun street, Sao boso street, and Mechlin street. Hourly distribution at the busiest street is almost constant during day time, about 450 vehicles.
Pax. Car,2,331
Pick Up, 288
Truck, 38
Taxi, 396
Bus, 123
Bike, 281
Figure 4.5-4 Number of Parking in Monrovia CBD
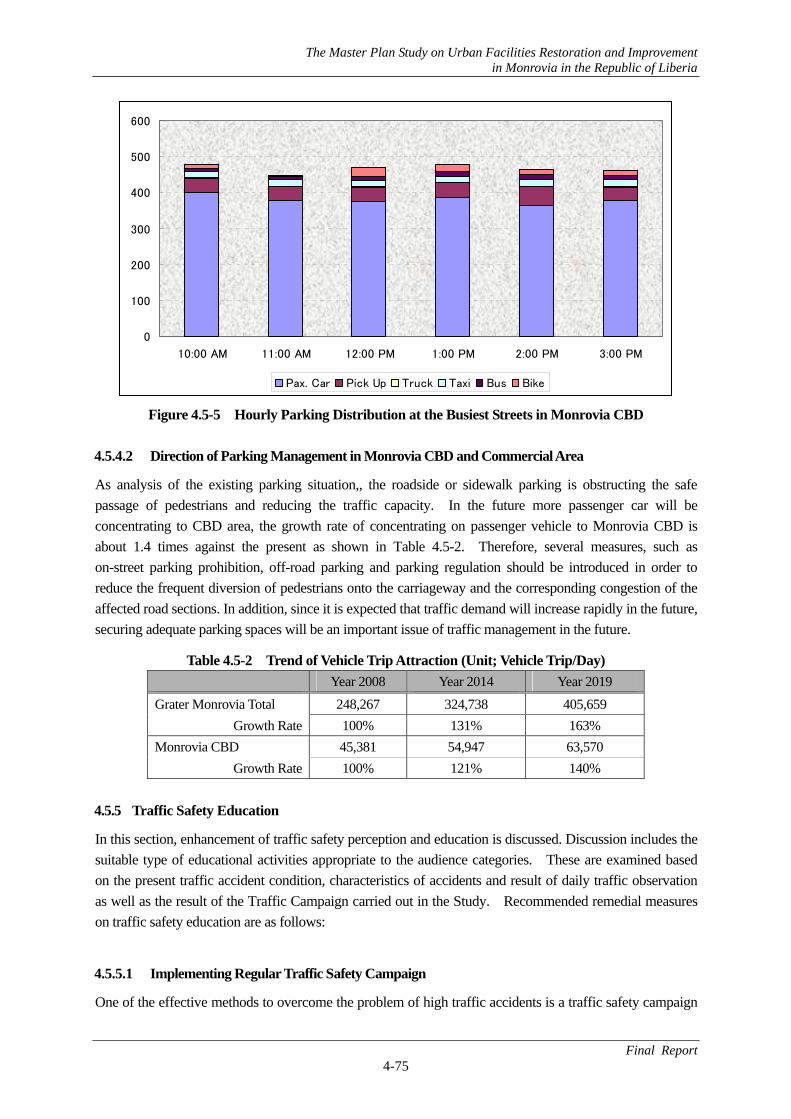
The Master Plan Study on Urban Facilities Restoration and Improvement in Monrovia in the Republic of Liberia
Final Report 4-75
0
100
200
300
400
500
600
10:00 AM 11:00 AM 12:00 PM 1:00 PM 2:00 PM 3:00 PM
Pax. Car Pick Up Truck Taxi Bus Bike
Figure 4.5-5 Hourly Parking Distribution at the Busiest Streets in Monrovia CBD 4.5.4.2 Direction of Parking Management in Monrovia CBD and Commercial Area
As analysis of the existing parking situation,, the roadside or sidewalk parking is obstructing the safe passage of pedestrians and reducing the traffic capacity. In the future more passenger car will be concentrating to CBD area, the growth rate of concentrating on passenger vehicle to Monrovia CBD is about 1.4 times against the present as shown in Table 4.5-2. Therefore, several measures, such as on-street parking prohibition, off-road parking and parking regulation should be introduced in order to reduce the frequent diversion of pedestrians onto the carriageway and the corresponding congestion of the affected road sections. In addition, since it is expected that traffic demand will increase rapidly in the future, securing adequate parking spaces will be an important issue of traffic management in the future.
Table 4.5-2 Trend of Vehicle Trip Attraction (Unit; Vehicle Trip/Day) Year 2008 Year 2014 Year 2019 Grater Monrovia Total 248,267 324,738 405,659
Growth Rate 100% 131% 163% Monrovia CBD 45,381 54,947 63,570
Growth Rate 100% 121% 140% 4.5.5 Traffic Safety Education
In this section, enhancement of traffic safety perception and education is discussed. Discussion includes the suitable type of educational activities appropriate to the audience categories. These are examined based on the present traffic accident condition, characteristics of accidents and result of daily traffic observation as well as the result of the Traffic Campaign carried out in the Study. Recommended remedial measures on traffic safety education are as follows:
4.5.5.1 Implementing Regular Traffic Safety Campaign
One of the effective methods to overcome the problem of high traffic accidents is a traffic safety campaign
The Master Plan Study on Urban Facilities Restoration and Improvement in Monrovia in the Republic of Liberia
Final Report 4-76
targeted at all citizens, namely the general public, school children, parents and drivers. Traffic safety campaign is suggested to be carried out repeatedly and regularly as one of the effective means and first priority in the Study Area, as proven by the actual performances of the Traffic Safety Campaign held by the MPP and Study Team.
4.5.5.2 Training for Instructors on Traffic Safety Education
One of the reasons that current traffic safety education has almost no impact on the public is the absence of adequate and qualified instructors. It is indispensable to train instructors to do such tasks. There are three types of instructor groups to be trained as listed below.
Teachers at regular schools Traffic police to be trained on traffic safety education, Instructors at private driving schools to be trained on traffic safety education
4.5.5.3 Establishing Traffic Safety Instruction Patrol Unit at the Traffic Police Department
Traffic safety education for pupils and children in schools should be promoted by establishing traffic police and instruction patrol unit at the headquarters of the Traffic Police Department. A group of instructors would visit all kindergartens, primary schools, secondary schools and high schools in the city regularly and provide traffic safety education to them.
4.5.6 Traffic Enforcement
Measures to strengthen traffic enforcement are recommended in order to improve the current traffic situation where traffic accidents are likely to increase rapidly in the near future. Issues focusing on drivers in the Study Area are extracted based on characteristics of traffic accidents, driving behavior, and the current condition of traffic regulation and enforcement. In this section, urgent remedial measures based on the analysis so far are described.
4.5.6.1 Strengthening of Driving Instruction and Enforcement for Illegal Drivers
It is unrealistic to expect immediate results by stepping up traffic enforcement on illegal driving, considering the drivers habits. Thus, it is suggested that a grace period of about one year for enforcement be given with a focus on providing instructions on proper driving during that time. The objective is not to punish illegal driving but to provide instructions on proper driving manners. It is more effective to select certain regulations and enforce them emphatically at a selected time period, day of week etc. rather than trying to enforce all the rules. This method of selective enforcement makes a greater impression on drivers and is easier for the enforcement officers to conduct their duties. In selecting the regulations to be enforced, violations or causes of traffic accidents that most frequently occur can be listed, based on analyses of traffic accidents, and then given a priority ranking. Those with high priority will then be selected for enforcement.
The recommended areas for selective enforcement based on site observations and the survey data are as follow:
Driving on the opposing roadway
The Master Plan Study on Urban Facilities Restoration and Improvement in Monrovia in the Republic of Liberia
Final Report 4-77
Drunken driving Ignoring traffic signal Ignoring pedestrians on crosswalk Parking in or near intersections
4.5.6.2 Strengthening Illegal Parking Enforcement and Disclosure of Model Intersection
A parking ban can be set up at road sections where parked vehicles obstruct traffic flow. However, if the enforcement cannot be carried out accurately, the law will exist only in name. Illegal parking around intersections in particular adversely affects traffic safety and road efficiency. Thus enforcement at intersections must be emphasized.
4.5.6.3 Maintenance and Plenitude of Enforcement Equipment
Both the quantity and quality of the enforcement equipment retained by Phnom Penh Central Traffic Police are insufficient. The maintenance of an adequate quantity of enforcement equipment in good condition is essential and must be urgently raised for discussion. The following items in particular are needed to reduce congestion and accident.
Communication telephones between police officers on site Microphones installed at major intersections for drivers and pedestrians guidance Respiratory alcohol detector Speed enforcement equipment such as radar speedometer
4.5.6.4 Introducing a Penalty System for Traffic rule Violations
Introducing a penalty system for traffic rule violations is essential in Phnom Penh. The introduction of the system may face some problems; for example, difficulty in collecting fines. However, the aim of the penalty system is not just the collection of fines but also to achieve several other objectives such as discouraging dangerous driving, encouraging good driving, and uncovering organizations that employ dangerous drivers. A record system using a computerized LAN is recommended to register each driver’s license and centrally control traffic violation.
4.5.7 Project Implementation Plan for Traffic Management System
4.5.7.1 Background
There is no effective countermeasure against approximately 50,000 uneducated passenger car driver and 10,000 unlicensed motorcyclists
It is necessary to introduce a transition period especially for traffic enforcement activities considering capability of traffic police officers,
Effective traffic management schemes such as demand control are urgently needed considering the rapid increase of road traffic, especially in Monrovia CBD
The need to instill discipline among Monrovia citizens, such as following traffic rules, is the most important issue in the city, and city side understands that time is needed for this to happen.
The Master Plan Study on Urban Facilities Restoration and Improvement in Monrovia in the Republic of Liberia
Final Report 4-78
4.5.7.2 Objectives
The Objectives of the program are to improve urban traffic condition by reducing traffic congestion and accidents through the implementation of appropriate traffic management in Monrovia City.
4.5.7.3 Expected Outputs
To improve technology of traffic management by MPW / LNP counterpart and officers in Monrovia City.
To improve knowledge and techniques of the counterpart and officers of LNP in driver education to enhance traffic safety awareness of license holders in Monrovia City and to contribute to the improvement of safety through traffic safety campaign.
To improve the knowledge and techniques of the counterpart and other officers in traffic enforcement by internal education of LNP Traffic Police Officers.
4.5.7.4 Activities
(1) Engineering (Intersection and On -street Parking)
1-1 Preparatory study 1-2 Selection of intersections and streets for on-street parking system public experiments 1-3 Traffic survey 1-4 Consideration of detailed measures 1-5 Arrangement of facilities for the public experiments 1-6 Public experiments 1-7 Evaluation of the experiments 1-8 Support for similar projects by counterparts 1-9 Implementation of public campaign for public experiment 1-10 Preparatory work for the introduction of traffic demand control
(2) Education
2-1 Analysis of traffic safety and drivers education 2-2 Creation of the program of driver education 2-3 Creation of textbook of drivers’ education 2-4 Training for trainers of drivers’ education 2-5 Cooperation with local NGOs for implementation of public campaign for traffic safety 2-6 Implementation of traffic safety campaign 2-7 Countermeasures for uneducated drivers and unlicensed motorcycle users
(3) Enforcement
3-1 Analysis of traffic enforcement activities 3-2 Consideration of traffic enforcement system 3-3 Creation of manuals for traffic enforcement guidance 3-4 Enhancement of statistical system of traffic accident 3-5 Technical training for traffic police officers 3-6 Implementation of public campaign for traffic enforcement
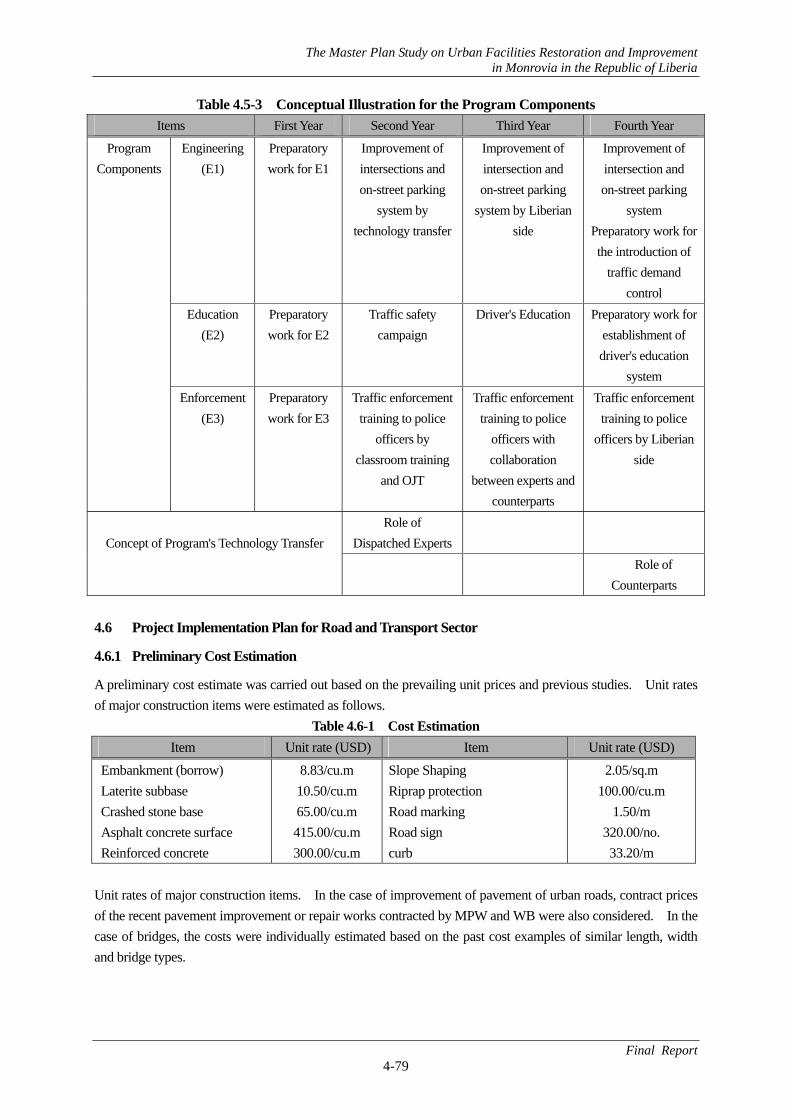
The Master Plan Study on Urban Facilities Restoration and Improvement in Monrovia in the Republic of Liberia
Final Report 4-79
Table 4.5-3 Conceptual Illustration for the Program Components Items First Year Second Year Third Year Fourth Year
Engineering(E1)
Preparatory work for E1
Improvement of intersections and on-street parking
system by technology transfer
Improvement of intersection and on-street parking
system by Liberian side
Improvement of intersection and on-street parking
system Preparatory work for the introduction of
traffic demand control
Education (E2)
Preparatory work for E2
Traffic safety campaign
Driver's Education Preparatory work for establishment of driver's education
system
Program Components
Enforcement (E3)
Preparatory work for E3
Traffic enforcement training to police
officers by classroom training
and OJT
Traffic enforcement training to police
officers with collaboration
between experts and counterparts
Traffic enforcement training to police
officers by Liberian side
Role of Dispatched Experts
Concept of Program's Technology Transfer
Role of Counterparts
4.6 Project Implementation Plan for Road and Transport Sector
4.6.1 Preliminary Cost Estimation
A preliminary cost estimate was carried out based on the prevailing unit prices and previous studies. Unit rates of major construction items were estimated as follows.
Table 4.6-1 Cost Estimation Item Unit rate (USD) Item Unit rate (USD)
Embankment (borrow) Laterite subbase Crashed stone base Asphalt concrete surface Reinforced concrete
8.83/cu.m 10.50/cu.m 65.00/cu.m 415.00/cu.m 300.00/cu.m
Slope Shaping Riprap protection Road marking Road sign curb
2.05/sq.m 100.00/cu.m
1.50/m 320.00/no. 33.20/m
Unit rates of major construction items. In the case of improvement of pavement of urban roads, contract prices of the recent pavement improvement or repair works contracted by MPW and WB were also considered. In the case of bridges, the costs were individually estimated based on the past cost examples of similar length, width and bridge types.
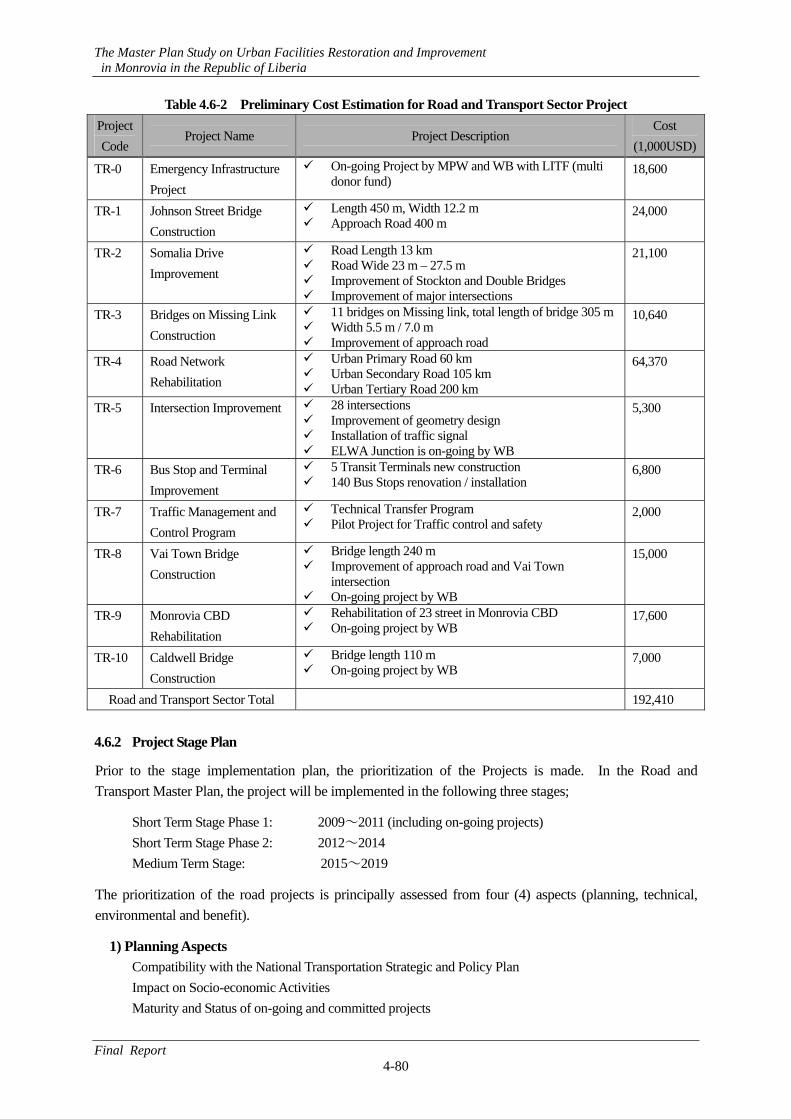
The Master Plan Study on Urban Facilities Restoration and Improvement in Monrovia in the Republic of Liberia
Final Report 4-80
Table 4.6-2 Preliminary Cost Estimation for Road and Transport Sector Project Project Code
Project Name Project Description Cost
(1,000USD)
TR-0 Emergency Infrastructure Project
On-going Project by MPW and WB with LITF (multi donor fund)
18,600
TR-1 Johnson Street Bridge Construction
Length 450 m, Width 12.2 m Approach Road 400 m
24,000
TR-2 Somalia Drive Improvement
Road Length 13 km Road Wide 23 m – 27.5 m Improvement of Stockton and Double Bridges Improvement of major intersections
21,100
TR-3 Bridges on Missing Link Construction
11 bridges on Missing link, total length of bridge 305 m Width 5.5 m / 7.0 m Improvement of approach road
10,640
TR-4 Road Network Rehabilitation
Urban Primary Road 60 km Urban Secondary Road 105 km Urban Tertiary Road 200 km
64,370
TR-5 Intersection Improvement 28 intersections Improvement of geometry design Installation of traffic signal ELWA Junction is on-going by WB
5,300
TR-6 Bus Stop and Terminal Improvement
5 Transit Terminals new construction 140 Bus Stops renovation / installation
6,800
TR-7 Traffic Management and Control Program
Technical Transfer Program Pilot Project for Traffic control and safety
2,000
TR-8 Vai Town Bridge Construction
Bridge length 240 m Improvement of approach road and Vai Town
intersection On-going project by WB
15,000
TR-9 Monrovia CBD Rehabilitation
Rehabilitation of 23 street in Monrovia CBD On-going project by WB
17,600
TR-10 Caldwell Bridge Construction
Bridge length 110 m On-going project by WB
7,000
Road and Transport Sector Total 192,410 4.6.2 Project Stage Plan
Prior to the stage implementation plan, the prioritization of the Projects is made. In the Road and Transport Master Plan, the project will be implemented in the following three stages;
Short Term Stage Phase 1: 2009~2011 (including on-going projects) Short Term Stage Phase 2: 2012~2014 Medium Term Stage: 2015~2019
The prioritization of the road projects is principally assessed from four (4) aspects (planning, technical, environmental and benefit).
1) Planning Aspects Compatibility with the National Transportation Strategic and Policy Plan Impact on Socio-economic Activities Maturity and Status of on-going and committed projects
The Master Plan Study on Urban Facilities Restoration and Improvement in Monrovia in the Republic of Liberia
Final Report 4-81
Requirement of Social Consideration (poverty reduction and recover economic activities) on Project Implementation Impact
2) Technical Aspect Urgency based on degree and scale of problems Improvement scale and the size of the project Function and role in road network Technical difficulty and requirement for special structures or measures
3) Environmental Aspect Effect on health in terms of its high impact in mitigation of air pollution Social impacts with limited need for land acquisition and resettlement schemes Natural Impact with limited negative effects on nature, flora and fauna Social acceptance by affected people and user groups
4) Benefit Aspect Traffic demand to handle high traffic volumes with high level-of-services Cost scale with high priority for low cost projects Relative benefit scale that is assessed by the share of project’s benefits to the total benefits
Based on the consideration and evaluation of the prioritization, the following staging plan for the road and transport sector project is proposed in this study.
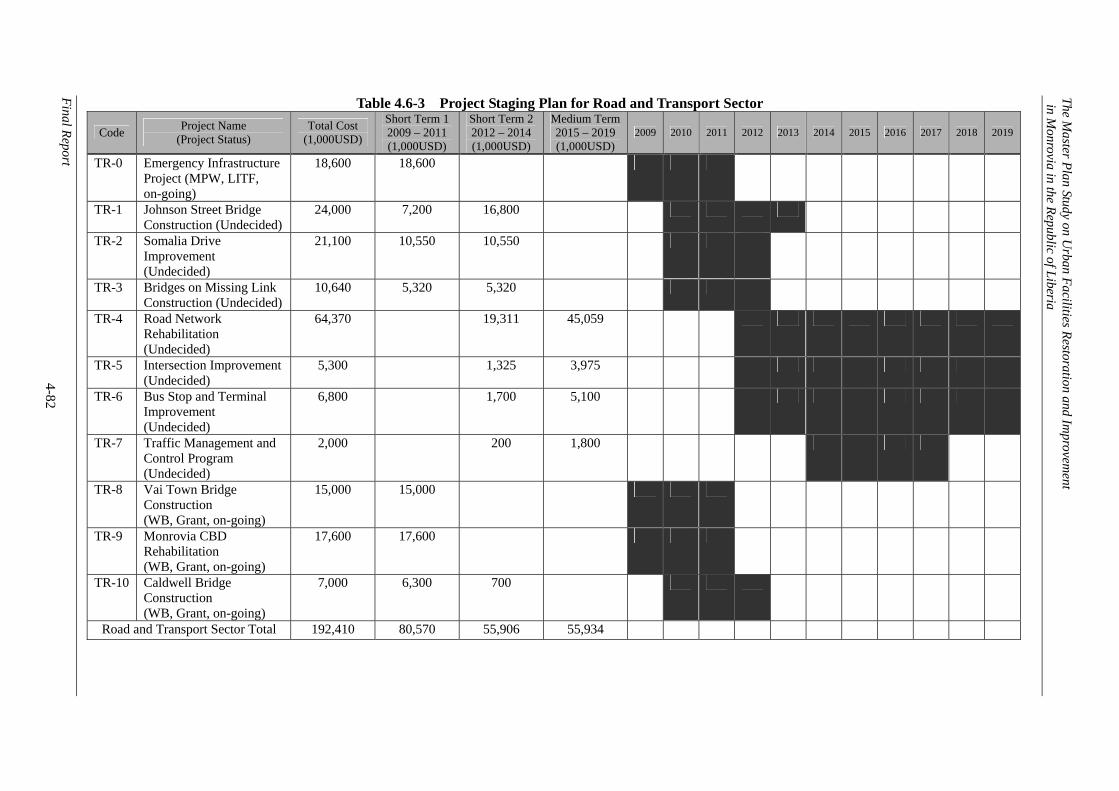
Final Report 4-82
The Master Plan Study on U
rban Facilities Restoration and Improvem
ent in M
onrovia in the Republic of Liberia
Table 4.6-3 Project Staging Plan for Road and Transport Sector
Code Project Name (Project Status)
Total Cost (1,000USD)
Short Term 12009 – 2011(1,000USD)
Short Term 22012 – 2014(1,000USD)
Medium Term 2015 – 2019 (1,000USD)
2009 2010 2011 2012 2013 2014 2015 2016 2017 2018 2019
TR-0 Emergency Infrastructure Project (MPW, LITF, on-going)
18,600 18,600
TR-1 Johnson Street Bridge Construction (Undecided)
24,000 7,200 16,800
TR-2 Somalia Drive Improvement (Undecided)
21,100 10,550 10,550
TR-3 Bridges on Missing Link Construction (Undecided)
10,640 5,320 5,320
TR-4 Road Network Rehabilitation (Undecided)
64,370 19,311 45,059
TR-5 Intersection Improvement (Undecided)
5,300 1,325 3,975
TR-6 Bus Stop and Terminal Improvement (Undecided)
6,800 1,700 5,100
TR-7 Traffic Management and Control Program (Undecided)
2,000 200 1,800
TR-8 Vai Town Bridge Construction (WB, Grant, on-going)
15,000 15,000
TR-9 Monrovia CBD Rehabilitation (WB, Grant, on-going)
17,600 17,600
TR-10 Caldwell Bridge Construction (WB, Grant, on-going)
7,000 6,300 700
Road and Transport Sector Total 192,410 80,570 55,906 55,934