chapter 4 thermal hazard assessment of...
TRANSCRIPT

68
CHAPTER 4
THERMAL HAZARD ASSESSMENT OF FIREWORKS
MIXTURE USING ACCELERATING RATE
CALORIMETER (ARC)
4.1 INTRODUCTION
Accelerating Rate Calorimeter (ARC) is one of the versatile
experimental tools available to study the self-propagating and thermally
sensitive reactions of fireworks mixtures. It operates in an adiabatic condition.
By using thermal techniques such as DSC and ARC in complement, it is
possible to address thermal hazard potentials of fireworks mixtures (Lightfoot
et al 2001, Brown and Gallagher 2003).
Although there are many reported studies on impact and friction
sensitivity of fireworks mixtures, studies of the thermal stability of fireworks
mixtures and their thermo kinetics are few.
In the present study, thermal hazards of fireworks mixtures were
studied using ARC to understand the thermal behavior of fireworks mixture.
ARC studies on fireworks mixtures were used to determine ceiling
temperatures and pressure limits for safe operation, storage and
transportation.

69
In this chapter, the thermal hazards of three cracker mixtures viz.
atom bomb cracker, Chinese cracker and palm leaf cracker and two tip
mixtures viz. flower pot tip mixture and ground spinner tip mixture by
adiabatic tests in ARC are studied. Further the water induced thermal hazards
of tip mixtures are also investigated by iso-ageing tests in ARC to deduce the
field conditions for triggering accidents.
4.2 MATERIALS AND METHOD
4.2.1 Accelerating Rate Calorimeter (ARC)
Accelerating Rate Calorimeter (ARC) has gained importance since
the 1980’s for studying the self heating reactions that cause thermal runaway.
It was employed (Aurbach et al 2003, Bunyan et al 1999, Carr 1983, Fenlon
1984, Fisher 1991, Iizuka and Surianarayanan 2003, Lee et al 2002, Liao et al
2011, Ottaway 1986, Roduit et al 2008, Smitha et al 2013, Sivapirakasam et
al 2006c, Surianarayanan et al 2001) for studying the runaway characteristics
of chemical reactions. ARC used in this study was an esARC supplied by
Thermal Hazard Technology, UK.
4.2.2 ARC Construction
Figure 4.1 illustrates the calorimeter part of ARC. It is a container
with its contents maintained at adiabatic conditions with respect to its
environment. This is accomplished by constant monitoring of its temperature
and suitably adjusting the surrounding temperature to minimize the heat gains
(or) losses from the container. In order to achieve an adiabatic environment
over a temperature range of ambient to 425°C, the ARC is equipped with a
sophisticated digital control for the heater system.

70
Shield
Bomb
Control Heater
Radiant Heater
Insulation Pressure Transducer
SampleThermocouple
ControlThermocouple
The calorimeter can be divided into three temperature control zones
viz. Top, middle and bottom with each of them equipped with its own control
instrumentation. The sample container or “bomb” is attached to a pressure
transducer on the top of the chamber for close monitoring of pressure
responses. The radiant heater located at the bottom of the adiabatic chamber,
is meant for heating the sample container at the start of the experiment.
Figure 4.1 Accelerating Rate Calorimeter chamber setup
4.2.3 ARC Principle
The working principle, design description, and operational details
of ARC were well cited in literature (Townsend and Tou 1980). ARC
measurements were made using a sample bomb, i.e. a metal sphere in a 2.5cm
diameter, typically made of Titanium. The sample mass usually (1-2 g) would
depend upon the expected energy release and type of sample container

71
(known as a bomb) used. The sample bomb was attached to the lid section on
the calorimeter assembly by a Swagelok pressure fitting and a pressure line
that led to the pressure transducer. A thermocouple was attached to the outer
surface of the bomb and the lid of the calorimeter positioned on the base
section.
The calorimeter has three separate thermal zones. The top (lid
section) contains two heaters and a thermocouple, the side zone of the base
section has four heaters and a thermocouple and the bottom zone at the base
section has two heaters and a thermocouple. After set up and connection, the
calorimeter was sealed with an explosion proof containment vessel. After
defining experimental conditions on the PC, the test commenced. Two types
of tests can be performed in ARC viz., heat-wait-search and iso-ageing
method. ARC experiments were performed both under heat-wait-search and
iso-ageing methods. The heat-wait-search method (Figure 4.2) is briefly
discussed below.
The test conditions were a start and end temperature and choosing
the size of ‘heat steps', 'wait time' and detection sensitivity'. The system will
heat to the start temperature. A small heater in the calorimeter, the radiant
heater was used to heat the sample, bomb and its thermocouple. The
calorimeter was cooled and the temperature difference observed by the three
calorimeter thermocouples. The system then applied power to the calorimeter
heaters to minimize the temperature difference. This was to continue as the
temperature rose to the start temperature. When this start temperature was
reached the system would go into a wait period and during this time no heat
was provided by the radiant heater. This allowed the temperature differences
within the calorimeter to be reduced to zero. The calorimeter operates
adiabatically allowing the calorimeter temperature to track sample

72
temperature. These wait periods (typically 10-15 minutes) was followed by a
search or seek period. Again during this period (typically 20 minutes) no heat
was provided by the radiant heater, and any temperature drift, upwards or
downwards, was observed. If there was upward temperature drift it was
caused by a self-heating reaction. The heat-wait-seek procedure, the normal
mode of operation of the ARC was to continue until an upward temperature
drift observed an exothermic reaction, greater than the selected sensitivity
(normally 0.01-0.02°C min-1). The system automatically switched to the
exothermic mode; it would apply heat to the calorimeter jacket to keep its
temperature the same as the bomb/sample.
The adiabatic control is the key feature of the ARC. The system
continues in the exotherm mode until the rate of self heating is less than the
chosen sensitivity and at this stage the heat-wait-seek procedure resumes.
When the end temperature is reached (or an end pressure is reached) the test
automatically stops and cooling, by compressed air, begins.
The aim of the ARC is to complete the test to get a full time,
temperature, and pressure profile of the exothermic reaction in a safe and
controlled manner. In iso-ageing method the sample is screened for
exothermic activity at a specified temperature, on initiation of exothermic
activity, the self heating was followed under adiabatic control mode. The
difference between iso-ageing method and heat-wait-search method is that, in
the iso-ageing method the sample is subjected to remain at a pre determined
temperature. On exothermic onset ARC follows the exothermic reaction
adiabatically as in heat-wait-search method.

73
Figure 4.2 Heat-wait-search operation of ARC
Following data plots can be obtained from an ARC experiment.
Self heat rate vs. temperature
This plot provides information on the onset temperature of the
exothermic activity and qualitative indication of the rate of energy liberation.
Temperature vs. time
It provides information on the vigour of the exothermic reaction
and also the available time span from the onset of exothermic activity to the
end of the reaction.
Pressure vs. temperature
Information on the rate of pressure and temperature rise will be
most useful for estimating the vent area required for the safe operation of a
reaction mixture.

74
4.2.4 Adiabatic Thermo Kinetics
The first assumption in the interpretation of ARC experimental data
is the representation of concentration in terms of temperature differences
(Townsend (1977 and 1991), Townsend and Tou (1980)). The equivalence of
temperature and concentration for a simple well-defined chemical reaction is
established using the ratio (Bunyan et al 1999, Davis et al 1991, Fisher 1991,
Kossoy et al 1994, Lee and Back 1986, Nalla et al 2012, Ottaway 1986,
Smitha et al 2013, Wedlich and Davis 1990,):
= = (4.1)
Here C is the concentration of the reacting substance, and T the temperature.
The subscript ‘0’ indicates some initial condition, and F a final state in which
the substance has been consumed. Then T = TF –T0 is the temperature rise
for the reaction. It is also equal to the ratio of enthalpy to average specific
heat. As the reaction proceeds, the disappearance of the reacting species
produces a proportional increase in the heat energy. The heat of reaction, Hr,
can be calculated from
H = mC T (4.2)
where PC , is the average heat capacity, m the mass of the sample.
The heat generated in an exothermic reaction is used to heat the
material, the container or bomb, and the surroundings. The heat being used up
in heating the sample mass depends on specific heat. The proportion of heat
used in heating the container is called thermal inertia ( ), expressed as
=Heat capacity of sample(s)and container or bomb(b)
Heat capacity of sample(or)

75
=m C + m C
m C(or) (4.3)
= 1 +m Cm C
(4.4)
Incorporating the effects of thermal inertia ( ), the absolute
temperature rise is given by
Tab= T (4.5)
The corrected heat of reaction, Hr, is calculated using
Hr = mC T (4.6)
The question that is basic to the study of relationship of time to
explosion is the measurement, and extrapolation of data. Extrapolation must
involve a concept of concentration since no material can continue to self-heat
forever. The time dependence of concentration for an nth order reaction rate is
expressed as follows
dCdt
= kC (4.7)
Where C is the concentration, k the rate coefficient, and t the time. When
Equations (4.1) and (4.7) are used, additional temperature dependence appears.
dCdt
= Cddt
(T T)T
=CT
dTdt
(4.8)
m =dTdt
= k(T T
T) . C T (4.9)

76
Here mT , is defined as the rate of temperature increase (or slope of the graph
of T vs. t), i.e. the self-heat rate. To remove this extra temperature
dependence, a modified rate is defined as the pseudo rate constant, k*.
k = k. C =m
T. (
TT T
) (4.10)
It is defined in such a way that its dimensions for any order reaction
are reciprocal of time. In practice, k* is evaluated from experimental data
using the right hand side expression. With the proper choice of N, k* has the
same temperature dependence as k, and yields a straight-line graph.
The Arrhenius relationship for determining the rate coefficients is
k = Ae (4.11)
where T is the absolute temperature in Kelvin, E the activation energy, R the
universal gas constant, and A is the pre-exponential factor
First order model (i.e. N=1) kinetics was assumed for the
decomposition of fireworks tip mixture.
For N =1 Equation (4.10) becomes
k = k =m
(T T)(4.12)
Pseudo rate constants (k*) were calculated using Equation (4.12).
Then E/R, and pre-exponential factor were found out by plotting ln k*
versus inverse of temperature. The slope of the plot was equal to E/R, and
the intercept gave the pre-exponential factor, A.

77
4.3 RESULTS AND DISCUSSION
4.3.1 ARC Studies for Cracker Mixtures
Under adiabatic conditions the atom bomb cracker mixture
decomposed slowly (Figure 4.3) until 1750 min (285°C) and beyond this, the
temperature rise is sudden and sharp until the end of the exothermic activity.
The entire activity is recorded within a time span of 300 minutes. The sharp
and sudden rise in temperature shows the vulnerability of this mixture to
undergo violent decomposition. The discontinuity in both the self heat rate
plot and time versus temperature plot is indicative of multiple exothermic
activities.
Figure 4.3 Temperature rise profile for different types of crackers
(Atom bomb cracker ( ), Chinese cracker ( ), Palm leaf cracker ( ))
1500 1600 1700 1800 1900 2000 2100 2200 2300 2400
280
300
320
340
360
380
400
420
Time, (min)

78
The self heat rate plot for thermal explosive decomposition of atom
bomb cracker consisting of KNO3, S and Al in the ratio of 60:20:20 is shown
in Figure 4.4 and the data summarized in Table 4.1. The onset for thermal
explosive decomposition was observed at 275°C and extended up to 340°C.
The self heat rate plot shows a maximum heat release rate of 1088.1°C min-1
at 320°C. The observed large heat release rate confirms the vigour of
exothermic explosive process of atom bomb cracker mixture.
Figure 4.4 Self heat rate profile for different types of crackers
(Atom bomb cracker ( ), Chinese cracker ( ), Palm leaf cracker ( ))
The exothermic activity is accompanied by a considerable quantity
release of gaseous components as shown in Figure 4.5. It is interesting to
note that one gram of sample could contribute to a peak pressure rise of 25.9
bar at 342.3°C. The adiabatic temperature rise for this process was
66.7°C.The heat of reaction for the exothermic activity was calculated as
504.2 Jg-1. The ARC data showed that the fireworks mixture decomposition
process under adiabatic condition was vigourous and therefore dangerous.
280 300 320 340 360 380 400 420
0.1
1
10
100
1000
Temperature, (°C)

79
Although explosive potential was required for it to be a cracker, the same
property could be dangerous if the event occurred during handling,
manufacturing, storage or transport. Evidence is available (Chapter 6) that the
onset temperature attainment could be possible due to mechanical stimulus.
Figure 4.5 Pressure rise profile for different types of crackers
(Atom bomb cracker ( ), Chinese cracker ( ), Palm leaf cracker ( ))
The ARC results for Chinese cracker and palm-leaf crackers are
shown in Figures 4.3-4.5. Both Chinese and palm-leaf crackers show delayed
onset temperatures of 295°C and 290°C respectively as compared to the atom
bomb cracker mixture. The delay in initiation of the exothermic activity can
be related to their mixture, especially the quantity of the oxidiser KNO3.
While the percentage of KNO3 in palm-leaf is more or less equal to that of
Chinese cracker, early onset is perhaps due to the presence of another oxidiser
Ba(NO3)2 and a large quantity of different grades of aluminium. Palm-leaf
280 300 320 340 360 380 400 4200
5
10
15
20
25
30
Temperature, (°C)

80
cracker also shows multiple exothermic activities extended up to 420°C. Both
these mixtures liberate peak heat rates more than 100°C min around 320°C.
The time versus temperature plot (Figure 4.3) shows that the exothermic
activity is sudden and sharp as observed with atom bomb cracker mixture.
Although the heat rates of the second exothermic activity of palm-leaf
mixture were within 1 °C min-1, the decomposition process raises the system
temperature suddenly to 410°C from 345°C. The decomposition process
contributes to a system pressure rise up to 15 bar. The ARC data showed that
the Chinese cracker and palm-leaf cracker decompositions under adiabatic
conditions were vigourous and therefore dangerous.
4.3.2 Thermo Kinetics of Cracker Mixtures
Pseudo rate constants (k*) were calculated using Equation (4.12).
Then ln k* versus inverse of temperature was plotted. The straight line
obtained confirms the assumption that the pyrotechnic mixture follows first
order kinetics. The slope of the plot is equal to E/R. The activation energy
was calculated as 352.17 kJ mol-1, 403.34 kJ mol-1 and 513.82 kJ mol-1 for
atom bomb cracker, Chinese cracker and palm leaf cracker respectively. The
pre-exponential factor was evaluated as 1.38X1030, 8.35X1033, and 1.05X1044
min-1. Thus the Arrhenius rate law for thermal decomposition of atom bomb
cracker, Chinese cracker and palm leaf cracker mixture can be given as
Equations (4.13), (4.14), and (4.15) respectively.
k = 1.38X1030exp (-352.17 /RT) (4.13)
k = 8.35X1033exp (-403.34/RT) (4.14)
k = 1.05X1044exp (-513.82/RT) (4.15)

81
The heat rates determined were compared with the experimentally
obtained heat rates in Figure 4.6 and they did show a good agreement between
the two.
Figure 4.6 Self heat rate profile experimental and predicted for
different types crackers
(Atom bomb cracker ( ), Chinese cracker ( ), Palm leaf
cracker ( ), Predicted ( )
280 300 320 340 360 380 400 420
0.1
1
10
Temperature, (°C)

82

83
4.3.3 ARC Studies of Ground Spinner Tip and Flowerpot Tip
Mixtures
The ARC results for ground spinner tip mixture are presented in
Figures 4.7-4.9. Compared to DSC results, adiabatic calorimeter showed
interesting results for ground spinner tip mixture and ground spinner tip
mixtures with varying water content. The ground spinner tip mixture without
added water is marked as 0% in Figures 4.7-4.9. The time temperature curve
(Figure 4.7) shows two discontinuous exothermic activity at 160-190°C and
220-320°C. The first self heating rate process proceeds slowly compared to
the second event.
Figure 4.7 Time vs. Temperature plot for ground spinner tip mixture
and ground spinner tip mixture with different % of water
content
(0% ( ), 10% ( ), 20% ( ), 30%( ), 40%( ))
200 400 600 800 1000 1200 1400 1600 1800 2000 2200 2400 2600 2800 300060
80
100
120
140
160
180
200
220
240
260
280
300
320
340
360
380
400
Time, (min)

84
Figure 4.8 Temperature vs. Self heat rate plot for ground spinner tip mixture and ground spinner tip mixture with different % of water content
(0% ( ), 10% ( ), 20% ( ), 30%( ), 40%( ))
The self heating process for ground spinner tip mixture started at
220°C and peaked at 320°C with a heating rate of 100°C min-1. The self
heating process ended at this point perhaps due to complete depletion of the
sample. The sudden jump in self heat rate from 10-50°C and finally 100°C
min-1 (in a discontinuous manner) indicated the explosive nature of the
process. As the water content increased the exothermic onset point decreased.
The mixture with 40% water content showed the lowest onset point of 80°C.
The time required for exothermic initiations under dynamic heat-wait-seek
pattern was 300 minutes. Once the exothermic initiation occurred, in less than
100 minutes, the temperature rose to 300°C. Although the onset temperature
(120°C) for the mixture with 30% water content was higher, the behavior of
the exothermic event was similar to that of the mixture with 40% water
content, but with a higher end point i.e. 340°C. The mixtures with no water
60 80 100 120 140 160 180 200 220 240 260 280 300 320 340 360 380 4000.01
0.1
1
10
100
Temperature, (°C)

85
and 10-20% water (w/w) content underwent multiple exothermic events in the
temperature range of 140°C-380°C.
The self heat rate pattern observed for fireworks tip mixture
presented in Figure 4.8 showed the vigour of exothermic behavior of these
samples. The neat sample showed a maximum self heat rate of 100°C min-1at
320°C. The sample with 40% water (w/w) content released a maximum heat
of 40°C min-1at 300°C. The maximum heat releases for mixture containing
30, 20, 10% water (w/w) content were within 15°C min-1.
Figure 4.9 Temperature vs. Pressure plot for ground spinner tip
mixture and ground spinner tip mixture with different % of
water content
(0% ( ), 10% ( ), 20% ( ), 30%( ), 40%( ))
The pressure release profiles for mixtures are presented in
Figure 4.9. The self heating exothermic process for 40 and 30% water (w/w)
containing samples accompanied a maximum pressure release of 65, and 75
75 100 125 150 175 200 225 250 275 300 325 350 375 400
0
10
20
30
40
50
60
70
80
Temperature, (°C)

86
bar respectively. The samples with less than 30% water (w/w) content showed
pressure release of less than 20 bar, though that was comparatively less than
these of samples with 30 and 40% water (w/w) content.
The ARC results of flowerpot tip are presented in Figures 4.10-
4.12. Compared to DSC results, adiabatic calorimeter showed interesting
results for flowerpot tip mixture and mixture with 40% water content. The
neat sample showed an onset of 170.62°C but the sample with 40% water
content showed the lowest onset point of 95.71°C. The time required for
exothermic initiations under dynamic heat-wait-seek pattern was 475 minutes.
Once the exothermic initiation occurred, in less than 100 minutes, the
temperature rose to 210°C. Both the samples underwent multiple exotherm at
two different temperatures as shown in Figure 4.10.
Figure 4.10 Time vs. Temperature plot for flowerpot tip mixture and
flowerpot tip mixture with 40% of water content
(Flowerpot tip ( ), Flowerpot tip with 40% water ( ))
400 600 800 1000 1200 1400 1600 1800 200080
100
120
140
160
180
200
220
240
260
280
300
320
340
360
Time, (min)

87
The self heat rate pattern observed for flowerpot tip mixture
presented in Figure 4.11 showed the vigour of exothermic behavior of
these samples. The neat sample showed a maximum self heat rate of
143.48 °C min-1 at 339°C. The sample with 40% water (w/w) content
released a maximum heat of 4.19 °C min-1at 147.65 °C.
Figure 4.11 Temperature vs. Self heat rate plot for flowerpot tip mixture
and flowerpot tip mixture with 40% of water content
(Flowerpot tip ( ), Flowerpot tip with 40% water ( ))
The pressure release profiles for mixtures are presented in
Figure 4.12. The self heating exothermic process for neat sample and sample
with 40% water (w/w) containing samples accompanied a maximum pressure
release of 32, and 20 bar respectively.
80 100 120 140 160 180 200 220 240 260 280 300 320 340 3600.01
0.1
1
10
100
Temperature, (°C)

88
Figure 4.12 Temperature vs. Pressure plot for flowerpot tip mixture and
flowerpot tip mixture with 40% of water content
(Flowerpot tip ( ), Flowerpot tip with 40% water ( ))
4.3.4 Thermo Kinetics of Ground Spinner Tip Mixtures
Thermo kinetics for the thermal behavior of ground spinner tip for
dynamic heat-wait-search, and iso-ageing ARC tests were determined. The
thermo kinetic data are presented in Tables 4.2 and 4.4 respectively. The
reliability of Arrhenius kinetics has been checked by predicting self heat rate
by employing Arrhenius equation.
The activation energy was calculated for fireworks tip with 0%,
10%, 20%, 30%, and 40% water (w/w) are 81.04, 266.35, 164.94, 196.09, and
164.94 kJ mol-1 respectively. The pre-exponential factor was evaluated as
6.78 x 10²⁰, 3.57 x 10²³, 1.47 x 10¹³, 6.68 x 10²¹, and 9.17 x 10²⁰ min-1. Thus
the Arrhenius rate law for thermal decomposition of ground spinner tip for
different quantities of water (w/w) 0%, 10%, 20%, 30%, and 40% can be
given as Equations (4.16) to (4.20) respectively.
80 100 120 140 160 180 200 220 240 260 280 300 320 340 3600
5
10
15
20
25
30
Temperature, (°C)

89
k = 6.78 x 10²⁰ exp (-81.04/RT) (4.16)
k = 3.57 x 10²³ exp (-266.35/RT) (4.17)
k = 1.47 x 10¹³ exp (-164.94/RT) (4.18)
k = 6.68 x 10²¹ exp (-196.09/RT) (4.19)
k = 9.17 x 10²⁰ exp (-164.94/RT) (4.20)
The heat rates determined were compared with the experimentally
obtained heat rates in Figure 4.13 and they did show a good agreement
between the two.
Figure 4.13 Experimental and predicted self heat rates of thermal
decomposition of ground spinner tip mixture with different
% of water
(0% ( ), 10% ( ), 20% ( ), 30%( ), 40%( ), Predicted( ))
80 100 120 140 160 180 200 220 240 260 280 300 320 340 360
0.1
1
10
Temperature, (°C)

90

91
4.3.5 Thermo Kinetics of Flowerpot Tip Mixtures
Thermo kinetics for the thermal behavior of flowerpot tip for
dynamic heat-wait-search, and iso-ageing ARC tests were determined. The
thermo kinetic data are presented in Table 4.3 and 4.5. The reliability of
Arrhenius kinetics has been checked by predicting self heat rate.
The activation energy was calculated for flowerpot tip mixture and
flowerpot tip mixture with 40% water (w/w) are 171.99 and 167.54 kJ mol-1
respectively. The pre-exponential factor was evaluated as 3.11 x 10¹⁴ and
2.35 x 10²¹ min-1 respectively. Thus the Arrhenius rate law for thermal
decomposition of flowerpot tip mixture and mixture with 40% water (w/w)
can be given as Equations (4.21) and (4.22) respectively.
k = 3.11 x 10¹⁴ exp (-171.99 / RT) (4.21)
k = 2.35 x 10²¹ exp (-167.54 / RT) (4.22)
The heat rates determined were compared with the experimentally
obtained heat rates in Figure 4.14 and they did a good agreement between the
two. For kinetic treatment, the initial portion of exotherm alone is sufficient;
since the interest lies in knowing the Arrhenius constants for the onset of
exothermic activity and not for the entire exothermic region. Furthermore, as
the reaction progresses, complexity may arise due to onset of secondary
decompositions.

92
Figure 4.14 Experimental and predicted self heat rate plot for flowerpot
tip mixture
(Flowerpot tip ( ), Flowerpot tip with 40% water ( ),
Predicted ( ))
80 100 120 140 160 180 200 220 240 260 280 300 320 340 3600.01
0.1
1
10
100
1000
Temperature, (°C)

93

94
4.3.6 ARC Iso-Ageing Studies for Ground Spinner Tip Mixture
The ARC outputs for ground spinner tip mixture containing 40%
water (w/w) were subjected to iso-ageing test in ARC in the temperature
range of 40-75°C (Figures 4.15-4.18). The temperature range chosen here was
based on the dynamic ARC results presented in the previous section and
involvement of these mixtures in frequent accidents in the industry.
Figure 4.15 Time vs. Temperature plot for ground spinner tip mixture
at various iso-ageing temperatures
(40°C ( ), 47.5°C ( ), 50°C ( ), 55°C ( ), 60°C ( ), 65°C
( ), 75°C ( ))
A simple view of the time versus temperature profile shown in
Figure 4.15 at various iso-ageing temperatures confirmed the vigourous
thermal behavior of the mixtures. Irrespective of the iso-ageing (thermal
history) conditions all the samples show a single sharp rise to a final
temperature within a short duration from the onset point. The onset point for
0 250 500 750 1000 1250 1500 1750 2000 2250 2500 2750 3000 3250 3500 3750 4000
40
60
80
100
120
140
160
180
200
220
240
260
280
Time, (min)

95
the thermal event was dependent on the initial iso-ageing temperature. Lowest
onset of 40°C was recorded for the mixtures. The time needed to initiate the
event depended on the initial iso-ageing temperature. At the lower iso-ageing
temperature (40°C), longer time was taken to initiate the event.
Thus, this study, perhaps for the first time, could successfully
correlate the accident occurring conditions. More or less close to ambient
conditions considered here exist in the southern districts of Tamilnadu, India,
where a major firework manufacturing is carried on.
Figure 4.16 Self heat rate plot for ground spinner tip mixture at various
iso-ageing temperatures
(40°C ( ), 47.5°C ( ), 50°C ( ), 55°C ( ), 60°C ( ), 65°C
( ), 75°C ( ))
The self heat rate plots presented in Figure 4.16 depict the vigour of
the exothermic event. Interestingly the experimental runs at lower iso-ageing
temperatures (although too long to initiate the event) showed maximum self
heat release rates i.e. 40°C is 37°C min-1, 47.5°C is 30°C min-1 and 50°C is
40 60 80 100 120 140 160 180 200 220 240 260 280
0.1
1
10
Temperature, (°C)

96
25°C min-1. The self heat rate release curves also showed multiple steps in
their pattern; the first trend from onset to maximum heat release rate followed
by a drop at the temperature range 100 - 140°C, the second slower exothermic
activity picking up from 110 - 120°C to reach a final temperature range of
185- 260°C. This behavior was a clear indication of operation of two different
reaction mechanisms for the exothermic events.
The heat rates determined were compared with the experimentally
obtained heat rates in Figure 4.17 and they did show a good agreement
between the two.
Figure 4.17 Experimental and predicted self heat rates plot for ground
spinner tip mixture at various iso-ageing temperatures
(40°C ( ), 47.5°C ( ), 50°C ( ), 55°C ( ), 60°C ( ), 65°C
( ), 75°C ( ), Predicted ( ))
40 45 50 55 60 65 70 75 80 85 90 95 100 105 110 115 120
0.1
1
10
Temperature, (°C)

97
Figure 4.18 confirmed the pressure release during the exothermic
events. In fireworks industry, the unused water mixed with ground spinner tip
mixture was left overnight at the end of the day for next day use. Explosive
accidents were reported after shutting down the factory. The iso-ageing
studies could be correlated to blast accidents in fireworks industry involving
ground spinner tip mixture.
Figure 4.18 Temperature vs. Pressure plot for ground spinner tip
mixture at various iso-ageing temperatures
(40°C ( ), 47.5°C ( ), 50°C ( ), 55°C ( ), 60°C ( ), 65°C
( ), 75°C ( ))
40 60 80 100 120 140 160 180 200 220 240 260 280-5
0
5
10
15
20
25
30
35
40
45
50
55
60
65
Temperature, (°C)

98

99
4.3.7 ARC Iso-Ageing Studies for Flowerpot Tip Mixture
The ARC outputs for flowerpot tip mixture containing 40% water
(w/w) were subjected to iso-ageing in the temperature range of 40 °C
(Figures 4.19-4.21). A simple view of the time versus temperature profile
shown in Figure 4.19 at iso-ageing temperature confirmed the vigourous
thermal behavior of the mixtures.
Figure 4.19 Time vs. Temperature plot for flowerpot tip mixture with
40% water at 40°C iso-ageing temperature
The self heat rate plots presented in Figure 4.20 depict the vigour of
the exothermic event. Interestingly the experimental runs at 40°C iso-ageing
temperatures (although too long to initiate the event) showed maximum self
heat release rates of 30.62 °C min-1. The self heat rate release curves also
showed multiple steps in their pattern; the first trend from onset to maximum
3580 3600 3620 3640 3660 3680 3700 3720
40
60
80
100
120
140
160
180
200
220
240
Time, (min)

100
heat release rate followed by a drop at the temperature range 80-120°C, the
second slower exothermic activity picking up from 120-220°C to reach a final
temperature range of 220-230°C. This behaviour was a clear indication of
operation of two different reaction mechanisms for the exothermic events.
Pressure profile in Figure 4.20 confirmed the pressure release during the
exothermic events.
Figure 4.20 Self heat rate plot and pressure plot for flowerpot tip
mixture with 40% water at 40°C iso-ageing temperature
(Self heat rate ( ), Pressure ( ))
40 60 80 100 120 140 160 180 200 220 240
0.1
1
10
100
Temperature, (°C)
0
5
10
15
20
25
30
35
101
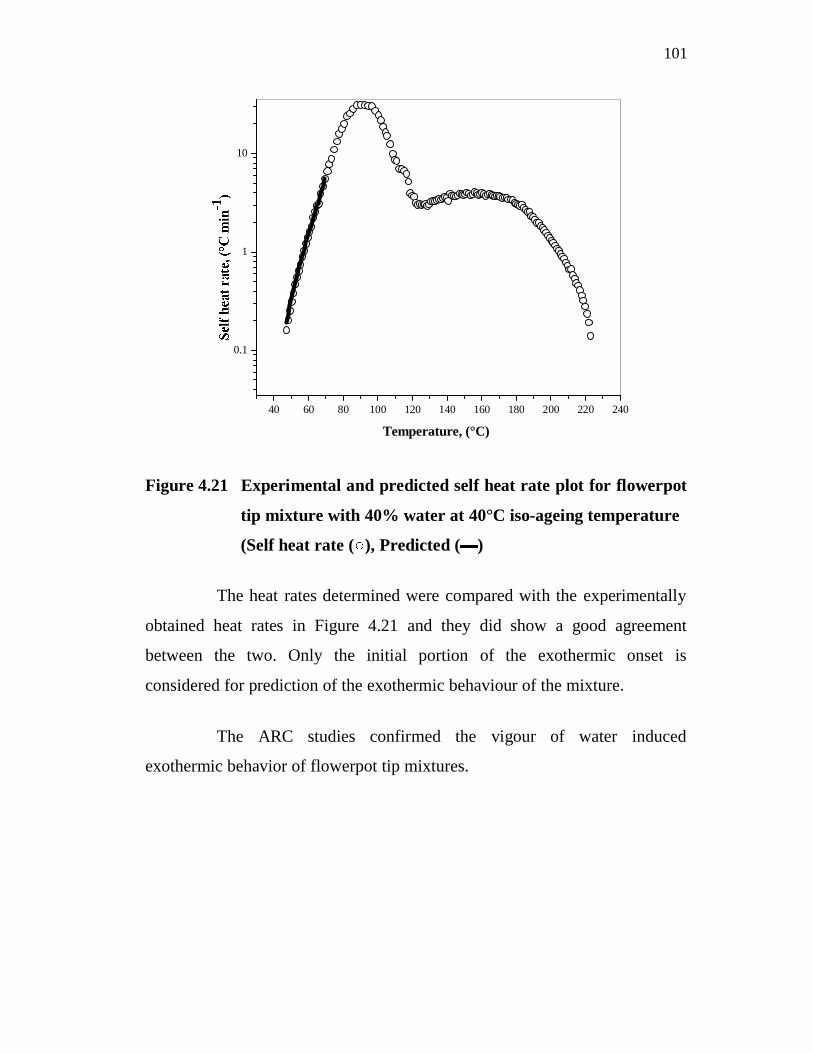
Figure 4.21 Experimental and predicted self heat rate plot for flowerpot
tip mixture with 40% water at 40°C iso-ageing temperature
(Self heat rate ( ), Predicted ( )
The heat rates determined were compared with the experimentally
obtained heat rates in Figure 4.21 and they did show a good agreement
between the two. Only the initial portion of the exothermic onset is
considered for prediction of the exothermic behaviour of the mixture.
The ARC studies confirmed the vigour of water induced
exothermic behavior of flowerpot tip mixtures.
40 60 80 100 120 140 160 180 200 220 240
0.1
1
10
Temperature, (°C)

102

103
4.4 PROCESS SAFETY
4.4.1 ARC Results and their Impact on Process Safety of Cracker
Mixtures
Fireworks mixtures are vulnerable to thermal hazards. ARC data
are used for determining the ceiling temperature for processing, handling and
transportation of hazardous materials. The practice adopted is that the
process/handling temperature should be 100°C below the onset temperature
observed in ARC. This rule has been in practice in process chemical industry
for safe and successful operation of process plants, storage systems and
transportation. On these considerations, in case of atom bomb cracker,
Chinese fire cracker and Palm leaf cracker the ceiling temperature should
never exceed 175°C, 195°C, and 191°C respectively. Although there is no
possibility of reaching this temperature during normal mixing and packing
process of these mixtures, the chances of thermal explosions cannot be ruled
out. This is because the onset temperature can be achieved under situations
like heat radiation from neighbouring area or ignition from unknown sources,
subjecting these mixtures to impact (dropping the mixture containing boxes
leading to impact stimulus) and friction (dragging the mixture compositions
leading to the generation of sparks as a result of friction stimulus). During
such abnormal situations the cracker mixture is vulnerable to hazard.
Further, impact and friction sensitivity can also lead to triggering of
explosive decompositions. As of now, there is no direct correlation available
between thermal, impact and frictional sensitivity, either to predict one or the
other or to predict which of these forces can come together to trigger a
thermal explosion. We hypothesize that impact or frictional stimulus onsets
the thermal stimuli for the fireworks mixture to undergo thermal explosion.
Under severe impact or friction stimuli, thermal stimuli can occur

104
immediately, and this can lead to a catastrophic thermal explosion.
Irrespective of the nature of the stimuli, explosion occurs through thermal
mechanism only. This means that, for these mixtures, the impact or any other
stimulus can only initiate the thermal mechanism by providing the minimum
threshold energy needed/necessary to raise the onset temperature observed
experimentally for thermal explosion in ARC. Therefore it is possible to relate
the mechanical form of energy with the threshold energy ( E) observed in the
ARC. ARC study provides a means of suggesting a predictive correlation in
such explosive systems. Nevertheless the degree of explosivity also depends
on other factors such as compactness, particle size and shape and other
environmental conditions.
4.4.2 ARC Results and their Impact on Process Safety of Tip
Mixtures
The ARC studies for fireworks tip mixture confirmed that the
trigger of exothermic activity could be possible at ambient conditions. The
fireworks tip mixture is involved in triggering accidents often in fireworks
industry, when the remaining quantities of these mixtures are left over night.
The water in the mixture slowly dries; the exothermic activity induced during
drying of water appears to be responsible for accidents. Most of the fireworks
industry accidents (reported in media) have occurred either late at night or
early in the morning. Therefore, from this study the following precautions are
given to the fireworks industry.
The unutilized fireworks tip mixture should be appropriately
disposed off at the end of each day.
During the manufacture of fireworks, it should be ensured that
the ambient temperature should be less than 30°C.

105
Effect of impact and friction stimulus should be analysed, as
these could trigger accidents.
As ARC studies presented here have shown such acts have the
potential to initiate exothermic activity at ambient conditions. For the first
time the reasons for accident triggering at closer to ambient conditions and the
culprit mixture have been identified.
4.5 SUMMARY
ARC studies of the atom bomb cracker, Chinese cracker and palm
leaf cracker have revealed that all the above mixtures are susceptible to
thermal decomposition. The thermal decomposition contributes to substantial
rise in system pressure. The onset temperature for explosive decomposition
observed in accelerating rate calorimeter is however the minimum
temperature for triggering an accident. In practice this temperature can be
attained by thermal and mechanical stimulus. Therefore these mixtures are to
be handled carefully. The thermo kinetic studies revealed that the mixtures
follow first order Arrhenius Kinetics and the kinetic data are validated by
comparing the predicted self heat rates with the experimental data.
The sharp and sudden rise in temperature shows the
vulnerability of these mixtures to undergo violent
decomposition. The discontinuity in both the self heat rate plot
and time versus temperature plot is indicative of multiple
exothermic activities.
The self heat rate plot shows a maximum heat release rate of
1088.1°C min-1 at 320°C. The observed large heat release rate

106
confirms the vigour of exothermic explosive process of atom
bomb cracker mixture.
One gram of atom bomb cracker mixture can contribute to a
peak pressure rise of 25.9 bar at 342.3°C.
The ARC data showed that the fireworks mixture
decomposition process under adiabatic condition was vigourous
and therefore dangerous. Although explosive potential is
required for it to be a cracker, the same property can be
dangerous if the event occurs during handling, manufacturing,
storage or transport.
Both Chinese and palm-leaf crackers show delayed onset
temperatures of 295°C and 290°C respectively as compared to
the atom bomb cracker mixture. The delay in initiation of the
exothermic activity can be related to their composition,
especially the quantity of the oxidiser KNO3.
While the percentage of KNO3 in palm-leaf is less than that of
Chinese cracker, early onset is perhaps due to the presence of
another oxidiser Ba(NO3)2 and a large quantity of different
grades of aluminium
The time versus temperature plot shows that the exothermic
activity is sudden and sharp as observed with atom bomb
cracker mixture.
ARC studies of the fireworks tip mixture have revealed that the
above mixture is susceptible to thermal decompositions at ambient conditions.
The thermal decomposition contributes to substantial rise in system pressure.

107
The onset temperature for explosive decomposition observed in accelerating
rate calorimeter is however the minimum temperature for triggering an
accident. In practice this temperature can be attained by thermal and
mechanical stimulus. Therefore, this mixture is to be handled carefully. The
thermo kinetic studies revealed that the mixture follows first order Arrhenius
kinetics and the kinetic data are validated by comparing the predicted self heat
rates with the experimental data.
A second self heating process for the ground spinner tip mixture
started at 220°C and peaked at 320°C with a heating rate of
100°C min-1; the self heating process ended at this point perhaps
due to complete depletion of the samples. The sudden jump in
self heat rate from 10 to 50 °C min-1and finally 100°C min-1 (in
a discontinuous manner) indicated the explosive nature of the
process.
The time vs. temperature plot of ground spinner tip shows two
discontinuous exothermic activities 160-190°C and 220-320°C.
The first self heating rate process proceeds slowly compared to
the second event.
Thus the self heating nature of the ground spinner tip mixture
and its reactive thermal hazards with water necessitated the
study of the behaviour of these samples under iso-ageing
conditions.
The neat mixture showed a maximum self heat rate of 143.48
°C min-1 at 339°C. The sample with 40% water (w/w) content
released a maximum heat of 4.19°C min-1at 147.65 °C.

108
The self heating natures of the ground spinner tip mixture and
its reactive thermal hazards with water under iso-ageing
conditions showed a lowest onset temperature of 40°C.
The self heating exothermic process for neat sample and sample
with 40% water (w/w) containing samples accompanied a
maximum pressure release of 32, and 20 bar respectively.