chapter 4 profitability analysis -...
TRANSCRIPT

Chapter 4
Profitability Analysis
Introduction
Profitability is the result of financial as well as operational
efficiency of a business organisation. Assessment of the financial
position of the CSMs will be incomplete, if the overall profitability of the
business organisation is not evaluated thoroughly. Therefore, an
attempt is made to evaluate the profitability of the five sample CSMs
with the help of gross profit ratio, net profit ratio and return on
investment ratio in this chapter.
Concept of profit and profitability
Profit is generally known as the excess total revenue over total
costs. Profit is the main motivating force for the business activities.
Profits are the report card of the past and the inventive gold star for the
future. If an enterprise fails to make profit, capital invested is eroded
and if this situation prolongs, the enterprise ultimately ceases to exist1.
Profit is the whetstone of the operational performance and the
touch stone of financial stability. Profit which is the surplus of business
income over business expenditure, provides for
i] adequate returns to investors,
ii] replacement of fixed assets,
iii] improved standard for the workers and
iv] expansion of the business.,

■Ml'WWiWBWaBK
especially in an inflationary environment2. Profit is, therefore,
considered as soul of the business management.
According to Lord Keynes, profit is an engine that drives
business enterprise3. It is comprehensive indicator of the ability of the
management to coordinate the functions of planning, decision making
and administration. Therefore, it is considered as the primary measure
of the success of business management4.
It is true that the modern concept of financial management is
concerned with maximisation of wealth as against profit maximisation
that has found a significant place in economics. It must, however, be
pointed out that it is profit that provides wealth5. Therefore the
business executives emphasise return on investments rather than
maximisation of wealth6.
Profits determine the liquidity and solvency of the firm. They
serve as yardstick for judging the competence and efficiency of the
management. Profits are essential for the purpose of financing future
activities7.
Profit maximisation is the art of making as much profit as
possible for a business organisation. This is a slogan which raises
several questions. Over what time horizon, are profits to be maximised?
There is likely to be a conflict between short-run and long-run growth.
If the aim is maximising the present discounted value of all future
profits, what is the correct discount rate to be used? Profit maximisation
83
is a sensible objective, only if the owners are risk-neutral. There is
normally a trade off to be made between risk and mean expected
profits. Also the directors or owners may have their own objectives,
these range from desire for a large empire or jobs for their relatives or
the concern about environment. All these have to be traded off against
profit. Other things being equal, however, businesses prefer higher
profits8.
Keirstead (1959) expressed the view that profits originate from
monopoly, successful innovation and a correct estimation of uncertain
factors either particular to the industry or general to the whole
economy9.
The major objective of any business activity is to maximise it’s
wealth through profit. Profit planning is a disciplined method, whereby
the environs impinging on an organisation are analysed, the available
resources and internal competencies are identified and plans are made
to achieve them. It is a routine work and covers a definite span.
Initially, it is concerned with the gap analysis and evaluation of reasons
for the variations in the financial plan and the actuals10.
Profits are essential for a business organisation. But it is not
correct, if the organisation aims at maximising profit, without
concerning the social consequences. It is a misfortune that the word
“profit” is used in wrong sense that the business enterprise should
maximise profits at the cost of employees, customers and society.
84

Nevertheless, any business organisation should earn adequate profits to
sustain it’s operation so as to receive funds from investors for it’s
growth and to serve the society.
Howard and Upton observed, “the word profitability may be
defined as the ability of a given investment to earn a return on it’s
use .
Weston and Bringham observed that profitability is the net19
surplus of a large number of policies and decisions . Thus, profitability
is the ability of business organisation to earn profits as an absolute
figure alone will not help to assess the adequacy of income or changes
in efficiency as shown by the financial performance of a business
organisation. The remaining final profit in absolute quantities may rather
be confusing and it will be difficult to interpret due to variations in the
size of investments and/or the volume of sales. Therefore, it becomes
necessary to relate profit figures either to the volume of sales or to the
quantum of investment and thereby we have to derive quantitative
relationship in the form of either ratios or percentages. Thus, profit is
an absolute connotation, whereas profitability is a relative concept.
Inspite of the several social objectives to be fulfilled by the
CSMs, it is necessary to earn minimum rate of return on the capital
employed atleast for their existence. Also the profit earned by the
CSMs gives margin of safety to the sundry creditors and it is a source
of fringe benefits or welfare measure to the employees. If profit is
85

earned by CSMs, the price of the yarn can be reduced by giving rebates
to the customers, Thus, the importance of profit and profitability for
the CSMs is significant.
Determinants of profitability
There are several factors influencing profitability. Factors such
as size of firm, scale of operation, efficiency of technology, market
concentration, product diversification and vertical integration are among
those causes which result in inter-industry and inter-firm differences in
profitability . Also market conduct of the firm comprising adver
tisement, marketing strategy, pricing, etc., have considerable
implication for profitability.
However, it is very difficult to identify these factors and the task
of gauging their influence on profit, even with the help of the most
powerful computers is further more formidable one.
However, the businessmen and the investors will look upon the
following few elements.
i] Past profit - a steady upward trend is ideal, but caution against
creative accounting is necessary.
ii] Past sales and present market trends - many help by advising how
to move the stuff out of the warehouse and so they allot much more
importance to marketing ability.
iii] Existing demand for the product.
iv] Probable changes in competition.
86

v] Economic outlook.
vi] Company’s ability to control costs.
There are three ways for maximising profit (viz.)
i] increasing price,
ii] reducing price and increasing volume of sales and
iii] reduction of cost14.
Whereas the price and volume of sales are influenced by many
external factors, reduction of cost is fairly under the control of
management.
Measure of profit
There are many measures to assess profitability of a business.
' They comprise the following.
1. Net profit margin
2. Total assets turnover
3. Return on assets
4. Dupont return on assets
5. Operating income margin
6. Operating assets turnover
7. Sales to fixed assets
8. Return on operating assets
9. Return on investment (ROI)
10. Return on total equity
11. Return on common equity
12. Gross profit margin.

The above represent the standard measures that most analysis
and texts usually refer to in the course of an analysis of profitability15.
• These measures are meant to serve different purposes. For
example, net profit margin refers to the net surplus realised by the
business and the next three ratios will throw light on the efficiency in
utilisation of assets. Similarly, return to common equity helps to
evaluate the performance of the business in earning rewards for the
shareholders.
However, the well-known concepts of determining profitability
are gross profit ratio, operating profit ratio, net profit ratio and return
on investments.
Gross profit is realised after prime cost and factory on cost are
met from the sales revenue. The gross profit ratio will facilitate the
evaluation of efficiency of management in controlling over the cost of
sales (prime cost and factory on cost) and prices. Net profit after tax is
the surplus of gross profit after the office on cost and selling and
distribution on cost are met out that can be claimed by the owners of
the business. Therefore, the net profit ratio to sales helps in assessing
the feasibility of the scale of operations and management of overheads.
The third important measure of profitability is the Return on Investment
(ROI) by which the net profit after tax is related to total capital
employed by the business. This helps to find out whether the precious
capital has been profitably employed in the business. Thus, ratio of
88

gross profit to sales, ratio of net profit to sales and the ratio of net
profit to investments or capital employed have been chosen in this study
for evaluating the management of prime cost and factory on cost,
viability of scale of operation and effective utilisation of investments.
Gross profit ratio
Gross profit ratio relates to gross profit to sales. Gross profit is
the surplus of sales revenue over and above the cost of production
(prime cost and factory overheads). Since prime cost is the major part
of cost of production, gross profit ratio becomes crucial indicating the
efficiency of management of cost of production as well as choice of
pricing strategy and achievement in sales.
Net profit ratio
Net profit ratio relates to net profit after tax to sales. Since net
profit is the surplus of gross profit over fixed costs (office on cost and
selling distribution on cost), the net profit ratio shows the extent of
managerial efficiency in controlling over the fixed costs.
Return on Investment (ROI)
Net profit after tax is related to total capital employed by the
business in the form of return on investments. Therefore ROI helps to
evaluate utilisation of resources in the business. Thus, ROI will be a
measure of the productivity of capital, guiding decision on investments.
In ROI, investment comprises share capital, long term loan, accumulated
profit and reserves including depreciation reserve. The interval
89

between investments and net profit involves time value of money and
therefore, investments have been compounded to the years of net profit
The compounding factor is the weighted average of the interest rate in
each CSM. Closing balance of investment of the preceding year has
been compounded and added to the investments during the current year
for computation of investments for ROI.
Multiple Regression Analysis
Multiple Regression Analysis has been employed for identifying
the reasons of profit/loss. Since presence of irrelevant independent
variable may vitiate the results of enter-regression method, the study
has used step-wise regression method, discarding irrelevant
independent variables and accepting relevant independent variables,
influencing profitability models.
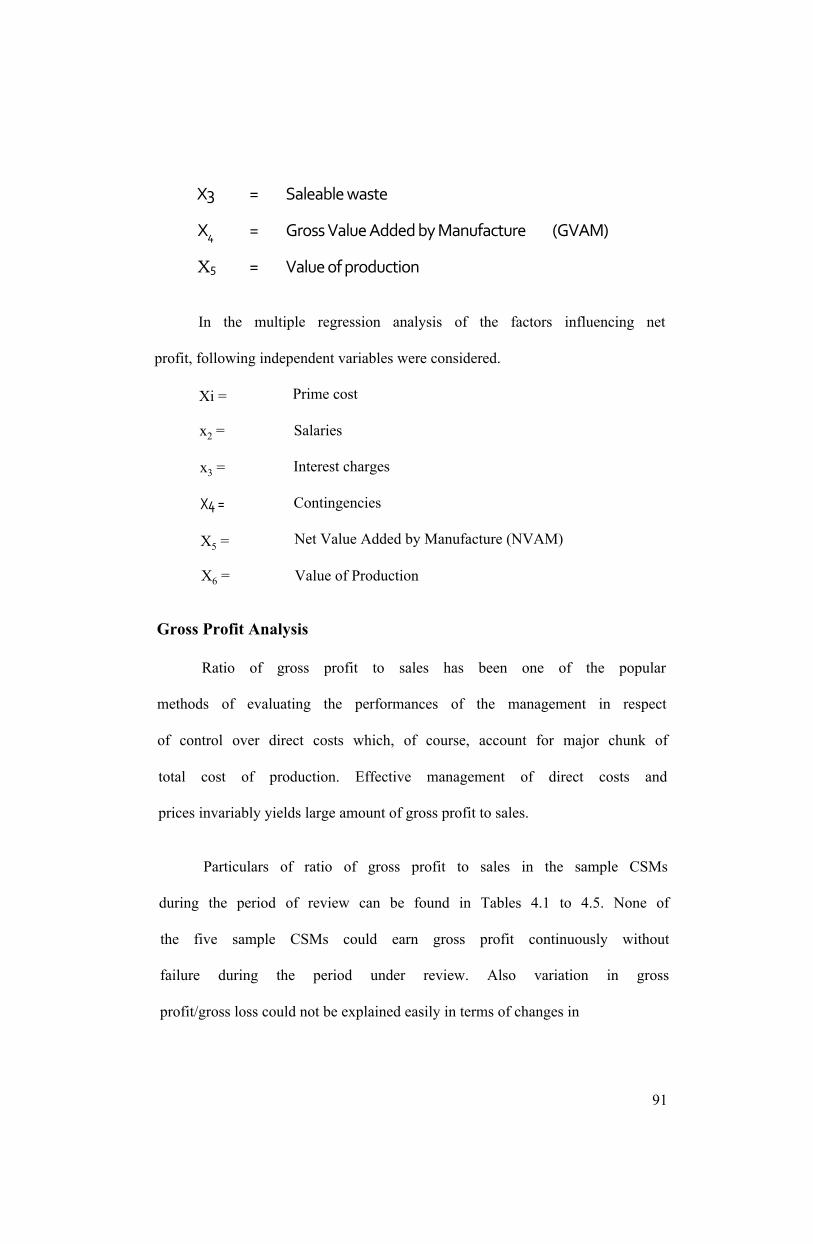
In the multiple regression analysis of the factors influencing net
profit, following independent variables were considered.
X3 = Saleable waste
X4 = Gross Value Added by Manufacture (GVAM)
X5 = Value of production
Xi = Prime cost
x2 = Salaries
x3 = Interest charges
X4 = Contingencies
X5 = Net Value Added by Manufacture (NVAM)
X6 = Value of Production
Gross Profit Analysis
Ratio of gross profit to sales has been one of the popular
methods of evaluating the performances of the management in respect
of control over direct costs which, of course, account for major chunk of
total cost of production. Effective management of direct costs and
prices invariably yields large amount of gross profit to sales.
Particulars of ratio of gross profit to sales in the sample CSMs
during the period of review can be found in Tables 4.1 to 4.5. None of
the five sample CSMs could earn gross profit continuously without
failure during the period under review. Also variation in gross
profit/gross loss could not be explained easily in terms of changes in
91

sales. In almost all the CSMs, gross loss often coincided with significant
rise in sales.
Ramanathapuram District Co-operative Spinning Mills Ltd., Achankulam (RSM)
Particulars of gross profit ratios of RSM can be found in Table
4.1. This CSM made gross profit in the first three years and in 1996-97
with gross profit ratios declining continuously from 11.86 percent to
1.35 percent. During the first three years, value of sales continuously
rose from 387.80 lakh rupees in 1989-90 to 456.25 lakh rupees in
1991-92, but gross profit fell from 45.99 lakh rupees in 1989-90 to
8.07 lakh rupees in 1991-92. Even the highest sales at 1020.88 lakh
rupees in 1995-96 could not prevent gross loss of 48.31 lakh rupees.
Yet in the very next year, sales of 899.24 lakh rupees could yield gross
profit of 12.14 lakh rupees.
Therefore, RSM lacks control over direct costs and prices which
need strong management. In RSM gross profits were earned in the
years which had high value of NVAM as in 1989-1992. Again
substantial gross loss was incurred in the years marked by very low
amount of NVAM as in 1992-93, 1994-95 and in the last three years
(vide Table 3.2).
Regression analysis of gross profit yielded three models
involving value of production, GVAM and material cost. While value of
production accounted for 47.00 percent of variation in gross profit,
GVAM influenced 34.00 percent and material cost accounted for 14.30
92

Table 4.1 Ramanathapuram District Co-operative
Spinning Mills Ltd., Achankulam (RSM) Gross Profit Ratio
(Rs. in lakhs)SI. Gross Value of Gross ProfitNo. Year profit sales in Rs. ratio in %
in Rs. [% x 100](1) (2) (3) (4) (5)
1 1989-1990 45.99 387.80 11.86
2 1990-1991 38.85 418.96 9.27
3 1991-1992 8.07 456.25 1.77
4 1992-1993 (-)59.80 551.10 -
5 1993-1994 (-)28.88 567.10 -
6 1994-1995 070.53 683.20 -
7 1995-1996 048.31 1,020.88 -
8 1996-1997 12.14 899.24 1.35
9 1997-1998 078.86 833.76 -
10 1998-1999 065.99 694.22 -
11 1999-2000 036.88 689.70 -
Mean 2.20
' Regression models of RSM
Equations R2 df FYj = 72.613 - 0.127x5
(0.045) 0.470 1,9 7.996*
Yu = 32.183 - 0.20rX5 + 0.575”x4 (0.036) (0.152) 0.810 2,8 17.021”
Y in = 33.107 - 0.506-xs + 0.798"x4 + 0.395"xi (0.067) (0.094) (0.085)
0.953 3,7 47.535”
* - Significant at 5 percent level of probability ** ~ Significant at 1 percent level of probability Figures in brackets are respective standard errorsSource : Computed from the Annual Audited Statement of Final Accounts of RSM
93

percent of variation in gross profit. An increase of one lakh rupees in
production would reduce gross loss by fifty thousand rupees.
Expansion of GVAM by one lakh rupees would raise gross profit
by eighty thousand rupees, whereas reduction of one lakh rupees in
material cost would add forty thousand rupees to gross profit. It is,
therefore, necessary to improve value addition especially through
reduction of material cost for improvement of gross profit of the CSM.
Srivilliputhur Co-operative Spinning Mills Ltd., Srivilliputhur (SSM)
Data on gross profit ratios of SSM are furnished in Table 4.2.
This CSM incurred gross loss in seven out of eleven years. In the
remaining four years, it earned gross profit with gross profit ratio falling
from 13.48 percent in 1989-90 to 2.02 percent in 1996-97. Thus,
gross profit ratios show continuous declining trend. Huge gross loss of
Rs.l 15.58 lakh during the year 1997-98, despite substantial sales of
Rs. 1,745.22 lakh, indicated that the problem was mainly in control over
direct costs and prices. In SSM also, gross profit and minimisation of
gross loss are found to be associated with significant increase in NVAM
as in 1989-90, 1990-91, 1993-94 and 1994-95. Similarly sharp
increase in gross loss was incurred during 1997-99, marked by
significant fall in the amount of NVAM (vide Table 3.2).
The regression analysis reveals that the saleable waste was the
most crucial factor influencing 45.60 percent of the variation in gross
profit. Reduction of saleable waste by one lakh rupees would raise
94
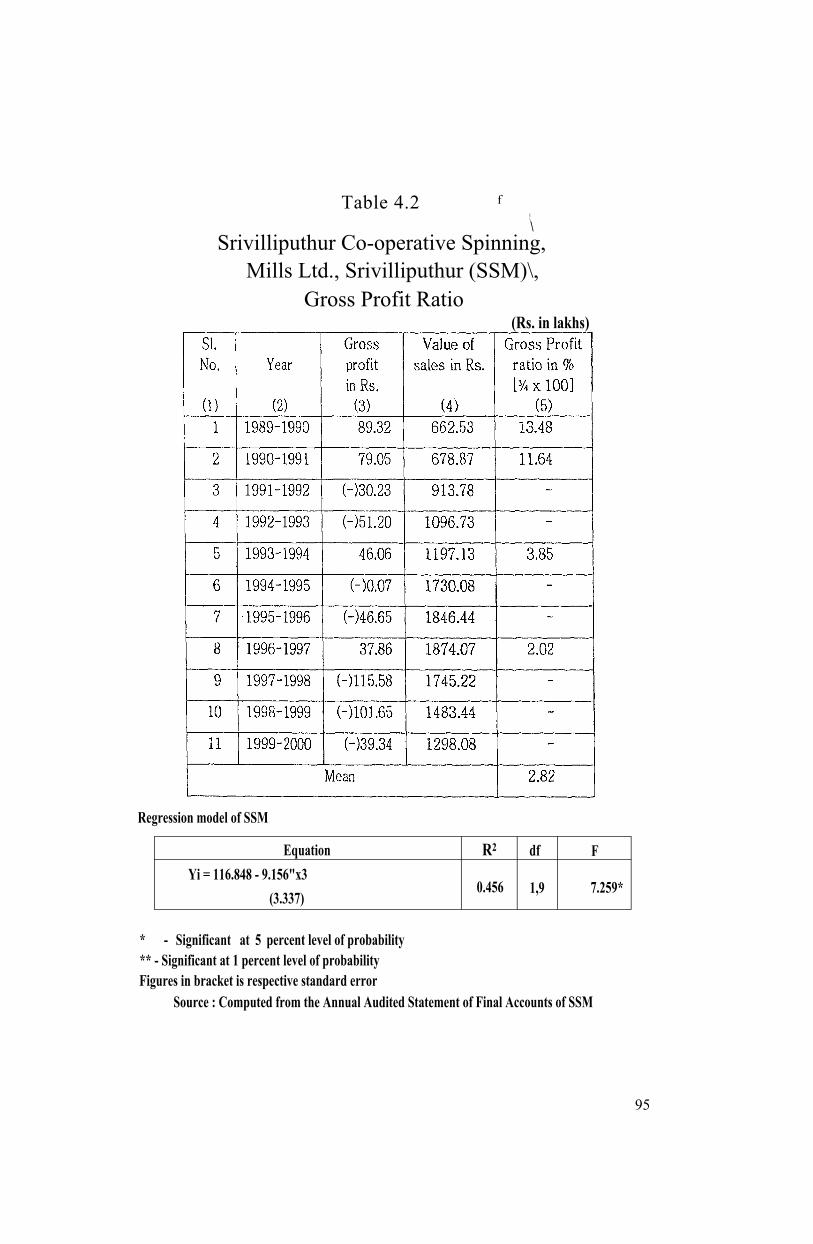
i\\
Srivilliputhur Co-operative Spinning, Mills Ltd., Srivilliputhur (SSM)\,
Table 4.2 f
Gross Profit Ratio(Rs. in lakhs)
Regression model of SSM
Equation R2 df FYi = 116.848 - 9.156"x3
(3.337)0.456 1,9 7.259*
* - Significant at 5 percent level of probability** - Significant at 1 percent level of probability Figures in bracket is respective standard error
Source : Computed from the Annual Audited Statement of Final Accounts of SSM
95
gross profit by nine lakh rupees. Therefore the unit should concentrate
on purchase of material inputs of appropriate quality, thus minimising
saleable waste. Other crucial factors like material cost, labour cost,
GVAM and value of production make insignificant contribution towards
gross profit. However, the above remedial measures are bound to raise
value addition and thereby profitability.
Thiruchirapalli District Co-operative Spinning Mills Ltd., Karur (TSM)
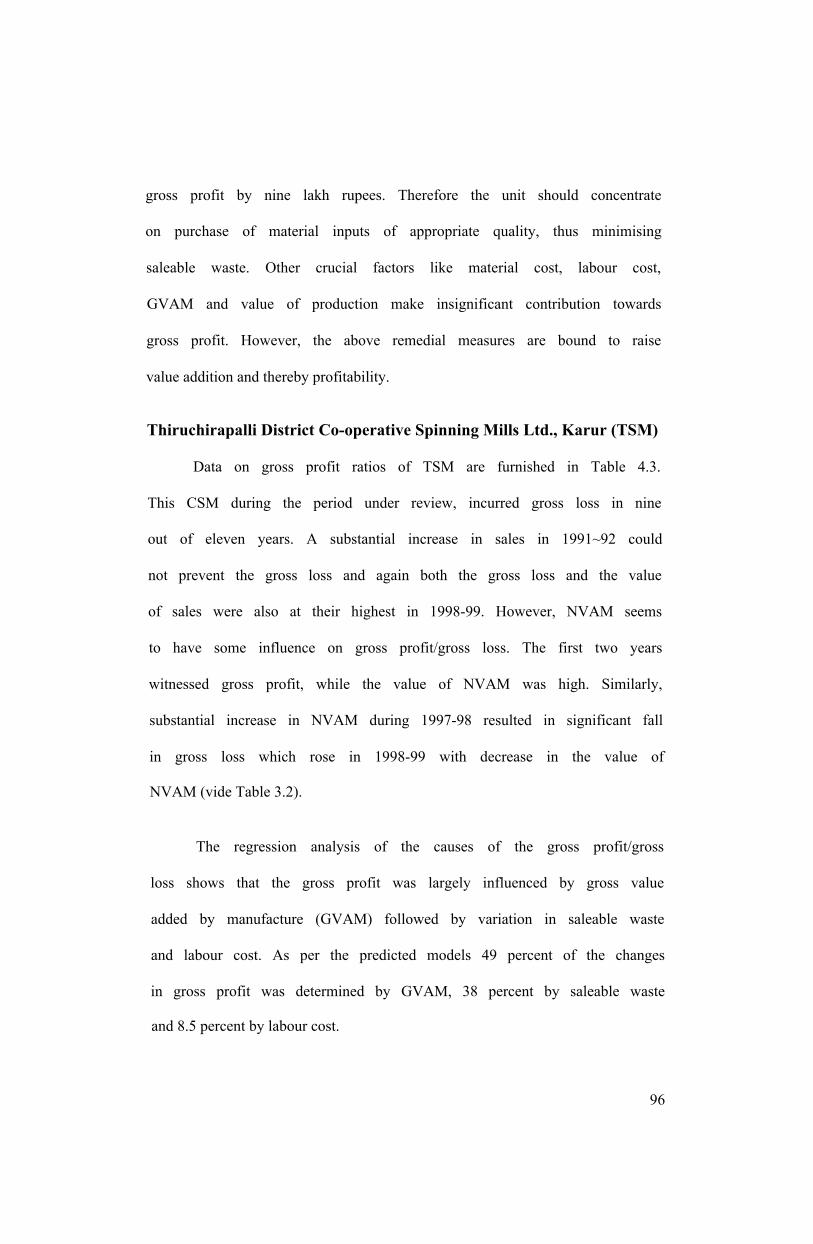
Data on gross profit ratios of TSM are furnished in Table 4.3.
This CSM during the period under review, incurred gross loss in nine
out of eleven years. A substantial increase in sales in 1991~92 could
not prevent the gross loss and again both the gross loss and the value
of sales were also at their highest in 1998-99. However, NVAM seems
to have some influence on gross profit/gross loss. The first two years
witnessed gross profit, while the value of NVAM was high. Similarly,
substantial increase in NVAM during 1997-98 resulted in significant fall
in gross loss which rose in 1998-99 with decrease in the value of
NVAM (vide Table 3.2).
The regression analysis of the causes of the gross profit/gross
loss shows that the gross profit was largely influenced by gross value
added by manufacture (GVAM) followed by variation in saleable waste
and labour cost. As per the predicted models 49 percent of the changes
in gross profit was determined by GVAM, 38 percent by saleable waste
and 8.5 percent by labour cost.
96

Table 4.3
Thiruchirapalli District Co-operative
Spinning Mills Ltd., Karur (TSM)Gross Profit Ratio
(Rs. in lakhs)
SI.No.
(1)
Year
(2)
Gross profit in Rs.
(3)
Value of sales in Rs.
(4)
Gross Profit
ratio in % [V* x 100]
(5)1 1989-1990 125.31 849.11 14.76
2 1990-1991 118.01 792.81 14.89
3 1991-1992 R50.13 1142.35 -
4 1992-1993 H86.47 946.76 -
5 1993-1994 (-)32.20 1028.35 -
6 1994-1995 (->154.90 843.89 -
7 1995-1996 (-)156.57 613.28 -
8 1996-1997 (-)63.81 685.14 -
9 1997-1998 (-)21.93 1366.02 -
10 1998-1999 (~)180.43 2254.30 -
11 1999-2000 (-)64.19 957.85 -
Mean 2.70
Regression model of TSM
Equation R2 df FYt = - 83.299 + 0.826%- 0.712* x2 - 4.892'xa
(0.088) (0.177) (1.287)0.959 3,7 54.685”
** ~ Significant at 1 percent level of probability Figures in brackets are respective standard errorsSource : Computed from the Annual Audited Statement of Final Accounts of TSM
97
If TSM could improve GVAM by one lakh rupees, gross profit
would go up by Rs.82,600. Similarly, if labour could be reduced by one
lakh rupees, the increase in gross profit would be Rs.71,200. When the
saleable waste is reduced by one lakh rupees, gross profit would move
up by 4.89 lakh rupees.
Mere increase in sales would not improve gross profit. The
analysis reveals that value addition through control over direct costs
and prices alone would raise gross profit and reduction of saleable
waste would be a vital component in this strategy.
Anna Co-operative Spinning Mills Ltd., Andipatty (ASM)
Data on gross profit ratios of ASM are furnished in Table 4.4.
This CSM has posted better performance than other sample CSMs
making gross profit in seven out of eleven years. However, this CSM
also has suffered from almost continuous fall in gross profit ratios.
Again, fluctuations in sales and gross profit have been erratic in this
CSM also, with sharp increase in sales yielding gross loss as in 1991-
92 and fall in sales resulting in gross profit as in 1993-94. However,
value of NVAM was quite high in the years which posted gross profit in
ASM (vide Table 3.2).
Regression analysis of gross profit has yielded two models
involving GVAM and labour cost. The value of “R2” are found to be
0.405 and 0.953 respectively in the two models. In view of the wide
difference in the values of “R2”, the second model carrying higher value
98
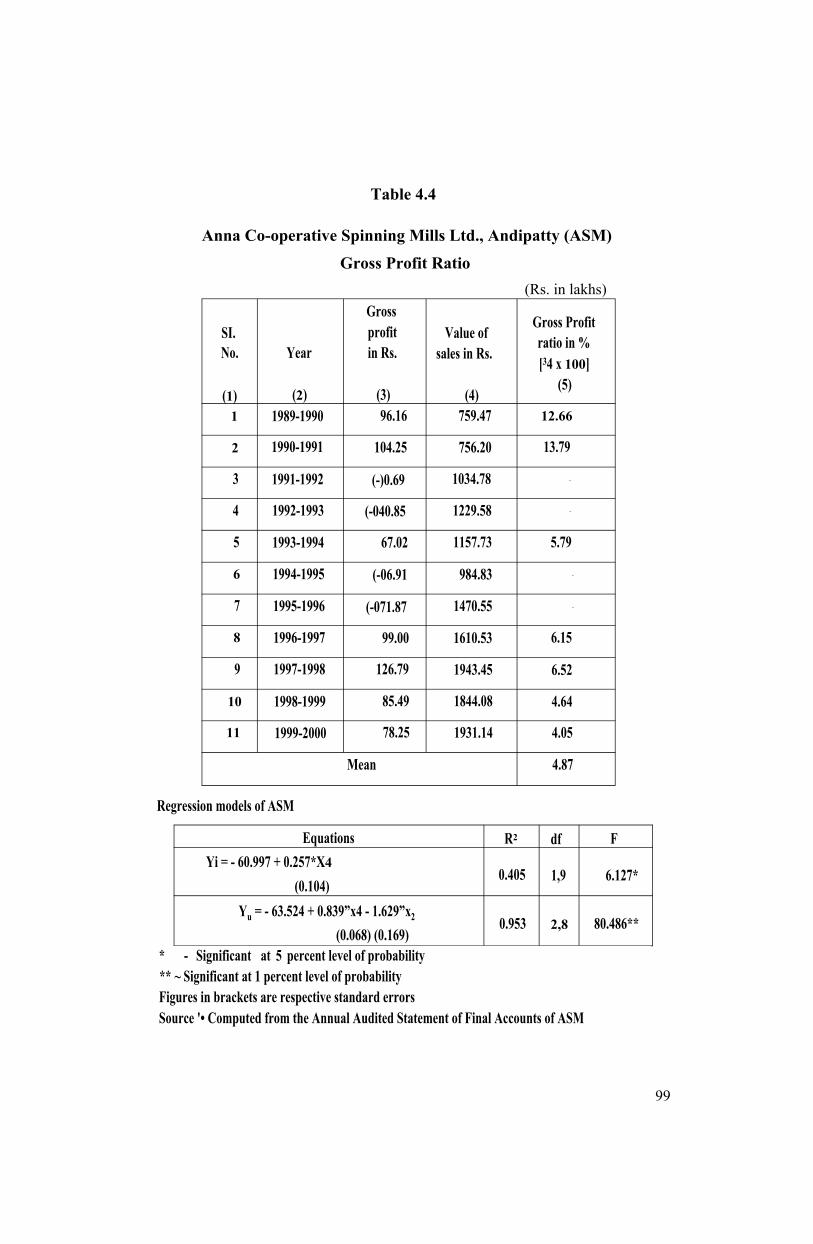
Table 4.4
Anna Co-operative Spinning Mills Ltd., Andipatty (ASM) Gross Profit Ratio
(Rs. in lakhs)
SI.No.
(1)
Year
(2)
Gross profit in Rs.
(3)
Value of sales in Rs.
(4)
Gross Profit ratio in % [34 x 100]
(5)
1 1989-1990 96.16 759.47 12.66
2 1990-1991 104.25 756.20 13.79
3 1991-1992 (-)0.69 1034.78 -
4 1992-1993 (-040.85 1229.58 -
5 1993-1994 67.02 1157.73 5.79
6 1994-1995 (-06.91 984.83 -
7 1995-1996 (-071.87 1470.55 -
8 1996-1997 99.00 1610.53 6.15
9 1997-1998 126.79 1943.45 6.52
10 1998-1999 85.49 1844.08 4.64
11 1999-2000 78.25 1931.14 4.05
Mean 4.87
Regression models of ASM
Equations R2 df FYi = - 60.997 + 0.257*X4
(0.104)0.405 1,9 6.127*
Yu = - 63.524 + 0.839”x4 - 1.629”x2 (0.068) (0.169)
0.953 2,8 80.486**
* - Significant at 5 percent level of probability** ~ Significant at 1 percent level of probability Figures in brackets are respective standard errorsSource '• Computed from the Annual Audited Statement of Final Accounts of ASM
99

of “Rz” can be considered. Accordingly, both GVAM and labour cost
together account for about 95 percent of the variations in gross profit.
If GVAM raises by one lakh rupees, gross profit will raise by Rs.83,900,
while increase of one lakh rupees in labour cost will reduce gross profit
by Rs.1.63 lakh. Thus, GVAM and labour cost are found to be the most
important factors in the gross profit of ASM.
The South India Co-operative Spinning Mills Ltd., Pettai, Tirunelveli (PSM)
As it will be found in Table 4.5, PSM earned gross profit in three
years and the gross profit ratio declined from 11.29 percent in 1989-90
to 2.67 percent in 1993-94. Gross loss grew considerably from 1997-
98 onwards, when there was a continuous fall in production (in the price
level of 1989-90) vide Table 3.1. Also perusal of Table 3.2 shows that
gross profit in PSM in the first two years coincided with high value of
NVAM. Also substantial gross loss was incurred during 1997-2000,
when the amount of NVAM took a nose dive.
Regression analysis has thrown one model. Accordingly, value of
production is the most important factor influencing about -50 percent
variation in gross profit. An increase of one lakh rupees in value of
production would reduce gross loss by 0.175 lakh rupees.
Summary of Gross Profit Analysis
Regression analysis has highlighted factors influencing gross
profit of the CSMs under study. It will be found that GVAM is the most
important influence on gross profit as found in 3 out of the 5 CSMs. In
100
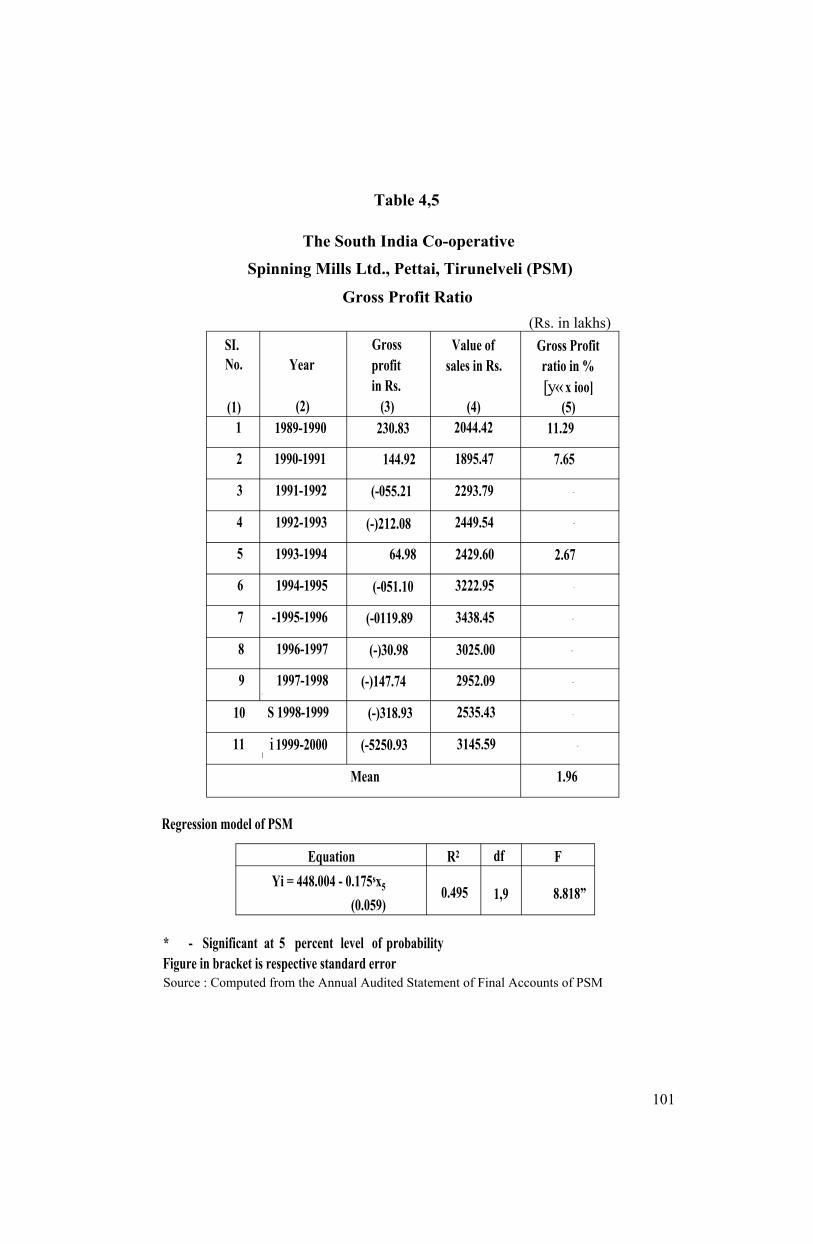
Table 4,5
The South India Co-operative Spinning Mills Ltd., Pettai, Tirunelveli (PSM)
Gross Profit Ratio(Rs. in lakhs)
SI. Gross Value of Gross ProfitNo. Year profit sales in Rs. ratio in %
in Rs. [y« x ioo](1) (2) (3) (4) (5)
1 1989-1990 230.83 2044.42 11.29
2 1990-1991 144.92 1895.47 7.65
3 1991-1992 (-055.21 2293.79 -
4 1992-1993 (-)212.08 2449.54 -
5 1993-1994 64.98 2429.60 2.67
6 1994-1995 (-051.10 3222.95 -
7 -1995-1996 (-0119.89 3438.45 -
8 1996-1997 (-)30.98 3025.00 -
9 1997-1998'
(-)147.74 2952.09 -
10 S 1998-1999 (-)318.93 2535.43 -
11 i 1999-2000[
(-5250.93 3145.59 -
Mean 1.96
Regression model of PSM
Equation R2 df FYi = 448.004 - 0.175sx5
(0.059)0.495 1,9 8.818”
* - Significant at 5 percent level of probabilityFigure in bracket is respective standard errorSource : Computed from the Annual Audited Statement of Final Accounts of PSM
101

addition, saleable waste, labour cost and value of production have been
identified as crucial factors in two CSMs each. Material cost influenced
gross profit in one CSM. It may, however, be pointed out that value of
production, GVAM, material cost and saleable waste are closely related
and, therefore, they can be dealt with together. The CSMs under study
will have to raise their level of production and improve GVAM through
reduction of material cost and saleable waste. The existing practice of
centralised procurement of cotton for all the CSMs in the state needs
reconsideration and revision. The executives of each CSM can be
authorised to procure cotton from the local or nearby market. This will
help to reduce material cost and saleable waste. Again labour cost will
have to be regulated through application of norms of productivity. By
these measures the CSMs will be able to control their cost of
production, raise sales and improve gross profit.
Net Profit Analysis
Whereas the ratio of gross profit to sales reliably indicates the
effectiveness of management of direct costs and prices, the ratio of net
profit to sales enables us to gauge the management of fixed costs of the
business. Effective managements control fixed costs/indirect costs and
keep them below the level of gross profit, thus generating net profit. It
is true that the sample CSMs incurred gross loss in many years, thereby
wiping out the chances of net profit. However, remedial action should
cover both earning of gross profit through effective management of
direct costs and prices as well as controlling over fixed costs.
102
Particulars relating to ratio of net profit to sales in the sample
CSMs can be found in Tables 4.6 to 4.10. Given the performance of
gross profit, none of the CSMs could show satisfactory performance in
respect of net profit. Among the sample CSMs, ASM recorded net profit
in five out of eleven years and RSM incurred net loss during the entire
period under review. The performance of other three CSMs (SSM, TSM
and PSM) can be placed between ASM and RSM. It is true that TSM and
PSM incurred gross loss in nine and eight years respectively as against
SSM incurring gross loss for seven years. The TSM and SSM could
show better showing in net profit than RSM, because of the latter’s
relatively greater failure to control indirect costs/fixed costs.
Ramanathapuram District Co-operative Spinning Mills, Ltd., Achankulam (RSM)
Particulars of net profit ratios of RSM are to be found in Table
4.6. This is the only CSM in the sample that incurred net loss during
the entire period under review. Even though it recorded gross profit
ratios which were higher than PSM during 1989-91, they incurred net
loss in these two years, while PSM earned net profit in that period.
Obviously RSM had greater difficulties in managing fixed costs than
other CSMs in the sample. In this CSM also interest charges was one
among the largest items of fixed costs, raising significantly from 1995-
96 onwards. This was the only CSM in which expenditure on salaries
was the largest item in the fixed cost. Therefore both of them, besides
gross loss, were responsible for mounting net loss through out the
period under review.
103

Table 4.6Ramanathapuram District Co-operative
Spinning Mills Ltd., Achankulam (RSM) Net Profit Ratio
(Rs. in lakhs)
Regression models of RSM
Equations R2 Df FYi = - 9.136 - 3.049”x2
(0.833)0.598 1,9 13.391”
Yu = - 79.238-5.778Mxz+ 0.866* x5 (0.564) (0.137)
0.933 2,8 55.380”
Ym= - 39.802 - 6.154'x2 + 0.986% ~ 3.237% (0.390) (0.098) (0.963)
0.974 3,7 88.167”
* ~ Significant at 5 percent level of probability** ~ Significant at 1 percent level of probability Figures in brackets are respective standard errorsSource : Computed from the Annual Audited Statement of Final Accounts of RSM
104

Regression analysis of the net profitability considerably confirms
the above view. Expenditure on salaries influences 59.80 percent of the
variations, while it is 93.30 percent, when NVAM is combined with
salary. The third model involving salary, NVAM and contingencies
accounted for 97.40 percent of the variations in net profit. An increase
of one lakh rupees in salaries would reduce net profit by 6.15 lakh
rupees. Addition of one lakh rupees to NVAM would add 0.99 lakh
rupees in net profit. An increase of one lakh rupees in contingencies
would reduce net profit by 3.24 lakh rupees.
Analysis of gross profit ratio has already highlighted corrective
measures like expansion of GVAM through control over material cost
for augmenting, gross profit.
This exercise must be followed by similar control over
expenditure, salaries, depreciation and contingencies in order to
strengthen the profitability.
Srivilliputhur Co-operative Spinning Mills Ltd., Srivilliputhur (SSM)
Particulars of net profit ratios of this CSM are furnished in Table
4.7. Though SSM could make gross profit in four out of eleven years, it
could report net profit in one year only. It was already noted that the
gross profit ratio exhibited declining trend. Declining gross profit and
rising fixed cost wiped off net profit in the remaining three years
reporting gross profit. Amount of interest charges was continuously
brought down from Rs.52.89 lakh in 1989-90 toRs.37.32 lakh in
105

Table 4.7 Srivilliputhur Co-operative
Spinning Mills Ltd., Srivilliputhur (SSM) Net Profit Ratio
(Rs. in lakhs)
Regression model of SSM
Equation R2 df FY [ = 147.704 - 5.386*xa
(1.798)0.499 1,9 8.974"
* - Significant at 5 percent level of probabilityFigures in bracket is respective standard errorSource : Computed from the Annual Audited Statement of Final Accounts of SSM
106
1994-95, but afterwards both interest charges and expenditure on
salary increased continuously, thereby raising net loss. Especially
during the last three years, net loss had become very large, ranging
between Rs.262.34 lakh and Rs.377.50 lakh. During this period there
was a sharp fall in NVAM.
Regression analysis of net profit yielded only one model
involving interest charges, which would influence about 50 percent
changes in net profit. An increase of one lakh rupees in interest charges
would reduce profit by Rs.5.39 lakh. Besides improving gross profit,
the CSM should address itself to full utilisation of capital through sound
management of working capital which is dealt with under operating
cycle in Chapter 5.
Thiruchirapalli District Co-operative Spinning Mills Ltd., Karur (TSM)
Net profit ratios of TSM are furnished in Table 4.8. This CSM
achieved net profit of about 4.00 percent during the first two years,
when it earned gross profit and incurred net loss in the remaining nine
years under study, because of gross loss. Among fixed costs, interest
charges claimed largest amount especially in 1993—94 and during 1995-
98. It may be noted that there was a slump on sales in 1995-97.
Comparison of the performance in net profit/net loss and NVAM
suggests that net profit and NVAM were directly related and there was
inverse relationship between net loss and NVAM. During 1989-91, TSM
earned net profit and the period was marked by high amounts of
107
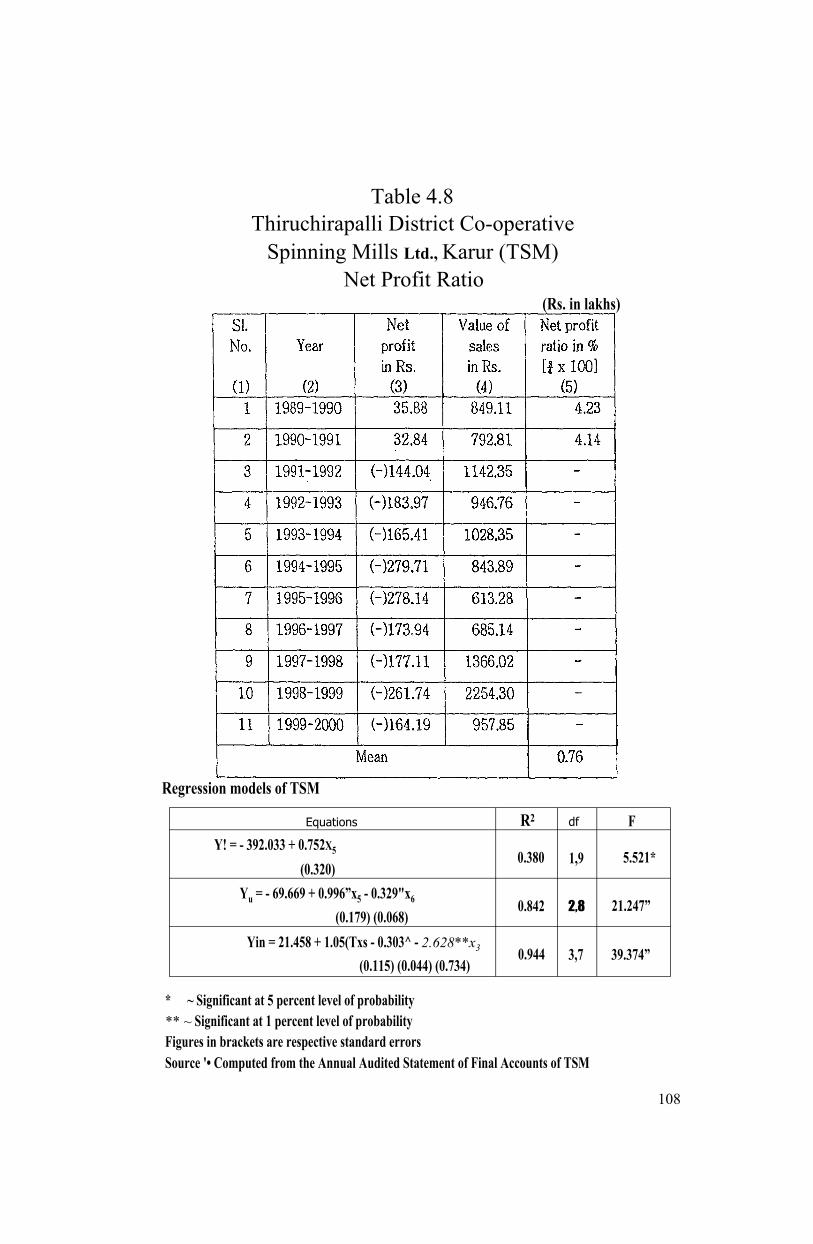
Table 4.8 Thiruchirapalli District Co-operative
Spinning Mills Ltd., Karur (TSM) Net Profit Ratio
(Rs. in lakhs)
Regression models of TSM
Equations R2 df FY! = - 392.033 + 0.752x5
(0.320)0.380 1,9 5.521*
Yu = - 69.669 + 0.996”x5 - 0.329"x6 (0.179) (0.068)
0.842 2,8 21.247”
Yin = 21.458 + 1.05(Txs - 0.303^ - 2.628**x3 (0.115) (0.044) (0.734)
0.944 3,7 39.374”
* ~ Significant at 5 percent level of probability** ~ Significant at 1 percent level of probability Figures in brackets are respective standard errorsSource '• Computed from the Annual Audited Statement of Final Accounts of TSM
108

NVAM. Similarly, TSM incurred heavy net loss in 1994-95, 1995-96
and 1998-99, when NVAM was at its lowest in TSM.
Regression analysis has yielded three models involving NVAM,
value of production and interest charges, which together accounted for
94.40 percent of the variations in net profit. Gross profit analysis
already indicated the influence of GVAM along with saleable waste and
labour cost on gross profit. Naturally NVAM continues to be crucial
factor in net profit. An increase of one lakh rupees in NVAM would rise
net profit by 1.05 lakh rupees, thus making NVAM as the most crucial
factor in net profit. Because of the negative relationship between value
of production and net profit, the second model can be ignored. As per
the third models interest charges account for 10.20 percent of changes
in net profit. An increase of one lakh rupees in interest charges would
reduce net profit by 2.63 lakh rupees. Thus NVAM and interest charges
are important for net profit.
Anna Co-operative Spinning Mills Ltd., Andipatty (ASM)
Net profit ratios of ASM are furnished in Table 4.9. As in gross
profit in net profit also ASM has registered better performance than
others, earning net profit in five out of eleven years. The net profit
ratios ranged between 5.57 percent in 1990-91 and 0.65 percent in
1999-2000. Gross profit of Rs.85.49 lakhs in 1998-99 could not prevent
net loss of Rs.3.52 lakhs, while gross profit of Rs.78.25 lakh in 1999-
2000 could yield net profit of Rs.12.56 lakh indicating uncontrolled
variations in fixed cost.
109
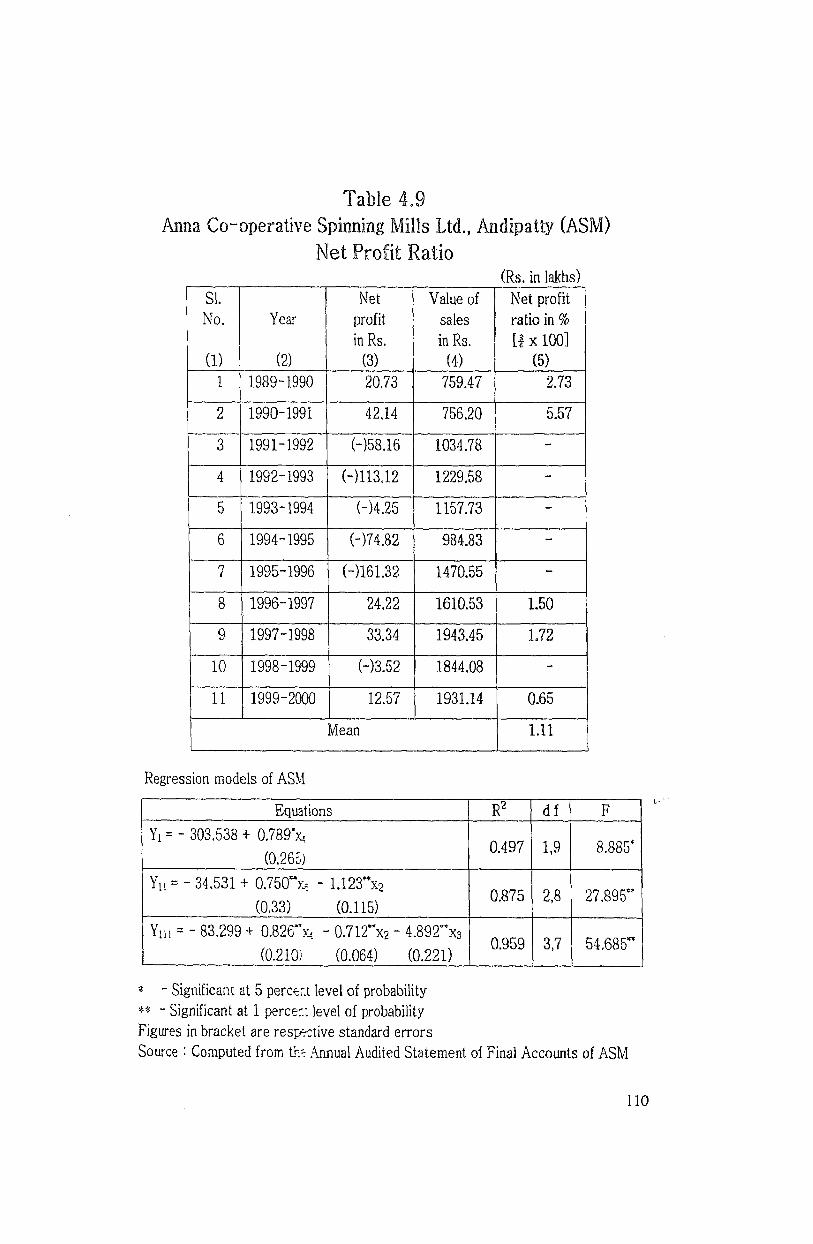
Though interest charges were the largest item of fixed costs, the
amount of interest remained reasonably stable, fluctuating between
Rs.48.39 lakh in 1989-90 and Rs.32.17 lakh in 1999-2000. Expenditure
on salaries registered considerably increase in 1995-96 and during
1997-2000. Therefore, the CSM has to control these two items of
expenditure in order to regulate fixed costs and improve net profit.
Also NVAM is another factor influencing net profit. Drastic reduction of
NVAM during 1991-92 and 1994-96 witnessed increase in net loss and
improvement of NVAM in the last four years, helped to raise net profit
in three years and minimise net loss in one year (1998-99).
Regression analysis has yielded three models involving
contingencies salary and interest charges. Contingency expenditure had
negative influence over net profit involving inverse relationship between
the two factors. However, the first model shows positive influence of
contingency expenditure on net profit and therefore the model can be
ignored. As per the second model, both contingency expenditure and
salary together influence 87.5 percent of variation in net profit. When
interest charges (in the third model) is included the three factors are
responsible for about 95.90 percent of changes in net profit. When
salary expenditure increases by one lakh rupees, net profit falls by
Rs.1.12 lakh. When interest charges raise by one lakh rupees, net profit
falls by Rs.4.89 lakh. Thus salary and interest charges are factors to be
reckoned with in ASM.
I l l
The South India Co-operative Spinning Mills Ltd., Pettai, Tirunelveli (PSM)
Data on net profit ratios of this CSM can be found in Table 4.10.
Though PSM earned gross profit in three years, it could yield net profit
in the first two years only, when the net profit ratio fell from 6.26
percent to 1.49 percent. In this CSM also the largest item of fixed cost
"was interest charges which rose sharply from 1990-91 onwards and
interest charges exceeded Rs.100 lakh in 1995-96 and the CSM paid
Rs.237.22 lakh as interest in 1999-2000. Thus, interest charges was a
decisive factor in raising the amount of net loss in PSM. Administrative
expenses were stable during the period under review. The CSM
suffered reduction of net profit in 1990~91, despite there was
substantial increase in the amount of NVAM. However decrease in
NVAM was among the factors responsible for growing net loss,
especially during the last three years.
Regression analysis of net profitability has yielded three models
involving interest charges, NVAM and value of production. Interest
charges would account for 68.00 percent of variation in net profit. An
increase of one lakh rupees in interest charges would reduce the net
profit by Rs.0.26 lakh. Interest charges and NVAM would be responsible
for 82.80 percent of variation in net profit. An increase of one lakh
rupees in NVAM would yield increase in net profit by Rs.0.58 lakhs.
Interest charges, NVAM and value of production would explain
93.30 percent of variation in net profit. Since the third model shows
112

These CSMs can improve NVAM largely through increase in
GVAM and control over depreciation. The CSMs have to regulate the
salaries and contingencies on the basis of capacity to pay. Improvement
of gross profit would be the major factor contributing to net profit aided
by control over fixed costs like interest charges, depreciation, salaries
and contingencies. .
Return on Investment (ROI) Analysis
Return on investment (ROI) is a measure of evaluating the
wisdom of investment decision as well as competence of management of
long term finance. As already noted, gross loss incurred by the sample
CSMs in most of the period under review and consequent net loss have
considerably eroded the efficacy of the concept of return on
investments. Still exercise in ROI will show the position of long term
funds and the exact condition of the management of fixed capital.
Data on return on investments for the sample CSMs can be found
in Table 4.11 to 4.15. For most of the years of study, ROI could not be
calculated because of net loss suffered by the sample CSMs. While ASM
could report ROI for five years, RSM incurred net loss during the entire
period. For the remaining three CSMs (SSM, TSM, and PSM), ROI could
be calculated for one or two years. In profitable years ROI could
exceed 14.00 percent in three years only - during 1989-91 in TSM and
in 1989-90 in PSM. In the other CSMs, ROI has been less than 10
percent.
115

negative influence of value of production over net profit, the model is
ignored. Thus, interest charges and NVAM are the main factors
influencing net profit. Thus PSM should concentrate on reduction of
interest charges and improvement of NVAM and value of production.
Summary of Net Profit Analysis
The most important determinant of net profit in a business is the
gross profit available for meeting fixed costs. Among the sample CSMs,
ASM earned gross profit in seven out of eleven years under review.
The remaining four CSMs earned gross profit in fewer years, incurring
gross loss in seven to nine years in the period of the study. The gross
loss was the most important reason for the lackluster performance inI
respect of net profit. Some CSMs in the sample incurred net loss,
despite gross profit.
Regression analysis of the factors influencing net profit has
helped us to identify reasons responsible for variations in net profit and
net loss. Interest charge is found to be the most pervasive factor
influencing profitability in 4 CSMs, followed by NVAM in 3 CSMs,
salaries and value of production in 2 CSMs each and contingencies in
one CSM. Sound management of interest charges involves full utilisation
of fixed capital and optimum turnover of working capital. Improvement
of production, GVAM and sales, which have been recommended for
improvement of gross profit, would result in maximisation of utilisation
of fixed assets.
114

These CSMs can improve NVAM largely through increase in
GVAM and control over depreciation. The CSMs have to regulate the
salaries and contingencies on the basis of capacity to pay. Improvement
of gross profit would be the major factor contributing to net profit aided
by control over fixed costs like interest charges, depreciation, salaries
and contingencies.
Return on Investment (ROI) Analysis
Return on investment (ROI) is a measure of evaluating the
wisdom of investment decision as well as competence of management of
long term finance. As already noted, gross loss incurred by the sample
CSMs in most of the period under review and consequent net loss have
considerably eroded the efficacy of the concept of return on
investments. Still exercise in ROI will show the position of long term
funds and the exact condition of the management of fixed capital.
Data on return on investments for the sample CSMs can be found
in Table 4.11 to 4.15. For most of the years of study, ROI could not be
calculated because of net loss suffered by the sample CSMs. While ASM
could report ROI for five years, RSM incurred net loss during the entire
period. For the remaining three CSMs (SSM, TSM, and PSM), ROI could
be calculated for one or two years. In profitable years ROI could
exceed 14.00 percent in three years only - during 1989-91 in TSM and
in 1989~90 in PSM. In the other CSMs, ROI has been less than 10
percent.
115
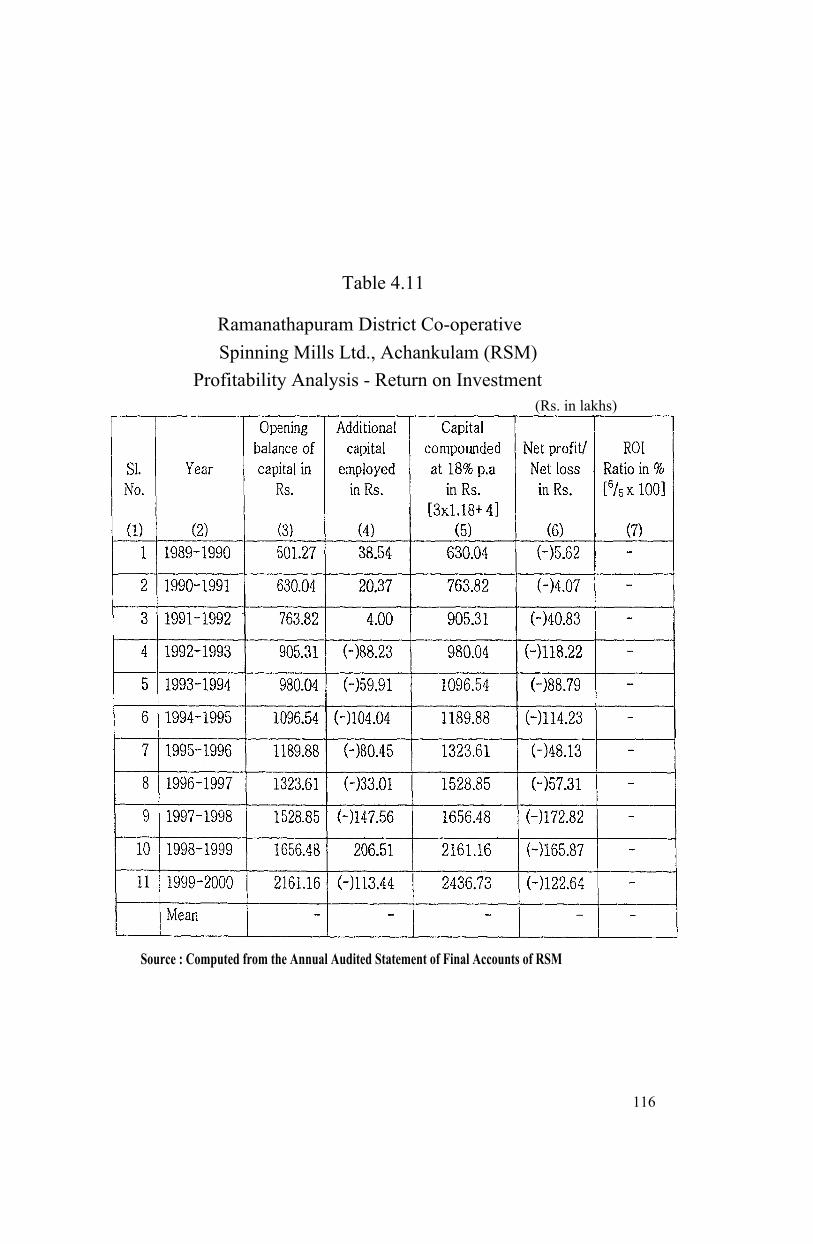
Table 4.11
Ramanathapuram District Co-operativeSpinning Mills Ltd., Achankulam (RSM)
Profitability Analysis - Return on Investment(Rs. in lakhs)
Source : Computed from the Annual Audited Statement of Final Accounts of RSM
116

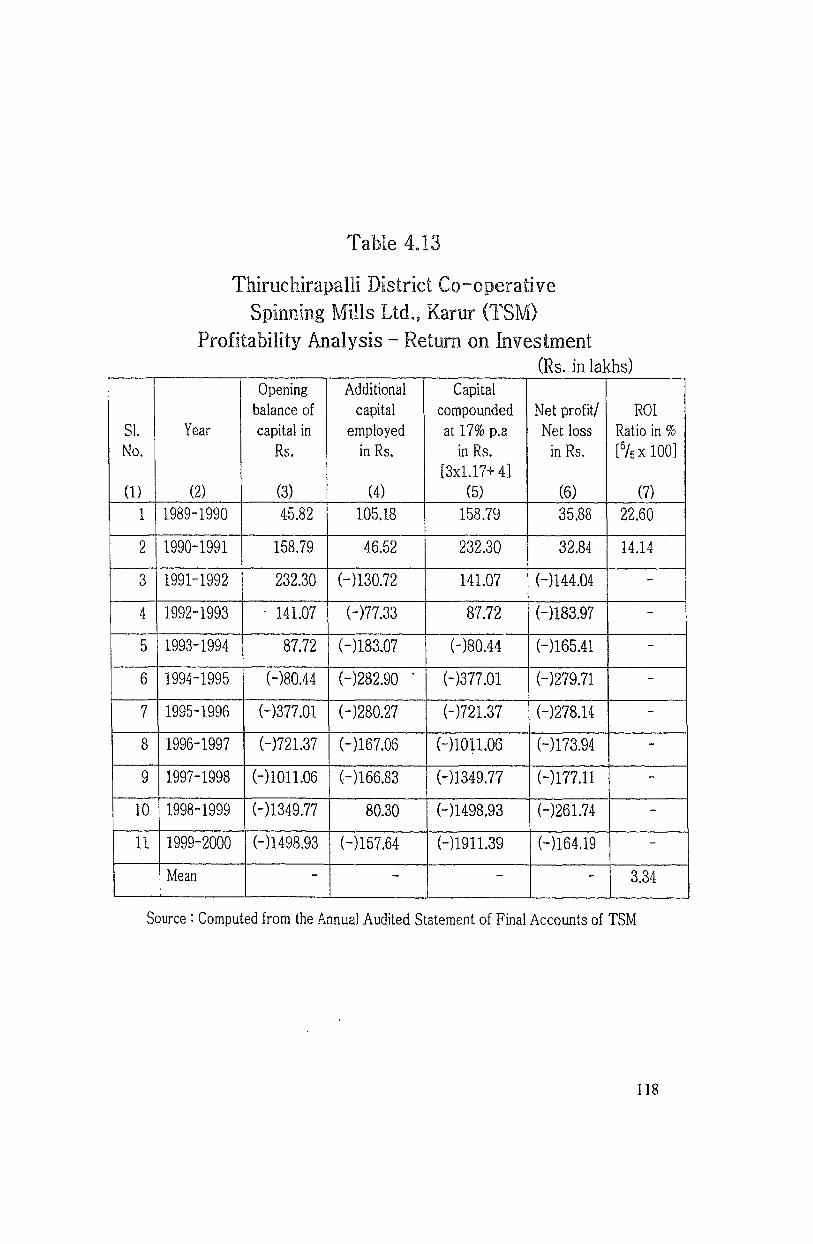


Continuous net losses caused serious erosion in the capital base
in the sample CSMs. Among the five CSMs, three CSMs, namely, SSM,
TSM and PSM posted disastrous performance, which wiped out the
capital and saddled the CSMs with heavy net loss which amounted to
Rs.627.75 lakh in SSM, Rs. 1,911.39 lakh in TSM and Rs, 1,359.69 lakh in
PSM as on 31.03.2000. Without compounding, the accumulated loss in
the above three CSMs were Rs.546.58 lakh in SSM, Rs.l,168.00 lakh in
TSM and Rs.l,805.84 lakh in PSM as on 31.03.2000. Thus, the three
CSMs had completely lost capital and had huge net loss aggregating
Rs.3,520.42 lakh. In the remaining two CSMs (RSM and ASM), capital
base has been preserved despite net losses incurred during the period
under review. However, the actual amount of capital in these two CSMs
was far smaller than the compounded capital shown in column 5 for the
years 1999-2000 in Table 4.11 and 4.14. The actual amount of capital
in RSM as on 31.3.2000 was Rs. 144.05 lakh as against Rs.2,436.73 lakh
shown as compounded capital for the year 1999-2000. In ASM the
actual amount of capital left with ASM stood at Rs.770.14 lakh, whereas
the compounded capital was Rs.4,048.40 lakh for the year 1999-2000.
ASM was the only CSM where the amount of capital had grown during
eleven years from Rs.714.68 lakh in 1989-90 to Rs.770.14- lakh in
1999-2000. In RSM the amount of capital decreased from Rs.501.27
lakh to Rs. 144.05 lakh during the period under review. In other three
CSMs (SSM, TSM and PSM), capital has been displaced by the
accumulated loss as already noted. It may, therefore, be concluded that
out of five CSMs, RSM and ASM alone have chances of resurrection,
121
while the other three CSMs required extraordinary measures of
injecting new capital for discharging the accumulated net loss and
sustaining their operations.
Summary
Lackluster performance of the sample CSMs in profitability has
confirmed the hypotheses that the business operations of the CSMs
would not be profitable. The losses have been due to inadequacies in
value addition, production and sales as well as high costs of materials,
labour costs, saleable waste and contingencies. Thus, besides fall in
demand for yarn (due to fall in the production of handloom), internal
factors like selection and purchase of raw materials, wages and lack of
monitoring of production influenced the performance of these five
sample CSMs. The above causes of losses are inter-related and they
should be tackled by a package of remedial measures. Localisation of
procurement of cotton will help to reduce the material cost, saleable
waste and enhance production, value addition and sales. The resulting
acceleration in operation would help to bring down the incidence of
interest and contingencies charges. Further the CSMs should modernise
their facilities for reducing cost and improving quality, since
modernisation is the most vital factor for profitability. The CSMs should
ensure that their SPP is atleast equal to SITRA’s standard to ensure
productivity and profitability.
122
1 ] Gupta R.K., Profitability, Financial Structure and Liquidity, Printwell Publishers, Jaipur, 1989, p. 28.
2l Harley W.C.F., Cash Planning, Forecasting and Control, Business Books Limited, London, 1979, p. 3.
3] Jain C.P., Profit Planning and Control, National Publishing House, Jaipur, 1989, p. 3.
4l Barthwal, Industrial Economics, Willey Eastern Ltd., New Delhi, 1992, Pp. 211-226.
5] Hampton J.J., Financial Decision Making Concepts, Problems and Cases, Prentice Hall of India, New Delhi, 1983, p. 10.
3] Patel M., Corporate Financial Objectives, some Emperical findings Agarval (Ed), Readings in Financial Management, Indian Institute of Finance, New Delhi, 1995, p. 7.
7 ] Peacock M.A. and Taylor A.H., Handbook of Financial Planning, Gower Publishing Co. Ltd., Westwoods, UK, 1981, p. 145.
3] John Black, Dictionary of Economics, Oxford University Press, Oxford, 1997, p. 273.
3] Keirstead B.S., Capital Interest and Profits, MacMillan Ltd., 1959, p. 6.
3] Barry Render, Ralph M. and Stair Sr., Quantitative Analysis for Management, Prentice Hall Publishing Inc., New Jersey, 1997, p. 3.
L ] Howard B.B. and Upton M., Introduction to Business Finance, McGraw Hill, New York, 1961, p. 160.
I ] Weston J.F. and Bringham E.F., Essentials of Managerial Finance, Hold Renechart & Winston, New York, 1971, p. 48.
i 3 Barthwal, Industrial Economics, Willey Eastern Limited, New Delhi, 1992, p. 211.
I] Natarajan S., “Profit maximisation”, The Management Accountant, Volume IX, November 1974, p. 241.
j] Stigler G.J., The Theory of Price, Prentice Hall, New Jersey, 1952, p. 82.
References
123