chapter 4 localized carbohydrate and essential …mineral nutrients, carbohydrates, or both may be...
TRANSCRIPT

33
CHAPTER 4LOCALIZED CARBOHYDRATE AND
ESSENTIAL NUTRIENT DEPRIVATION ASCAUSAL FACTORS IN GRAPEVINE BUD NECROSIS
Abstract. Bud necrosis (BN) of grape is observed as an abortion and drying of one or moreprimordia of the developing compound winter bud. The causes are uncertain, but high vigor, andcanopy shade increase BN incidence under some conditions. This work was conducted todetermine if localized carbohydrate or mineral nutrient deprivation increased the incidence of BNobserved with ‘Riesling’ grapes in Virginia. Changes in carbohydrate levels in ‘Riesling’grapevines was attempted by shading and shoot tip removal. In 1994, 92% shade was applied at 20, 40,or 60 days after budbreak in one vineyard, and starting 40 days after budbreak in another vineyard for three-weekperiods. In 1996, a second shade experiment at 25 and 65 days after budbreak for a 40-day period was conducted.Shade reduced PPF in the fruit zone of canopies to <2% of ambient PPF in both experiments. The first experimentdid not increase BN. However, the second experiment increased BN in the distal nodes of the shaded vinescompared to the control vines. Shoot vigor, measured as shoot diameter and internode length at season’s end, waspositively correlated with BN in shaded as well as unshaded vines. The frequency of necrotic buds was greater atnodes 5 through 16 than at nodes 1 to 4 in both shaded and unshaded vines. Levels of total nonstructuralcarbohydrates (TNC) measured spectrophotometrically, were not significantly affected by shade treatment. Levelsof sucrose, glucose, fructose, and starch in bud, leaf, and stem tissues analyzed by high performance liquidchromatography were lower in shaded vines as determined at the time of shade cloth removal. Shoot tip removalincreased BN at nodes distal to 12. Bud tissues of shoot-tipped vines had lower levels of sucrose, glucose,fructose, and starch than did the control vines. Mineral nutrient surveys conducted on ‘Riesling’ and ‘Chardonnay’vines indicated that BN is not caused by essential nutrient deficiency. Carbohydrate surveys revealed that‘Riesling’ buds had lower levels of sucrose compared to ‘Chardonnay’ buds. Visual starch rating revealed that‘Chardonnay’, the BN-insensitive cultivar, had greater levels of bud starch deposits than did the BN-susceptiblecultivars, ‘Riesling’, ‘Syrah’, and ‘Viognier’. Starch deposits in grape buds was negatively correlated with BNincidence. ‘Riesling’ and ‘Chardonnay’ vines showed a node position effect where in nodes 1to 6 had higherlevels of starch deposits compared to nodes 7 to 13. From these studies it can be concluded that a negativecorrelation between carbohydrate levels in vines and BN incidence exisits.
34
INTRODUCTION
Bud necrosis (BN) of grape (Vitis vinifera L.) is observed as an apparent abortion and drying ofthe primary bud and, in severe cases, secondary buds of the developing winter bud (Dry andCoombe, 1994; Lavee et al., 1981; Naito et al., 1989; Perez, 1991; Wolf and Warren, 1995).Secondary buds usually continue to develop after primary bud death, and produce normal shootsthe following season; however, crop yields are significantly reduced due to the destruction of themore fruitful primary buds. BN has been reported in Australia (Dry and Coombe, 1994),California, USA (Morrison and Iodi, 1990), Chile (Perez and Kliewer, 1990), India (Bains et al.,1981; Bindra and Chohan, 1975), Israel (Lavee et al., 1981; Lavee, 1987; Ziv et al., 1981), Japan(Naito et al., 1986), and Virginia, USA (Wolf and Warren, 1995). The causes of this apparentphysiological disorder are uncertain, but high shoot vigor, quantified by shoot growth rate orjudged from cane size (Dry and Coombe, 1994; Lavee et al., 1981; Wolf and Warren, 1995),excessive irrigation (Bindra and Chohan, 1975; Perez, 1991), low carbohydrate levels (Naito etal., 1987), shade (Perez and Kliewer, 1990; Wolf and Warren, 1995), and high gibberellin-likeactivity (Lavee, 1987; Ziv et al., 1981) have all been reported to increase BN. Shoot thinning andartificial shade studies have yielded conflicting responses. Severe shoot thinning ("75-85% shootremoval") increased BN of ‘Shiraz’ in Australia (Dry and Coombe, 1994), while a more modestlevel of shoot thinning decreased BN incidence of ‘Thompson Seedless’ in Chile (Perez andKliewer, 1990). In Australia, severe thinning apparently stimulated shoot vigor (judged by canediameter and lateral development), which probably increased BN. The timing of shade may alsobe critical to the occurrence of BN. Previous research in Virginia indicated that a three-weekperiod of shade (either 64% or 92% reduction in PPF), applied shortly before veraison, had noeffect on BN (Wolf and Warren, 1995). Preliminary anatomical studies, however, revealed thattissue destruction began as early as 66 days after bud break. Thus, shading experiments wereconducted to determine if early-season shading caused BN in ‘Riesling’ grapevines grown inVirginia. It was hypothesized that as shade reduced the rate of photosynthesis in leaves, axillarybuds would suffer from carbohydrate deprivation resulting in BN. Carbohydrates in buds ofshaded and non-shaded grapevines were analyzed to test this hypothesis.
Shoot vigor has been reported to be one of the causes of BN (Dry and Coombe, 1994; Lavee etal., 1981; Wolf and Warren, 1995). Carbon resources are preferentially translocated to activelygrowing shoot tips at the expense of other plant parts such as developing fruit clusters and axillarybuds (Candolfi-Vasconcelos and Koblet, 1990). Studies in Japan and California, USA attemptedto correlate carbohydrate concentrations in bud tissues with BN incidence (Morrison and Iodi,1990; Naito et al., 1987). Research in Japan on the cultivar ‘Kyoho’ revealed that starch waslower in strong shoots where “strong” was quantified as greater overall shoot length, greaterinternode length, and larger bud diameter (Naito et al., 1987). Strong shoots had higher BNincidence (8.3%) at basal nodes compared to the weak shoots (0% BN). The level of starch was5% of dry matter in strong shoots whereas it was around 8% in weak shoots at 40 days afterbloom (Naito et al., 1987). Morrison and Iodi (1990) also observed a negative correlationbetween starch level and necrosis. Therefore, it was hypothesized that shoot tipping wouldremove the sink that would compete with fruit clusters and buds for carbon resources early in the

35
shoot’s growth period. Removal of shoot tips would cause preferential translocation of organicnutrients to fruit clusters and other organs on the current shoot including axillary buds.Therefore, the objective of this study was to increase carbohydrate translocation into the axillarybuds by removing shoot tips.
A few studies in grapevines have indicated that low nutrient (nitrogen, phosphorus, potassium)levels in overvigorous vines are responsible for flower bud death in the grape cultivar ‘Anab-e-Shahi’ (Bains et al., 1981; Bindra and Chohan, 1975). However, other conflicting reports inliterature have shown no correlation between nutrient levels and BN (Naito et al., 1987; Perez,1991). Naito et al. (1987) examined the levels of nitrogen, phosphorus, potassium, calcium,magnesium, and boron in the lateral buds of ‘Kyoho’ grape. Strong shoots and weak shootsclassified on the basis of shoot length, internodal cross section, and bud size were used. Strongshoots had a higher percentage of BN (44%) compared to the weak shoots (9%). However nocorrelation between nutrient levels and BN was observed (Naito et al., 1987). Similarly, Perez(1991) found no effect of nitrogen or potassium fertilizer application on BN. It cannot be judgedfrom these conflicting reports whether nutrient deficiency is involved in BN occurrence inVirginia. Necrotic buds generally form because of cell compression and breakage beneath theprimary axis (Chapter 3). As calcium is essential for cell wall formation, it was hypothesized thatBN-prone vines may be deficient in calcium, leading to cell distortion and cell breakage. Calciumdeficiency is reported to cause lettuce tip burn (Collier and Tibbetts, 1983), blossom-end rot intomatoes (Ho et al., 1995), marginal bract necrosis in poinsettia (Woltz and Harbaugh, 1986), andbract necrosis in sunflower (de la Guardia et al., 1990). Foliar application of calcium andmagnesium reduced rachis necrosis in ‘Canada Muscat’ grape (Cline, 1987). In plants, rapiddeath of cells in the apical meristem and stunted growth results when supplied with nutrientslacking in calcium (Epstein, 1972). Deficiency of certain other nutrient elements in plants can alsocause nutritional disorders that resemble necrosis. For instance, deficiency of boron usually killscells in meristematic regions. Boron deficiency in lettuce sometimes caused a form of tip-burnsimilar to that caused by calcium deficiency (Collier and Tibbetts, 1983).
In addition to mineral nutrient reductions, overly vigorous vines might be expected to have highBN (Dry and Coombe, 1994; Lavee et al., 1981; Wolf and Warren, 1995) because of activelygrowing shoot tips that are strong photosynthate sinks. Carbohydrate resources and mineralnutrients preferentially go to the growing tips rather than to the fruit clusters (Candolfi-Vasconcelos and Koblet, 1990). Fruit clusters form the next dominating sink followed by stemsand axillary buds (Edson et al., 1995; Motomura, 1990). It was therefore hypothesized that eithermineral nutrients, carbohydrates, or both may be locally deficient in the lateral buds and that suchdeficiencies might lead to BN. Therefore, essential elements such as calcium, magnesium,potassium, phosphorus, manganese and boron and carbohydrates were analyzed in the lateralbuds, leaves, and stem tissues of a BN-prone and a BN-resistant cultivar.
It has been proposed that another grapevine disorder, inflorescence necrosis (IN) in grapes mayalso be caused by carbohydrate deprivation (Keller and Koblet, 1994, 1995). The vinesdeveloped severe symptoms of IN when exposed to light levels of 30 µE⋅m-2⋅s-1. Keller and

36
Koblet (1995) also observed low rates of photosynthesis at those low light levels, which led themto conclude that stress induced carbon depletion, combined with competitive interactions amongsinks, were responsible for IN. Shading studies have revealed a reduction in the rate ofphotosynthesis in single leaves (Cartechini and Palliotti, 1995) leading to carbohydrate deprivationin leaves. At fruit set and fruit ripening, vegetative shoots are weak carbohydrate sinks (Edson etal., 1995; Motomura, 1990), and therefore a vine at this phenological stage, when subjected tostress situations like shade, experiences carbohydrate deprivation in leaves, stems, and othervegetative parts. A similar argument can be forwarded for BN as well. It was hypothesized thatBN develops from localized carbohydrate deprivation in the lateral grape buds. Therefore,towards this end, four grape cultivars that showed differential BN-sensitivity, were selected forvisual starch analysis. Visual starch rating studies have been performed in the past with applefruits. A starch rating chart was developed to evaluate the quantity of starch in the fruits (Hesseand Hitz, 1938; Marini et al., 1990; Poapst et al., 1959). A similar key was created to evaluatethe cultivars ‘Riesling’, ‘Viognier’, and ‘Syrah’ that have been reported to have high BN levels(Wolf, unpublished data) and compared with the BN-insensitive cultivar, ‘Chardonnay’.
Therefore, the objectives of this study was to determine the potential role of carbohydrate ormineral nutrient deprivation in BN incidence of ‘Riesling’ grapevines. Changes in carbohydratelevels of grapevine organs was attempted by shading and shoot tipping. Carbohydrate andmineral nutrient surveys were conducted in BN-prone and BN-insensitive vineyards. Visualstarch analyses were also performed on four cultivars showing differential BN sensitivity.
MATERIALS AND METHODS
Studies were conducted from 1993 to 1996 to evaluate the effect of artificial shade, vigor, mineralnutrients and carbohydrate deprivation on BN occurrence in the cultivars ‘Riesling’ and‘Chardonnay’ at four vineyards in Virginia. A brief description of the procedures used in theexperiments is followed by a description of each experiment. All general laboratory chemicalswere obtained from Fisher Scientific (Springfield, NJ 07081-3193) and Sigma (St. Louis, MO63178).
Mineral AnalysisCalcium, magnesium, potassium, boron, manganese, and phosphorus were analyzed at VirginiaTech’s Soil Testing and Plant Analysis Laboratory, Blacksburg using a simultaneous inductivelycoupled plasma (ICP) spectrometer (Thermo-Jarrell-Ash ICAP-61). The procedure involvesheating samples to volatilize the organic components, dissolving the resulting ash using perchloricacid, and filteration. The filterate was then analyzed for its elemental concentration using an ICP.The lyophilized plant tissue was ground and 0.5 g of the tissue was weighed into a Folin Wudigestion tube to which 4 ml of concentrated nitric acid was added. The tubes were then allowedto stand overnight, and then 2 ml perchloric acid was added to each tube. The tubes were heateduntil all the red fumes of nitric acid and the white fumes of perchloric acid had disappeared, andonly 1 ml of the solution remained in the tubes. The tubes were cooled and 15 ml of distilled

37
deionized water was added. The samples were then filtered through Whatman #42 filter paperinto plastic bottles.
All elements were analyzed in the same extract by an ICP equipped with a modified Technicon IVautosampler. A blank and a standard were analyzed with each set of plant samples. The quantityof each mineral nutrient present in the plant organ was reported as mg⋅g-1 of dried plant tissue.
Carbohydrate AnalysisTwo representative shoots per treatment plot were collected every 10 days, starting 50 days afterbudbreak and continuing until 90 days after budbreak. Buds, leaves, and stem tissues wereseparated in the field and immediately submerged in liquid nitrogen. Stem and leaf tissues fromnodes 5 through 13 were collected for analysis. Buds from all nodes (1-17) were collected. Theplant tissues were then transported to the lab on dry ice and stored at -80C.
Carbohydrates were analyzed using high performance liquid chromatography (HPLC) (adaptedfrom Mullen and Koller, 1988 and Wellso et al., 1989). Stem, leaf, and bud tissues werelyophilized (Virtis Sentry Lyophilizer) and ground to pass through a 1-mm screen. Subsamplesfrom individual samples were used to determine glucose, fructose, sucrose, and starch levels. Thesugars (glucose, fructose, and sucrose) were extracted by placing 100 g of each sample intoprelabeled 25 ml centrifuge tubes with 5 ml of 80% ethanol and vortexing thoroughly to mix thesamples. The samples were then placed in a heated sonicator (Branson Ultrasonic Cleaner B-32)(60C) for 1 hour. The samples were then centrifuged (Beckman centrifuge Model J2-31) for 5minutes at 3080×g. The supernatant extract was removed and heated to evaporate the ethanol toapproximately 1 ml and then diluted by adding 2 ml distilled, deionized water. The samples wereagain sonicated for 30 minutes and centrifuged at 3080×g for 5 minutes. The supernatant wasdrawn off and evaporated. The samples were then dried in a lyophilizer. Starch was hydrolyzedand measured as equivalents of glucose. Starch was hydrolyzed by adding 3 ml of 0.02 N sulfuricacid to the tissue remaining in the centrifuge tubes after the second centrifugation and placing thetubes in a boiling water bath for 1 hour to gelatinize the samples. The samples were cooled and 3ml of 0.1M sodium acetate buffer, adjusted to pH 4.5, and 1 ml of amyloglucosidase (1 mgamyloglucosidase in 5 ml of 0.1M sodium acetate buffer) were added to the samples. Thesamples were then placed in a water bath at 55C for 48 hours. The samples were centrifuged at3080×g for 5 minutes, and the supernatant was drawn off into centrifuge tubes, evaporated to 1ml, and lyophilized. Lyophilized samples were diluted by adding 200 µl of deionized water. Thesamples were then filtered through a nylon filter (Nylon Acrodisc, 13 mm diameter, 0.45 µm poresize) before injecting 20 µL of the sample into the HPLC. The carbohydrates were separatedusing a Bio-Rad Aminex HPX-87P 3007.8 mm column (Bio-Rad Laboratories, Hercules, CA)heated to 85C with a mobile phase of degassed filtered double distilled water at a flow rate of 0.6ml⋅min-1. A guard column (with Carbo-P micro guard cartridge from Bio-Rad Laboratories,Hercules, CA) at room temperature was used between the injector and analytical column. Thecarbohydrates in the extract were detected by a refractometer (Waters 410 DifferentialRefractometer). The area under each peak and the retention times were determined using Axiom

38
717 chromatography data system by referencing with sugar standards of sucrose, glucose andfructose.
BN AssessmentBN was evaluated on 10 shoots per vine in October by making sequential lateral razor cutsthrough the buds from node 1 to 20. Each shoot was divided into 5 sections (nodes 1-4, nodes 5-8, nodes 9-12, nodes 13-16, and nodes 17-20). Percentage of BN was determined by countingthe number of dead and live buds for each section. Primary buds were judged dead if theyappeared dry, crushed, and/or darkened. Buds were judged alive if green.
Effect of Shade on BN in ‘Riesling’ Grapevines, 1994Vineyards: Shade experiments were conducted during 1994 in two mature (10 years old)‘Riesling’ vineyards: Somerset, in central Virginia and Willowcroft, in northern Virginia. AtSomerset Vineyard, 92% neutral black shadecloth, was applied 20 (Shade I ), 40 (Shade II), or 60(Shade III) days after budbreak over a 3-week period. Shade cloth was suspended over 2-vineplots, each replicated six times in a completely randomized design. An equal number of unshadedcontrol plots (Control I, II, and III) were used for each shade period. Vines were trained to acasarsa, unilateral cordon system at Somerset Vineyard. The vines were spur pruned and shootswere positioned to grow vertically upright. The vines were spaced 3.7 m apart in rows 3.7 mwide.
At Willowcroft Vineyard, one shade treatment along with a control treatment (with no shade) wasapplied 40 days after budbreak to three-vine plots replicated five times in a completelyrandomized design. Vines were trained to bilateral cordons at Willowcroft Vineyard. Vines werespur-pruned, and shoots were positioned to grow vertically upright, similar to Somerset Vineyard.Spacing at Willowcroft Vineyard was 3.1 m (row) × 2.1 m (vine).
Point Quadrat Analysis: Shoot density of all plots at both vineyards was standardized to 15shoots per meter of canopy 15 days after budbreak. Canopy point quadrat analyses (Smart et al.,1990) were also done about 100 days after budbreak. A thin metal rod was passed horizontallythrough the fruiting region of the canopy at equal intervals fifteen times per plot. Contacts of theprobe with leaves, fruit clusters and canopy gaps were recorded. The number of leaf layers,percent gaps, percent exterior fruit clusters, and percent interior leaves was calculated for bothvineyards.
Light Measurement: Photosynthetic photon flux (PPF) measurements were made in canopy fruitzones of each treatment plot with a 1.0-m line quantum sensor (LI-COR model LI-191SB) and aphotometer (LI-COR model 185B) in both vineyards the day after each shade treatment wasapplied. Light measurements were made between 1100 and 1400 HR at both vineyards. TwoPPF measures were recorded in each plot in the fruit zone. Each of those records was an averageof three separate readings: one with the sensor face oriented vertically upright (0°), one facing 45° left, and one facing 45° right of the rows. Additionally, a single exterior PPF reading was made
39
at each plot by holding the sensor above the vine canopy with the sensor oriented skyward (0°).Ambient PPF values ranged from 1400 to 2000 µmol⋅m-2⋅s-1 on all days of measurement.
Ten representative shoots per plot were selected 20 days after budbreak in both vineyards. Thefruit clusters on all selected shoots were removed to avoid the confounding effect of clusterdevelopment on shoot growth rate. Average internode length (from nodes 1 to 20) and maximumdiameter of the second internode were also measured on the tagged shoots of all treatments on 24October 1994 at Somerset and on 8 November 1994 at Willowcroft. BN assessment, asdescribed previously, was also done on those dates.
Total Nonstructural Carbohydrate Analysis: Total nonstructural carbohydrates (TNC) weremeasured for shade I and control I panels at Somerset Vineyard in bud and leaf tissues. Tworepresentative shoots were sampled at 10-day intervals starting at 40 days after budbreak whenthe shading treatment finished, until 90 days after budbreak. TNC analysis was also done forshade and control panels of Willowcroft Vineyard. Here as well, several samplings wereperformed when the shade cloth came off 50 days after budbreak. Subsequent samplings weredone at 10-day intervals until 90 days after budbreak. Leaves and buds were sampled from nodesone to 17 and were lyophilized. The samples were then stored at 4C until analysis. Analysis ofTNC was conducted using procedures adapted from Davis (1976) and Smith (1981). Thesamples were ground and 200 mg of each sample was weighed into Erlenmeyer flasks. Sampleswere then treated with 50 ml of 0.01N hydrochloric acid and heated for 30 minutes at 100C. Thesamples were then cooled and 20 ml of the 0.5% enzyme solution (5 g of Mylase 100 enzymedissolved in 1000 ml of distilled water) was added to each sample and incubated for 42 hours.Mylase 100 has rapid saccharogenic activity and no apparent hemicellulolytic or cellulolyticactivity (Smith 1981). Mylase hydrolyzes starches and disaccharides to monosaccharides (Smith,1981). The samples were then tested on a standard Technicon Autoanalyzer and the totalnonstructural carbohydrates were determined by the p-hydroxy benzoic acid hydrazide(PAHBAH) method of Ferraro et al. (1976).
Statistical Analysis: In both Somerset and Willowcroft Vineyards, the designs were completelyrandomized. There were 6 treatments, which consisted of shaded and non-shaded panels,replicated six times in Somerset Vineyard. In Willowcroft Vineyard, there were 2 treatments ofshaded and unshaded panels, replicated five times. PPF data were square root transformed, andBN rating data were arcsin-square root transformed before analysis by ANOVA (SAS Institute,1990). Shoot density data (point quadrat analysis), shoot diameter, average internode length, andTNC data were also compared by ANOVA (SAS Institute, 1990). Mean separation was doneusing Duncan’s procedure. Contrast analysis was done between Shade I vs Control I, Shade II vsControl II, Shade III vs Control III, Shade I vs Shade II, Shade I vs Shade III, and Shade II vsShade III (treatments at Somerset Vineyard) for the variables, average BN, shoot diameter, andaverage internode length (SAS Institute, 1990).
40
Effect of Shade on BN in ‘Riesling’ Grapevines, 1996Vineyard: A second shade experiment was conducted at Willowcroft Vineyard in 1996. Shadetreatments commenced at 25 (Shade I) and 65 (Shade II) days after budbreak with each lasting 40days. Shade treatment consisted of neutral black 92% shade cloth suspended over three-vineplots. Each shade treatment was replicated 4 times and compared to an equal number of controlplots for each shade period (Control I and Control II). Vines were trained to bilateral cordons aspreviously described and spur pruned. Shoots were positioned to grow vertically upright.
Canopy point quadrat analyses (Smart et al., 1990) were also done about 100 days after budbreakas previously described. The number of leaf layers, percent gaps, percent fruit clusters andpercent interior leaves were calculated. Light measurements (PPF) were also made as previouslydescribed, between 1100 and 1400 HR, 30 days after each shade treatment was erected using aLI-COR 1.0 m line quantum sensor and a LI-COR photometer. Average PPF was calculated foreach treatment plot. Fruit cluster counts on the vines were made for Shade I and Control I panelsafter the shade cloth was removed. Net photosynthesis was measured for Shade II and Control IIpanels using a portable infra-red gas analyzer (ADC LCA2, The Analytical Development Co.,Ltd.) with a leaf chamber (ADC PLC-7504). Ten measurements were made for each three-vineplot between 1000 and 1200 HR, 40 days after shade II was applied, at ambient light levels of1600 to 1900 µmol⋅m-2⋅s-1. Net photosynthetic rate was determined using the formula Pn = (∆CO2⋅F⋅K) / A wherePn = net photosynthesis in µmol CO2⋅m
-2⋅sec-1
∆CO2 = change in CO2 concentration between interior and exterior of the leaf as ppm by volume × 10-6
F = air flow in L⋅sec-1
K = ((44000mg of CO2)/22.4) × (273/294) × (103/44) (an approximate conversion for liter of CO2
to µmol of CO2)A = area of leaf chamber (0.000625 m2)Two shoots were sampled per panel for carbohydrate analysis as soon as the shade cloth wasremoved: 66 days after budbreak for Shade I and Control I and 106 days after budbreak for ShadeII and Control II panels. Subsequent samplings were made at 86 days after budbreak and 126days after budbreak for Shade I and 126 days after budbreak for Shade II. The shoots wereseparated into bud, leaf, and stem tissues. The buds were sampled from nodes 1 through 20.Leaf and stem tissues were sampled from node 5 through 10. The tissues were freeze-dried aspreviously described and stored at 4C until analysis of carbohydrates. Levels of sucrose, glucose,fructose, and starch were analyzed by HPLC. BN assessment was also done as previouslydescribed on 10 shoots per vine on 28 October, 1996.
Statistical Analysis: The design was completely randomized with four treatments consisting ofshaded and non-shaded three-vine plots, each replicated four times. The treatments were Shade Iand Control I applied 25 days after budbreak and Shade II and Control II applied 65 days afterbudbreak with each lasting 40 days. PPF data were square root transformed, and BN rating datawere arcsin-square root transformed before comparison by ANOVA (SAS Institute, 1990). The

41
shoot density data, photosynthesis data, and carbohydrate concentration data were also analyzedby ANOVA. Carbohydrate levels at different sampling dates within each organ were comparedusing the PDIFF option of SAS’s GLM procedure.
Effect of Shoot Tipping on ‘Riesling’ BN, 1996Vineyard: This experiment was conducted at the Alson H. Smith Agricultural Research andExtension Center, Winchester (AHS AREC) Vineyard in 1996. Six ‘Riesling’ vines were selectedfor the experiment. The vines were trained to a Geneva Double Curtain system and were spacedat a distance of 2.1m apart in rows 3.7 m wide. The treatments consisted of shoot-tipped andnon-shoot-tipped single vines replicated three times. Budbreak was on 25 April, 1996. The shootdensity was standardized to 15 shoots per meter of canopy 15 days after budbreak. All shoots ofthree vines were tipped 40 days after budbreak. After shoot tip removal the shoots hadapproximately 17 to 18 nodes. Ten representative shoots, each with two fruit clusters, wereselected per vine for assessment of fruit set and BN. Vine measurements consisted of fruit setrating, carbohydrate analysis of stem, leaf and bud tissues, and BN rating.
Fruit Set Rating: As the hypothesis was shoot tip removal would remove a competing sinkcausing carbon reserves to be diverted to fruit clusters and other vegetative parts, shoot-tippedvines should have greater fruit set than control vines. Therefore, fruit set rating was done bydetermining the percent of flowers that set fruits (Matthews and Anderson, 1988). Both clusterson selected shoots were bagged with cloth bags (5" W × 8" L) approximately two weeks beforeanthesis (75% bloom was on 15 June, 1996). Approximately 20 days after full bloom (7 July,1996) percent fruit set was determined after counting all set berries, shot berries, and abortedovaries.
Representative shoots were sampled for carbohydrate analysis by HPLC four times at 10-dayintervals starting 50 days after budbreak. Stem and leaf tissue from nodes 5 through 13, and budsfrom all nodes (1-17) were collected for analysis. BN assessment was also performed aspreviously described in October, 1996.
Statistical Analysis: The design was completely randomized with two treatments, whichconsisted of shoot-tipped and non-shoot-tipped vines. A single vine formed an experimental unit.The variables of interest, fruit set, percentage of BN, and carbohydrate levels, were analyzed byANOVA (SAS Institute, 1990). The BN rating data were arcsin-square root transformed beforeanalysis by ANOVA. Mean separation was done using least squares means with the PDIFFoption of GLM procedure of SAS (SAS Institute, 1990).
Mineral Nutrient and Carbohydrate Survey of ‘Riesling’ Grapevines, 1995Vineyards: ‘Riesling’ and ‘Chardonnay’ vines of Prince Michel Vineyard, Virginia and ‘Riesling’vines of AHS AREC Vineyard were surveyed for mineral nutrient and carbohydrate levels in bud,leaf, and stem tissues from May 1995 to July 1995. Prince Michel ‘Riesling’ vines had a historyof high BN occurrence (67% BN) while ‘Chardonnay’ vines annually expressed only 7% BN(Wolf and Warren, 1995) and Winchester ‘Riesling’ vines expressed 7.3% BN. The vines in both
42
the vineyards were trained to a bilateral cordon system with vertical shoot positioning. The vinesat Prince Michel Vineyard were spaced at a distance of 1.1 m in rows 2.7 m wide. At AHSAREC, Winchester, the row × vine spacing was 3.7 m × 2.1 m. The shoot density in bothvineyards was standardized to 15 shoots per meter of canopy 45 days after budbreak. Thesampling strategy for tissue analysis was completely randomized and involved three replications of5 vines each per cultivar (‘Riesling’ and ‘Chardonnay’) in Prince Michel Vineyard and fourreplications of 3 ‘Riesling’ vines each in Winchester. Random sampling of two representativeshoots per panel was done at 10-day intervals starting 50 days after budbreak until 90 days afterbudbreak. The bud, leaf, and stem tissues were frozen separately by submerging in liquid nitrogenin the field. The tissues were then transported to the lab on dry ice and stored in a freezer at -80C. The tissues were then lyophilized and stored at 4C. Nutrient analysis was done on leaf,bud, and stem tissues collected from ‘Riesling’ and ‘Chardonnay’ vines of Prince Michel Vineyardby the ICP technique described earlier. Carbohydrate analysis was done on tissues collected from‘Riesling’ and ‘Chardonnay’ vines of Prince Michel Vineyard as well as from ‘Riesling’ vines ofAHS AREC, Winchester by HPLC.
BN assessment was done on both ‘Riesling’ and ‘Chardonnay’ from Prince Michel Vineyard andon ‘Riesling’ from AHS AREC, Winchester at the end of the growing season in October, 1995.Twelve shoots were sampled for BN rating.
Statistical Analysis: Mineral nutrient and carbohydrate data were analyzed by ANOVA (SASInstitute, 1990). Mean separation for mineral nutrients data and carbohydrate concentration dataat different sampling dates within each organ was done using least squares means with the PDIFFoption of GLM procedure of SAS (SAS Institute, 1990).
Starch Rating of Grape Cultivars, 1996Vineyard: This study was conducted in AHS AREC, Winchester in 1996. Three BN-pronecultivars, ‘Riesling’, ‘Viognier’, and ‘Syrah’, were selected and compared with the BN-resistantcultivar, ‘Chardonnay’ for the relative amount of starch in the axillary buds during summer. Allvines were at least three years old and were spaced at a distance of 2.1 m in rows 3.7 m wide.The vines were trained to bilateral cordons with vertical shoot positioning. Two representativeshoots were sampled randomly from three vines per cultivar at each sample date. The shootswere sampled at intervals of 10 days, starting 50 days after budbreak, until 80 days afterbudbreak. Buds at nodes 1 through 13 from the base were examined for starch levels. Eachshoot was divided into two sections: a basal section of nodes 1 to 6 and an apical section of nodes7 to 13. A total of twelve buds from each section was examined for starch. Budbreak for‘Riesling’, ‘Syrah’ and ‘Viognier’ was on 24 April, 1996 and for ‘Chardonnay’ on 21 April, 1996.But all the cultivars were sampled using 24 April, 1996 as a reference point for budbreak.
Starch staining: Buds of sampled shoots were longitudinally sectioned through the center with arazor. One half of the bud was then stained in iodine-potassium iodide (IKI) solution (0.2 g ofiodine dissolved in 100 ml of 2% potassium iodide solution in water) for 1 HR and examinedunder a dissection microscope at 2X magnification. On interaction with iodine, the amylose part

43
of starch stains blue and the amylopectin part reddish violet (Hesse and Hitz, 1938). A visual key(Table 4.1) was created based on different intensities of starch stain as well as parts of the budsstained, to enable quantification of starch in the buds with progression of summer, 1996.
A BN assessment was made with all cultivars in October, 1996. Ten shoots per replicate weresampled randomly for each cultivar for BN rating.
Statistical Analysis: The design was completely randomized with four treatments, whichconsisted of cultivars, replicated three times. A single vine formed the experimental unit.Numerical starch rating data were analyzed by a multivariate repeated measures procedure usingthe REPEATED statement of SAS’s GLM procedure (SAS Institute, 1990). Interactions ofsampling date, cultivar, and node position were explored by using the least squares means withthe PDIFF option of SAS’s GLM procedure. Regression analysis of starch data with BN data of‘Riesling’, ‘Viognier’, ‘Syrah’, and ‘Chardonnay’ was performed using PROC GLM procedure ofSAS (SAS Institute, 1990).
RESULTS
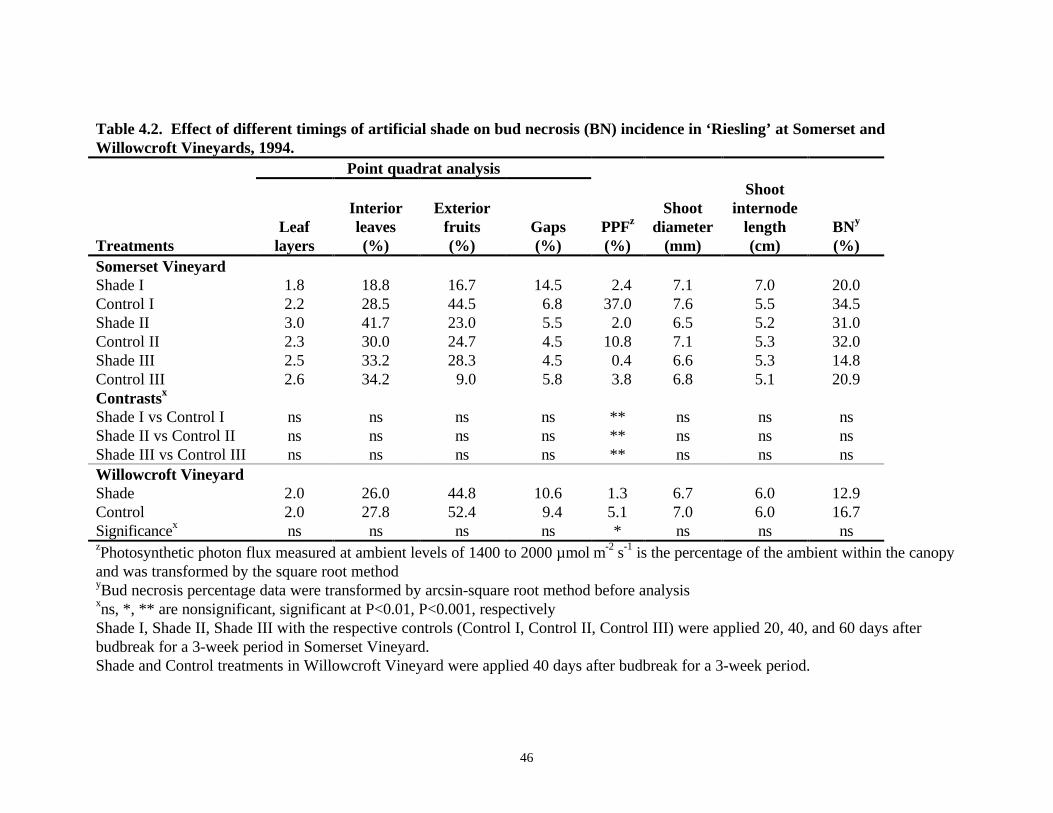
Shade Experiment, 1994Three-week periods of shade, applied 20, 40, or 60 days after budbreak at Somerset Vineyard, orat 40 days after budbreak at Willowcroft Vineyard, did not increase BN (Table 4.2). Lightmeasurements of the shade and control plots demonstrated that shading was effective in excluding92% of PPF in the fruit zone of shaded vines (Table 4.2). Plant canopies were uniform andrelatively thin (Smart et al., 1990) at Somerset Vineyard with 2.4 leaf layers, 31.1% interiorleaves, 24.4% exterior fruits and 6.9% canopy gaps. Uniform canopy density was observed inWillowcroft Vineyard as well, where canopies averaged 2.0 leaf layers, 26.9% interior leaves,48.6% exterior fruits, and 10.0% canopy gaps. Contrasts between shade treatments and theirrespective controls (Table 4.2), as well as between the different shade treatments (data notshown) revealed no significant difference in BN incidence despite the different light levels inshaded and control plots. The percentage of BN incidence, averaged over all treatments, washigher in Somerset Vineyard (29%) than at Willowcroft Vineyard (15%) (Table 4.2). Anevaluation of different sections of the tagged shoots revealed a higher incidence of BN for nodes 5to 16 (25 to 46% at Somerset and 10 to 26% at Willowcroft) compared to the basal four nodes,which had a very low rate of BN incidence (11% at Somerset and 3% at Willowcroft) (Table 4.3).
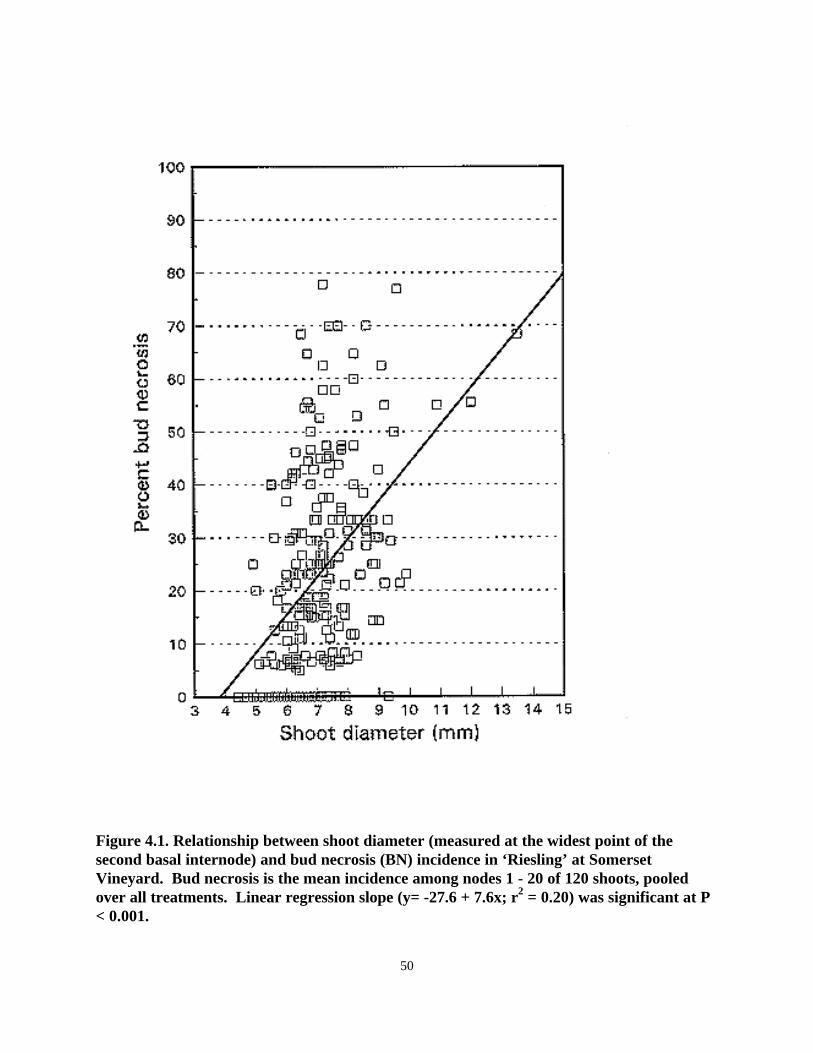
Regression analysis revealed a weak but positive correlation between BN and shoot vigor in bothvineyards, where “vigor” was expressed as a function of shoot diameter (Fig. 4.1), or averageinternode length (data not shown).

44
Table 4.1. Visual key for iodine-potassium iodide starch staining rating

45
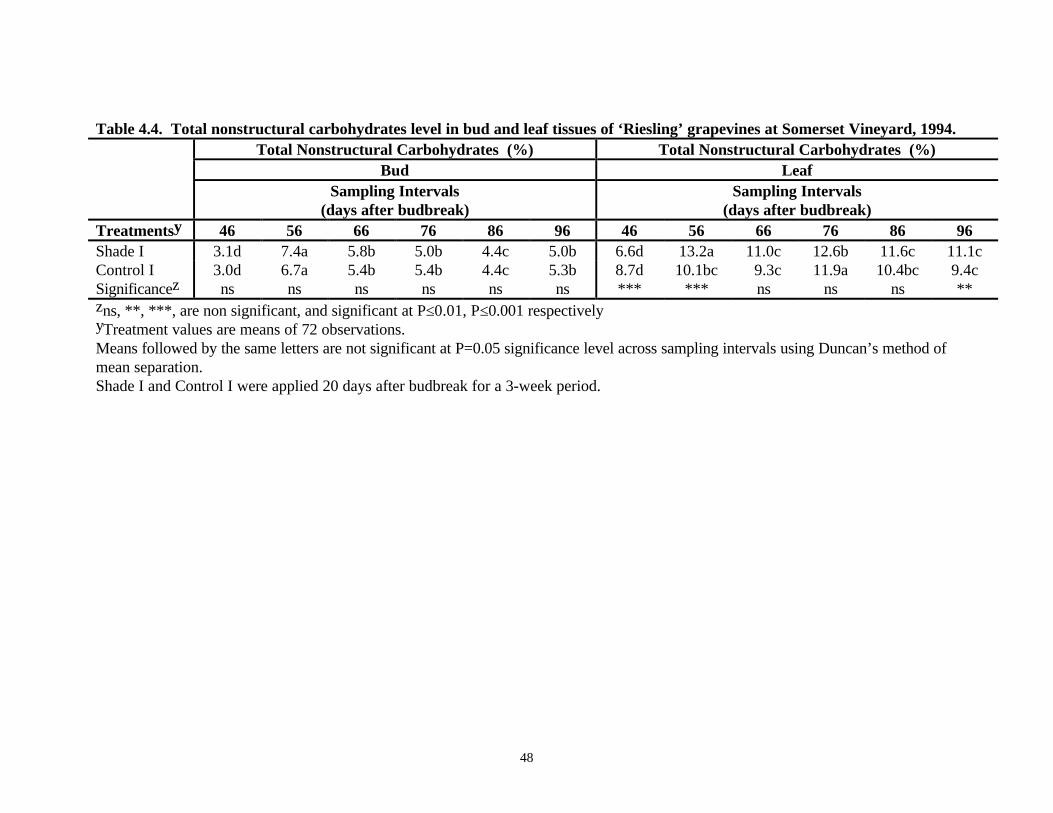
Analysis of total nonstructural carbohydrates (TNC) in bud tissues of ‘Riesling’ vines at SomersetVineyard revealed no significant difference between shade (6.8% dry weight) and control (6.6%dry weight) panels (Table 4.4). TNC levels in leaf tissues did not reveal any significant differenceeither (Table 4.4). TNC level was lower at 40 days after budbreak in the bud (3.1%) and leaf(3.0%) then increased at 50 days after budbreak before leveling off (Table 4.4). At WillowcroftVineyard, TNC levels did not reveal any significant difference between shade and control plots inbud or leaf tissues. Here, the TNC level was higher at 50 and 60 days after budbreak than at 70and 80 days after budbreak (Table 4.5). Leaf tissues showed a different trend. The level of TNCwas highest at 60 days after budbreak followed by a decrease at subsequent sampling intervals(Table 4.5).
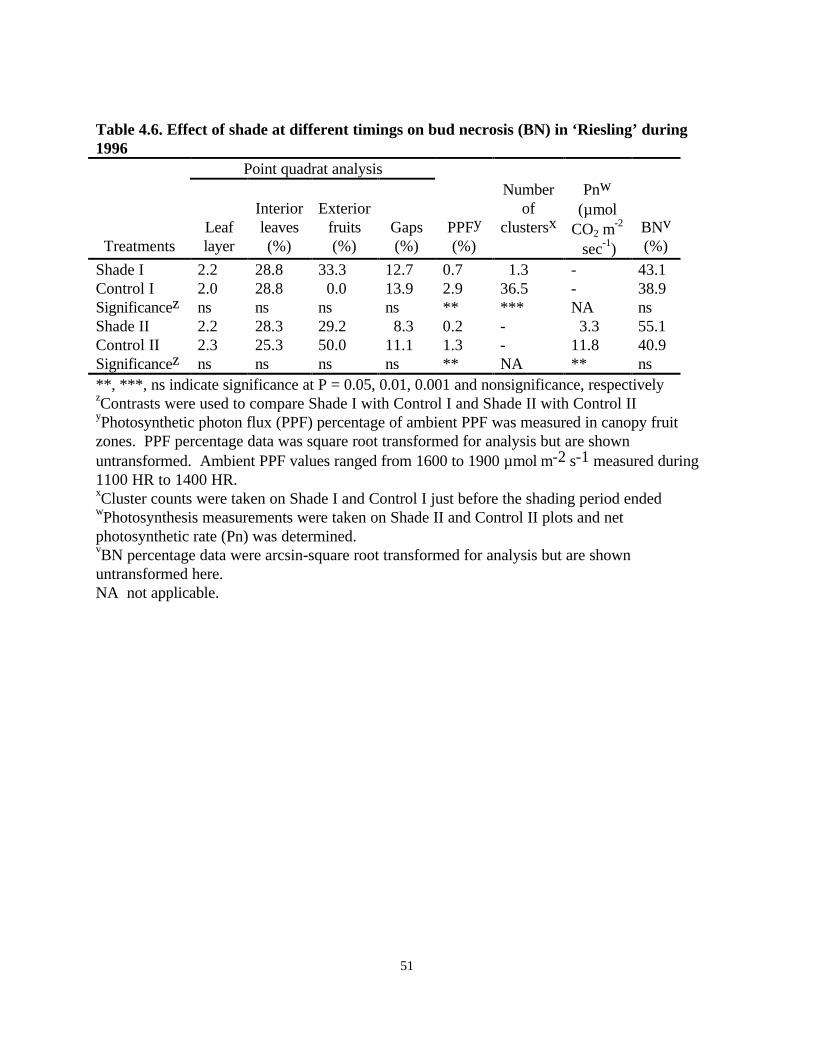
Shade Experiment, 1996Forty-day periods of shade, applied either at 25 or 65 days after budbreak, did not increase BN atWillowcroft Vineyards in 1996 (Table 4.6). Light measurements of shade and control panelsagain demonstrated that shading was effective in excluding 92% of PPF (Table 4.6). Canopydensity was also uniform.2 leaf layers, 27.8% interior leaves, 28.2% exterior fruits, 11.5% canopygaps (Table 4.6). Fruit cluster number was much lower in Shade I compared to Control I (Table4.6). Yield of Shade II and Control II panels could not be measured because of very high birdand deer depredation. Net photosynthetic rate was significantly higher for Control II panels (11.8µmol·CO2·m
-2·s-1), compared to Shade II panels (3.3 µmol·CO2·m-2·s-1) (Table 4.6). Contrasts
between shade and control treatments, as well as between the shade treatments (data not shown)did not reveal any significant increase in BN in shaded panels despite the different light levels(Table 4.6).
An evaluation of BN at different node sections revealed a higher incidence of BN at nodes 5 to 20compared to the basal four nodes (Fig. 4.2). There was no significant difference between shadedand control panels in the first two node sections (1-4 and 5-8). Shade I increased BN in nodesdistal to 9 while shade II increased BN in the last two node sections, 13-16 and 17-20 than didcontrol ‘Riesling’ vines (Table 4.6).
Carbohydrate analyses of bud, leaf, and stem tissues revealed that sucrose, glucose, fructose, andstarch levels were significantly lower immediately after the shade was removed in the shadedpanels in bud, leaf, and stem tissues, compared to the control panels (Table 4.7). However, atsubsequent samplings in shade I, the levels of carbohydrates were comparable between shade andcontrol panels which was due to an increase in sugar levels in buds from shaded vines. In shadeII, even though the levels of sucrose, glucose, fructose, and starch increased at the subsequentsampling, the levels of carbohydrates were significantly lower than in unshaded vine tissues. Inthe control vines, the levels of sucrose, glucose, and fructose in bud, leaf, and stem tissuesdecreased steadily. Starch levels increased in all the treatments (Table 4.7).
46
Table 4.2. Effect of different timings of artificial shade on bud necrosis (BN) incidence in ‘Riesling’ at Somerset andWillowcroft Vineyards, 1994.
Point quadrat analysis
TreatmentsLeaf
layers
Interiorleaves(%)
Exteriorfruits(%)
Gaps(%)
PPFz
(%)
Shootdiameter
(mm)
Shootinternode
length(cm)
BNy
(%)Somerset VineyardShade I 1.8 18.8 16.7 14.5 2.4 7.1 7.0 20.0Control I 2.2 28.5 44.5 6.8 37.0 7.6 5.5 34.5Shade II 3.0 41.7 23.0 5.5 2.0 6.5 5.2 31.0Control II 2.3 30.0 24.7 4.5 10.8 7.1 5.3 32.0Shade III 2.5 33.2 28.3 4.5 0.4 6.6 5.3 14.8Control III 2.6 34.2 9.0 5.8 3.8 6.8 5.1 20.9Contrastsx
Shade I vs Control I ns ns ns ns ** ns ns nsShade II vs Control II ns ns ns ns ** ns ns nsShade III vs Control III ns ns ns ns ** ns ns nsWillowcroft VineyardShade 2.0 26.0 44.8 10.6 1.3 6.7 6.0 12.9Control 2.0 27.8 52.4 9.4 5.1 7.0 6.0 16.7Significancex ns ns ns ns * ns ns nszPhotosynthetic photon flux measured at ambient levels of 1400 to 2000 µmol⋅m-2⋅s-1 is the percentage of the ambient within the canopyand was transformed by the square root methodyBud necrosis percentage data were transformed by arcsin-square root method before analysisxns, *, ** are nonsignificant, significant at P<0.01, P<0.001, respectivelyShade I, Shade II, Shade III with the respective controls (Control I, Control II, Control III) were applied 20, 40, and 60 days afterbudbreak for a 3-week period in Somerset Vineyard.Shade and Control treatments in Willowcroft Vineyard were applied 40 days after budbreak for a 3-week period.

47
Table 4.3. Effect of node position on bud necrosis (BN) incidence in ‘Riesling’ grapevines at Somerset and WillowcroftVineyards, 1994.
BN (%)Node positionx
Treatments 1 - 4 5 - 8 9 - 12 13 - 16 17 - 20 Significancey,z
Somerset VineyardShade I 8.8 11.9 31.8 53.9 56.3 *Control I 12.1 32.0 50.1 53.1 79.7 *Shade II 15.9 37.1 41.8 49.5 54.3 *Control II 14.2 34.6 44.7 55.5 61.2 *Shade III 6.7 13.4 21.2 24.1 57.3 *Control III 10.2 23.3 33.4 42.3 56.8 *Significancew,y ns ns ns ns nsWillowcroft VineyardShade 2.2 4.3 28.9 20.1 41.7 *Control 3.1 12.0 25.0 32.4 16.0 *Significancew,y ns ns ns ns nszAnalysis was done using repeated measures analysis of variance.yns, * are nonsignificant and significant at P<0.001 respectivelyxBud necrosis percentage is expressed in each section of the shoot defined by the node position. Bud necrosis percentage data weretransformed by arcsin-square root method before analysis.wData was analyzed by the analysis of variance procedure.Shade I, Shade II, Shade III with the respective controls (Control I, Control II, Control III) were applied 20, 40, and 60 days afterbudbreak for a 3-week period in Somerset Vineyard.Shade and Control treatments in Willowcroft Vineyard were applied 40 days after budbreak for a 3-week period.
48
Table 4.4. Total nonstructural carbohydrates level in bud and leaf tissues of ‘Riesling’ grapevines at Somerset Vineyard, 1994.Total Nonstructural Carbohydrates (%) Total Nonstructural Carbohydrates (%)
Bud LeafSampling Intervals
(days after budbreak)Sampling Intervals
(days after budbreak)Treatmentsy 46 56 66 76 86 96 46 56 66 76 86 96Shade I 3.1d 7.4a 5.8b 5.0b 4.4c 5.0b 6.6d 13.2a 11.0c 12.6b 11.6c 11.1cControl I 3.0d 6.7a 5.4b 5.4b 4.4c 5.3b 8.7d 10.1bc 9.3c 11.9a 10.4bc 9.4cSignificancez ns ns ns ns ns ns *** *** ns ns ns **zns, **, ***, are non significant, and significant at P≤0.01, P≤0.001 respectivelyyTreatment values are means of 72 observations.Means followed by the same letters are not significant at P=0.05 significance level across sampling intervals using Duncan’s method ofmean separation.Shade I and Control I were applied 20 days after budbreak for a 3-week period.

49
Table 4.5. Total nonstructural carbohydrates level in bud and leaf tissues of ‘Riesling’ grapevines at Willowcroft Vineyard,1994.
Total Nonstructural Carbohydrates(%)
Total Nonstructural Carbohydrates(%)
Bud LeafSampling Intervals
(days after budbreak)Sampling Intervals
(days after budbreak)Treatmentsy 56 66 76 86 56 66 76 86Shade 4.5a 5.0a 4.1b 3.8b 6.8c 11.0a 9.4b 8.6abControl 5.1a 5.3a 4.0b 3.8b 9.0b 10.8a 8.3b 8.1bSignificancez ns ns ns ns ** ns ns nszns, ** are non-significant and significant at P≤0.01, respectivelyyTreatment values are means of 40 observations.Means followed by the same letters are not significant at P=0.05 significance level across samplingintervals using Duncan’s method of mean separation.Shade and control treatments were applied 40 days after budbreak for a 3-week period.
50
Figure 4.1. Relationship between shoot diameter (measured at the widest point of thesecond basal internode) and bud necrosis (BN) incidence in ‘Riesling’ at SomersetVineyard. Bud necrosis is the mean incidence among nodes 1 - 20 of 120 shoots, pooledover all treatments. Linear regression slope (y= -27.6 + 7.6x; r2 = 0.20) was significant at P< 0.001.
51
Table 4.6. Effect of shade at different timings on bud necrosis (BN) in ‘Riesling’ during1996
Point quadrat analysis
TreatmentsLeaflayer
Interiorleaves(%)
Exteriorfruits(%)
Gaps(%)
PPFy
(%)
Numberof
clustersx
Pnw
(µmolCO2⋅m
-2
⋅sec-1)BNv
(%)
Shade I 2.2 28.8 33.3 12.7 0.7 1.3 - 43.1Control I 2.0 28.8 0.0 13.9 2.9 36.5 - 38.9Significancez ns ns ns ns ** *** NA nsShade II 2.2 28.3 29.2 8.3 0.2 - 3.3 55.1Control II 2.3 25.3 50.0 11.1 1.3 - 11.8 40.9Significancez ns ns ns ns ** NA ** ns**, ***, ns indicate significance at P = 0.05, 0.01, 0.001 and nonsignificance, respectivelyzContrasts were used to compare Shade I with Control I and Shade II with Control IIyPhotosynthetic photon flux (PPF) percentage of ambient PPF was measured in canopy fruitzones. PPF percentage data was square root transformed for analysis but are shownuntransformed. Ambient PPF values ranged from 1600 to 1900 µmol⋅m-2⋅s-1 measured during1100 HR to 1400 HR.xCluster counts were taken on Shade I and Control I just before the shading period endedwPhotosynthesis measurements were taken on Shade II and Control II plots and netphotosynthetic rate (Pn) was determined.vBN percentage data were arcsin-square root transformed for analysis but are shownuntransformed here.NA not applicable.

52
0
10
20
30
40
50
60
70
80
1 to 4 5 to 8 9 to 12 13 to 16 17 to 20
Shade IControl IShade IIControl II
BN
(%
)
a
b b
ba
b
b
b
b
ab
aaa
a
b b
a
a
b
b
Node position
Figure 4.2. Effect of node position on bud necrosis (BN) in shaded and non-shaded‘Riesling’ vines at Willowcroft Vineyard during 1996. Bars indicated by same letters arenot significantly different at P = 0.05; mean separation done using least squares means withPDIFF option of GLM procedure of SAS.

53
Table 4.7. Carbohydrate analysis of shaded and unshaded ‘Riesling’ vines at WillowcroftVineyard, Virginia during 1996.
Carbohydrates (mg⋅g-1 of dried plant tissue) x
Shadeperiod Organ Treatmentz
Samplingstagey
(days) Sucrose Glucose Fructose StarchI Bud Shade 66 0.20b 0.29c 0.45c 0.006c
(25 days 86 0.28a 0.36b 0.56b 0.012bafter 126 0.27a 0.15d 0.09d 0.016a
budbreak) Control 66 0.28a 0.69a 0.84a 0.011b86 0.28a 0.44b 0.60b 0.012b126 0.25a 0.17d 0.09d 0.019a
Leaf Shade 66 0.35b 0.31c 0.53c 0.076b86 0.84a 0.71a 0.63b 0.079b126 0.87a 0.47c 0.59bc 0.082a
Control 66 0.99a 0.77a 0.97a 0.107a86 1.12a 0.63a 0.79b 0.112a126 1.04a 0.52b 0.52c 0.113a
Stem Shade 66 0.74c 0.79c 0.29c 0.006c86 1.02a 1.06b 0.34b 0.009c126 0.79c 0.83c 0.19d 0.013b
Control 66 1.03a 1.21a 0.44ab 0.020b86 0.99b 1.03b 0.53a 0.019b126 0.86bc 0.97b 0.22d 0.034a
II Bud Shade 106 0.26b 0.07a 0.15a 0.007c(65 days 126 0.27b 0.06a 0.08b 0.011b
after Control 106 0.33a 0.10a 0.10a 0.014bbudbreak) 126 0.36a 0.07a 0.10a 0.021a
Leaf Shade 106 0.62c 0.37b 0.46c 0.057d126 0.99b 0.43b 0.44c 0.072c
Control 106 0.96b 0.53a 0.82a 0.101b126 1.23a 0.50a 0.55b 0.119a
Stem Shade 106 0.32c 0.30c 0.25b 0.007c126 0.39c 0.49b 0.26b 0.011c
Control 106 0.78a 0.95a 0.37a 0.026b126 0.57b 0.83a 0.22b 0.036a

54
Table 4.7. contd.zTreatments were analyzed by Analysis of Variance using the PROC GLM procedure of SAS andequality of treatments was tested within each plant organ.ySampling intervals were measured as number of days after budbreak.xMeans are averages of three observations and means followed by same letters are not significantat P=0.05. The mean separation was done using adjusted with the PDIFF option of SAS. Themean separation was done only within each treatment across the sampling intervals.

55
Shoot Tipping Experiment, 1996The hypothesis of this study was that shoot tipping would divert more photosynthates to thedeveloping buds and fruit clusters, as opposed to translocation to shoot tips, resulting in anincreased fruit set and reduced BN in shoot-tipped vines. However, tipping of shoots did notresult in any significant effect on percentage of aborted fruits, normal fruit set, or shot berries inthe lower or upper clusters (Table 4.8) suggesting that the intended reduction did not occur.
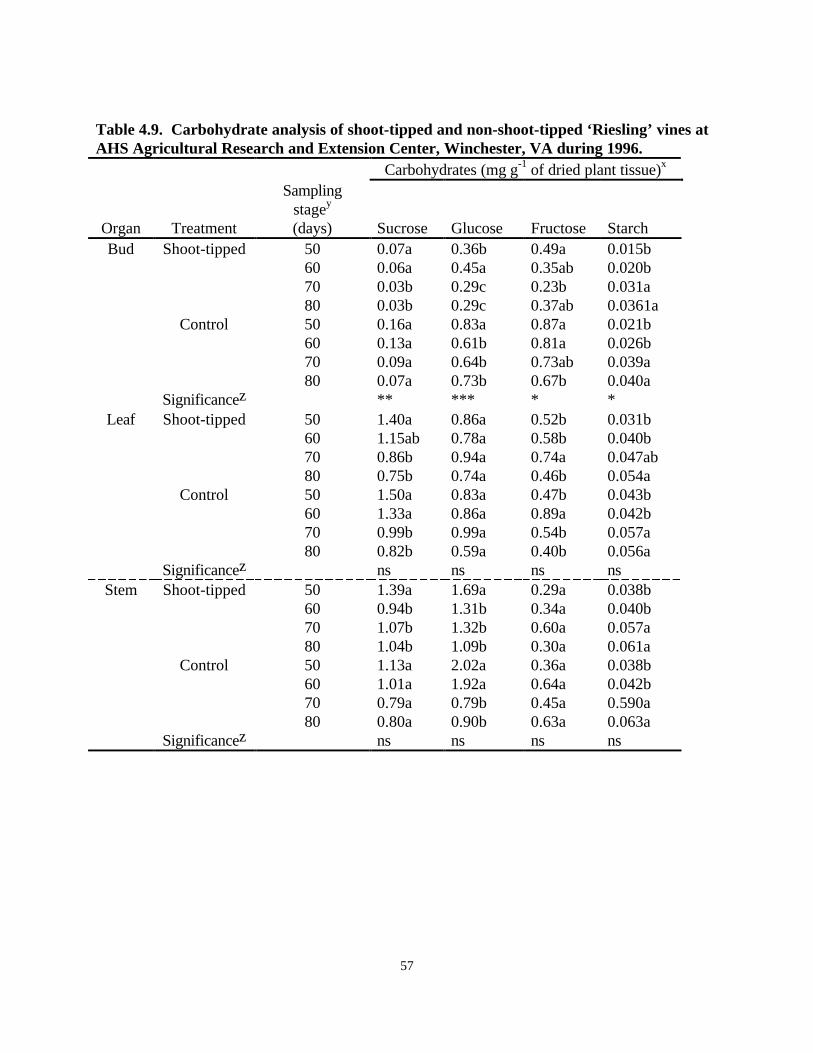
The amount of aborted flowers per lower cluster ranged from 59% to 71%, shot berries from 9%to 10%, and normal berries from 19% to 29% in shoot-tipped vines and the control vines. Theupper clusters had 57% to 54% aborted berries, 8% to 11% shot berries, and 31% to 36% normalberries in shoot-tipped vines and controls (Table 4.8). Levels of carbohydrates such as sucrose,glucose, fructose, and starch were also determined in bud, leaf, and stem tissues of shoot-tippedand control vines (Table 4.9). The levels of sucrose, glucose, and fructose decreased from 50days after budbreak to 80 days after budbreak in bud, stem, and leaf tissues in both shoot-tippedand control vines. Starch, however, showed an increase in all the tissues (Table 4.9). The controlvines had significantly higher levels of sucrose than shoot-tipped vines (Table 4.9). A similartrend was observed in leaves and stems of both shoot-tipped and control vines (Table 4.9).However, there was no significant difference in the levels of sucrose, glucose, fructose, and starchbetween shoot-tipped and control vines.
Statistical analysis of the BN rating data revealed that there was no significant difference betweenshoot-tipped and control vines (Table 4.8). No statistically significant difference was revealed inBN incidence between shoot-tipped vines (47%) and control vines (33%). Statistical analysis ofaverage BN for each node section revealed a significant difference between shoot-tipped vinesand controls at nodes 13-16 and nodes 17-20 (Fig. 4.3). Shoot-tipped vines had lower BN atboth section 13-16 and section 17-20 (58%, 50%, respectively) than in controls (22%, 16%,respectively).

56
Table 4.8. Bud necrosis (BN) and fruit set measurements of shoot-tipped and non-shoot-tipped ‘Riesling’ vinesduring 1996.
Aborted flowers (%) Shot berries (%) Normal fruit set (%)Treatments Lower
clusterUppercluster
Lowercluster
Uppercluster
Lowercluster
Uppercluster
BN(%)y
Shoot-tipped 71.3 57.3 9.1 11.1 19.6 31.6 46.6Control 59.5 54.8 10.9 8.5 29.6 36.7 32.8
Significancez ns ns ns ns ns ns nszTreatments were analyzed by Analysis of Variance using the PROC GLM procedure of SAS and equality of treatments was tested.ns indicates non-significanceyBN is the bud necrosis rating done at the end of the season in October, 1996. BN assessment was done from nodes 1-20 and theaverage BN was determined. The data was transformed by arsin square root transformation method before analysis. The datapresented here are the untransformed values.
57
Table 4.9. Carbohydrate analysis of shoot-tipped and non-shoot-tipped ‘Riesling’ vines atAHS Agricultural Research and Extension Center, Winchester, VA during 1996.
Carbohydrates (mg⋅g-1 of dried plant tissue)x
Organ Treatment
Samplingstagey
(days) Sucrose Glucose Fructose StarchBud Shoot-tipped 50 0.07a 0.36b 0.49a 0.015b
60 0.06a 0.45a 0.35ab 0.020b70 0.03b 0.29c 0.23b 0.031a80 0.03b 0.29c 0.37ab 0.0361a
Control 50 0.16a 0.83a 0.87a 0.021b60 0.13a 0.61b 0.81a 0.026b70 0.09a 0.64b 0.73ab 0.039a80 0.07a 0.73b 0.67b 0.040a
Significancez ** *** * *Leaf Shoot-tipped 50 1.40a 0.86a 0.52b 0.031b
60 1.15ab 0.78a 0.58b 0.040b70 0.86b 0.94a 0.74a 0.047ab80 0.75b 0.74a 0.46b 0.054a
Control 50 1.50a 0.83a 0.47b 0.043b60 1.33a 0.86a 0.89a 0.042b70 0.99b 0.99a 0.54b 0.057a80 0.82b 0.59a 0.40b 0.056a
Significancez ns ns ns nsStem Shoot-tipped 50 1.39a 1.69a 0.29a 0.038b
60 0.94b 1.31b 0.34a 0.040b70 1.07b 1.32b 0.60a 0.057a80 1.04b 1.09b 0.30a 0.061a
Control 50 1.13a 2.02a 0.36a 0.038b60 1.01a 1.92a 0.64a 0.042b70 0.79a 0.79b 0.45a 0.590a80 0.80a 0.90b 0.63a 0.063a
Significancez ns ns ns ns

58
Table 4.9. contd.zTreatments were analyzed by Analysis of Variance using the PROC GLM procedure of SAS andequality of treatments was tested within each plant organySampling stage was measured as number of days after budbreakxMeans are averages of three observations and means followed by same letters are not significantat P=0.05. The mean separation was done by using adjusted means with the PDIFF option ofSAS. The mean separation was done only within each treatment across the sampling intervals.*, **, ***, ns indicate significance at P=0.05, 0.01, 0.001 and non significance respectively

59
0
10
20
30
40
50
60
70
1 to 4 5 to 8 9 to 12 13 to 16 17 to 20
Shoot-tippedControl
BN
(%
)
a a
aa
a
aa
b
a
b
Node position
Figure 4.3. Effect of node position on bud necrosis (BN) in shoot-tipped and non-shoot-tipped ‘Riesling’ vines during 1996. Bars indicated by same letters are not significantlydifferent at P = 0.05; mean separation done using least squares means with PDIFF optionof GLM procedure of SAS.

60
Mineral Nutrient and Carbohydrate Survey, 1995Mineral Nutrient Survey: Average BN was higher for ‘Riesling’ (44%) than ‘Chardonnay’ (15%)(Table 4.10). However, the level of nutrients did not show any difference between cultivars(Table 4.10). Calcium was higher in ‘Riesling’ compared to ‘Chardonnay’ bud tissue. The levelsof magnesium, potassium, boron, and manganese did not show any difference between the twocultivars. Phosphorus was, however, higher in ‘Riesling’ than ‘Chardonnay’ in stem, leaf, and budtissues. The level of nutrients was also compared at 10-day intervals. Calcium in all the tissues,and potassium and boron in leaf and stem tissues in both ‘Riesling’ and ‘Chardonnay’ showedvery little difference among the sampling dates. The other mineral nutrients did show a differenceover the sampling dates. However, there was no definite pattern followed in the two cultivars.Generally, the level of nutrients increased in leaves and remained constant in stem tissue from 70to 90 days after budbreak. All the nutrients decreased in bud tissues over time with the exceptionof manganese. The level of manganese decreased from the first sampling at 50 days afterbudbreak but increased at 90 days after budbreak (Table 4.10).
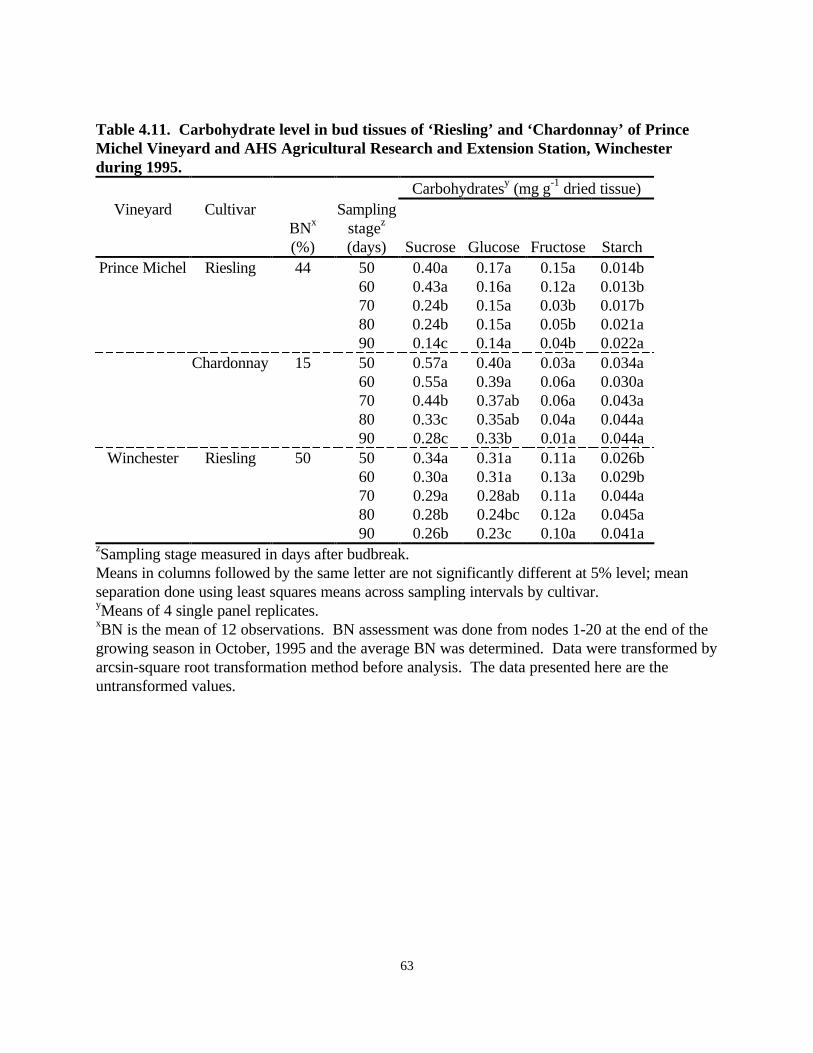
Carbohydrate Survey: The level of monosaccharides such as glucose and fructose and thedisaccharide sucrose decreased at each sampling, starting at 50 days after budbreak until 90 daysafter budbreak (Table 4.11). The level of starch, however, increased with each sampling interval.In the bud tissues of ‘Riesling’ vines of Prince Michel Vineyard, there was a decrease in the levelsof sucrose and fructose, and an increase in starch, but no change in glucose was observed (Table4.11). In ‘Chardonnay’ of Prince Michel Vineyard, there was a decrease in sucrose, glucose, andfructose, and an increase in starch (Table 4.11). In ‘Riesling’ of AHS AREC, Winchester, therewas a decrease in sucrose and glucose, and an increase in starch, but no change in fructose levelswas observed as the summer progressed (Table 4.11). A similar trend was observed in leaves(Table 4.12) and stems (Table 4.13) for both cultivars. The levels of carbohydrates were higher inleaves and stems than in buds at any given sampling stage. Upon examination of buds, leaves, andstems it was observed that Prince Michel ‘Riesling’ vines had the lowest levels of carbohydratesfollowed by AHS AREC, Winchester ‘Riesling’ vines and Prince Michel ‘Chardonnay’ vines.
Rating for BN at the end of the growing season in October revealed a higher incidence of BN inPrince Michel ‘Riesling’ (44%) compared to ‘Chardonnay’ (15%) vines. Prince Michel‘Chardonnay’ had a lower percentage of BN at all nodes compared to ‘Riesling’ vines.Winchester (50%) and Prince Michel (44%) ‘Riesling’ vines had comparable BN incidence (Table4.11, Table 4.12, Table 4.13).

61
Table 4.10. Concentrations of mineral elements in ‘Riesling’ and ‘Chardonnay’ cultivars sampled from Prince MichelVineyard during 1995.
Mineral nutrients (mg⋅g-1 of dried tissue)z
CultivarBN
(%)w Organ
Samplingstageyx
(days) Ca Mg KCa+Mg
K B Mn PRiesling 44 leaf 50 9.45a 1.99ab 7.15a 1.62a 0.03a 0.23bc 2.86a
60 9.17a 1.90b 7.86a 1.57a 0.03a 0.36b 2.08b70 10.25a 2.10ab 6.38a 1.92a 0.02a 0.25bc 1.50c80 9.14a 2.06ab 6.02a 1.84a 0.02a 0.21c 1.39c90 12.04a 2.56a 9.49a 1.60a 0.03a 0.50a 1.49c
stem 70 4.01a 0.86a 7.03a 0.70a 0.02a 0.03b 1.45a80 3.37a 0.62b 6.48a 0.62a 0.02a 0.02b 1.33a90 5.20a 0.84a 7.19a 0.84a 0.02a 0.05a 1.51a
bud 50 12.38a 3.27a 26.27a 0.61b 0.07a 0.15ab 4.10a60 10.38a 2.32b 18.75b 0.72ab 0.04b 0.16ab 2.96b70 10.61a 2.05b 13.13b 0.98ab 0.03b 0.10b 2.53b80 12.44a 2.09b 15.71b 0.97ab 0.04b 0.11b 2.49b90 11.44a 2.41b 12.81b 1.21a 0.04b 0.19a 2.22b

62
Table 4.10. contd.Mineral nutrients (mg⋅g-1 of dried tissue)z
CultivarBN
(%)w Organ
Samplingstageyx
(days) Ca Mg KCa+Mg
K B Mn PChardonnay 15 leaf 50 9.57a 2.17bc 7.50a 1.63a 0.03a 0.33bc 1.92a
60 12.09a 2.54ab 8.44a 1.78a 0.03a 0.53a 1.97a70 13.36a 2.93a 7.50a 2.26a 0.03a 0.47ab 1.60ab80 9.25a 1.85c 5.96a 1.98a 0.02a 0.27c 1.24b90 13.25a 3.00a 7.03a 2.42a 0.03a 0.61a 1.23b
stem 70 6.09a 1.27a 6.13a 1.24a 0.02a 0.10a 1.10a80 5.41a 1.32a 6.41a 1.10a 0.02a 0.05a 1.06a90 6.38a 1.43a 8.84a 0.95a 0.02a 0.10a 0.81a
bud 50 10.92a 2.88a 26.83a 0.53b 0.07a 0.18ab 2.66a60 10.93a 2.93a 19.65ab 0.74b 0.04b 0.19a 2.13ab70 9.60a 2.69a 19.12ab 0.64b 0.04b 0.15bc 1.85bc80 9.83a 2.61a 11.60b 1.20a 0.03b 0.13c 1.64bc90 9.18a 2.47a 15.40b 0.77b 0.03b 0.19a 1.35c
zMeans of 3 panel replicatesySampling intervals were measured as number of days after budbreakxThe sampling intervals within each plant organ were analyzed by the PROC GLM procedure and REPEATED MEASURES of SAS.Means in columns followed by the same letters are not significantly different at 5% significance level using Duncan’s mean separationmethod within each plant organ across sampling intervals.wBN (Average bud necrosis) is the mean of 12 observations. BN assessment was done from nodes 1-20 at the end of the growingseason in October, 1995 and the average BN was determined. The data was transformed by arsin square root transformation methodbefore analysis. The data presented here are the untransformed values.
63
Table 4.11. Carbohydrate level in bud tissues of ‘Riesling’ and ‘Chardonnay’ of PrinceMichel Vineyard and AHS Agricultural Research and Extension Station, Winchesterduring 1995.
Carbohydratesy (mg⋅g-1 dried tissue)Vineyard Cultivar
BNx
(%)
Samplingstagez
(days) Sucrose Glucose Fructose StarchPrince Michel Riesling 44 50 0.40a 0.17a 0.15a 0.014b
60 0.43a 0.16a 0.12a 0.013b70 0.24b 0.15a 0.03b 0.017b80 0.24b 0.15a 0.05b 0.021a90 0.14c 0.14a 0.04b 0.022a
Chardonnay 15 50 0.57a 0.40a 0.03a 0.034a60 0.55a 0.39a 0.06a 0.030a70 0.44b 0.37ab 0.06a 0.043a80 0.33c 0.35ab 0.04a 0.044a90 0.28c 0.33b 0.01a 0.044a
Winchester Riesling 50 50 0.34a 0.31a 0.11a 0.026b60 0.30a 0.31a 0.13a 0.029b70 0.29a 0.28ab 0.11a 0.044a80 0.28b 0.24bc 0.12a 0.045a90 0.26b 0.23c 0.10a 0.041a
zSampling stage measured in days after budbreak.Means in columns followed by the same letter are not significantly different at 5% level; meanseparation done using least squares means across sampling intervals by cultivar.yMeans of 4 single panel replicates.xBN is the mean of 12 observations. BN assessment was done from nodes 1-20 at the end of thegrowing season in October, 1995 and the average BN was determined. Data were transformed byarcsin-square root transformation method before analysis. The data presented here are theuntransformed values.

64
Table 4.12. Carbohydrate level in leaf tissues of ‘Riesling’ and ‘Chardonnay’ of PrinceMichel Vineyard and AHS Agricultural Research and Extension Center, Winchesterduring 1995.
Carbohydratesy (mg⋅g-1 dried tissue)Vineyard Cultivar
BNx
(%)
Samplingstagez
(days) Sucrose Glucose Fructose StarchPrince Michel Riesling 44 50 0.45a 0.57a 0.39a 0.080b
60 0.42a 0.55a 0.32a 0.070b70 0.39b 0.41b 0.27a 0.080b80 0.39b 0.39b 0.23a 0.099a90 0.36b 0.35b 0.16a 0.093a
Chardonnay 15 50 0.54a 0.18a 0.35a 0.071a60 0.52a 0.16a 0.28a 0.054b70 0.48a 0.13a 0.27a 0.055b80 0.45a 0.17a 0.14b 0.069a90 0.45a 0.15a 0.17b 0.073a
Winchester Riesling 50 50 0.54a 0.52a 0.27a 0.030d60 0.50a 0.49a 0.24a 0.053c70 0.57a 0.40b 0.19b 0.051c80 0.51a 0.37b 0.16b 0.066b90 0.55a 0.35b 0.08c 0.075a
zSampling interval measured in days after budbreak.Means in columns followed by the same letter are not significantly different at 5% level; meanseparation done using least squares means across sampling intervals by cultivar.yMeans of 4 single panel replicates.xBN is the mean of 12 observations. BN assessment was done from nodes 1-20 at the end of thegrowing season in October, 1995 and the average BN was determined. Data were transformed byarcsin-square root transformation method before analysis. The data presented here are theuntransformed values.

65
Table 4.13. Carbohydrate level in stem tissues of ‘Riesling’ and ‘Chardonnay’ of PrinceMichel Vineyard and AHS Agricultural Research and Extension Center, Winchesterduring 1995.
Carbohydratesy (mg⋅g-1 dried tissue)Vineyard Cultivar
BNx
(%)
Samplingstagez
(days) Sucrose Glucose Fructose StarchPrince Michel Riesling 44 70 0.49a 0.44a 0.16a 0.045a
80 0.30b 0.37ab 0.13a 0.044a90 0.24b 0.11b 0.11a 0.041a
Chardonnay 15 70 0.53a 0.44b 0.20a 0.044b80 0.50a 0.80a 0.19a 0.099a90 0.36a 0.45b 0.11b 0.098a
Winchester Riesling 50 70 0.38a 0.43a 0.17a 0.034a80 0.39a 0.62a 0.07b 0.042a90 0.40a 0.36a 0.06b 0.055a
zSampling interval measured in days after budbreak.Means in columns followed by the same letter are not significantly different at 5% level; meanseparation done using least squares means across sampling intervals by cultivar.yMeans of 4 single panel replicates.xBN is the mean of 12 observations. BN assessment was done from nodes 1-20 at the end of thegrowing season in October, 1995 and the average BN was determined. Data were transformed byarcsin-square root transformation method before analysis. The data presented here are theuntransformed values.

66
Starch Rating of Grape Cultivars, 1996With the exception of the last sampling date with ‘Chardonnay’, bud starch ratings increased in allcultivars with seasonal progress (Fig. 4.4, Fig. 4.5). The greatest apparent starch increaseoccurred between 60 and 70 days after budbreak, which corresponded to 15 and 25 days afterbloom. There was a significant difference in the amount of starch among the four cultivars (Fig.4.4). At each date ‘Chardonnay’ had the greatest apparent amount of starch followed by‘Riesling’, ‘Viognier’ and ‘Syrah’, with the latter two having approximately equal amounts ofstarch (Fig. 4.4, Fig. 4.5). ‘Riesling’ buds had significantly lower levels of starch than‘Chardonnay’, but higher than ‘Viognier’ and ‘Syrah’ buds at comparable sampling dates(P<0.001) (Fig. 4.5).
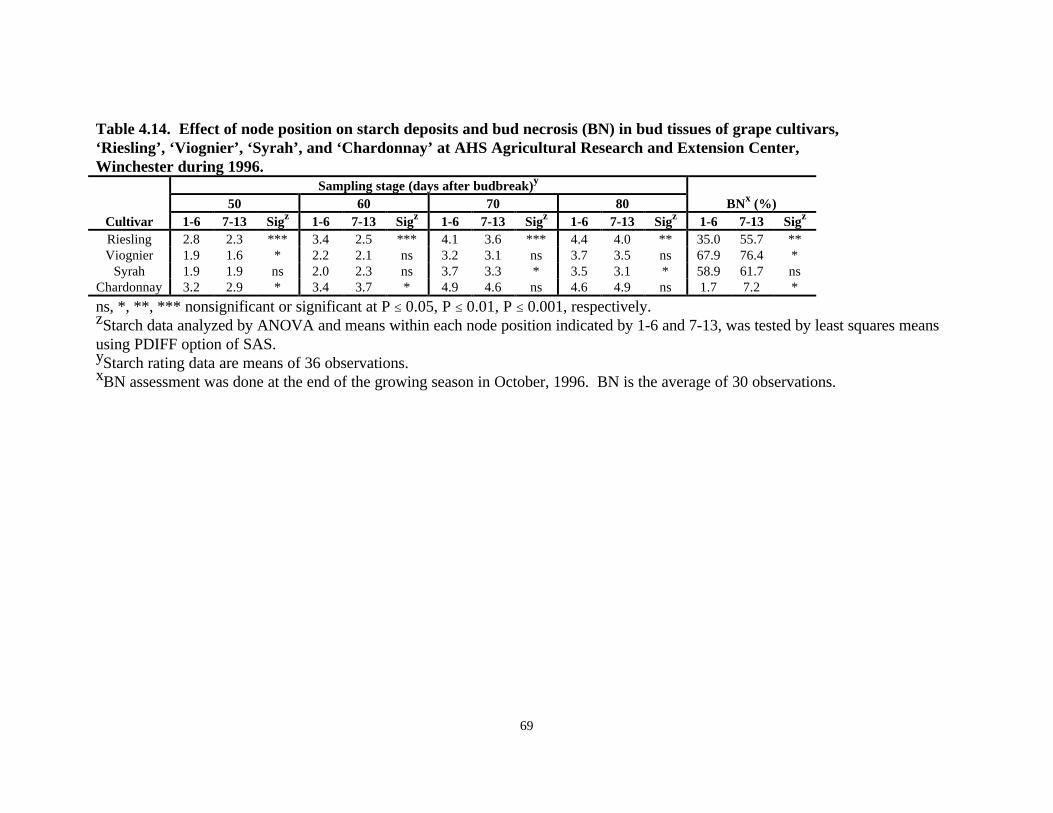
‘Viognier’ and ‘Syrah’ showed almost equal ratings at 50 days (1.7 and 1.8, respectively) and 60days (2.1 and 1.9, respectively) after budbreak. At 70 days after budbreak, ‘Viognier’ (2.6) hadlower levels of starch than ‘Syrah’ (3.0) (P<0.01), while at 80 days after budbreak, ‘Syrah’ (2.9)had less starch than did ‘Viognier’ (3.1). Node position had a variable effect within each cultivar(Table 4.14). ‘Riesling’ revealed greater levels of starch in lower nodes compared to highernodes at all sampling dates. ‘Chardonnay’ buds had significantly greater starch levels in the lowersection than in the upper nodes only at 50 and 60 days after budbreak. Starch level in the twosections at 70 days and 80 days after budbreak did not show any significant difference in‘Chardonnay’. In ‘Riesling’ and ‘Chardonnay’, the basal 6 nodes generally had higher levels ofstarch than did the more apical nodes. ‘Viognier’ and ‘Syrah’, on the other hand, did not revealany significant node position effect with respect to starch levels (Table 4.14). With the exceptionof ‘Syrah’, all cultivars had higher BN at nodes 7-13 compared to nodes 1-6. ‘Syrah’ did notreveal any significant node position effect on BN incidence. ‘Viognier’, ‘Syrah’, and ‘Riesling’had higher BN than did ‘Chardonnay’ (Table 4.14). Regression analysis across all four cultivarsrevealed a negative correlation between BN and starch deposits in bud tissues (r2=0.55)(P<0.001) (Fig. 4.6).
DISCUSSION
Shade, whether due to mutual leaf shading (Somda et al., 1991), periods of cloudy weather, orartificial, can cause tissue senescence and organ-specific dysfunctions, such as early fruitabscission in apple (Byers et al., 1991), soybean (Jiang and Egli, 1993), and flower bud or flowerabscission in pepper (Wien et al., 1989). Research by Perez and Kliewer (1990) with ‘ThompsonSeedless’ grapes in Chile indicated that 15-day periods of artificial shade (52%, 25%, or 14% ofambient PPF) increased BN if applied anytime from bloom until veraison. Shade was suggestedas an integral aspect of the BN syndrome (Perez and Kliewer, 1990). Wolf and Warren (1995),however, found no increase in BN of ‘Riesling’ when either 64% or 92% shade was applied in thethree-week period prior to veraison (starting at approximately 85 days after budbreak).

67
0
0.5
1
1.5
2
2.5
3
3.5
4
4.5
5
Riesling Viognier Syrah Chardonnay
day50day60day70day80St
arch
leve
l
Significance level between sample days (P value):
‘Riesling’ ‘Viognier’ ‘Syrah’ ‘Chardonnay’
50 days vs 60 days 0.0012 0.0001 0.0340 0.000150 days vs 70 days 0.0001 0.0001 0.0001 0.000150 days vs 80 days 0.0001 0.0001 0.0001 0.000160 days vs 70 days 0.0001 0.0001 0.0001 0.000160 days vs 80 days 0.0001 0.0001 0.0001 0.000170 days vs 80 days 0.0002 0.0001 0.0497 0.8980
Figure 4.4. Comparison of bud starch levels as a function of date from 50 to 80 days afterbudbreak among four grape cultivars at AHS Agricultural Research and Extension Center,Winchester during 1996.

68
0
0.5
1
1.5
2
2.5
3
3.5
4
4.5
5
day 50 day 60 day 70 day 80
RieslingViognierSyrahChardonnaySt
arch
leve
l
Significance level between cultivars (P value):
Day 50 Day 60 Day 70 Day 80
‘Riesling’ vs ‘Viognier’ 0.0001 0.0001 0.0001 0.0001‘Riesling’ vs ‘Syrah’ 0.0001 0.0001 0.0019 0.0001‘Riesling’ vs ‘Chardonnay’ 0.0001 0.0001 0.0001 0.0001‘Viognier’ vs ‘Chardonnay’ 0.0001 0.0001 0.0001 0.0001‘Syrah’ vs ‘Chardonnay’ 0.0001 0.0001 0.0001 0.0001‘Viognier’ vs ‘Syrah’ 0.1004 0.8054 0.0008 0.0105
Figure 4.5. Comparison of starch levels among four grape cultivars within each samplingdate at AHS Agricultural Research and Extension Center, Winchester during 1996.Sampling was done starting 50 days after budbreak until 80 days after budbreak.
69
Table 4.14. Effect of node position on starch deposits and bud necrosis (BN) in bud tissues of grape cultivars,‘Riesling’, ‘Viognier’, ‘Syrah’, and ‘Chardonnay’ at AHS Agricultural Research and Extension Center,Winchester during 1996.
Sampling stage (days after budbreak)y
50 60 70 80 BNx (%)Cultivar 1-6 7-13 Sigz 1-6 7-13 Sigz 1-6 7-13 Sigz 1-6 7-13 Sigz 1-6 7-13 Sigz
Riesling 2.8 2.3 *** 3.4 2.5 *** 4.1 3.6 *** 4.4 4.0 ** 35.0 55.7 **Viognier 1.9 1.6 * 2.2 2.1 ns 3.2 3.1 ns 3.7 3.5 ns 67.9 76.4 *
Syrah 1.9 1.9 ns 2.0 2.3 ns 3.7 3.3 * 3.5 3.1 * 58.9 61.7 nsChardonnay 3.2 2.9 * 3.4 3.7 * 4.9 4.6 ns 4.6 4.9 ns 1.7 7.2 *
ns, *, **, *** nonsignificant or significant at P ≤ 0.05, P ≤ 0.01, P ≤ 0.001, respectively.zStarch data analyzed by ANOVA and means within each node position indicated by 1-6 and 7-13, was tested by least squares meansusing PDIFF option of SAS.yStarch rating data are means of 36 observations.xBN assessment was done at the end of the growing season in October, 1996. BN is the average of 30 observations.

70
0
20
40
60
80
0 0.5 1 1.5 2 2.5 3 3.5 4 4.5
BN
(%
)
Starch rating
Figure 4.6. Correlation of BN with starch deposits in bud tissues of ‘Riesling’, ‘Viognier’,‘Syrah’, and ‘Chardonnay’ at AHS Agricultural Research and Extension Center,Winchester, VA. Bud necrosis is the mean incidence among nodes 1-20 of 40 shoots pooledover all cultivars. Linear regression slope (y = 125.46 - 28.16x; r2 = 0.55) was significant atP<0.001.

71
Anatomical studies (Chapter 3) have revealed that the earliest, visual evidence of BN in ‘Riesling’buds is observed soon after bloom. Therefore, shade effects early in the bud development periodcould not be ruled out. The current study has shown that artificial shade applied at 20, 40, or 60days after budbreak for a 3-week period did not increase BN of ‘Riesling’ grapevines in twovineyards. But shade applied at 25 or 65 days after budbreak for a 40-day period increased BN in‘Riesling’ vines at the distal nodes than in the basal 8 nodes. Shade applied 25 days afterbudbreak increased BN in nodes distal to 8 and shade applied at 65 days after budbreak increasedBN in nodes distal to 12 than in the basal nodes. Therefore, although a 21-day shading periodwas not long enough to produce a lasting effect on the buds, a season-long shade, which mayoccur with excessively dense canopies, may increase BN frequency. A higher frequency of BNwas observed in nodes 5 to 16 than in the basal four nodes of current season shoots in alltreatments (Table 4.3). Some studies have reported that the highest percentage of BN occurredamong the basal buds (Dry and Coombe, 1994; Lavee et al., 1981; Morrison and Iodi, 1990;Perez and Kliewer, 1990). But in ‘Kyoho’ (Naito et al., 1989) and ‘Riesling’ (Wolf and Warren,1995), a higher frequency of BN was observed in the more distal nodes, than in the basal nodes.The lower frequency of BN in the basal nodes of ‘Riesling’ does permit some yield compensationwhen affected vines are cordon-trained and spur-pruned.
Shoot diameter and average internode length showed positive but weak correlations with BNincidence. Positive correlations between similar growth parameters and BN incidence have alsobeen reported by others (Dry and Coombe, 1994; Lavee et al., 1981; Naito et al., 1989; Wolf andWarren, 1995). In the cultivars, ‘Shiraz’ and ‘Queen of Vineyard’, shoots greater than 10 mm indiameter had a higher incidence of BN than did smaller shoots (<10 mm) (Dry and Coombe,1994; Lavee et al., 1981). Wolf and Warren (1995) reported a positive relationship between BNand cane diameter, specific growth rate, and internode length. While a positive correlationbetween vigor and BN appears common to several BN studies, the establishment of a cause andeffect relationship involving growth processes remains elusive.
One hypothesis tested here was that rapid growth led to carbohydrate or nutrient deprivation inbuds and that, in turn, led to the specific visual symptoms associated with BN. Morrison and Iodi(1990) observed lack of starch grains in necrotic buds but they questioned whether it was thecausal factor or effect of necrosis. Shade experiment conducted in 1996 revealed that shadedpanels had a lower rate of photosynthesis compared to control vines (Table 4.6). Therefore,shaded panels should experience a reduction in carbohydrate levels in bud and leaf tissues. In1994, TNC analysis of leaf and bud tissues of shaded and control panels did not reveal anysignificant difference between the treatments. Grapevines generally, mobilize carbohydratereserves from trunk, arms and roots (Candolfi-Vasconcelos and Koblet, 1990; Candolfi-Vasconcelos et al., 1994) to the shoots during stress conditions. Therefore, in this situationenough carbon reserves might have been translocated, so that no significant difference wasobserved in TNC level. Another reason for observation of a lack of shade effect in the shadeexperiments of 1994 might have been contributed by the comparison of TNCs which are the sumtotal of reducing, non-reducing sugars, and starch. Levels of enough type of sugars might havebeen left unaltered in the shaded panels for the total amount of TNC to not show any significant

72
difference. For instance, Naito et al. (1987) observed higher levels of starch in the strong shootswhich were more prone to BN than the weak shoots and an opposite trend was observed for totalsugars and reducing sugars. Naito et al. (1987) observed no significant difference between totalcarbohydrate levels. Therefore, in 1996, the second shade experiment was conducted in order tomeasure the levels of the individual sugars at different sampling dates and to determine the trendof the sugar concentrations in bud, leaf, and stem tissues as the summer progressed. Sucrose,glucose, fructose, and starch were all at significantly lower levels in bud, leaf, and stem tissues ofshaded panels than in controls as soon as the shade was removed (Table 4.7). However, theshaded vines made up the difference as was evident from the carbohydrate data from subsequentsamplings. The vines might have mobilized carbohydrates or increased photosynthesis whenexposed to higher light levels. Shaded vines had almost no crop yield compared to control vines,thereby eliminating a very dominant sink. Translocation becomes directed into fruit clustersduring fruit set and veraison (Hunter and Visser, 1988; Motomura, 1990). Control panels,therefore, had a major part of their carbon resources diverted into fruit ripening whereas theshaded panels could divert these carbohydrates into the axillary buds enabling them to make upthe reduction in photosynthates during shade as the summer progressed. But shade applied for a40-day period did increase BN in the distal nodes. These distal nodes that developed necrosiswere either very young when shade was applied or developed in shade. These young buds mighthave experienced carbohydrate deficiency during the shading period making them more sensitiveto BN. Therefore, a negative correlation between carbohydrate deprivation and BN incidence isindicated. Radioactive studies with CO2 and analyzing the levels of 14CO2 in shaded basal anddistal nodes would help to establish the sink strength of the nodes.
The objective of the shoot tipping study was to divert nutrients and photosynthates from thegrowing shoot tip to flower clusters and lateral buds. Expected results were an increase in budcarbohydrates and increased fruit set due to greater carbohydrate availability, concomitant todecrease in BN, if BN was due to decreased carbohydrate level. Nonetheless, analysis of fruit setrevealed that there was no significant difference in normal fruit set between shoot-tipped vinesand the controls. Shoot tipping was done rather early in the season at 40 days after budbreak and ≈17 to 18 nodes were left on the shoots. Shoot tipping resulted in production of lateral shoots.Laterals form sinks until veraison after which they act as source organs (Candolfi-Vasconcelosand Koblet, 1990). Therefore, in the shoot tipping study, the lateral shoots in shoot-tipped vinesmight have competed as alternate sinks with fruit clusters resulting in comparable levels of fruitset as the controls. A shoot tipping study on ‘Chardonnay’ vines caused a reduction in fruitsoluble solids in shoot-tipped vines (Wolf et al., 1986). According to Wolf et al. (1986) prolificlateral growth observed in the shoot-tipped vines created a competitive sink resulting in poorquality fruits. In the current shoot tipping study, higher BN at nodes 13-16 and nodes 17-20 wasalso observed in shoot-tipped vines compared to the control vines. The buds in the basal portionof the shoots were less necrotic possibly because the buds were able to accumulate sufficientamount of carbohydrates to counteract the effect of shoot tipping. The distal buds were unable tostore sufficient carbohydrates in time to withstand the production of competing sinks such as thelateral shoots produced after shoot tipping. The carbohydrates such as sucrose, glucose, fructose,and starch were much lower in the bud tissues of shoot-tipped vines than in controls (P<0.05).
73
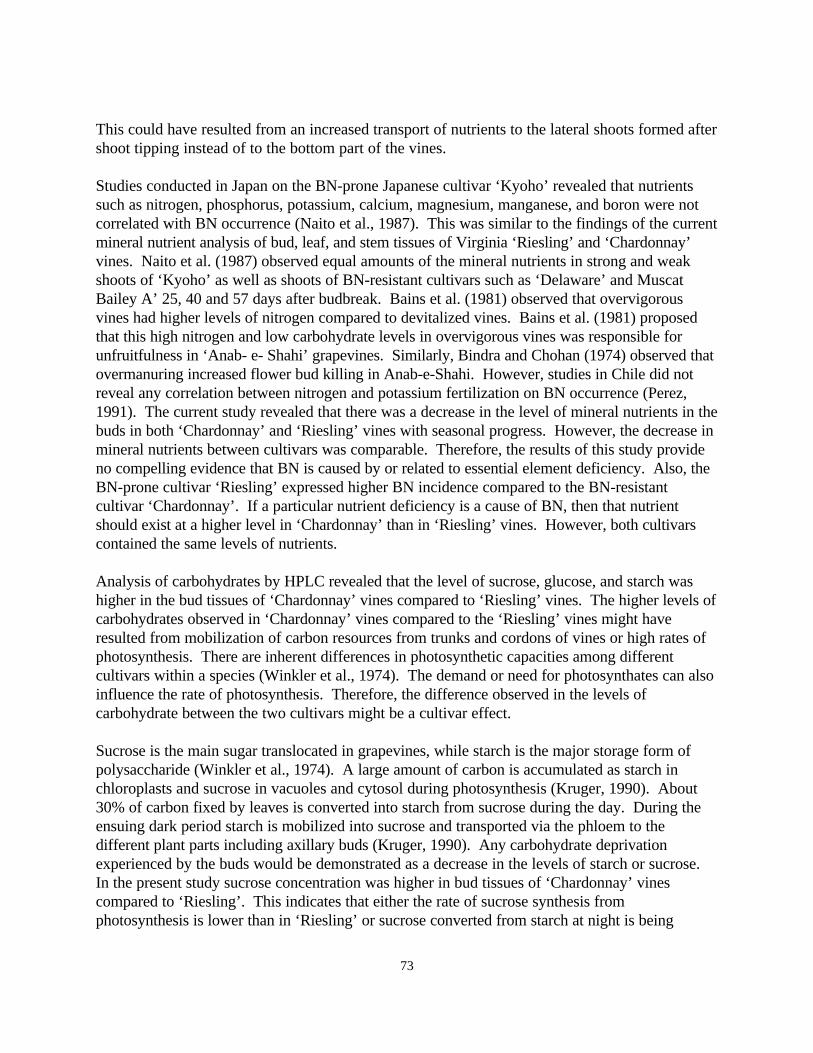
This could have resulted from an increased transport of nutrients to the lateral shoots formed aftershoot tipping instead of to the bottom part of the vines.
Studies conducted in Japan on the BN-prone Japanese cultivar ‘Kyoho’ revealed that nutrientssuch as nitrogen, phosphorus, potassium, calcium, magnesium, manganese, and boron were notcorrelated with BN occurrence (Naito et al., 1987). This was similar to the findings of the currentmineral nutrient analysis of bud, leaf, and stem tissues of Virginia ‘Riesling’ and ‘Chardonnay’vines. Naito et al. (1987) observed equal amounts of the mineral nutrients in strong and weakshoots of ‘Kyoho’ as well as shoots of BN-resistant cultivars such as ‘Delaware’ and MuscatBailey A’ 25, 40 and 57 days after budbreak. Bains et al. (1981) observed that overvigorousvines had higher levels of nitrogen compared to devitalized vines. Bains et al. (1981) proposedthat this high nitrogen and low carbohydrate levels in overvigorous vines was responsible forunfruitfulness in ‘Anab- e- Shahi’ grapevines. Similarly, Bindra and Chohan (1974) observed thatovermanuring increased flower bud killing in Anab-e-Shahi. However, studies in Chile did notreveal any correlation between nitrogen and potassium fertilization on BN occurrence (Perez,1991). The current study revealed that there was a decrease in the level of mineral nutrients in thebuds in both ‘Chardonnay’ and ‘Riesling’ vines with seasonal progress. However, the decrease inmineral nutrients between cultivars was comparable. Therefore, the results of this study provideno compelling evidence that BN is caused by or related to essential element deficiency. Also, theBN-prone cultivar ‘Riesling’ expressed higher BN incidence compared to the BN-resistantcultivar ‘Chardonnay’. If a particular nutrient deficiency is a cause of BN, then that nutrientshould exist at a higher level in ‘Chardonnay’ than in ‘Riesling’ vines. However, both cultivarscontained the same levels of nutrients.
Analysis of carbohydrates by HPLC revealed that the level of sucrose, glucose, and starch washigher in the bud tissues of ‘Chardonnay’ vines compared to ‘Riesling’ vines. The higher levels ofcarbohydrates observed in ‘Chardonnay’ vines compared to the ‘Riesling’ vines might haveresulted from mobilization of carbon resources from trunks and cordons of vines or high rates ofphotosynthesis. There are inherent differences in photosynthetic capacities among differentcultivars within a species (Winkler et al., 1974). The demand or need for photosynthates can alsoinfluence the rate of photosynthesis. Therefore, the difference observed in the levels ofcarbohydrate between the two cultivars might be a cultivar effect.
Sucrose is the main sugar translocated in grapevines, while starch is the major storage form ofpolysaccharide (Winkler et al., 1974). A large amount of carbon is accumulated as starch inchloroplasts and sucrose in vacuoles and cytosol during photosynthesis (Kruger, 1990). About30% of carbon fixed by leaves is converted into starch from sucrose during the day. During theensuing dark period starch is mobilized into sucrose and transported via the phloem to thedifferent plant parts including axillary buds (Kruger, 1990). Any carbohydrate deprivationexperienced by the buds would be demonstrated as a decrease in the levels of starch or sucrose.In the present study sucrose concentration was higher in bud tissues of ‘Chardonnay’ vinescompared to ‘Riesling’. This indicates that either the rate of sucrose synthesis fromphotosynthesis is lower than in ‘Riesling’ or sucrose converted from starch at night is being

74
translocated to alternate sinks such as the vigorously growing shoot tips. And as BN was muchlower in ‘Chardonnay’ vines compared to ‘Riesling’ vines, a negative relationship betweensucrose levels and BN is indicated.
Results of the visual starch rating study revealed a continuous increase in starch in buds as thesummer progressed with all cultivars except ‘Chardonnay’ in which no increase was observedfrom 70 to 80 days after budbreak, and ‘Syrah’ in which there was a small reduction in starchlevel from 70 days (3.5) to 80 days after budbreak (3.3). Starch level usually increases in grapeshoots from May to November (northern hemisphere) as sucrose decreases (Pickett and Cowart,1941; Chaumont et al., 1994). A major portion of sucrose synthesized during photosynthesis isused by the developing shoots for growth. The remaining part is converted into starch (Candolfi-Vasconcelos and Koblet, 1990; Koblet et al., 1993). But starch accumulation occurs when therate of photosynthesis exceeds the leaf’s capacity for sucrose export. Therefore, low levels ofstarch at the start of the season indicate that it is not being synthesized in sufficient amounts.Starch is the chief storage form of available carbohydrates (Winkler and Williams, 1945) and isfound in parts of the vine such as the trunk, arms, roots, and green tissues (Koblet et al., 1993).As shoot growth starts in spring, carbon sources are preferentially translocated to the growingshoot tip. As more leaves are produced, the basal leaves direct the assimilates into the trunk andother permanent structures of the vine. Inflorescences are very poor sinks but at fruit set andripening, fruit clusters become very strong sinks (Edson et al., 1995; Motomura, 1990). Understress situations, carbon is believed to be mobilized from the permanent parts of the vines into thedeveloping fruit clusters; and a compensation effect occurs with a change in partitioning in favorof developing fruit clusters at the expense of the vegetative parts (Koblet et al., 1993).
The intensity of starch staining was the highest for ‘Chardonnay’ followed by ‘Riesling’,‘Viognier’ and ‘Syrah’. Low levels of starch in these cultivars therefore, could be due topreferential partitioning of photosynthates into fruit clusters rather than to the axillary buds or dueto low rates of starch production. ‘Riesling’, ‘Viognier’ and ‘Chardonnay’ vines have higher BNin nodes 7-17 than in the basal 6 nodes. ‘Riesling’ and ‘Chardonnay’ vines had greater levels ofstarch deposits in the basal section (nodes 1-6) compared to the distal section. ‘Viognier’ hadgreater levels of starch deposits in the basal node section compared to the distal section at the firstsampling; and ‘Syrah’ had higher levels at the last two samplings. Correlatively, at least thesedata support the hypothesis that BN results from carbohydrate starvation. However, it cannot beruled out that the low starch levels in bud tissues is an effect of the senescence process caused byBN. Morrison and Iodi (1990) suggested that the observed lack of starch grains in necrotic‘Thompson Seedless’ buds could be caused by the senescence process that occurs during theinitial stages of BN, rather than the cause of necrosis. BN might cause a dysfunction in phloemtransport of sucrose causing a reduction in starch levels. This can be tested by radioactive 14CO2
leaf feeding and measuring radioactive sucrose levels in bud tissues; examination of sieve elementsof bud and adjoining nodal tissues for callose deposition using an electron microscope would alsohelp to determine if phloem dysfunction has occurred.

75
CONCLUSION
Shade studies indicated a three-week period of artificial shade applied either 20, 40, or 60 daysafter budbreak did not increase BN in ‘Riesling’, while a 40-day period applied 25 or 65 days afterbudbreak did increase BN in distal nodes (9-20). Lack of sunlight over long periods does appearto be involved in BN incidence. Shoot vigor, expressed as shoot diameter or average internodelength, was positively correlated with BN of ‘Riesling’. A lower incidence of BN was observed inthe basal nodes of shoots than in the more distal (5 - 16) nodes. Therefore, as suggested by Wolfand Warren (1995) management practices that regulate vigor as well as spur pruning arerecommended compensatory practices. In 1994, TNC levels were analyzed and no significantdifference was observed between shaded and non-shaded vines. Although shade did decreasesucrose, glucose, fructose and starch levels in bud, leaf, and stem tissues as determined at thepoint of shade removal, the carbohydrate concentrations in bud, leaf, and stem tissues of vinessoon increased to levels equal to those in controls. But as distal nodes exhibited necrosis whenshaded for a 40-day period, carbohydrate deprivation caused by shading does appear to beinvolved in BN occurrence.
Shoot tipping at ≈18 nodes increased BN at nodes distal to node 12 compared to control vineswhich were not shoot-tipped. Shoot-tipped vines had lower bud levels of sucrose, glucose,fructose, and starch than did the controls. Therefore, a negative relationship between sucrose,glucose, and starch and BN incidence is indicated.
Results of the mineral nutrient survey in 1995 suggested that BN is not caused by whole vine orlocalized bud deficiency of an essential element. The nutrients examined decreased in the budtissue as the summer progressed in both ‘Riesling’ and ‘Chardonnay’ vines. Carbohydrateanalyses indicated that sucrose levels might be related to BN incidence. However, there is notsufficient evidence to prove causality.
Starch increased in buds as the summer progressed. The BN-insensitive cultivar ‘Chardonnay’had significantly higher levels of starch compared to the BN-susceptible cultivars, ‘Riesling’,‘Viognier’, and ‘Syrah’. ‘Chardonnay’ had the lowest BN incidence followed by ‘Riesling’,‘Syrah’, and ‘Viognier’. There was a node position effect as well in ‘Chardonnay’ and ‘Riesling’cultivars in that the basal six nodes had a higher quantity of starch than nodes 7-13. BN washigher in the distal 7 to 13 nodes than in the basal six nodes for ‘Riesling’ and ‘Chardonnay’.However, no node position effect was observed in ‘Viognier’ or ‘Syrah’. Therefore, it can beconcluded that there is a negative correlation between BN susceptibility and level of starch in thebuds.
76
LITERATURE CITED
Bains, K. S., Bindra, A. S. and Bal, J. S. 1981. Seasonal changes in carbohydrate and mineralcomposition of vigorous and devitalized Anab-e-Shahi grapevines in relation to unfruitfulness.Vitis 20:311-319.
Bindra, A. S. and Chohan, J. S. 1975. Flower-bud killing in Anab-e-Shahi grapes. Indian J.Mycol. Plant Pathol. 5:63-68.
Byers, R. E., Carbaugh, D. H., Presley, C. N., and Wolf, T. K. 1991. The influence of low lighton apple fruit abscission. J. Hort. Sci. 66:7-17.
Candolfi-Vasconcelos, M. C., Candolfi, M. P. and Koblet, W. 1994. Retranslocation of carbonreserves from the woody storage tissues into the fruit as a response to defoliation stressduring the ripening period in Vitis vinifera L. Planta 192: 567-573.
Candolfi-Vasconcelos, M. C. and Koblet, W. 1990. Yield, fruit quality, bud fertility and starchreserves of the wood as a function of leaf removal in Vitis vinifera - evidence of compensationand stress recovering. Vitis 29: 199-221.
Cartechini, A. and Palliotti, A. 1995. Effect of shading on vine morphology and productivity andleaf gas exchange characteristics in grapevines in the field. Am J. Enol. Vitic. 46: 227-234.
Chaumont, M., Morot-Gaudry, J. and Foyer, C. H. 1994. Seasonal and diurnal changes inphotosynthesis and carbon partitioning in Vitis vinifera leaves in vines with and without fruit.J. Exp. Bot. 45: 1235-1243.
Cline, R. A. 1987. Calcium and magnesium effects on rachis necrosis of interspecific hybrids ofEuvitis grapes cv. Canada Muscat and cv. Himrod grapes. J. Plant Nutr. 10: 1897-1905.
Collier, G. F. and Tibbetts, T. W. 1983. Tipburn of lettuce. In: Janick J. (ed.) HorticulturalReviews. Westport, CT. The Saybrook Press Inc.
Davis, R. E. 1976. A combined automated procedure for the determination of reducing sugarsand nicotine alkaloids in tobacco products using a new reducing sugar method. Tobacco Sci.20: 139-144.
Dry, P. R. and Coombe, B. G. 1994. Primary bud-axis necrosis of grapevines. I. Natural incidenceand correlation with vigor. Vitis 33:225-230.
Edson, C. E., Howell, G. S. and Flore, J. A. 1995. Influence of crop load on photosynthesis anddry matter partitioning of Seyval grapevines. II. Seasonal changes in single leaf and whole vinephotosynthesis. Am. J. Enol. Vitic. 46: 469-485.
Epstein, E. 1972. Mineral Nutrition of Plants: Principles and Perspectives. New York: Academic.Ferraro, J. J., Caccavo, F. A. and Saifer, A. 1976. P-hydroxybenzoic acid hydrazide procedure for
serum glucose adapted to the Technicon SMA 12/60 and compared with other glucosemethods. Clin. Chem. 22: 263-266.
de la Guardia, M. D., Alcantara, E. and Fournier, J. M. 1990. Effect of 2,3,5-triiodobenzoic acidon calcium level in sunflower plants and incidence of bract necrosis. J. Plant Nutr. 13: 117-129.
Hesse, C. O. and Hitz, C. W. 1938. Maturity studies with Jonathan and Grimes Golden apples.Proc. Am. Soc. Hort. Sci. 36: 351-357.

77
Ho, L. C., Adams, P., Li, X. Z., Shen, H., Andrews, J., Xu, Z. H. 1995. Resposes of Ca-efficientand Ca-inefficient tomato cultivars to salinity in plant growth, calcium accumulation andblossom-end rot. J. Hort. Sci. 70: 909-918.
Hunter, J. J., and Visser, J. H. 1988. Distribution of 14C-photosynthate in the shoots of Vitisvinifera L. cv. Cabernet Sauvignon. I. The effect of leaf position and developmental stage ofthe vine. S. Afr. J. Enol. Vitic. 9: 3-9.
Jiang, H. and Egli, D. B. 1993. Shade induced changes in flower and pod number and flower andfruit abscission in soybean. Agron. J. 85:221-225.
Keller, M. and Koblet, W. 1994. Is carbon starvation rather than excessive nitrogen supply thecause of inflorescence necrosis in Vitis vinifera L.? Vitis 33: 81-86.
Keller, M. and Koblet, W. 1995. Stress-induced development of inflorescence necrosis and bunch-stem necrosis in Vitis vinifera L. in response to environmental and nutritional effects. Vitis 34:145-150.
Koblet, W., Candolfi-Vasconcelos, M. C., Aeschimann, E. and Howell, G. S. 1993. Influence ofdefoliation, rootstock, and training system on Pinot noir grapevines. I. Mobilization andreaccumulation of assimilates in woody tissue. Vitic. Enol. Sci. 48: 104-108.
Kruger, N. J. 1990. Carbohydrate synthesis and degradation. In Dennis, D.T. and Turpin, D.H.(ed.) Plant Physiology, Biochemistry, and Molecular Biology. Longman Scientific &Technical, UK.
Lavee, S. 1987. Necrosis in grapevine buds (Vitis vinifera cv. Queen of Vineyard). III.endogenous gibberellin levels in leaves and buds. Vitis 26:225-230.
Lavee, S., M. Ziv, M. and Bernstein, Z. 1981. Necrosis in grapevine buds (Vitis vinifera cv.Queen of Vineyard). I. Relation to vegetative vigor. Vitis 20:8-14.
Marini, R. P., Byers, R. E., Sowers, D. L. and Young, R. W. 1990. Fruit abscission and fruitquality of apples following use of dicamba to control preharvest drop. J. Amer. Soc. Hort.Sci. 115: 390-394.
Matthews, M.A. and Anderson, M.M. 1989. Reproductive development in grape (Vitis viniferaL.): responses to seasonal water deficits. Am. J. Enol. Vitic. 40: 52-60.
Morrison, J. C. and Iodi, M. 1990. The development of primary bud necrosis in ThompsonSeedless and Flame Seedless grapevines. Vitis 29:133-144.
Motomura, Y. 1990. Distribution of 14C-assimilates from individual leaves on clusters in grapeshoots. Am. J. Enol. Vitic. 41: 06-312.
Mullen, J. A. and Koller, H. R. 1988. Trends in carbohydrate depletion, respiratory carbon loss,and assimilate export from soybean leaves at night. Plant Physiol. 86: 517-521.
Naito, R., Ueda, H. and Munesue, S. 1989. Studies on the necrosis in grapevine buds IV.relationship between the occurrence of bud necrosis and the shoot emerging from lateral budson fruiting canes in 9 Japanese leading cultivars. Bull. Fac. Agricult. Shimane Univ. 23:1-6.
Naito, R., Yamamura, H. and Munesue, S. 1987. Studies on the necrosis in grapevine buds (III)the time of the occurrence of bud necrosis in ‘Kyoho’ and the relation between its occurrenceand the amounts of nutritional elements in buds. Bull. Fac. Agricult. Shimane Univ. 21:10-17.
Naito, R., Yamamura, H. and Yoshino, K. 1986. Effects of shoot vigor and foliar application ofGA and SADH on the occurrence of bud necrosis in ‘Kyoho’ grape. J. Japan. Soc. Hort. Sci.55:130-137.

78
Perez, J. 1991. The influence of nitrogen fertilization on bud necrosis and bud fruitfulness ofgrapevines. Proc. Intl. Symp. on Nitrogen in Grapes and Wine, Seattle, Washington, USA,18-19 June 1991. p 110-115.
Perez, J. and Kliewer, W. M. 1990. Effect of shading on bud necrosis and bud fruitfulness of‘Thompson Seedless’ grapevines. Amer. J. Enol. Vitic. 41:168-175.
Pickett, T. A. and Cowart, F. F. 1941. Carbohydrate changes in Muscadine grape shoots duringthe growing season. Proc. Am. Soc. Hort. Sci. 38: 393-394.
Poapst, P. A., Ward, G. M. and Phillips, W. R. 1959. Maturation of McIntosh apples in relationto starch loss and abscission. Can. J. Plant Sci. 39: 257-263.
SAS Institute. 1990. SAS/STAT user’s guide, version 6, 4th ed. SAS Inst., Cary, N. C.Smart, R. E., Dick, J. K., Gravett, I. M. and Fisher, B. M. 1990. Canopy management to improve
grape yield and wine quality - principles and practices. S. Afr. J. Enol. Vitic., 11:3-17.Smith, D. 1981. Removing and analyzing total nonstructural carbohydrates from plant tissue.
Research Report 41. The Research Division of the College of Agricultural and Life Sciences,University of Wisconsin, Madison, WI.
Somda, Z. C., Mahomed, M. T. M. and Kays, S. J. 1991. Analysis of leaf shedding and dry matterrecycling in sweet potato. J. Plant Nutr. 14:1201-1212.
Wellso, S. G., Hoxie, R. P. and Olien, C. R. 1989. Effects of hessian fly (Diptera: Cecidomyiidae)larvae and plant age on growth and soluble carbohydrates of Winoka winter wheat. Environ.Entomol. 18: 1095-1100.
Wien, H. C., Turner, A. D. and Yang, S. F. 1989. Hormonal basis for low light intensity-inducedbud abscission of pepper. J. Amer. Soc. Hort. Sci. 114:981-985.
Winkler, A. J. and Williams, W. O. 1945. Starch and sugars of Vitis vinifera. Plant Physiol. 20:421-432.
Winkler, A. J., Cook, J. A., Kliewer, W. M. and Lider, L. A. 1974. General Viticulture,University of California Press, Berkeley.
Wolf, T. K., Pool, R. M. and Mattick, L. R. 1986. Responses of young Chardonnay grapevines toshoot tipping, ethephon, and basal leaf removal. Am. J. Enol. Vitic. 37: 263-268.
Wolf, T. K. and Warren, M. K. 1995. Shoot growth rate and shoot density affect bud necrosis of‘Riesling’ grapevines. J. Amer. Soc. Hort. Sci. 120:989-996.
Woltz, S. S. and Harbaugh, B. K. 1986. Calcium deficiency as the basic cause of marginal bractnecrosis of ‘Gutbier V-14 Glory’ poinsettia. HortScience 21: 1403-1404.
Ziv, M. M., Bernstein, Z. and Lavee, S. 1981. Necrosis in grapevine buds (Vitis vinifera cv.Queen of Vineyard). II. Effect of gibberellic acid (GA3) application. Vitis 20:105-114.