chapter 4. how to build agent-based models. field service
TRANSCRIPT

How to build agent-based models. Field service example 1
Chapter 4. How to build agent-based models. Field service example
Agent-based modeling is the easiest modeling method. You identify which objects in
the real system are important for solving the problem and create those same objects
in the model. You think of the behavior of those objects relevant to the problem, and
program that same behavior in the model. You do not have to exercise your
abstraction skills as much as in system dynamics or force yourself to "always think
in terms of a process," as in discrete event modeling.
Described in one page, the process of building an agent-based model includes
answering the following questions:
1. Which objects in the real system are important? These will be the agents.
2. Are there any persistent (or partially persistent) relationships between the
real objects? Establish the corresponding links between the agents.
3. Is space important? If yes, choose the space model (GIS, continuous,
discrete) and place the agents in the space. If the agents are mobile, set
speeds, paths, etc.
4. Identify the important events in the agents’ life. These events may be
triggered from outside, or they may be internal events caused by the
agent's own dynamics.
5. Define the agents' behavior:
5.1. Does the agent just react to the external events? Use message handling
and function calls.
5.2. Does the agent have a notion of state? Use a statechart.
5.3. Does the agent have internal timing? Use events or timeout
transitions.
5.4. Is there any process inside the agent? Draw a process flowchart.
5.5. Are there any continuous-time dynamics? Create a stock and flow
diagram inside the agent.
6. Do agents communicate? Use message sequence diagrams (see Section 4.2)
to design communication/timing patterns.
7. What information does the agent keep? This will be the memory, or state
information, of the agent. Use variables and statechart states.
8. Is there any information, and/or dynamics, external to all agents and
shared by all agents? If yes, there will be a global part of the model (the
term "environment" is sometimes used instead).
9. What output are you looking for? Define the statistics collection at both the
individual and aggregate levels.

2 The Big Book of Simulation Modeling · Multimethod Modeling with AnyLogic 8
In this chapter, we give a very detailed description of a model design process, from
the very beginning to the optimization results and assumptions discussion.
4.1. The problem statement
A fleet of equipment units (for example, wind turbines or vending machines) are
distributed geographically within a certain area. Each equipment unit generates
revenue while it is working. However, it sometimes breaks down and needs to be
repaired or replaced. Maintenance is due every maintenance period. Late
maintenance, as well as advanced age, increase the probability of failure.
Figure 4.1 Wind turbines
The service system consists of several service crews that are based in a single
central, or "home," location. When a service or maintenance request is received by
the service system, one of the crews takes it, drives to the equipment in question,
and performs the required work. During the failure examination, it may turn out
that the equipment cannot be repaired, in which case it is replaced. If already due,
any currently scheduled maintenance is done after the repair, within the same visit.
(The service crew can also replace aged equipment even if it is still working, subject
to the replacement policy.) Having finished the work, the service crew may take
another request and drive to the next unit location, or, if there are no requests,
return home.

How to build agent-based models. Field service example 3
A service crew has constant daily costs associated with it. Each operation
(maintenance, repair, or replacement) has an additional one-time cost. All
parameters of the system are listed in the Table.
Parameter Value
Daily revenue per working equipment unit $400
Daily cost of a service crew, including driving costs $1,500
Average repair cost $1,000
Maintenance cost $600
Replacement cost $10,000
Typical repair time 5 hours
Typical maintenance time 3 hours
Typical replacement time 12 hours
Probability replacement needed after failure 10%
Maintenance period 90 days
Base failure rate (maintenance done, equipment not aged) 3 / 100 days
Service crew speed 70 kph
Equipment units in the fleet 50
The goal of this model is to find the number of service crews, and the replacement
policy, that result in maximum profit for the equipment fleet.
4.2. Phase 1. Can be done on paper
Who are the agents?
As we said earlier, mapping the problem to the modeling language is easy in the
agent-based modeling paradigm. What objects in the real system do we observe and
are interested in? Equipment and service crews. So, these will be the agents in our
model. Do we need a central service dispatcher of any kind, or any environment
objects? We will find out later during the model building process.

4 The Big Book of Simulation Modeling · Multimethod Modeling with AnyLogic 8
Figure 4.2 Agents in the field service model
Equipment unit agent
We definitely do want to know if the equipment is working or not. So, we will
distinguish between at least two states of the equipment unit – Working and Not
working, – and will try to use the state transition diagram to model the equipment
behavior, see Figure 4.3 version 1.
Figure 4.3 State transition model of the equipment unit, versions 1, 2, and 3
While the equipment is not working, it can be in failure (and be waiting for the
service crew to arrive and fix it), be repaired or replaced, or be on scheduled
maintenance, Figure 4.3 version 2. Are these separate states or one state? Making
these states separate makes sense if:
• The behavior of the equipment unit is essentially different in different states
– say, different time spent in the state, different reactions to the external
events, or different actions taken upon exiting the state; or
• We want to have separate statistics for the states.
Working
Not working
Working
Not working
Failed, waiting for
service crew Being repaired
Being replaced
On scheduled maintenance
1 2
Working 3
Failed, waiting for
service crew
Being repaired
Being replaced
On scheduled maintenance
Equipment unit agent Service crew agent
How to build agent-based models. Field service example 5
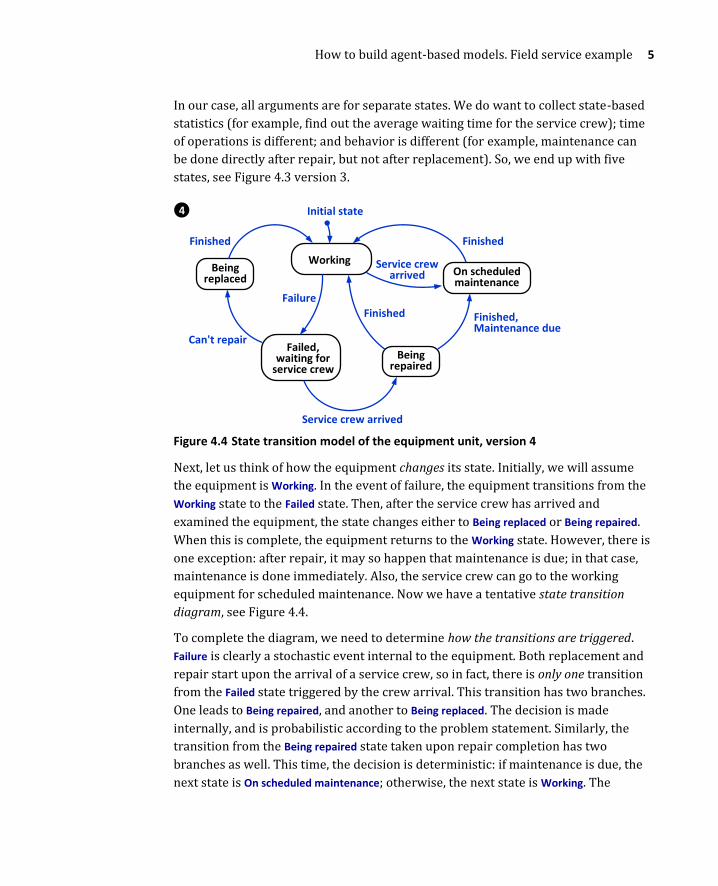
In our case, all arguments are for separate states. We do want to collect state-based
statistics (for example, find out the average waiting time for the service crew); time
of operations is different; and behavior is different (for example, maintenance can
be done directly after repair, but not after replacement). So, we end up with five
states, see Figure 4.3 version 3.
Figure 4.4 State transition model of the equipment unit, version 4
Next, let us think of how the equipment changes its state. Initially, we will assume
the equipment is Working. In the event of failure, the equipment transitions from the
Working state to the Failed state. Then, after the service crew has arrived and
examined the equipment, the state changes either to Being replaced or Being repaired.
When this is complete, the equipment returns to the Working state. However, there is
one exception: after repair, it may so happen that maintenance is due; in that case,
maintenance is done immediately. Also, the service crew can go to the working
equipment for scheduled maintenance. Now we have a tentative state transition
diagram, see Figure 4.4.
To complete the diagram, we need to determine how the transitions are triggered.
Failure is clearly a stochastic event internal to the equipment. Both replacement and
repair start upon the arrival of a service crew, so in fact, there is only one transition
from the Failed state triggered by the crew arrival. This transition has two branches.
One leads to Being repaired, and another to Being replaced. The decision is made
internally, and is probabilistic according to the problem statement. Similarly, the
transition from the Being repaired state taken upon repair completion has two
branches as well. This time, the decision is deterministic: if maintenance is due, the
next state is On scheduled maintenance; otherwise, the next state is Working. The
Working
Failed, waiting for
service crew Being
repaired
Being replaced
On scheduled maintenance
Finished
Failure
Finished Finished
Finished, Maintenance due
Can't repair
Service crew arrived
4
Service crew arrived
Initial state

6 The Big Book of Simulation Modeling · Multimethod Modeling with AnyLogic 8
transitions labeled Finished are all time-driven, the time spent in a state
corresponding to work being done can be obtained from the input data.
Notice that, depending on the state, the equipment unit reacts differently to the
arrival of the service crew. If the crew comes to the working equipment, it can only
mean it will do the scheduled maintenance, whereas, in the Failed state, it will
examine the situation and repair or replace the equipment. It is also worth
mentioning that, according to the semantics of statecharts, the transitions are
instantaneous (take zero time), so in our statechart we assume the examination of
failure takes zero time. This is a fair assumption: if we want, we can simply add this
time to the duration of both replacement and repair.
Figure 4.5 State transition model of the equipment unit, version 5
That’s it for the equipment unit so far. We will add more details after we make some
progress with the other parts of the model’s design.
Service crew agent
The service crew behavior is simple: it takes a request, drives to the equipment unit,
does the work, and either continues with the next request or returns to its home
location. Unlike the equipment unit, the service crew is a mobile agent, so moving in
space will be the essential part of its behavior. The notion of state, however, (Idle,
Driving, Working) seems to be present here as well, so we will follow the same design
pattern we used for the equipment unit, see Figure 4.6 version 1.
If we draw all possible states transitions, we will get what is shown in Figure 4.6
version 2. There are two transitions from the Driving state, both triggered by Arrival.
5
Working
Failed, waiting for
service crew
Being repaired
Being replaced
On scheduled maintenance
Failure [internal
stochastic event]
Finished [time-driven]
Maintenance due
Can't repair
Service crew arrival [a signal from another agent]
Can repair
Finished [time-driven]
Maintenance not due
Finished [time-driven]
Service crew arrival [a signal from another agent]
[internal probabilistic decision]
[internal decision]

How to build agent-based models. Field service example 7
One leads to Idle, and the other to Working. The destination state depends on where
the crew was driving. How do we capture this in the statechart? One way is to check
the location upon arrival. Another, more elegant method is to have two different
states for driving: Driving to work and Driving home. The decision of where to drive is
made when the current task is completed (transition Finished triggered by the
equipment's timing) and depends on whether there are more requests waiting to be
serviced. This can be modeled by a construct we are already familiar with: a
transition with two branches, see Figure 4.6 version 3.
Figure 4.6 State transition model of the service crew, versions 1, 2, and 3
In the resulting statechart there are two arcs labeled There are requests: one is from
Idle state, and the other is a branch of the Finished transition. While in the latter case
the condition is tested once upon completion of the current work assignment, in the
former case the condition should be constantly monitored while the service crew is
idle. We will combine them into one: in Idle the service crew will be explicitly told to
check if there are requests, see Figure 4.7 version 4. The reason for making this
change in this case technical, based on the knowledge of agent-based modeling.
Idle
Driving
1
Working
Idle
Driving
Working
Initial state
Arrival
Arrival
Finished
2
Driving to work
Driving home
Idle
No more requests There are requests
Arrival
Arrival
There are requests
There are requests
3
Working
Finished

8 The Big Book of Simulation Modeling · Multimethod Modeling with AnyLogic 8
Multiple service crew agents may check the request queue at the same time, but
there may be fewer requests than agents, so some will return to the Idle state (in our
statechart: through the Driving home state, which will be passed through immediately
in case the agent is already home).
Figure 4.7 State transition model of the service crew, versions 4 and 5
However, it may so happen that the notification about new requests comes while
the service crew is driving home. In that case the crew will ignore it and having
arrived at the home location, will stay there, idle (until, most likely, another piece of
equipment breaks down). This is no good. We can assume the service crew is
equipped with a radio and can take requests while driving. So, if the "check request"
signal comes in the Driving home state, the crew will accept it, change the route, and
drive to the equipment unit. In the statechart we could draw another transition
Driving to work
Driving home
Idle
No more requests There are requests
Arrival [end of movement]
Arrival [end of movement]
Check if there are requests
4
Working
Finished [a signal from another agent]
[Global signal]
[Test of a global condition]
Driving to work
Driving home Idle
No more requests There are requests
Arrival [end of movement]
Check if there are requests
5
Working
Finished [a signal from another agent]
[Global signal]
[Test of a global condition]
Arrival [end of
movement]
A composite state

How to build agent-based models. Field service example 9
triggered by the signal from the Driving home state to the decision diamond, but we
will use a great statechart feature – a composite state.
A composite state is a group of states that have some common behavior – for
example, the same reactions to events, or common timeouts.
The updated statechart of the service crew agent is shown in Figure 4.7 version 5.
The transition Check if there are requests exits the composite state, and therefore
applies both to the Idle and Driving home states. Note that transitions may freely cross
the composite state borders; for example, the branch No more requests directly
enters the Driving home state, and the initial state pointer points to the Idle state.
While designing the service crew behavior, we were constantly referencing the
"request queue" and assuming somebody can "tell all agents" to check it out. The
request queue is clearly global for all agents, as well as the central "dispatcher" that
takes care of it. We will return to those items later.
Agent communication. Message sequence diagrams
During the design of the service crew behavior, we used reasoning that goes like,
"What will happen if a notification about the new requests comes while the service
crew is driving home?" We have already started thinking about the agent
communication and event ordering. In this section, we will introduce a graphical
notation that greatly helps in communication design. This notation comes from the
computer science world; namely, from the distributed systems area.
A good agent-based modeler should know a little bit about the design of distributed
and parallel systems. An agent-based model is, in fact, a pseudo-distributed system:
it is a collection of objects that are concurrently active and communicate with each
other (despite the concurrency is simulated by the engine). Deadlocks, livelocks,
unexpected simultaneous event ordering, and other problems specific to distributed
systems are possible in agent-based models.
Let’s list all communication instances that we have used in our models of the
equipment units and the service crews. They are:
• Service crew arrival: a message from a service crew to an equipment unit.
• Finished: a message from an equipment unit to the service crew.
• Check if there are requests: a message from a "central dispatcher" to all service
crews.
The best design notation for communication in concurrent systems is a message
sequence diagram. In such a diagram, each object is represented by a vertical line,
and messages (signals, function calls) from one object to another as horizontal

10 The Big Book of Simulation Modeling · Multimethod Modeling with AnyLogic 8
arrows. Time flows downward. Time can be both physical (continuous) and logical
(representing just event ordering with possibly zero intervals between events).
Individual events local to an object can also be placed on a message sequence
diagram.
Figure 4.8 Message sequence diagram of the field service model, version 1
The first version of a message sequence diagram for our model is shown in Figure
4.8. There is just one equipment unit and one service crew. The shaded bars
represent processes that take place inside the agents, and may end up with a
message sent to another agent. Of course, both the service crew and the equipment
unit are involved in the repair process; however, according to our model, it is the
equipment unit that defines the duration or repair, and then notifies the service
crew of completion.
However, in Figure 4.8 it is not clear who initiates the whole thing. We will now
extend the diagram to include the equipment failure event. We will also add another
equipment unit.
1 Service
crew Equipment
unit Central
dispatcher
Check if there are requests
Service crew arrival
Repair, replacement, or maintenance
Finished
Driving
Idle
Take 0 time

How to build agent-based models. Field service example 11
Figure 4.9 Message sequence diagram of the field service model, version 2
In version 2 of the message sequence diagram, we see the initial states of the
agents: both equipment units are working, and the service crew is idle. Then,
equipment 1 fails and posts a request to the "dispatcher.” The "dispatcher" notifies
the service crew, which immediately takes the assignment and starts driving to the
failed equipment unit. While the first equipment unit is being repaired, failure
occurs at the second unit. The request is posted, and the "dispatcher" notifies the
service crew, but this notification is ignored; the service crew is in the Working
state and will not react to Check request queue messages, see Figure 4.9. The service
crew will not test the request queue and take another assignment until the first
repair is completed.
Message sequence diagrams, in our case, are an auxiliary design document intended
to help the modeler with understanding agent communication. They are not formal
or executable, and they are not a part of the AnyLogic modeling language.
The last communication scenario we will draw is one with one service request and
two crews, see Figure 4.10. The "dispatcher" broadcasts the notification to all
service crews. Both are idle, so both will check the queue. The events of checking
2 Service
crew Equipment
unit 1 "Central
dispatcher"
Check
Arrival
Repair
Finished
Driving
Driving
Failure Request for service
Equipment unit 2
Failure Request for service
Check - ignored
Check and take
Arrival
Repair
0 time
Failed and waiting
Failed and waiting
Idle Working Working
Take

12 The Big Book of Simulation Modeling · Multimethod Modeling with AnyLogic 8
the request queue by the two agents are simultaneous, but ordered. Only one will
take the assignment and start driving, while another will return to the Idle state.
Figure 4.10 Message sequence diagram of the field service model. Two service crews
Space and other things shared by all agents
Among the things shared by all agents is the space where equipment is located and
service crews drive. In the Main agent, we will add a GIS map to define the field
service area. We will place the equipment units inside the area and place the service
crews initially in a home location. The service crew agents will take the shortest
routes along the existing roads. Where the roads are absent, the crews will drive
along straight lines directly.
Apart from space at the global level, there are:
• The queue of service requests
• The "dispatcher" that manages the queue
How do we model this? Is the dispatcher active or passive? Does it have state or
timing? The quick analysis of all we have said about it shows that the dispatcher
does just one thing: it inserts a message in the queue and immediately broadcasts
the notification to all service crews. No state or timing. Just stimulus and immediate
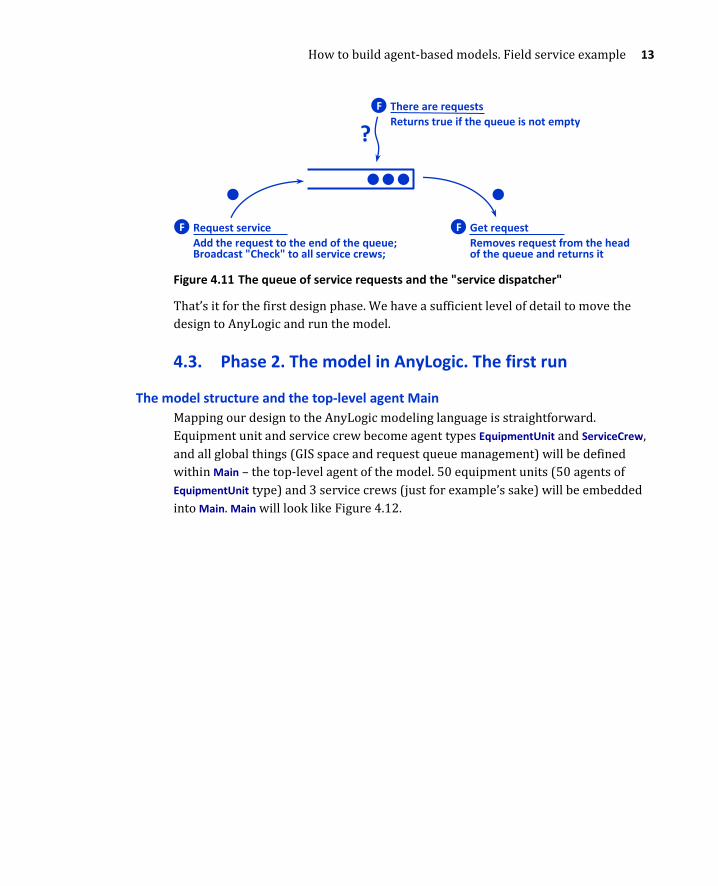
response. This is best modeled as a function call. In addition, we can write functions
that check the queue and remove the first request in the queue. See Figure 4.11 for
this part of the model.
Service crew 1
"Central dispatcher"
Check
Driving Idle
Service crew 2
Idle
Check
Take Nothing to take
0 time
Idle
How to build agent-based models. Field service example 13
Figure 4.11 The queue of service requests and the "service dispatcher"
That’s it for the first design phase. We have a sufficient level of detail to move the
design to AnyLogic and run the model.
4.3. Phase 2. The model in AnyLogic. The first run
The model structure and the top-level agent Main
Mapping our design to the AnyLogic modeling language is straightforward.
Equipment unit and service crew become agent types EquipmentUnit and ServiceCrew,
and all global things (GIS space and request queue management) will be defined
within Main – the top-level agent of the model. 50 equipment units (50 agents of
EquipmentUnit type) and 3 service crews (just for example’s sake) will be embedded
into Main. Main will look like Figure 4.12.
F Request service
Add the request to the end of the queue; Broadcast "Check" to all service crews;
F There are requests
Returns true if the queue is not empty
F Get request
Removes request from the head of the queue and returns it
?

14 The Big Book of Simulation Modeling · Multimethod Modeling with AnyLogic 8
Figure 4.12 The structure and the top level of AnyLogic Field service model
We have selected the windy North East France and Belgium and placed wind
turbines in the 200 kilometers long area near Boulogne-sur-Mer, Dunkerque and
Brugge.
To place agents on a GIS map, you would typically use a database containing the
equipment location data. We have simply added 50 GIS points to the map to act as
wind turbine locations. One more GIS point (named home) defines the crew home
location.
To place service crew agents at the home location, we set home as the initial location
for the service population.
To provide multiple equipment locations to the equipment population, we create the
collection equipmentLocation containing our 50 GIS points. The easiest way to do this
Agent types
The Main agent
Collection of equipment locations
home
GIS map
50 GIS points
3 ServiceCrew agents Dimensions and movement Initial speed: 70 km per hour Initial location Place agent(s): in the node Node: home
50 EquipmentUnit agents Initial location Place agent(s): in the node Node: equipmentLocations.get(index)

How to build agent-based models. Field service example 15
is selecting all GIS points (except for home) in the projects tree and using the Create
collection command of the context menu. Each agent in a population has an index, so
do elements of a collection. We iterate through the population and place the agents
at the GIS points with matching indexes by the expression
equipmentLocations.get(index).
The queue of requests is modeled by AnyLogic collection of type linked list with
elements of class EquipmentUnit.
Notice that we do not use a special data type for a service request – we just use the
reference to the equipment unit that originates the request. This is good (because
we follow the principle of minimalism), but it is only possible until we need to add
more attributes to the request, such as timestamp, priority, or severity of problem.
Figure 4.13 Elements related to the queue of requests
The function requestService( EquipmentUnit unit ) adds the equipment unit provided as
the argument to the end of the queue and iterates through all the agents in the
service to send them the message "CHECK REQUEST QUEUE". The boolean function
thereAreRequests() calls the collection's method isEmpty() and returns its negation. The
function getRequest() removes the last element of the queue and returns it.
The EquipmentUnit agent
The AnyLogic statechart of the equipment unit agent is shown in Figure 4.14.
The queue of requests. Collection class: Linked list Elements class: EquipmentUnit
serviceRequests.addLast( unit ); for( ServiceCrew sc : service ) send( "CHECK REQUEST QUEUE", sc );
return ! serviceRequests.isEmpty();
return serviceRequests.removeFirst();

16 The Big Book of Simulation Modeling · Multimethod Modeling with AnyLogic 8
We encourage modelers to use colors to visually emphasize the meaning of states;
for example, red for failure, green for up and running, etc. The same color scheme
can then be used for statistics visualization.
Having drawn the statechart, we can specify the transition triggers. We have four
transitions in this statechart that are time-driven (taken after the equipment unit
has spent a certain time in a state):
• Failure – time to failure depends, according to our problem definition, on
many factors. For now, we will just set the trigger type to Rate, and rate to the
BaseFailureRate, which we will make a parameter. The transition of rate type
works in the same way as the transition with exponentially distributed
timeout.
• FinishRepair – we know the typical repair time and will assume a triangular
distribution. The timeout for this transition will be
triangular( RepairTime * 0.5, RepairTime, RepairTime * 2.5 ) hours
• FinishReplacement – similarly, stochastic timeout:
triangular( ReplacementTime * 0.5, ReplacementTime, ReplacementTime * 1.5 ) hours
• FinishMaintenance – same as above:
triangular( MaintenanceTime * 0.5, MaintenanceTime, MaintenanceTime * 1.5 ) hours
There are two remaining transitions that are triggered by a message received by the
agent from another agent: SCArrivedForRepair and SCArrivedForMtce. We could use a
text message like "SERVICE CREW ARRIVED”, but we need to remember the service
crew in the equipment unit because, at the end of work, it will be the equipment unit
who notifies the service crew that it can leave. Therefore, we will use the reference
to the service crew as the message type and save it in a local variable serviceCrew.
To establish a temporary link between agents, you can either call the agent's
function connectTo() or simply remember a reference to another agent in a variable.
The advantage of a variable is that we can explicitly specify the type of another
agent and can identify the kind of relation in case there are many (like best friend,
parent, colleagues). Don’t forget to delete the reference (set the variable to null)
when the relationship ceases to exist.

How to build agent-based models. Field service example 17
Figure 4.14 AnyLogic statechart of the EquipmentUnit agent
Two transitions in our model have branches; namely, SCArrivedForRepair and
FinishRepair. Branch can be considered as an "if" statement executed when the
transition is taken. The condition of the branch StartReplacement is probabilistic: we
know that, with a certain probability, the failed equipment cannot be repaired and
needs to be replaced. In the AnyLogic language, this can be written as randomTrue(
ProbabilityReplacementNeeded ). The alternative branch StartRepair will be set as the
default and will be taken if the condition of StartReplacement evaluates to false. At the
moment, we cannot write the condition for the MaintenanceDue branch because we
do not know the date of the last maintenance; moreover, we have not yet modeled
the maintenance scheduling at all. We will write false on that branch, and in the first
version of our model it will never be taken.
We will now consider the actions associated with transitions. They are:
• Failure – here we need to place a service request. This is done through the
Main agent by calling its function requestService(). The Main agent is the direct
container of the EquipmentUnit agent (see Figure 4.12). If you pan the
EquipmentUnit diagram down, you will find the main element. It is a Link to
upper level agent, which enables accessing the Main agent from the embedded
equipment unit agent by this element name, main (remember that AnyLogic is
case sensitive). The action of the Failure transition, therefore, is
main.requestService( this );. "this" is a reference to "self": the equipment unit
provides it as an argument in the function call to identify who requests the
service. That reference will then be placed in the request queue in Main.
Reference to the service crew that is currently with the equipment; null at other times
Parameters

18 The Big Book of Simulation Modeling · Multimethod Modeling with AnyLogic 8
• SCArrivedForRepair and SCArrivedForMtce – we need to remember the service
crew in a local variable, so the action is serviceCrew = msg;. Here, msg is the
message that triggered the transition.
• FinishReplacement, FinishMaintenance, and MaintenanceNotDue – all these
transitions should release the service crew, so they have identical actions:
send( "FINISHED", serviceCrew );
serviceCrew = null;
If you are observant, you may have noticed that these three transitions are the only
transitions entering the Working state. So, each time the equipment enters the
Working state, the same action gets executed. It is tempting to write the code
releasing the service crew just once in the entry action of the Working state instead of
writing it three times. However, the entry action will also be executed upon the
statechart initialization when there is no service crew to release. Of course, you can
test if serviceCrew is not null, etc., but to keep the design clean we will leave the code
in the transitions; who knows what other transitions we may add to the statechart
later that are not necessarily associated with the service crew release.
The last thing we would like to discuss before we switch to the ServiceCrew agent is
the parameters. The six parameters we created are defined in the editor of the
EquipmentUnit agent; therefore, each equipment unit will have its own copy of
RepairTime, BaseFailureRate, etc. Do we really need that? According to our problem
statement, we don't: the parameters are global and apply to all equipment units.
Unless we want to have different values in different units, having a copy in each unit
is redundant and consumes memory (not an issue in this model, however). We
could define the parameters in Main, but then the access to them from EquipmentUnit
would look a bit complex: main.RepairTime. For simpler code writing, we will leave
the parameters where they are.

How to build agent-based models. Field service example 19
The ServiceCrew agent
Figure 4.15 AnyLogic statechart of the ServiceCrew agent
The AnyLogic statechart of the service crew is shown in Figure 4.15. The transition
triggers and actions are the following:
• CheckRequestQueue – triggered by the message "CHECK REQUEST QUEUE" sent by
the function requestService of Main.
• RequestsWaiting – a branch ("ending" of the two transitions) taken if the
condition main.thereAreRequests() is true. Action of this branch is
equipmentUnit = main.getRequest();
moveTo( equipmentUnit );
Similarly to the EquipmentUnit agent type, the service crew temporarily
remembers the equipment unit being serviced in the variable equipmentUnit.
moveTo() is the built-in function of the agent that starts a movement to a given
agent (equipmentUnit).
• NoRequests – the default branch that is taken if the request queue is empty.
The action of that branch starts the agent movement to its home location:
moveTo( main.home );
According to the statechart topology, this branch may follow both the
transition Finished and the transition CheckRequestQueue (in the latter case, the
service crew is already at home and will not move). It makes the statechart
simpler.
• Arrived – triggered by the agent’s arrival. The action is:
send( this, equipmentUnit );
send() is the function of the agent that sends a message to another agent. The
message is this – a reference to service crew itself.
• ArrivedHome – triggered by the agent arrival; no action.
Reference to the equipment unit whose request is being handled by the crew; null at other times

20 The Big Book of Simulation Modeling · Multimethod Modeling with AnyLogic 8
• Finished – triggered by the message "FINISHED" set by the equipment unit, the
action code erases the reference to the equipment: equipmentUnit = null;.
Animation
We will draw some schematic animation for equipment and service crew (see
Figure 4.16) so we see them on the GIS map in Main. The animation of an agent
should be drawn in the agent editor at the coordinate origin so that later on, in the
global picture, it appears exactly where the agent is located.
If the animation of the agent was drawn after this agent was embedded into a
container agent, it will not appear on the container agent diagram until you click the
Show presentation button in the Advanced section of the embedded agent properties.
Figure 4.16 Animations of the agents at 300% zoom
Instead of drawing animation for the crew home location, we will change the fill
color of the home GIS point (which can be accessed from the projects tree).
The first run
Now we can run the model. The top-level animation of the model is displayed in the
Main agent – the first thing you see after you click the Run control in the model
window. You can see how the service crews drive from one equipment unit to
another – click the serviceRequests queue and inspect its contents.
Equipment unit Service crew

How to build agent-based models. Field service example 21
Figure 4.17 The first run of the model. Top-level animation and internal view of agents
The great advantage of the object-centric agent-based modeling approach is that we
can look inside any agent and see what it is doing, what is its state, variable values,
connections, etc, see Figure 4.17. The Select agent to dive in control in the developer
panel can take you to any agent in the model at any depth of the hierarchy.
Discussion and next steps
The main goal of the first runs of the model is to test it. The animation we created
may not be needed by the end client, but it greatly helps to verify if the model is
working as planned. All main parts of the model are in place now; however, the
model at this stage is not yet able to answer our questions. Why not?
The model navigation control
The top-level animation of the model
Service crew [1] is currently working on the unit [26]
You can inspect the queue
Equipment unit [0] is currently being repaired by crew [2]

22 The Big Book of Simulation Modeling · Multimethod Modeling with AnyLogic 8
• We are not collecting any statistics in our model. We need to know the
availability of equipment at any time, the utilization of the service, and many
other things.
• Money still is to be added throughout the model. We need to calculate the
revenue brought by the equipment and the cost associated with maintaining
it.
• Some functionality is still missing (and some parts of the model have not yet
been tested); we have not yet added the maintenance of the equipment and
dependency of the failure rate on the equipment age and the timeliness of
maintenance.
• We have not programmed the ability to experiment with either the number
of service crews and the replacement policy.
• The visual impact of the model can be improved. For example, the color of the
equipment unit animation can reflect its state; then, we can always visually
assess the percent of working and failed equipment.
We will address these points in the next design phases.
4.4. Phase 3. The missing functionality
Maintenance, age, and failure rate
We will first focus on the missing functionality. According to our problem
statement, maintenance is due every 90 days (the MaintenancePeriod parameter).
When done on time, it decreases the probability of failure. Also, the age of
equipment is important: the older the equipment, the higher the failure rate.
How do we discover the time that maintenance is due, and the age? The equipment
statechart does not keep that information; when maintenance is done, it just comes
to the Working state.
The easiest way of always be able to find out the time since a certain event is to
remember the time of the event occurrence in a variable.
So, we will add two variables to the EquipmentUnit agent: TimeLastMaintenance and
TimeLastReplacement. The type of these variables will be double because model time in
AnyLogic has type double. What should the initial values of the variables be? The
problem statement says nothing about the initial condition of the equipment, so let
us assume that:
• No maintenance is overdue, and the time to the next maintenance is
distributed uniformly across the equipment units from 0 to the maintenance
period.

How to build agent-based models. Field service example 23
• The age is also distributed uniformly from 0 (new) to 3 maintenance periods
(moderately old).
Given that the model time at the beginning of the simulation is 0 (the calendar date
at time 0 can be anything we want), the initial values of the variables will be:
• TimeLastMaintenance is initialized as uniform( -MaintenancePeriod, 0 )
• TimeLastReplacement is initially equal to uniform( -3*MaintenancePeriod, 0 )
We will also write two useful auxiliary functions calculating age and time since last
maintenance. age() is calculated as time() – TimeLastReplacement (in AnyLogic, time() is
the current model time). Similarly, timeSinceMaintenance() returns time() -
TimeLastMaintenance.
Both functions will return time intervals measured in the time units of the model
and it makes sense to set the time units to days (this is done in the properties of the
model – the top-level item in the Projects tree).
Figure 4.18 Changes in the EquipmentUnit agent: maintenance, age, and failure rate
Since now we know the age and the maintenance state of the equipment, we can
properly calculate the failure rate, which depends on both things (as you may
remember, in the first version of the model we just used the base failure rate). We
were not given the exact dependency formula or any data to fit, so we will assume
some simple dependency. For example:
Static event (works in parallel with the statechart) Action: request maintenance
New condition
Action: schedule next mtce; update time of last mtce
New rate
New variables and functions
Action: update time of last replacement and last mtce; schedule next mtce

24 The Big Book of Simulation Modeling · Multimethod Modeling with AnyLogic 8
• If maintenance is overdue, the increase of the failure rate is proportional to
the overdue period divided by the maintenance period. For example, if the
maintenance has not been done for 180 days (it is 90 days overdue), the
failure rate will be multiplied by 2.
• Similarly, the equipment older than 3 maintenance periods has the failure
rate increased by the age divided by 3 maintenance periods.
This is the code of the failureRate function:
double mtceoverduefactor = max( 1, timeSinceMaintenance() / MaintenancePeriod ); double agefactor = max( 1, age() / ( 3 * MaintenancePeriod ) ); return BaseFailureRate * mtceoverduefactor * agefactor;
Now we can use this function in the rate of the Failure transition. Also, we can now
write the proper condition of the transition branch MaintenanceDue; it will be
timeSinceMaintenance() > MaintenancePeriod. The changes made to the model in this
and the next section are highlighted in Figure 4.18.
Scheduling maintenance. Handling requests of two types
Our model is still missing the maintenance scheduling. Which agent in the model
should take care of that? In the real world, it is most likely the service system that
keeps the log of completed maintenances and schedules the next ones. We could
literally mirror this in the model by adding an array of dynamic events, one for each
equipment unit, at the Main level. However, it would be more natural and elegant to
have a static event in each equipment unit. The event will act like a timer.
The equipment unit has a statechart that defines the main behavior pattern. Now
we are adding a small primitive activity (an event) that will go on in parallel to the
main activity and interact with it, see the message sequence diagram in Figure 4.19.

How to build agent-based models. Field service example 25
Figure 4.19 Two parallel activities in the EquipmentUnit agent: statechart and timer
We will call the event MaintenanceTimer. The timer will be restarted for the
MaintenancePeriod each time the maintenance is done. And we need to initialize the
timer at the beginning of the simulation according to the initial value of the
TimeLastMaintenance variable. The corresponding settings of the model are shown in
Figure 4.20.
MaintenancePeriod, timer is active
Maintenance being done
Failed, waiting for the service crew
Being repaired
Timer goes off and asks for maintenance
Service crew arrives
MaintenancePeriod, timer is active
Next maintenance
Timer is restarted
…
Statechart
Timer

26 The Big Book of Simulation Modeling · Multimethod Modeling with AnyLogic 8
Figure 4.20 Properties of elements related to maintenance scheduling
When the maintenance timer goes off, the equipment unit will request a service
crew to come and perform the maintenance by calling the function
requestMaintenance() of the Main agent. That function still is to be implemented; so
No auto scheduling
Default timeout
The timer is restarted with the default timeout: MaintenancePeriod
The first maintenance is scheduled according to the initial state of equipment – we use custom timeout
We are placing a maintenance request by calling a function of Main
Startup code of the EquipmentUnit agent

How to build agent-based models. Field service example 27
far, in the Main agent type, we only have one request queue and one function
requestService() that puts the request there. Should we place the maintenance
requests in the same queue? If we decide to do so (and leave the reference to the
equipment unit as the request type), the requests will be indistinguishable, and we
will not be able to treat them differently; for example, to implement priorities.
There are a couple options. Option one is to create a special type for a request that
will include the reference to the equipment unit, the type of request (repair or
maintenance), and maybe more information, such as timestamp. Option two is to
have two different queues for equipment units that need repair and those that need
maintenance. For simplicity’s sake, we will choose the second option.
Figure 4.21 The "service dispatcher" in Main that handles two types of requests
The updated implementation of the "service dispatcher" is shown in Figure 4.21. We
will assume that service requests are treated as high priorities because the failed
equipment stops bringing revenue. The maintenance requests are served only if
there is no failed equipment.
The equipment unit, however, can generate two requests in parallel. For example, it
can request maintenance and, while waiting for the service crew, it can fail and ask
for repair. Or, the maintenance timer can go off while the equipment is being
F Request service
If there is a maintenance request from the same unit, discard it. If a crew is already handling the unit, do nothing. Otherwise, add the request to the end of the queue; Broadcast "Check" to all service crews;
F There are requests
Returns true if any of the two queues is not empty
F Get request
Removes request from the head of the service queue, if it is empty, from the maintenance queue and returns it
?
F Request maintenance
If there is a service request from the same unit, or if a crew is already handling the unit, do nothing. Otherwise, add the request to the end of the queue; Broadcast "Check" to all service crews;
High priority

28 The Big Book of Simulation Modeling · Multimethod Modeling with AnyLogic 8
repaired. These situations need special treatment, because we do not want two
service crews to arrive at the same equipment unit. Therefore, before adding a
request to a queue, we are checking if the there was another request from the same
unit. The code of the corresponding functions of Main is shown in Figure 4.22.
Figure 4.22 The updated implementation of the service system in Main
Now the model functionality is completed, and we can run the model again to check
if equipment maintenance is done. You can see the number of maintenance requests
in the queue in the Main agent, the time to the next maintenance nearby the
MaintenanceTimer in EquipmentUnit, and the equipment statechart periodically
entering the Maintenance state.
requestService( EquipmentUnit unit )
requestMaintenance( EquipmentUnit unit )
boolean thereAreRequests()
EquipmentUnit getRequest()
Two identical linked lists
How to build agent-based models. Field service example 29
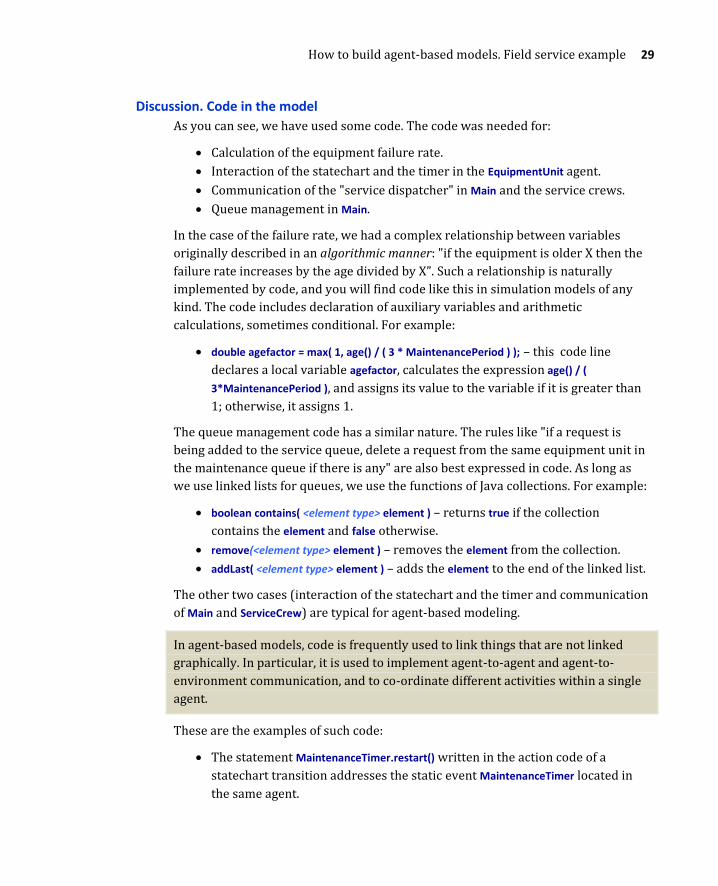
Discussion. Code in the model
As you can see, we have used some code. The code was needed for:
• Calculation of the equipment failure rate.
• Interaction of the statechart and the timer in the EquipmentUnit agent.
• Communication of the "service dispatcher" in Main and the service crews.
• Queue management in Main.
In the case of the failure rate, we had a complex relationship between variables
originally described in an algorithmic manner: "if the equipment is older X then the
failure rate increases by the age divided by X”. Such a relationship is naturally
implemented by code, and you will find code like this in simulation models of any
kind. The code includes declaration of auxiliary variables and arithmetic
calculations, sometimes conditional. For example:
• double agefactor = max( 1, age() / ( 3 * MaintenancePeriod ) ); – this code line
declares a local variable agefactor, calculates the expression age() / (
3*MaintenancePeriod ), and assigns its value to the variable if it is greater than
1; otherwise, it assigns 1.
The queue management code has a similar nature. The rules like "if a request is
being added to the service queue, delete a request from the same equipment unit in
the maintenance queue if there is any" are also best expressed in code. As long as
we use linked lists for queues, we use the functions of Java collections. For example:
• boolean contains( <element type> element ) – returns true if the collection
contains the element and false otherwise.
• remove(<element type> element ) – removes the element from the collection.
• addLast( <element type> element ) – adds the element to the end of the linked list.
The other two cases (interaction of the statechart and the timer and communication
of Main and ServiceCrew) are typical for agent-based modeling.
In agent-based models, code is frequently used to link things that are not linked
graphically. In particular, it is used to implement agent-to-agent and agent-to-
environment communication, and to co-ordinate different activities within a single
agent.
These are the examples of such code:
• The statement MaintenanceTimer.restart() written in the action code of a
statechart transition addresses the static event MaintenanceTimer located in
the same agent.

30 The Big Book of Simulation Modeling · Multimethod Modeling with AnyLogic 8
• The statement main.requestMaintenance() in the action code of the
MaintenanceTimer located in the EquipmentUnit agent reaches out to the
equipment's container agent Main and calls its function requestMaintenence().
• The loop statement in Main
for( ServiceCrew sc : service )
if( sc.equipmentUnit == unit )
return;
iterates through all ServiceCrew agents embedded in Main (service is the name
of the service crew population), checks if the variable equipmentUnit in the
service crew equals a given unit, and, if yes, exits the loop and the function
where the loop is located.
The code patterns we considered are very typical and cover about 90% of the
modeler's needs.
4.5. Phase 4. Model output. Statistics. Cost and revenue
calculation
Now that the functionality is in place, we can work on the model output. So far,
animation is the only output the model generates. In this design phase, we will add
revenue and cost calculations throughout the model and collect and visualize
statistics. These are the output metrics we are interested in:
• Equipment availability
• Service crew utilization
• Cost of the service system
• Revenue
Equipment availability and service crew utilization
Both the equipment and the service crews are agents, so the task of calculating
availability and utilization is the task of obtaining percentages and average
numbers across the populations of agents. In AnyLogic, such statistics can be
defined in the Statistics section of the agent population properties, see Figure 4.23.

How to build agent-based models. Field service example 31
Figure 4.23 Statistics defined in the population of the equipment units
In those statistics we are counting the working equipment units, i.e. the units where
the current statechart state is Working. The expression in Condition, filed, looks a bit
unusual: the "natural" or "expected" form of the expression would be something
like inState( Working ). To understand why you should write the expression this way
consider the Java code generated by AnyLogic for the statistics (the user's part of
the code is highlighted):
int count = 0; for( EquipmentUnit item : equipment ) { if( item.inState( item.Working ) count++; }
We are currently in the Main agent and outside the EquipmentUnit agent. Therefore,
according to Java rules, every function or variable inside EquipmentUnit must be
prefixed by the reference to the agent. The local variable item in the loop is the
reference to the equipment unit, so it is put in front of the function and the state
names.
You may also wonder why we did not select the statistics of type Average. Average
calculates the average of a numeric value across the population. For example, if we
were calculating the average age of the equipment, we would use type Average. The
working / not working status of the equipment is a boolean value, so we are
counting the working units.
The result of the statistics definition is the function NWorking() that returns the
number of working units at the time it is called. Similarly, we will define three other
statistics functions:
• NOnService() calculating the number of equipment units being repaired or
replaced with a slightly more complex condition:
Reference to an agent in the population, i.e. to an EquipmentUnit
Expression in the agent (should evaluate to true or false)
The statistics will count those agents whose expressions evaluate to true

32 The Big Book of Simulation Modeling · Multimethod Modeling with AnyLogic 8
item.inState( item.Repair ) ||
item.inState( item.Replacement )
• NOnMaintenance() with the condition
item.inState( item.Maintenance )
• NFailed() with item.inState( item.Failed )
So far, we have only prepared the tools to collect data; no data has actually been
collected. We will now add a time stack chart to view the equipment availability.
The time stack chart settings are shown in Figure 4.24. There are four stripes in the
chart, corresponding to the four different statistics we have defined. The colors of
the stripes are the same as the colors of the equipment statechart states.
The chart will display a time interval of five years (see the Time window property).
Once per hour (Recurrence time setting) it will evaluate all four data items (call the
four statistics functions) and will internally keep a dataset of 50000 latest samples
(Display up to setting).
As long as the total number of equipment units is constant and we are interested in
the percent of working units, the Vertical scale is set to 100%. This means that the total
height of the four stripes will always equal the full height of the chart.
In most cases, it makes sense to separate the animation and output screens.
Moreover, the amount of output data may require more than one screen. Use
AnyLogic view areas to markup the screens and hyperlinks to switch between them.
The runtime picture of the chart after one year is shown at the bottom of Figure
4.24. Not surprisingly, the percent of time spent on service and maintenance times
is minor compared to the time equipment is up and running. But the time the
equipment is failed and waits for the service crew (the red stripe) is significant.

How to build agent-based models. Field service example 33
Figure 4.24 Time stack chart for equipment availability. Design time settings and
runtime view
The chart at runtime after five years have been simulated

34 The Big Book of Simulation Modeling · Multimethod Modeling with AnyLogic 8
In the same manner, in the service population we will define the statistics functions
for the idle, driving, and working states of the service crews. The two time stack
charts with the results of 5 simulated years with default parameter values are
shown in Figure 4.25. These charts (along with the financial ones that we will add in
the next section) will be the basis for our policy analysis.
Figure 4.25 Equipment and service states during a 5 years period
Cost and revenue
Revenue calculation is easy. A working equipment unit is bringing
DailyRevenuePerUnit dollars per day. Therefore, the annual revenue equals (the
annual average number of working equipment units) x (daily revenue per unit) x
(365).
First, we will create the cost and revenue parameters in the Main agent.
Figure 4.26 Cost and revenue parameters in Main
We will collect the statistics on number of working equipment units with a high
sampling rate (once per hour) to better monitor the state of the equipment. We will
accumulate the time averages of the equipment states during a year and display
annual revenue in a time plot.
Cost and revenue parameters

How to build agent-based models. Field service example 35
Figure 4.27 Statistics on number of working equipment units
Cyclic event. Each January 1 at the end of the day resets the statistics
Time stack chart. Displays the annual revenue during last 5 years
State of equipment
Continuous statistics. Records the state of equipment every hour
Reset
Samples
Every year
Every hour

36 The Big Book of Simulation Modeling · Multimethod Modeling with AnyLogic 8
The element of AnyLogic that is capable of calculating time averages is called
continuous statistics. To create continuous statistics, you should drag the Statistics
element from the Analysis palette and select Continuous (samples have duration in time)
in its properties. Every hour, we will add the number of working equipment units to
the statistics. By the end of the year (at the end of the last day of a year) the
statistics will have the full history of the equipment state, and we will add the time
average (the function mean() of the statistics) to the stack chart, see Figure 4.27.
The day after, we will reset the statistics so that it starts collecting data for the next
year. This is done by the cyclic event onJan1 that is set up to occur at the end of the
1st day, 366th day, etc.
Finally, we will create a chart of annual revenue. We will use a time plot, see Figure
4.27. To keep the numbers smaller, we will display them in thousands dollars
(values are divided by 1000).
How do we calculate the cost of our service system? There are two components of
cost:
• Daily cost of "employing" the service crews, and
• Per-operation cost of maintenance, repair, and replacement.
The first part of the cost equals (the number of service crews) x (daily cost of a
crew) x (365).
As for the cost of operations being performed, the information is currently not
recorded anywhere. We will create a variable WorkCost at the top level in Main and
increment it each time a maintenance, repair, or replacement operation is
performed. The changes made to Main are shown in Figure 4.28.
Figure 4.28 Elements in Main related to cost and revenue calculations
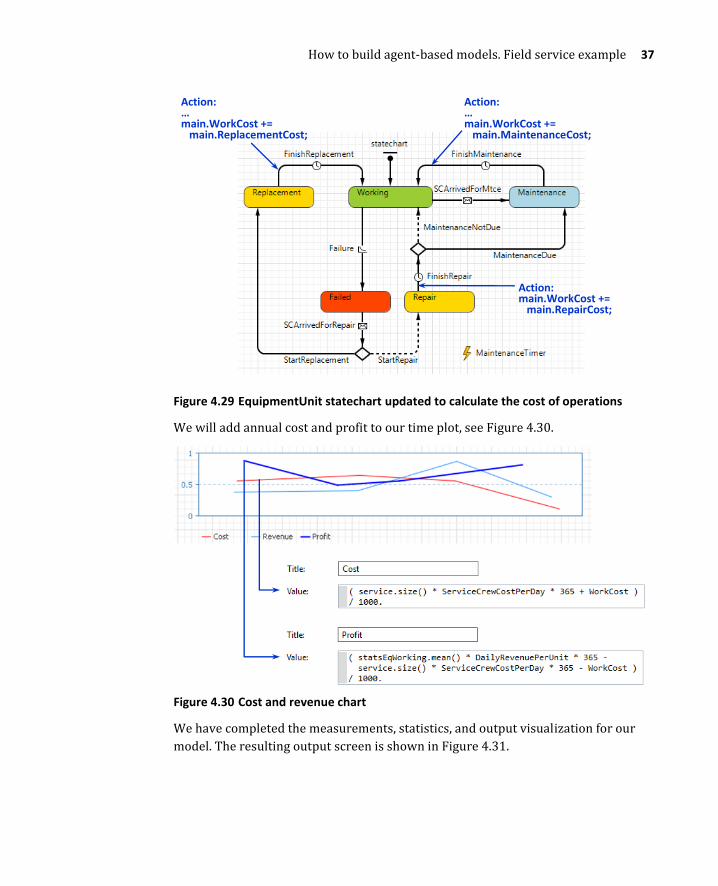
In the EquipmentUnit agent we will include the increments of the WorkCost variable at
the end of each operation. The corresponding actions are added to the transitions
FinishMaintenance, FinishRepair, and FinishReplacement, see Figure 4.29. As long as both
the cost parameters and the variable WorkCost are located in Main, we need to use
the prefix main to access them from the equipment unit.
Variable of type double
Reset annual cost of work
How to build agent-based models. Field service example 37
Figure 4.29 EquipmentUnit statechart updated to calculate the cost of operations
We will add annual cost and profit to our time plot, see Figure 4.30.
Figure 4.30 Cost and revenue chart
We have completed the measurements, statistics, and output visualization for our
model. The resulting output screen is shown in Figure 4.31.
Action: … main.WorkCost += main.ReplacementCost;
Action: … main.WorkCost += main.MaintenanceCost;
Action: main.WorkCost += main.RepairCost;

38 The Big Book of Simulation Modeling · Multimethod Modeling with AnyLogic 8
Figure 4.31 The model output screen with cost and revenue. 5 years simulated
4.6. Phase 5. Control panel. Running the flight simulator
We will now convert our model into a flight simulator where parameters and
policies can be varied on the fly and the results are displayed immediately. The
model user will be able to vary two things:
• The number of service crews, and
• The replacement policy, namely: a) replace only failed equipment that cannot
be repaired, or b) also replace equipment after N maintenance periods, even
if it is still working.
Design of control panel
We will create a simple control panel with two groups of radio buttons and one edit
box, see Figure 4.32. We will need three more parameters in the model:
• ServiceCapacity – the number of service crews, integer type, initially 3.
• ReplaceOldEquipment – boolean, initially false, if true, the equipment is
replaced after MtcePeriodToReplace maintenance periods.
• MtcePeriodToReplace – integer, initially 5, the maximum age of equipment if the
ReplaceOldEquipment policy applies.

How to build agent-based models. Field service example 39
Figure 4.32 The model control panel and related parameters
The value of a radio button control is a zero-based integer. Therefore, if the user
selects Replace equipment only if can't repair, the value is 0, and the boolean parameter
ReplaceOldEquipment is set to (value == 1), which evaluates to false. The edit box is
linked to an integer parameter, so it will automatically accept only an integer input.
We set the number of service crews (agents in the population service) to be
controlled by the parameter ServiceCapacity.
Now we need to set up the model to properly react to the policy changes made on
the fly.
Changing the number of service crews
In AnyLogic, agents can be added or deleted to or from a population by calling the
functions add_<population_name>() and remove_<population name>( agent ). To add a
new service crew to our service system, we can simply call add_service(). However,
we cannot delete a service crew at an arbitrary moment of time: the crew can be
handling a service request and, if the crew is deleted in the middle of say, a repair
operation, the operation will not finish correctly. For example, the message
"FINISHED" will be sent to a non-existing agent. To delete a service crew correctly, we
first need to make sure it is idle.
Default value: ReplaceOldEquipment ? 1 : 0 Action: ReplaceOldEquipment = ( value == 1 );
Link to: MtcePeriodsToReplace Enabled: ReplaceOldEquipment
Default value: ServiceCapacity - 1 Action: set_ServiceCapacity( value + 1 );

40 The Big Book of Simulation Modeling · Multimethod Modeling with AnyLogic 8
Here you can see the difference with discrete event (process-based) modeling. In a
discrete event model, you typically can reduce the number of resources in a pool at
any time and, if the resource being deleted is busy, it will follow some default policy;
for example, finish the work and then disappear. In the agent-based model, we are
implementing this policy explicitly.
Our implementation will be the following. Each agent in a population has an index
(from 0 to the size of the population - 1), and we will use that index to check if the
service crew is still employed. Each time a service crew finishes work with
equipment, it will check if its index is greater or equal than the parameter
ServiceCapacity. If yes, it will immediately delete itself. And for those service crews
that are idle or driving home, we will send a special notification to make check the
same condition.
Part of this scheme is implemented in Main in the On change code of the parameter
ServiceCapacity, see Figure 4.32. The second part is implemented in the updated
ServiceCrew agent, see Figure 4.33. The decision diamond on the left has two entries:
the Finished transition and the CheckIfLaidOff transition, and two outgoing branches:
one leads back to the normal operation, and another to the final state, where the
agent deletes itself (this is the Java reference to self).
Figure 4.33 The ServiceCrew statechart updated to react to the service capacity
changes
Action: main.remove_service( this );
Condition: getIndex() >= main.ServiceCapacity
Triggered by: Message "CHECK IF LAID OFF"

How to build agent-based models. Field service example 41
Figure 4.34 Updates in Main reflecting the changing number of service crews
In the Main agent, we created statistics statsScSize to calculate time average of
number of service crews. In the financial chart, we now use annual average number
of service crews obtained as statsScSize.mean() instead of the end-of-year number
service.size().
Equipment replacement policy
We need to implement the optional replacement of the equipment after a given
number of maintenance periods. We already have ReplaceOldEquipment and
Reset statistics
Continuous statistics on the number of service crews
New statistics

42 The Big Book of Simulation Modeling · Multimethod Modeling with AnyLogic 8
MtcePeriodsTpReplace parameters in Main. The rest can be naturally done in the
EquipmentUnit agent. Each time the service crew visits the equipment unit, we will
check if the policy is active; if yes, we will compare the age of the equipment with
MtcePeriodsToReplace * MaintenancePeriod. If the age is greater, the crew will perform
the "planned" replacement of the working equipment.
Figure 4.35 The EquipmentUnit statechart implementing the optional replacement
policy
We added another decision diamond after the transition SCArrivedForMtce ("service
crew arrived for maintenance"). If a planned replacement is recommended and due,
the statechart proceeds directly to the Replacement state. We also modified the
condition of the StartRepair branch. Now, if the service crew comes to fix the failed
equipment, it would also check if the planned replacement needs to be done.
The model now is ready for experiments.
Running the flight simulator
In the first experiment, we will vary the number of service crews. The results are
shown in Figure 4.36. The profit is virtually the same with four crews as with three,
but the equipment availability is considerably higher with four crews. The further
increase of the service capacity does not result in a noticeable increase of
Condition: randomTrue( ProbabilityReplacementNeeded ) || ( main.ReplaceOldEquipment && age() > main.MtcePeriodsToReplace * MaintenancePeriod )
Condition: main.ReplaceOldEquipment && age() > main.MtcePeriodsToReplace * MaintenancePeriod
Otherwise

How to build agent-based models. Field service example 43
availability, but it lowers the profit. Less than three service crews cannot handle the
fleet of 50 equipment units.
While in reality the system we are modeling will never remain unchanged for 5
years, the 5 years’ time window is good for the flight simulator mode as it allows us
to compare different solutions on one chart.
Figure 4.36 Trying different numbers of service crews
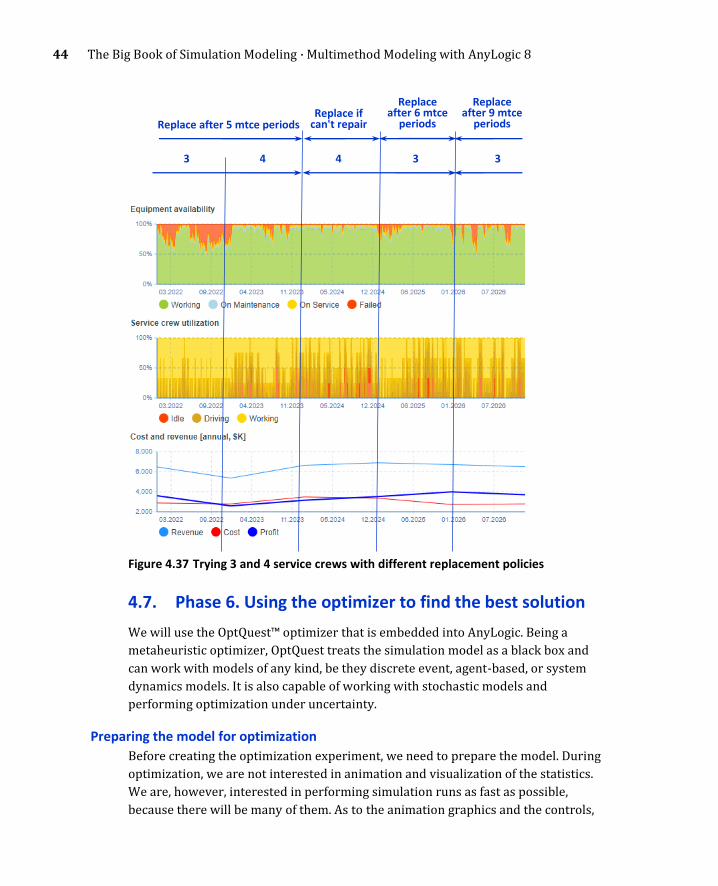
In the next run of our flight simulator, we will try three and four service crews and
vary the equipment replacement policy. The results (see Figure 4.37) show that
three service crews can successfully maintain high equipment availability and, at
the same time, bring high profit if old equipment is replaced.
Should we also try two service crews? We can, but even with the three parameters
we can vary (the number of service crews, the active/inactive policy, and the
maximum allowed age of equipment) it is quite hard to manually explore the
parameter space. Our next step will be to submit this task to the automatic
optimizer.
3 4 5 2 1
44 The Big Book of Simulation Modeling · Multimethod Modeling with AnyLogic 8
Figure 4.37 Trying 3 and 4 service crews with different replacement policies
4.7. Phase 6. Using the optimizer to find the best solution
We will use the OptQuest™ optimizer that is embedded into AnyLogic. Being a
metaheuristic optimizer, OptQuest treats the simulation model as a black box and
can work with models of any kind, be they discrete event, agent-based, or system
dynamics models. It is also capable of working with stochastic models and
performing optimization under uncertainty.
Preparing the model for optimization
Before creating the optimization experiment, we need to prepare the model. During
optimization, we are not interested in animation and visualization of the statistics.
We are, however, interested in performing simulation runs as fast as possible,
because there will be many of them. As to the animation graphics and the controls,
3
Replace after 5 mtce periods
3 4
Replace if can't repair
Replace after 9 mtce
periods
4 34
Replace after 6 mtce
periods

How to build agent-based models. Field service example 45
we can either delete them or leave them as-is; when not shown on the screen,
AnyLogic animation does not consume any computational resources. Charts and
statistics elements, however, are set up to evaluate their values with a certain
frequency, which slows down the simulation (especially when evaluating a value
requires iteration over a population of agents). Therefore, we will delete:
• All charts.
• All statistics except for statsEqWorking, which is needed to calculate the
revenue.
• Event onJan1 that resets the statistics every year.
We will create a new function profit() that will be called once at the end of a
simulation run and calculate the cumulative profit. This will be our objective
function. Figure 4.38 shows what is left.
Figure 4.38 The statistics and the objective function needed for optimization
Setting up the optimization experiment
One of the important settings is the duration of a simulation run. The duration
should be long enough to let the model work in the regular mode and produce
meaningful output. The warm-up period, in our case, is not a big issue: we are
initializing the equipment units at randomly distributed age and last maintenance
dates, so the initial state of the model differs from a regular state only in the
following:
• None of the equipment has failed or is being repaired.
• All service crews are idle and at their home location.
• The service and maintenance request queues are empty.
Given the failure rates and the maintenance period, the model should enter the
regular mode in less than a year. We will set the duration of a run to 4 years and will
not exclude the warm-up period from the output.
Is updated with one hour frequency
Accumulates the work cost
Mean daily revenue
Regular daily cost Total days simulated (the time unit is day)
Accumulated total work cost

46 The Big Book of Simulation Modeling · Multimethod Modeling with AnyLogic 8
We will ask the optimizer to maximize the cumulative profit evaluated at the end of
a simulation run, so we just write root.profit() in the objective function (root is the
reference to the top-level agent in the model, which in our case is Main).
Figure 4.39 Settings of the optimization experiment
The model has eight parameters at the top-level Main agent and more in the
EquipmentUnit agent. The solution space, however, is limited to only three
parameters (all of them are in Main): ServiceCapacity, ReplaceOldEquipment, and
MtcePeriodsToReplace. The solution space settings are shown in Figure 4.39.
From the flight simulator runs, we remember that two or fewer service teams are
not capable of handling the equipment, and five teams will be underutilized. Hence,
the minimum and maximum values of the ServiceCapacity parameter. The range for
the MtcePeriodsToReplace [2..8] is chosen both from the experience of the previous
runs and from the knowledge of the failure rate function.
Simulation duration settings
Objective and solution space settings
The optimizer will vary these three parameters
Maximum total profit during a 4 year period is our goal
4 years after the start date

How to build agent-based models. Field service example 47
Optimization run
Now we can run the optimization. This experiment may take a rather long time to
complete. The optimization results are shown in Figure 4.40. We have created the
default user interface for the experiment. The chart on the right shows the progress
of the optimization. Each dot in the chart corresponds to an iteration performed.
The vertical axis is the value of the objective function.
The best solution found by the optimizer is this:
• There are 3 service teams.
• We do replace old equipment, even if it works.
• The maximum allowed equipment age is 7 maintenance periods, i.e. 21
months.
Under these conditions, the estimated total 4-year profit is $17,791,343, which
makes an average annual profit of $4,447,836 (the optimization experiment,
however, does not tell us how the profit is distributed over the 4 years; to find that
out, you can copy the best parameter values into a simulation experiment we
created before and run it to see the charts).
The best parameter values (3 and 7) are in the middle of the searched ranges, which
means that the ranges were, most likely, well chosen.
Figure 4.40 The statistics and the objective function needed for optimization
The total number of iterations (number of solutions tried)
The best solution found by the optimizer
The progress of the optimization
OptQuest attempts to search the solution space
The solution

48 The Big Book of Simulation Modeling · Multimethod Modeling with AnyLogic 8
You may have noticed that, although the upper limit of the number of iterations was
set to 500, the optimizer only performed 70. This is because in our model, all three
parameters are discrete and the solution space has only [2..8] * [2..6] * [true, false] =
70 points. The optimizer was able to fully search the solution space – a rare simple
case.
We can, however, further reduce the number of iterations. Varying
MtcePeriodsToReplace does not make any sense when the ReplaceOldEquipment policy
is inactive. To pass this knowledge on to the optimizer you can use constraints –
conditions on the input parameters that are tested before a simulation run and
prevent the optimizer from trying particular solutions.
In AnyLogic, constraints are specified in the Constraints section of the optimization
experiment properties in the form <arithmetic expression over parameters> <relation>
<bound> where <relation> can be >=, <= or =. Boolean parameters in the constraint
expressions take values 0 and 1.
Figure 4.41 Optimization constraint
In our case, we need to invent an arithmetic expression that would be greater (or
less) than a certain value for all meaningful combinations of the two parameters,
see Figure 4.41 (when the replacement policy is inactive we just allow one arbitrary
value of MtcePeriodsToReplace, say, 2). A possible expression that does the job is
shown in the screenshot.
ReplaceOldEquipment
0 1
2 yes yes
3 no yes
4 no yes
5 no yes
6 no yes
7 no yes
8 no yes
Mtc
eP
eri
od
sTo
Re
pla
ce
ReplaceOldEquipment
0 1
2 2 -8
3 3 -7
4 4 -6
5 5 -5
6 6 -4
7 7 -3
8 8 -2
Mtc
eP
eri
od
sTo
Re
pla
ce
Restricted solution space Value of the constraint expression
Constraint in AnyLogic

How to build agent-based models. Field service example 49
With that constraint enabled, the number of iterations reduces to 40 and the
solution is found significantly quicker.
4.8. Assumptions
We can now deliver the final results of the modeling project to our client. The
deliverables, however, should always include the list of assumptions made by the
modeler under which the results make sense.
In a properly performed project, each of those assumptions should have been
discussed with the client and approved at the model design phases. Once again, we
recommend involving the client in the project on all stages and making as many
iterations with the client and getting as much feedback from the client as possible.
So, our major assumptions in this model are:
1. The formula for the equipment failure rate is one of our central
assumptions, along with the exponentially distributed time between
failures.
2. Repair, replacement, and maintenance times are triangularly distributed.
3. Repair, replacement, and maintenance have a fixed flat cost.
4. There are no shifts or breaks. All service crews work 24 hours a day.
5. Service crews never fail and always have all necessary parts and tools on
board. They never need to drive to the base location to pick up missing
stuff.
6. Service crews do not optimize their routes. They just take the next request
from the queue and drive there, whereas they could choose a request from
a closest location.
7. Service crews are equipped with a radio and can take new assignments
while driving.
4.9. Bonus phase. Enhanced animation
As a bonus to the work we have completed, we will enhance animation of the wind
turbines.
We will make the blades rotate when the wind turbine is working. We will also use
different colors to reflect the state of the equipment. It will make the model
animation more entertaining and may help with debugging the model.

50 The Big Book of Simulation Modeling · Multimethod Modeling with AnyLogic 8
Figure 4.42 Dynamic animation of the wind turbines
The shapes, groups and uses for the wind turbine animation and their properties
are shown in Figure 4.42. A new function color() was created in the EquipmentUnit
agent. It returns the color reflecting the current state of the equipment and is used
in multiple dynamic Fill color fields of shapes.
That's it!
Center of "rotatingpart"
Center of "group"
The dynamic Fill color of all shapes: color()
Dynamic Rotation, rad: inState( Working ) ? 5 * time() : 0

How to build agent-based models. Field service example 51
4.10. Bonus discussion. Could we model this in discrete
event style?
Now that we have finished the model, some of you may ask: Why did we use the
agent-based approach? Couldn't we do the same model in the discrete event style
with much less effort? Your doubts may be partially supported by the fact that the
system we were modeling is a service system, a type which is known to map well to
process-based flowchart languages. Let us consider a potential discrete-event
model design for the same problem.
The top-level process flow is easy. We have an incoming stream of maintenance and
repair requests (which are agents) that are serviced by a pool of service crews
(which are resources). This is a classical source – queue – service – sink model, see
Figure 4.43 A.
Figure 4.43 The top-level process flow and the "service" subprocess
Queue of requests
Resource pool – service crews
Service (repair, replacement, or maintenance)
Requests for repair or maintenance are
generated
Sink
Service crew drives to
equipment
The actual work is done
Service crew drives back home
Seize Release
Possibly seized on the way home by another request
Adding request to the queue depends on the whether a resource is currently seized by another request from the same equipment
A
B

52 The Big Book of Simulation Modeling · Multimethod Modeling with AnyLogic 8
We can have a single queue for both types of requests and treat repair requests as
high priority (all discrete event tools support priority queues). The rule that "an
incoming repair request discards a maintenance request from the same unit" can
also be implemented, provided you have access to the queue elements and the
ability to remove them. However, another rule that says "if a request comes in while
a service crew is already handling the equipment, the request is ignored" could
require some non-trivial coding in a discrete event model; we would have to either
search all agents being serviced or iterate through all service crews to find out what
are they doing.
In a discrete event model, implementation of the queuing policy would result in
approximately as much code as in our agent-based model. Some DE tools may not
have the necessary API. However, priority queue is a standard block in DE tools.
The "service" sub-process includes seizing a resource (a service crew), waiting for
the crew to arrive, the actual work, and releasing of the service crew, which then
drives home, see Figure 4.43 B. There are DE tools that support mobile resources.
The only thing that is rarely supported is "interception" of the resource on its way
home to assign another task (the red arrow in Figure 4.43 B).
So far there are no conceptual problems with using the discrete event method, only
potential technical limitations of some particular tools. But we still have to consider
the "work" block and the request generation.
Figure 4.44 Subprocess "The actual work"
Once the crew arrives at the equipment unit, it may find the unit in different states.
(Regardless of the request type: for example, while the unit was waiting for
maintenance, it could fail.) The work being done also depends on the age of the
Maintenance
Replacement
Repair
Maintenance due
Equipment is failed Can't
repair
Planned replacement
Accesses the age of equipment
Changes the next mtce date
Accesses the state of equipment at the time of crew arrival
Accesses the next mtce date

How to build agent-based models. Field service example 53
equipment and on the date of the next scheduled maintenance. Conditions in the
flowchart decision blocks explicitly refer to the state of the equipment, and the
actions modify the state, see Figure 4.44.
The state information, therefore, should be stored for each equipment unit in a
discrete event model anyway.
Figure 4.45 Generator of repair and maintenance requests
The request generation part is the most interesting part. It does not map to the
discrete event methodology at all. First, we clearly need a separate generator for
each equipment unit because the failure rate and the maintenance cycle are defined
for a unit. Second, the streams of requests are irregular: the next failure is
scheduled only after the equipment has been brought back to the working state, and
the next maintenance is scheduled only after the current one is completed, or if the
equipment has been replaced. The request sources work, therefore, in a very
unnatural mode: they are partially controlled by the changes of the equipment state
that are done elsewhere in the flowchart. The flowchart gets cross-linked by code
references and stops being a self-explanatory visual construct.
No matter how hard we try to "package" this system into a process, we will
inevitably end up with mimicking a set of independent objects having state
information and state-dependent behavior. And for that, the discrete event
modeling paradigm does not offer anything nearly as elegant as agents and
statecharts.
Accesses the age and the next mtce date. Is stopped if the equipment is failed or being serviced
Failure
Maintenance due
…
Is started after a maintenance or replacement and generates a single request
One such block for each
equipment unit
1
N