chapter 4 geothermal energy - ipcc · 2014-09-04 · 4 chapter 4: geothermal energy ... geothermal...
TRANSCRIPT

Zero Order Draft Special Report Renewable Energy Sources (SRREN)
Chapter 4
Geothermal Energy

2nd Order Draft Contribution to Special Report Renewable Energy Sources (SRREN)
Do Not Cite or Quote 1 of 45 Chapter 4 SRREN_Draft2_Ch04 16-Jun-10
Chapter: 4 Title: Geothermal Energy (Sub)Section: All Author(s): CLAs: Barry A. Goldstein, Gerardo Hiriart LAs: Ruggero Bertani, Christopher J. Bromley, Luis C.A. Gutiérrez-Negrín,
Ernst Huenges, Hirofumi H.M. Muraoka, Arni Ragnarsson, Jefferson W. Tester, Vladimir I. Zui
CAs: David Blackwell, Trevor N. Demayo, John W. Lund, Mike Mongillo, David Newell, Ladislaus Rybach, Subir Sanyal, Kenneth H. Williamson, Doone Wyborne [AUTHORS: to be finally completed].
Remarks: Second Order Draft Version: 01 File name: SRREN_Draft2_Ch04 Date: 16-Jun-10 14:02 Time-zone: CET Template Version: 9
COMMENTS ON TEXT BY TSU TO REVIEWERS 1
Yellow highlighted – original chapter text to which comments are references 2
Turquoise highlighted – inserted comment text from Authors or TSU e.g. [AUTHOR/TSU:…] 3
Chapter 4 has been allocated a total of 20 - 34 pages in the SRREN. The actual chapter length 4 (excluding references & cover page) is 38 pages: a total of 4 pages over target. Government and expert 5 reviewers are kindly asked to indicate where the chapter could be shortened in terms of text and/or 6 figures and tables. 7 8 All monetary values are presented in 2005 US$.9

2nd Order Draft Contribution to Special Report Renewable Energy Sources (SRREN)
Do Not Cite or Quote 2 of 45 Chapter 4 SRREN_Draft2_Ch04 16-Jun-10
Chapter 4: Geothermal Energy 1
CONTENTS 2
COMMENTS ON TEXT BY TSU TO REVIEWERS........................................................................1 3
Chapter 4: Geothermal Energy ....................................................................................................2 4
CONTENTS.........................................................................................................................................2 5
EXECUTIVE SUMMARY .................................................................................................................4 6
4.1 Introduction......................................................................................................................6 7
4.2 Resource Potential............................................................................................................8 8
4.2.1 Global technical resource potential.................................................................................8 9 4.2.2 Regional resource potential...........................................................................................10 10 4.2.3 Possible impact of climate change on resource potential .............................................11 11
4.3 Technology and applications (electricity, heating, cooling) ..........................................11 12
4.3.1 Geothermal energy utilisation.......................................................................................11 13 4.3.2 Exploration and drilling ................................................................................................12 14 4.3.3 Reservoir engineering ...................................................................................................12 15 4.3.4 Power plants..................................................................................................................13 16 4.3.5 Technologies needed for EGS development.................................................................14 17 4.3.6 Technology for submarine geothermal generation .......................................................14 18 4.3.7 Direct use ......................................................................................................................15 19 4.3.8 Geothermal heat pumps ................................................................................................15 20
4.4 Global and regional status of market and industry development...................................16 21
4.4.1 Status of geothermal electricity from conventional geothermal resources ...................16 22 4.4.2 Status of Enhanced Geothermal Systems......................................................................18 23 4.4.3 Status of direct uses of geothermal resources ...............................................................18 24 4.4.4 Impact of policies..........................................................................................................19 25
4.5 Environmental and social impacts .................................................................................20 26
4.5.1 CO2 and other gas and liquid emissions while operating geothermal plants ................20 27 4.5.2 Life-cycle assessment ...................................................................................................22 28 4.5.3 Potential hazards of induced seismicity and others ......................................................22 29 4.5.4 Benefits and impacts – economic, environmental, social .............................................23 30 4.5.5 Land use ........................................................................................................................24 31
4.6 Prospects for technology improvement, innovation, and integration ............................25 32
4.6.1 Technological and process challenges ..........................................................................25 33 4.6.2 Improvements in exploration technologies ...................................................................26 34 4.6.3 Accessing and engineering the reservoirs.....................................................................26 35 4.6.4 Efficient production of geothermal power, heat and/or cooling ...................................27 36
4.7 Cost trends .....................................................................................................................27 37
4.7.1 Costs of geothermal-electric projects and factors that affect it.....................................27 38 4.7.2 Levelised cost of geothermal electricity .......................................................................29 39

2nd Order Draft Contribution to Special Report Renewable Energy Sources (SRREN)
Do Not Cite or Quote 3 of 45 Chapter 4 SRREN_Draft2_Ch04 16-Jun-10
4.7.3 Historical trends of geothermal electricity....................................................................30 1 4.7.4 Future costs trends ........................................................................................................31 2 4.7.5. Economics of direct uses and geothermal heat pumps ................................................32 3
4.8 Potential Deployment.....................................................................................................33 4
4.8.1 Near-term forecasts .......................................................................................................33 5 4.8.2 Long-term deployment in the context of carbon mitigation .........................................35 6 4.8.3 Conclusions regarding deployment...............................................................................39 7
REFERENCES...................................................................................................................................40 8

2nd Order Draft Contribution to Special Report Renewable Energy Sources (SRREN)
Do Not Cite or Quote 4 of 45 Chapter 4 SRREN_Draft2_Ch04 16-Jun-10
EXECUTIVE SUMMARY 1
Geothermal resources correspond to the accessible thermal energy stored in the Earth’s interior, and 2 are used to generate electric energy in a thermal power plant, or in other domestic and agro-3 industrial applications requiring heat. Near-term (by 2015) geothermal-electric deployment is 4 estimated to be 121.6 TWh/y (0.44 EJ/y), and 250.4 TWh(thermal)/y (0.9 EJ/y) for heat 5 applications. Forecast long-term deployment (by 2050) is 1266 TWh/y (4.56 EJ/y) for electricity 6 and 2184 TWh(thermal)/y (7.86 EJ/y) for heat, representing 2.5%-4.1% of global electricity 7 demand and 4.9% of global heat demand, with some countries obtaining most of their primary 8 energy needs (heating, cooling and electricity) from geothermal energy. Global technical 9 potentials are estimated to be between 91 EJ/y (to 3 km depth) and 1043 EJ/y (to 10 km depth) for 10 electricity and between 10 EJ/y (minimum) and 322 EJ/y (maximum) for heat. 11
Geothermal heat is extracted using wells that produce hot fluids contained in hydrothermal 12 reservoirs with naturally high permeability or by artificial fluids pathways in Enhanced 13 (Engineered) Geothermal Systems (EGS). Technology for electric generation from 14 hydrothermal geothermal resources is mature, sustainable and reliable since approximately 15 40% of the installed capacity has been operating for more than 25 years. Direct heating technologies 16 using Geothermal Heat Pumps (GHP), district heating and EGS methods are available, with 17 different degrees of maturity. 18
High availability is a comparative advantage of geothermal energy use. Geothermal resources are 19 currently used for base-load electric generation in 24 countries with an installed capacity of 11 20 GW and a global average capacity factor of 71%, with newer installations above 90%, providing 21 10% to 30% of their electricity demand in six countries. Geothermal resources are also used directly 22 for heating and cooling in 78 countries, accounting for 50 GW of thermal capacity with GHP 23 applications having the widest market penetration. 24
Geothermal is a renewable resource as the extracted heat from an active reservoir is continuously 25 restored by natural heat production, conduction and convection from surrounding hotter regions, 26 and the extracted geothermal fluids are replenished by natural recharge and by injection of the 27 depleted (cooled) fluids. If managed properly, geothermal systems can be sustainable for the 28 long term. Direct CO2 emissions average 120 g/kWhe for currently operating conventional flash 29 and direct steam power plants and less than 1 g/kWhe for binary cycle plants with total injection. 30 Corresponding figures for direct use applications are even lower. It should be emphasized that this 31 emission is from natural CO2 releases into the atmosphere, not created by any combustion process, 32 since the exploitation of geothermal energy does not create any additional CO2 production to the 33 environment. Over its full life-cycle, the CO2-equivalent emissions range from 23-80 g/kWhe for 34 binary plants and 14-202 g/kWht for district heating systems and GHP. This means geothermal 35 resources are environmentally advantageous and the net energy supplied more than offsets 36 the environmental impacts of human, energy and material inputs. 37
Like other RE, geothermal-electric projects have relatively high up-front capital costs, varying 38 currently between 1800 and 5300 US$ (2005) per kilowatt, but with no recurring “fuel costs”. The 39 levelised costs of electricity (LCOE) from conventional hydrothermal resources are 40 competitive in today’s electricity markets, ranging from 43 to 84 US$ (2005) per megawatt-41 hour (MWh). LCOE projections for EGS electricity fall within a much wider range because of 42 uncertainties regarding resource parameters (particularly sustainable flow-rate and heat recovery 43 factor), and assumptions regarding future drilling costs. Costs are expected to decrease – by about 44 15% for hydrothermal and by 50% for EGS by 2050, assuming success in developing 45

2nd Order Draft Contribution to Special Report Renewable Energy Sources (SRREN)
Do Not Cite or Quote 5 of 45 Chapter 4 SRREN_Draft2_Ch04 16-Jun-10
stimulation technology. Current costs of direct uses are generally competitive ranging from an 1 average of <100 (pond heating) to 3900 (for building heating) US$ (2005) per installed thermal 2 kilowatt and correspondingly low levelised costs for energy as they avoid inherent heat to power 3 efficiency limitations. 4
Despite the present competitiveness of conventional geothermal energy for electric and non-electric 5 applications, most operating systems today are utilizing the highest grade resources available. 6 Public and private support for research along with favourable deployment policies would 7 assist the expanded utilisation of conventional geothermal resources and demonstration and 8 commercialisation of EGS and other non-conventional geothermal resources. This policy 9 support could include subsidies, loan guarantees and tax write-offs to cover the risks of initial deep 10 drilling and long term productivity. Feed-in tariffs with confirmed geothermal prices, and direct 11 subsidies for district and building heating would also help to accelerate deployment. 12
Geothermal heat sources will not be impacted by climate change. Geothermal energy utilization 13 is nearly climate neutral, and its many other positive environmental attributes enable it to operate in 14 an environmentally sustainable manner. With its natural thermal storage capacity, geothermal is 15 especially suitable for supplying dispatching base-load power. Thus geothermal could function in 16 a portfolio approach to increase the effectiveness of intermittent RE sources such as hydro, 17 wind and solar, resulting in a much larger net impact for mitigating climate change. 18
Although there are clear challenges to realizing the massive potential of geothermal energy, they are 19 surmountable within 20 years with modest investments for research, development, and early 20 deployment of advanced technologies. Geothermal energy is uniquely positioned to play a key 21 role in climate change mitigation strategies. 22

2nd Order Draft Contribution to Special Report Renewable Energy Sources (SRREN)
Do Not Cite or Quote 6 of 45 Chapter 4 SRREN_Draft2_Ch04 16-Jun-10
4.1 Introduction 1
Geothermal resources consist of thermal energy stored at depth within the earth in both rock and 2 trapped steam or liquid water. Geothermal systems occur in a number of geological environments 3 where the temperatures and depths of the reservoirs vary accordingly. Many high-temperature 4 (>180°C) hydrothermal systems are associated with recent volcanic activity and are found near 5 plate tectonic boundaries (subduction, rifting, spreading or transform faulting), or at crustal and 6 mantle hot spot anomalies. Intermediate (100-180°C) and low temperature (<100°C) systems are 7 also found in continental settings, formed by above-normal heat production through radioactive 8 isotope decay; they include aquifers charged by water heated through circulation along deeply 9 penetrating fault zones. However, there are several notable exceptions, and under appropriate 10 conditions, high, intermediate and low temperature geothermal fields can be utilised for both power 11 generation and the direct use of heat. 12
Geothermal systems can be classified as convective, which includes liquid- and vapour-dominated 13 hydrothermal as well as lower temperature aquifers, or conductive, which includes hot rock and 14 magma over a wide range of temperatures. Lower temperature aquifers contain deeply circulating 15 fluids in porous media or fracture zones, but lack a localized heat source. They are further sub-16 divided into systems at hydrostatic pressure and systems at pressure much higher than hydrostatic 17 (geo-pressured). Resource utilisation technologies can be grouped under types for electrical power 18 generation or for direct use of the heat. Geothermal Heat Pumps (GHP) are a subset of direct use, 19 and Enhanced or Engineered Geothermal Systems (EGS), where fluid pathways are engineered by 20 fracturing the rock, are a subset under both utilisation types. Currently, the most widely exploited 21 geothermal systems for power generation are hydrothermal (of continental subtype). Table 4.1 22 summarizes all of these types. 23
Table 4.1 Type of geothermal resources, temperatures and uses. 24
Utilisation Type
Natural fluids
Subtype Temperature
Range Current Potential
Continental H, I & L Power, direct uses Convective (Hydrothermal)
Yes Submarine H None Power
Shallow (<400 m) L Direct uses (GHP)
Hot rock (EGS) H, I Direct Power, direct Conductive No
Magma bodies H None Power, direct
Hydrostatic aquifers Direct Power, direct Lower temperature Aquifers
Yes Geo‐pressured
I & L Direct Power, direct
Temperature: H: High (>180°C), I: Intermediate (100‐180°C), L: Low (ambient to 100°C). EGS: Enhanced (or 25 Engineered) Geothermal Systems. Direct uses include GHP (Geothermal Heat Pumps). 26
In areas of magmatic intrusions, temperatures above 1000°C can occur at less than 10 km depth. 27 Magma typically ex-solve mineralised fluids and gases, which then mix with deeply circulating 28 groundwater. Heat energy is also transferred by conduction but in magmatic systems, convection is 29 also important. Typically, a hydrothermal convective system is established whereby local surface 30 heat-flow (through hot springs and steam vents) is significantly enhanced. Such shallow systems 31 can last hundreds of thousands of years, and the gradually cooling magmatic heat sources can be 32 replenished periodically with fresh intrusions from a deeper magma chamber. Finally, geothermal 33 fields with temperatures as low as 5-10°C are also used for direct applications using heat pumps. 34
Subsurface temperatures increase with depth according to the local geothermal gradient, and if hot 35 rocks within drillable depth can be stimulated to improve permeability, using hydraulic fracturing, 36 chemical or thermal stimulation methods, they form a potential EGS resource that can be used for 37

2nd Order Draft Contribution to Special Report Renewable Energy Sources (SRREN)
Do Not Cite or Quote 7 of 45 Chapter 4 SRREN_Draft2_Ch04 16-Jun-10
power generation and/or direct applications. EGS resources occur in all geothermal environments, 1 but are likely to be economic in the medium term in geological settings where the heat flow is high 2 enough to permit exploitation at depths of less than 5 km. Experiments have investigated the 3 potential of such continental EGS settings in large areas of Europe, North America, Asia and 4 Australia. In the longer term, and given the average geothermal gradients (25-30°C/km), EGS 5 resources at relatively high temperature (≥180C) may be exploitable in geological settings at 6 depths up to 7 km, which is well within the range of existing drilling technology (~10 km depth). 7 Geothermal resources of different types may occur at different depths. For example, fractured and 8 water-saturated hot-rock EGS resources lie below hot sedimentary aquifer resources in the 9 Australian Cooper Basin (Goldstein et al., 2009). These EGS resources include Hot Dry Rock 10 (HDR), Hot Fractured Rock (HFR), Hot Wet Rock (HWR), among other terms. 11
Direct uses of geothermal energy have been practised at least since the Middle Palaeolithic when 12 hot springs were used for ritual or routine bathing (Cataldi, 1999), and industrial utilisation began in 13 Italy by exploiting boric acid from the geothermal zone of Larderello, where in 1904 the first 14 kilowatts of electric energy were generated and in 1913 the first 250-kWe commercial geothermal 15 power unit was installed (Burgassi, 1999). 16
For the last 100 years, geothermal energy has provided safe, reliable, environmentally benign 17 energy used in a sustainable manner to generate electric power and provide direct heating services 18 on both large and small scales. Approximately 40% of the present-day installed electricity capacity 19 has been in operation for more than 25 years, demonstrating technical maturity and reliability. 20 Geothermal typically provides base-load generation, but it can be dispatched and used for meeting 21 peak demand. Today, geothermal represents a viable energy resource in many industrial and 22 developing countries using a mature technology to access and extract naturally heated steam or hot 23 water from natural hydrothermal reservoirs, and it has the potential to make a more significant 24 contribution on a global scale through the development of advanced technology such as EGS that 25 would enable energy recovery from a much larger fraction of the accessible stored thermal energy 26 in the earth’s crust. In addition, GHP that can be utilized anywhere in the world for heating and 27 cooling, have had significant growth in the past 10 years, and are expected to provide a significantly 28 greater contribution to global energy savings in the future (Lund et al., 2003, 2010). 29
Today’s hydrothermal technologies have demonstrated very high average capacity factors (up to 30 90% in some plants) in electric generation with low carbon emissions. The capacity factor (CF) is 31 the ratio of the actual generation of electricity (averaged across a year) to the installed electrical 32 capacity, and is expressed as a percentage. Environmental and social impacts do exist with respect 33 to land and water use and seismic risk, but these are site and technology specific and largely 34 manageable. New opportunities exist to develop geothermal beyond power generation, particularly 35 to use geothermal heat for district and process heating, along with GHP for space heating and 36 cooling. 37
This chapter includes a brief description of the worldwide potential of geothermal resources (4.2), 38 the current technology and applications (4.3) and the expected technological developments (4.6), 39 the present market status (4.4) and its probable future evolution (4.8), the geothermal environmental 40 and social impacts (4.5) and the cost trends (4.7) in using geothermal energy to contribute to reduce 41 greenhouse gas (GHG) emissions and then mitigate climate change. As presented in this chapter, 42 climate change has no major impacts on geothermal energy, but the widespread development of 43 geothermal energy could considerably reduce the future emission of carbon dioxide into the 44 atmosphere, and play a significant role in reducing anthropogenic effects on climate change by 45 replacing fossil fuel burning plants. 46

2nd Order Draft Contribution to Special Report Renewable Energy Sources (SRREN)
Do Not Cite or Quote 8 of 45 Chapter 4 SRREN_Draft2_Ch04 16-Jun-10
4.2 Resource Potential 1
4.2.1 Global technical resource potential 2
The IPCC Fourth Assessment Report (AR4) estimated an available energy resource for geothermal 3 (including potential reserves) of 5000 EJ/y (Sims et al., 2007; see Table 4.2). 4
The total thermal energy contained in the Earth is of the order of 12.6 x 10¹² EJ and that of the crust 5 the order of 5.4 x 10⁹ EJ to depths of up to 50 km (Dickson and Fanelli, 2003). The main sources of 6 this energy are due to the heat flow from the earth’s core and mantle, and that generated by the 7 continuous decay of radioactive isotopes in the crust itself. Heat is transferred from the interior 8 towards the surface, mostly by conduction, at an average of 0.065 W/m2 on continents and 0.101 9 W/m2 through the ocean floor. The result is a global terrestrial heat flow rate of around 1400 EJ/y. 10 Considering that continents cover ~30% of the earth’s surface and their lower average heat flow, the 11 terrestrial heat flow under continents can be estimated at 315 EJ/y (Stefansson, 2005). 12
Under continents, the stored thermal energy within 10 km depth (reachable with current drilling 13 technology) has been estimated between 400 x 106 EJ (EPRI, 1978) and 105 x 106 EJ (Tester et al., 14 2005, see Table 11.1), within 5 km depth between 140 x 106 EJ (WEC, 1994) and 65 x 106 EJ and 15 at 3 km depth between 43 x 106 EJ (EPRI, 1978) and 35 x 106 EJ (Table 4.2). For the Australian 16 continent alone, Budd et al. (2008) estimated that recovery of just 1% of the stored geothermal 17 energy above 150°C to 5 km in the Australian continental crust corresponds to 190,000 EJ. Based 18 on these estimates, available resource is clearly not a limiting factor for geothermal deployment 19 globally. 20
Estimates of stored geothermal energy can be regarded as theoretical geothermal potentials, e.g. the 21 physical upper limit of the energy available from a certain source, in this case geothermal. 22 Technical potential however, includes practical limits to development, and is defined as the amount 23 of RE output obtainable by full implementation of demonstrated and likely to develop technologies 24 or practices, with no explicit reference to costs, barriers or policies. 25
Table 4.2 Global theoretical and technical geothermal potential (for electricity). 26
Theoretical Potential (thermal) Technical Potential (electric) (EJ/y) Depth (km) 106 EJ Reference
Identified resources
Reference Hidden
resources Total
10 400 EPRI, 1978 1036.9 1042.6
10 105 Tester et al., 2005 267.8 273.5
5 140 WEC, 1994 359.2 364.9
5 65 ‐‐ 163.6 169.3
3 43 EPRI, 1978 106.4 112.1
3 35 ‐‐
5.7 Stefansson,
2005
85.1 90.8
Recovery of geothermal energy utilises only a portion of the stored thermal energy due to 27 limitations in rock permeability that permit heat extraction through fluid circulation, and to the 28 minimum temperature limits for utilisation at a given site. To calculate an effective technical 29 potential it is also necessary to exclude the heat which cannot be accessed at drillable depths or is 30 insufficiently hot for practical use. Global utilisation has so far concentrated on areas in which 31 geological conditions, such as natural fractures and porous formations, permit water or steam to 32 transfer heat nearer to the surface, thus giving rise to convecting hydrothermal resources where 33 drilling to depths up to 4 km can access fluids at temperatures of 180°C to more than 350°C. 34
2nd Order Draft Contribution to Special Report Renewable Energy Sources (SRREN)
Do Not Cite or Quote 9 of 45 Chapter 4 SRREN_Draft2_Ch04 16-Jun-10
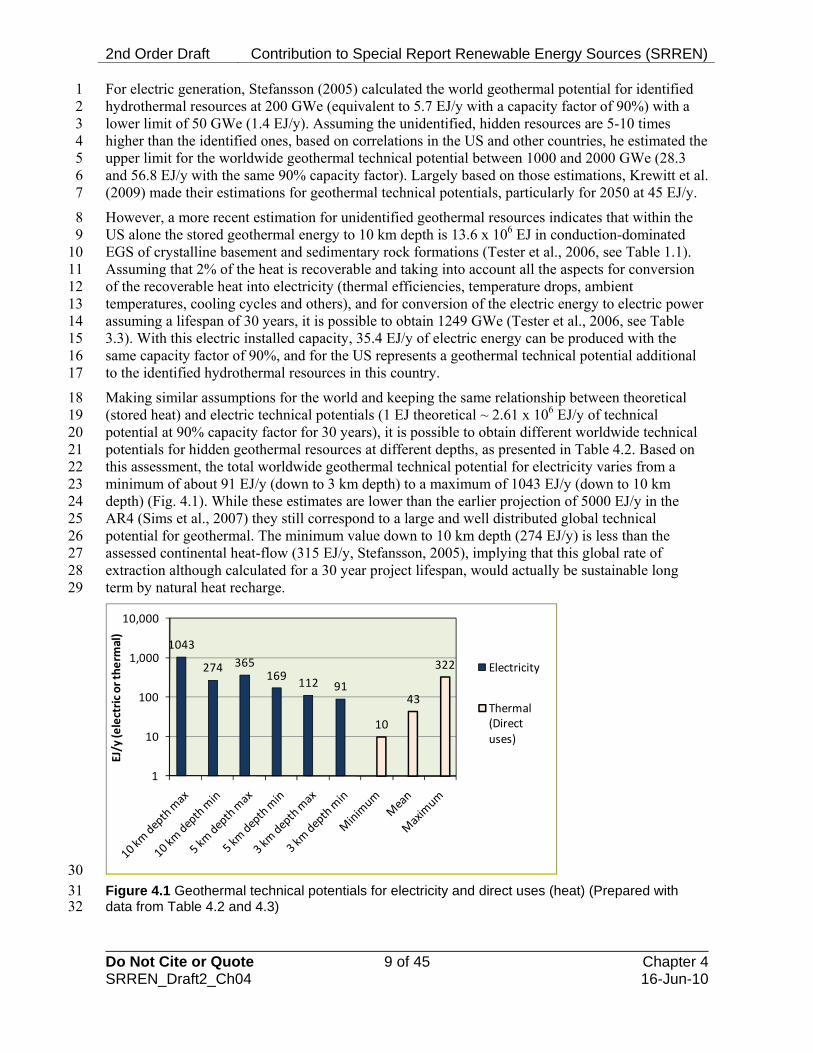
For electric generation, Stefansson (2005) calculated the world geothermal potential for identified 1 hydrothermal resources at 200 GWe (equivalent to 5.7 EJ/y with a capacity factor of 90%) with a 2 lower limit of 50 GWe (1.4 EJ/y). Assuming the unidentified, hidden resources are 5-10 times 3 higher than the identified ones, based on correlations in the US and other countries, he estimated the 4 upper limit for the worldwide geothermal technical potential between 1000 and 2000 GWe (28.3 5 and 56.8 EJ/y with the same 90% capacity factor). Largely based on those estimations, Krewitt et al. 6 (2009) made their estimations for geothermal technical potentials, particularly for 2050 at 45 EJ/y. 7
However, a more recent estimation for unidentified geothermal resources indicates that within the 8 US alone the stored geothermal energy to 10 km depth is 13.6 x 10⁶ EJ in conduction-dominated 9 EGS of crystalline basement and sedimentary rock formations (Tester et al., 2006, see Table 1.1). 10 Assuming that 2% of the heat is recoverable and taking into account all the aspects for conversion 11 of the recoverable heat into electricity (thermal efficiencies, temperature drops, ambient 12 temperatures, cooling cycles and others), and for conversion of the electric energy to electric power 13 assuming a lifespan of 30 years, it is possible to obtain 1249 GWe (Tester et al., 2006, see Table 14 3.3). With this electric installed capacity, 35.4 EJ/y of electric energy can be produced with the 15 same capacity factor of 90%, and for the US represents a geothermal technical potential additional 16 to the identified hydrothermal resources in this country. 17
Making similar assumptions for the world and keeping the same relationship between theoretical 18 (stored heat) and electric technical potentials (1 EJ theoretical ~ 2.61 x 10⁶ EJ/y of technical 19 potential at 90% capacity factor for 30 years), it is possible to obtain different worldwide technical 20 potentials for hidden geothermal resources at different depths, as presented in Table 4.2. Based on 21 this assessment, the total worldwide geothermal technical potential for electricity varies from a 22 minimum of about 91 EJ/y (down to 3 km depth) to a maximum of 1043 EJ/y (down to 10 km 23 depth) (Fig. 4.1). While these estimates are lower than the earlier projection of 5000 EJ/y in the 24 AR4 (Sims et al., 2007) they still correspond to a large and well distributed global technical 25 potential for geothermal. The minimum value down to 10 km depth (274 EJ/y) is less than the 26 assessed continental heat-flow (315 EJ/y, Stefansson, 2005), implying that this global rate of 27 extraction although calculated for a 30 year project lifespan, would actually be sustainable long 28 term by natural heat recharge. 29
1043
274 365169
112 91
10
43
322
1
10
100
1,000
10,000
EJ/y (electric or therm
al)
Electricity
Thermal (Direct uses)
30 Figure 4.1 Geothermal technical potentials for electricity and direct uses (heat) (Prepared with 31 data from Table 4.2 and 4.3) 32

2nd Order Draft Contribution to Special Report Renewable Energy Sources (SRREN)
Do Not Cite or Quote 10 of 45 Chapter 4 SRREN_Draft2_Ch04 16-Jun-10
Hidden or unidentified resources are mostly composed of low to mid grade conduction dominated 1 environments. Estimating the technical potential of EGS recovery methods is uncertain because of 2 the limited commercial experience to-date. Wide spread development is more likely to occur if 3 commercial-scale demonstration plants successfully establish sustainable operation within the next 4 decade. In particular, it is important to achieve sufficient reservoir heat exchange surface and 5 volume, inter-well connectivity and production flow rates, with acceptable water consumption and 6 pressure drops. Assuming successful resolution of these issues, EGS will become a leading 7 technology for providing thermal energy and electricity globally because of its widespread 8 accessibility. 9
For hydrothermal submarine vents, an estimation of >100 GWe (>2.8 EJ/y) offshore technical 10 potential has been made (Hiriart et al., 2010). This is based on the 3900 km of ocean ridges 11 confirmed as having hydrothermal vents, with the assumption that only 1% could be developed for 12 electricity production using a recovery factor of 4%. This assumption is based on capturing part of 13 the heat from the flowing submarine vent without any drilling. If offshore drilling becomes 14 technically and economically feasible a technical potential of 1000 GWe (28 EJ/y) from 15 hydrothermal vents may be possible. 16
For geothermal direct uses, Stefansson (2005) estimated 4400 GWth for the world potential 17 geothermal from resources <130°C, with a minimum of 1000 GWth and a maximum, considering 18 hidden resources, of 22,000-44,000 GWth. Taking a worldwide average capacity factor for direct 19 uses of 31%, the geothermal technical potential for heat can be estimated to be 43 EJ/y with a lower 20 value of 9.8 EJ/y and an upper value of 322 EJ/y (equivalent to 33,000 GWth of installed capacity) 21 (Fig. 4.1). Krewitt et al. (2009) used the same values estimated by Stefansson (2005) in GWth, but a 22 capacity factor of 100% was assumed when converted into EJ/y, and then the average upper limit of 23 33,000 GWth was converted into 1040 EJ/y. 24
4.2.2 Regional resource potential 25
The assessed geothermal technical potentials included in Table 4.2 and Fig. 4.1 are presented on a 26 regional basis in Table 4.3. 27
Table 4.3 Geothermal technical potentials for the IEA regions (prepared with data from EPRI, 28 1978, and global technical potentials described in section 4.2.1). 29
Technical potential in EJ/y (electric) at depths to:
3 km 5 km 10 km
Technical potential in EJ/y (heat for direct uses) IEA REGION
Min Max Min Max Min Max Min Mean Max
1. OECD North America 18.7 23.1 37.0 79.7 58.1 221.7 2.1 9.3 69.5
2. Latin America 10.4 12.8 21.3 45.9 32.9 125.5 1.2 5.5 40.9
3. OECD Europe 4.7 5.8 8.4 18.1 13.8 52.7 0.8 3.6 26.8
4. Africa 14.5 17.9 25.5 55.0 42.4 161.7 1.4 6.1 45.8
5. Transition Economies 17.2 21.2 29.5 63.6 49.6 189.1 1.5 6.8 51.1
6. Middle East 3.2 4.0 5.7 12.2 9.4 36.0 0.3 1.4 10.2
7. Developing Asia 7.3 9.1 14.6 31.5 22.9 87.2 0.8 3.7 27.6
8. India 2.4 3.0 4.0 8.7 6.9 26.1 0.2 1.0 7.2
9. China 6.4 7.9 12.9 27.7 20.1 76.6 0.7 3.3 24.5
10. OECD Pacific 5.9 7.3 10.4 22.4 17.3 65.9 0.6 2.5 19.0
Total 90.8 112.1 169.3 364.9 273.5 1042.6 9.8 43.0 322.6
The regional assessment of theoretical potential reported in Table 4.2 was conducted by the Electric 30 Power Research Institute in 1978 (EPRI, 1978), based on a detailed estimation of the thermal 31
2nd Order Draft Contribution to Special Report Renewable Energy Sources (SRREN)
Do Not Cite or Quote 11 of 45 Chapter 4 SRREN_Draft2_Ch04 16-Jun-10
energy stored inside the first 3 km under the continents accounting for regional variations in the 1 average geothermal gradient and the presence of either a diffuse geothermal anomaly or a high 2 enthalpy region, associated with volcanism or plate boundaries. The values in Table 4.3 followed 3 the EPRI approach for each region and applied to the minimum and maximum technical potentials 4 mentioned before at 3, 5 and 10 km depth. The separation into electric and thermal (direct uses) 5 potentials is somewhat arbitrary in that most higher temperature resources could be used for either 6 or both in combined heat and power applications depending on local market conditions. 7
4.2.3 Possible impact of climate change on resource potential 8
Geothermal energy is a renewable resource, but has unique sustainability characteristics. As thermal 9 energy is extracted from the active reservoir, it creates locally cooler regions. Geothermal projects 10 are typically operated at production rates that cause local declines in pressure and/or in temperature 11 over the economic lifetime of the installed facilities. These cooler and lower pressure zones in the 12 reservoir lead to gradients that result in continuous recharge by conduction from hotter rock, and 13 convection and advection of fluid from surrounding regions. The time scales for thermal and 14 pressure recovery are similar to those required for energy removal (Stefansson, 2000; Rybach and 15 Mongillo, 2006). Detailed modelling studies (Pritchett, 1998; O’Sullivan and Mannington, 2005) 16 have shown that this type of resource exploitation can be economically feasible, and still be 17 renewable on a timescale useful to society, when non-productive recovery periods are considered. 18
Therefore, with proper well placement and reservoir management strategies, geothermal energy can 19 be sustainably developed. In hydrothermal reservoirs sustainable production can be achieved by 20 adjusting production rates and injection strategies, taking into account the local resource 21 characteristics (field size, natural recharge rate, etc.). 22
Time scales for naturally recharging depleted geothermal reservoirs following the cessation of 23 production have been determined using numerical model simulations for: 1) heat extraction by 24 geothermal heat pumps, 2) the use of doublet (two wells) systems on a hydrothermal aquifer for 25 space heating, 3) the generation of electricity from a high enthalpy hydrothermal or EGS reservoir 26 (for details see Rybach and Mongillo, 2006; Axelsson et al., 2005; O’Sullivan and Mannington, 27 2005; Bromley et al., 2006). Models predict that replenishment will occur on time scales of the 28 same order as the lifetime of the geothermal production cycle (Axelsson et al., 2005; Axelsson et 29 al., 2010). 30
Geothermal resources are not dependent on climate conditions and climate change is not expected 31 to have a significant impact on the geothermal resource potential. The operation of heat-pumps is 32 not affected in any significant way by a gradual change in ambient temperature associated with 33 climate change. On a local basis, the effect of climate-change on rainfall distribution may have a 34 long-term effect on the recharge to specific groundwater aquifers, which in turn may affect 35 discharges from some hot springs, and could have an effect on water levels in shallow 36 geothermally-heated aquifers. Also a change in availability of cooling water from surface water 37 supplies could be affected by changes in rainfall patterns, and this may affect the efficiency of 38 cooling for power plant condensers. However, each of these effects, if they occur, can easily be 39 remedied by simple adjustments to the technology. 40
4.3 Technology and applications (electricity, heating, cooling) 41
4.3.1 Geothermal energy utilisation 42
Geothermal energy is extracted from reservoir fluids by discharging various mixtures of hot water 43 and steam through production wells. In high temperature reservoirs, as pressure drops, the water 44

2nd Order Draft Contribution to Special Report Renewable Energy Sources (SRREN)
Do Not Cite or Quote 12 of 45 Chapter 4 SRREN_Draft2_Ch04 16-Jun-10
component boils or “flashes”. Separated steam is piped to a turbine to generate electricity and the 1 remaining hot water may be flashed again two or three times at progressively lower pressures (and 2 temperatures) to obtain more steam. The remaining brine is usually sent back to the reservoir 3 through injection wells or first cascaded to a direct-use system before injecting. Few reservoirs 4 produce “dry” steam, which can be sent directly to the turbine. In these cases, control of steam flow 5 to meet power demand fluctuations is easier than in the case of two-phase production, where 6 continuous upflow in the well-bore is required to avoid gravity collapse of the water phase. 7 Intermediate temperature reservoirs are utilised by extracting heat from produced hot water through 8 a heat exchanger generating power in a binary cycle or in heating and injecting the cooled water 9 back into the reservoir. 10
Geothermal technologies belong to Category 1 (technologically mature with established markets in 11 at least several countries). Key technologies for exploration and drilling, reservoir management and 12 stimulation and energy recovery and conversion are described below. 13
4.3.2 Exploration and drilling 14
Since geothermal resources are underground, exploration methods (including geological, 15 geochemical and geophysical surveys) have been developed to locate and assess them and these 16 methods can be improved. The objectives of geothermal exploration are to identify and rank 17 prospective geothermal reservoirs prior to drilling, and to provide methods of characterising 18 reservoirs that enable estimations of geothermal reservoir performance and lifetime. Exploration of 19 a prospective geothermal reservoir involves estimating its lateral extent and depth with geophysical 20 methods and drilling exploration wells, minimising the risk. 21
Today, geothermal wells are drilled over a range of depths down to 5 km using conventional 22 drilling methods similar to those used for oil and gas. Advances in drilling technology enable high 23 temperature operation and provide directional capability. Typically, wells are deviated from vertical 24 to about 30-50° inclination from a “kick off point” at depths between 200 m and 2000 m. Many 25 wells can be drilled from the same pad, heading in different directions to access large resource 26 volumes, target permeable structures and minimise the surface impact. Current geothermal drilling 27 methods are presented in more detail in chapter 6 of Tester et al. (2006). In addition, for other 28 geothermal applications such as GHP and direct uses, smaller and more flexible rigs have been 29 developed to overcome accessibility limitations in built-up areas. 30
4.3.3 Reservoir engineering 31
The modern method of estimating reserves and sizing power plants is to apply reservoir simulation 32 technology. Since it is not possible to gather all the data required to construct a comprehensive 33 deterministic model, a conceptual model is built, using available data, then translated into a 34 numerical representation, and calibrated to the unexploited, initial thermodynamic state of the 35 reservoir. Future behaviour is forecast under selected load conditions using a heat and mass transfer 36 algorithm (for example, Pruess, 2009), and optimum plant size selected. 37
Injection management is an important aspect of geothermal development. Cooling of production 38 zones by injected water that has had insufficient contact with hot reservoir rock can result in severe 39 production declines. Placement of wells should also aim to enhance deep hot recharge through 40 production pressure drawdown, but suppress shallow inflows of peripheral cool water through 41 injection pressure increase. 42
Given sufficient, accurate calibration with field measurements (surface and subsurface), geothermal 43 reservoir evolution can be modelled and pro-actively managed. Hence, it is prudent to monitor and 44 analyse the chemical and thermodynamic properties of geothermal fluids, along with mapping their 45

2nd Order Draft Contribution to Special Report Renewable Energy Sources (SRREN)
Do Not Cite or Quote 13 of 45 Chapter 4 SRREN_Draft2_Ch04 16-Jun-10
flow and movement. This information combined with other geophysical data are fed back to re-1 calibrate models for better predictions (Grant et al., 1982). 2
4.3.4 Power plants 3
For electricity generation, dry steam, flash and binary plants are in use today. In all cases heat 4 transfer and rejection are major considerations in the existing designs. Geothermal flash plants, the 5 most common configuration, consist of pipelines, water-steam separators, vaporisers, de-misters, 6 and different types of turbines. Steam turbines are driven by convective flow to a low pressure 7 exhaust or a vacuum. In a condensing turbine (Figure 4.2, left), vacuum conditions are usually 8 maintained by direct contact condenser. 9
1
1
2 2
4 455
67
8 89
Steam
Steam
Water
Water
3 6
10 Figure numbers: 1: Production well, 2: Injection well, 3: Separator, 4: Turbo‐generator, 5: Cooling tower, 6: 11 Condenser, 7: Heat exchanger, 8: Water pump, 9: Feed pump. 12
Figure 4.2 Schematic diagram of a geothermal condensing steam power plant (left) and a binary-13 cycle power plant (right) (Adapted from Fridleifsson et al., 2008). 14
The unit sizes commonly range from 20-110 MWe (DiPippo, 2008). Design optimisation requires 15 knowledge of reservoir behaviour. Double or triple flash cycles make use of excess brine separated 16 at high pressure. A “triple flash” steam turbine can have three different inlets, operating at pressures 17 and temperatures as low as 1.4 bara and 110°C. Dry steam plants do not need separators as 18 geothermal fluids are steam (as in The Geysers, USA, Larderello, Italy, Matsukawa, Japan, and 19 some Indonesian fields), and then their design is simpler. Back-pressure turbines are steam turbines 20 that exhaust to the atmosphere, omitting the condenser and the cooling tower, and are frequently 21 used as small plants to start the development of new fields. The efficiency is only about 50-60% of 22 condensing turbines, but the cost is less. About 15 back-pressure units of 5 MWe have been 23 successfully operating in Mexico since the 1980s (Hiriart and Gutiérrez-Negrín, 1994). 24
Binary cycle plants of Organic Rankine Cycle (ORC) type (Figure 4.2, right) utilise lower 25 temperature geothermal fluids (ranging from about 70 to 170°C) than conventional flash and dry 26 steam plants (from about 150°C to over 300°C). They are more complex since the geothermal fluid 27 (water, steam or both) passes a heat exchanger heating another “working” fluid such as isopentane 28 or isobutane with a low boiling point, which vaporizes and drives a turbine. The working fluid can 29 then be air-cooled or condensed with water. Binary plants are often constructed as linked modular 30 units of a few MWe in capacity or as bottoming cycle with flash steam plants. 31
Combined or hybrid plants comprise two or more of the above basic types to improve versatility, 32 increase overall thermal efficiency, improve load-following capability, and efficiently would cover 33 a wide (90-260°C) resource temperature range. 34
Cogeneration (Co-gen) plants, or Combined or Cascaded Heat and Power plants (CHP), produce 35 both electricity and hot water for district heating or direct use at significantly higher utilisation 36

2nd Order Draft Contribution to Special Report Renewable Energy Sources (SRREN)
Do Not Cite or Quote 14 of 45 Chapter 4 SRREN_Draft2_Ch04 16-Jun-10
efficiency than can be achieved for just generating electricity or supplying heat. Relatively small 1 industries and communities of a few thousand people provide sufficient markets for combined heat 2 and power applications. Iceland has two geothermal cogeneration plants with a combined capacity 3 of 300 MWt in operation; the distance of the plants to the towns ranges from 12 to 25 km, over 4 which cooling losses using large insulated pipes and high flow-rates, are negligible. At the Oregon 5 Institute of Technology (OIT) with 3000 students, faculty and staff a CHP provides most of the 6 electricity needs and all the heat demand (Lund and Boyd, 2009). Combined heat and power using 7 low temperature geothermal resources have also been developed in Germany and Austria. 8
4.3.5 Technologies needed for EGS development 9
The principle of Enhanced Geothermal Systems (EGS) is as follows: in the subsurface where 10 temperatures are high enough for effective utilisation, a fracture network is created or enlarged to 11 act as fluid pathways. Water is passed through this deep reservoir using injection and production 12 wells, and heat is extracted from the circulating water at the surface. The extracted heat can be used 13 for power generation and for district heating. 14
EGS projects are currently at a demonstration and experimental stage. The key technical and 15 economic challenges for EGS over the next two decades will be to achieve and maintain efficient 16 and reliable stimulation of multiple reservoirs with sufficient volumes to sustain long term 17 production at acceptable rates, with low flow impedance, limited short-circuiting fractures, and 18 manageable water loss (Tester et al., 2006), and managing seismic risks. 19
Conforming research priorities for EGS and magmatic resources as determined in Australia (DRET, 20 2008), USA, the EU (ENGINE, 2008) and the International Partnership for Geothermal 21 Technologies (IPGT, 2008) are summarised in Table 4.4. Successful deployment of the associated 22 services and equipment is also relevant to many conventional geothermal projects. 23
Table 4.4 Priorities for advanced geothermal research (HTHF: high temperature & high flow-rate). 24
Complementary research & share knowledge Education / training
Standard geothermal resource & reserve definitions Improved HTHF hard rock drill equipment
Predictive reservoir performance modelling Improved HTHF multiple zone isolation
Predictive stress field characterisation Reliable HTHF slim‐hole submersible pumps
Mitigate induced seismicity / subsidence Improve resilience of casings to HTHF corrosion
Condensers for high ambient‐surface temperatures Optimum HTHF fracture stimulation methods
Use of CO2 as a working fluid for heat exchangers HTHF logging tools and monitoring sensors
Improve power plant design HTHF flow survey tools
Technologies & methods to minimise water use HTHF fluid flow tracers
Predict heat flow and reservoirs ahead of the bit Mitigation of formation damage, scale and corrosion
4.3.6 Technology for submarine geothermal generation 25
Offshore, there are some 67,000 km of mid-ocean ridges, of which 13,000 km have been studied, 26 and more than 280 sites with submarine geothermal vents have been discovered (Hiriart et al., 27 2010). Some discharge thermal energy of up to 60 MWt (Lupton, 1995) but there are others, such as 28 ‘Rainbow’, with an estimated output of 1-5 GWt (German et al., 1996). The abundance of 29 submarine hydrothermal systems indicates that technology for their future exploitation should be 30 investigated further, providing such projects become economically feasible. 31
In theory, electric energy could be produced directly from a hydrothermal vent (without drilling) 32 using an encapsulated plant, like a submarine, containing an ORC binary plant, as described by 33

2nd Order Draft Contribution to Special Report Renewable Energy Sources (SRREN)
Do Not Cite or Quote 15 of 45 Chapter 4 SRREN_Draft2_Ch04 16-Jun-10
Hiriart and Espíndola (2005). The operation would be similar to other binary cycle power plants 1 using evaporator and condenser heat exchangers, with internal efficiency of the order of 80% 2 (Hiriart et al., 2010). Overall efficiency for a submarine vent at 250°C of 4% (electrical power 3 generated / thermal power) is a reasonable estimate for such an installation (Hernández, 2008). 4 Other critical challenges for these resources include the distance from shore, water depth, grid-5 connection costs and the potential impact on unique marine life around hydrothermal vents. 6
Adaptation of off-shore drilling technology to tap into off-shore hydrothermal resources also has the 7 potential of significantly increasing global technical geothermal resource potential. Integrated 8 development, to share infrastructure with other renewable energy sources (such as offshore wind 9 and wave power), may provide an economic platform for utilisation in the long term. 10
4.3.7 Direct use 11
Direct use provides heating and cooling for buildings including district heating, fish ponds, 12 greenhouses and swimming pools, water purification/desalination and industrial and process heat 13 for agricultural products and mineral extraction and drying. 14
For space heating, closed loop (double pipe) systems are commonly used. In this case, heat 15 exchangers are utilised to transfer heat from the geothermal water to a closed loop that circulates 16 heated freshwater through the radiators. This is often needed because of the chemical composition 17 of the geothermal water. The spent water is disposed of into injection wells. Open loop systems do 18 not inject produced geothermal fluids. However, in both cases a conventional backup boiler (as 19 shown in Figure 4.3) may be provided to meet peak demand, to reduce the overall investment, and 20 to conserve the geothermal resource. 21
In Iceland, the geothermal water is transported up to 63 km from the geothermal fields to towns. 22 Transmission pipelines are mostly of steel insulated by rock wool (surface pipes) or polyurethane 23 (subsurface). However, several small villages and farming communities have successfully used 24 plastic pipes (polybutylene), with polyurethane insulation, as transmission pipes. The temperature 25 drop is insignificant in large diameter pipes with a high flow rate. 26
Open loop – single pipe system Closed loop – double pipe system
85°
Open loop – single pipe system Closed loop – double pipe system
85°
27 Figure 4.3 Two main types of district heating systems (Dickson and Fanelli, 2003). G=gas 28 separator, P=pump, B=backup boiler, R=radiation heating, HX=heat exchanger. 29
4.3.8 Geothermal heat pumps 30
Geothermal Heat Pumps (GHP) have experienced one of the fastest growing applications of 31 renewable energy in the world (Rybach, 2005; Lund et al., 2010). This form of direct use of 32 geothermal energy is based on the relatively constant ground or groundwater temperature in the 33 range of 4°C to 30°C readily available almost anywhere, to provide space heating, cooling and 34 domestic hot water for all types of buildings. Extracting energy cools the ground, which creates 35

2nd Order Draft Contribution to Special Report Renewable Energy Sources (SRREN)
Do Not Cite or Quote 16 of 45 Chapter 4 SRREN_Draft2_Ch04 16-Jun-10
temperature gradients, enhancing recharge thus, heating and cooling loads need to be balanced or 1 mitigated. 2
Closedloop,vertical
Closed loop, horizontal
Open loop, two
wells
Plasticpipes
3 Figure 4.4 Closed loop and open loop heat pump systems. The heat pump that includes a 4 compressor and heat exchangers is shown in red (Adapted from Lund et al., 2003). 5
There are two main types of geothermal heat pumps (Figure 4.4). In ground-coupled systems a 6 closed loop of plastic pipe is placed in the ground, either horizontally at 1-2 m depth or vertically in 7 a borehole down to 50-250 m depth. A water-antifreeze solution is circulated through the pipe. Thus 8 heat is collected from the ground in the winter and optionally heat is rejected to the ground in the 9 summer. An open loop system uses groundwater or lake water directly as a heat source in a heat 10 exchanger and then discharges it into another well or into the same water-reservoir. 11
In essence heat pumps are nothing more than refrigeration units with the heat rejected in the 12 condenser used for heating or heat extracted in the evaporator used for cooling. Their efficiency is 13 described by a coefficient of performance (COP) which is the heating or cooling output divided by 14 the electrical energy input. Typically this value lies between 3 and 4 (Lund et al., 2003; Rybach, 15 2005). 16
4.4 Global and regional status of market and industry development 17
Electricity has been generated commercially by geothermal steam since 1904. Presently the 18 geothermal industry has a wide range of participants, including major energy companies, private 19 and public utilities, equipment manufacturers and suppliers, field developers and drilling 20 companies. Current industrial participants can be found by searching the IGA, IEA-GIA, GEA, 21 GRC, and other national websites featuring energy attributes. [TSU: Full names missing.] 22
4.4.1 Status of geothermal electricity from conventional geothermal resources 23
In 2009, electricity was being produced from conventional geothermal resources in 24 countries 24 with an installed capacity of 10.7 GWe (Fig. 4.5). The worldwide use of geothermal energy for 25 power generation (predominantly from conventional hydrothermal resources) was 67.2 TWh/y in 26 2008 with a worldwide CF of 71% (Bertani, 2010). Many developing countries are amongst the top 27 15 in geothermal electricity production. 28
Conventional geothermal resources currently used to produce electricity are of high-temperature 29 (>180°C), typically utilised through steam turbines (condensing or back-pressure, flash or dry-30 steam), and of low-intermediate temperature (<180°C) commonly utilised using binary-cycle power 31 plants. 32
Currently the world’s top geothermal producer is the US with almost 29% of the global installed 33 capacity (3094 MWe, Fig. 4.5). The US geothermal resurgence is due to increased RE penetration 34 in the US power generation market. State Renewable Portfolio Standards (RPS) demand and the 35 Federal Production Tax Credit (PTC), increased natural gas price fluctuation, and a rapid 36

2nd Order Draft Contribution to Special Report Renewable Energy Sources (SRREN)
Do Not Cite or Quote 17 of 45 Chapter 4 SRREN_Draft2_Ch04 16-Jun-10
acceleration of pushback against the permitting of new coal-fired power plants have all opened a 1 clear market opportunity for geothermal growth. US geothermal activity is concentrated in a few 2 western states, but only a fraction of the geothermal potential has been developed so far. 3
United States 3094 MW
Mexico 958 MW
Guatemala 52 MW
El Salvador 204 MW
Nicaragua 88 MW
Costa Rica 166 MW
Portugal 29 MW
France 16 MW
Iceland 575 MW
Turkey 82 MW
Ethiopia 7.3 MW
Kenya 167 MW
Thailand 0.3 MW
Italy843 MW
Germany 6.6 MW
Austria 1.4 MW
Indonesia 1197 MW
Philippines 1904MW
Papua‐N. G. 56 MW
N. Zealand 628 MW
Australia 1.1 MW
Japan536 MW
Russia82 MW
Total : 10,715 MWe
China24 MW
4 Figure 4.5 Geothermal-electric installed capacity by country in 2009. Figure shows worldwide 5 average heat flow in mW/m2 and tectonic plates boundaries (Figure from Hamza et al., 2008; data 6 from Bertani, 2010). 7
Outside of the US, about 29% of the global installed geothermal capacity resides in the Philippines 8 and Indonesia, and then the markets of Mexico, Italy, Japan, Iceland, and New Zealand account for 9 one third of the global installed geothermal capacity (Fig. 4.5). Although some of these markets 10 have seen relatively limited growth over the past few years, in others, greater urgency to advance 11 low-carbon base-load power generation is helping re-start new capacity growth (for example, 12 installed capacity in New Zealand and Iceland has doubled in the past five years, IEA-GIA, 2009). 13 Moreover, attention is turning to new markets like Chile, Germany, and Australia, and other more 14 established markets as in East Africa, Turkey, Nicaragua and Russia. 15
The majority of existing geothermal assets are operated by state-owned utilities and Independent 16 Power Producers (IPP). Currently, more than 30 companies globally have an ownership stake in at 17 least one geothermal deployed project. Altogether the top 20 owners of geothermal capacity control 18 approximately 90% of the entire installed global market. 19
At the end of 2009, the geothermal-electric capacity (10.7 GWe) represented only 0.21% of the total 20 worldwide electric capacity, which was about 5,000 GWe. However, taken separately, six of those 21 24 countries shown in Figure 4.6 (El Salvador, Kenya, Philippines, Iceland, Costa Rica and New 22 Zealand) obtain more than 10% of their national electricity production from high temperature, 23 conventional geothermal resources (Bromley et al., 2010). 24
Worldwide evolution of geothermal power and geothermal direct uses during the last 40 years are 25 presented in Table 4.5, including the annual average rate of growth over each period. The average 26 annual growth of geothermal-electric installed capacity over the last 40 years is 7.2% [TSU to 27

2nd Order Draft Contribution to Special Report Renewable Energy Sources (SRREN)
Do Not Cite or Quote 18 of 45 Chapter 4 SRREN_Draft2_Ch04 16-Jun-10
authors: Value inconsistent with value in table 4.5. Please clarify.], and for geothermal direct uses 1 (heat applications) is 11% in the last 35 years. 2
Table 4.5 Average annual growth rate in geothermal power capacity and direct uses in the last 40 3 years. (Prepared with data from Bertani, 2010; Lund et al., 2005, 2010; Gawell and Greenberg, 4 2007; Fridleifsson and Ragnarsson, 2007.) 5
Electric capacity Direct uses capacity Year
MWe % MWt %
1970 720 ― N.A. ―
1975 1,180 13.1 1,300 ―
1980 2,110 15.6 1,950 10.7
1985 4,764 22.6 7,072 38.0
1990 5,834 5.2 8,064 3.3
1995 6,833 4.0 8,664 1.8
2000 7,972 3.9 15,200 14.4
2005 8,933 2.9 27,825 16.3
2010 10,715 4.7 50,583 16.1
Total annual average: 7.0 11.0
%: Average annual growth in percent over the period. 6 N.A.: Reliable data not available. 7
4.4.2 Status of Enhanced Geothermal Systems 8
EGS demonstration is active in Europe, the US and Australia. Since 2005 Australia has seen rapid 9 acceleration in activity. By 2010, 18 stock market-registered enterprises held Australian geothermal 10 licences. Cumulative investment amounted to US$ 248 M (to end of 2008) and was underpinned by 11 government grants of US$ 267 M (to end of 2009) (Goldstein et al., 2010). In France the EU project 12 “EGS Pilot Plant” at Soultz-sous-Forêts, started in 1987 and has recently commissioned the first 13 power plant (1.5 MWe) to utilise the enhanced fracture permeability at 200°C. In Landau, 14 Germany, the first EGS-plant, with 2.5 to 2.9 MWe, went into operation in late 2007 (Baumgärtner 15 et al., 2007). Deep sedimentary aquifers are tapped at the geothermal test site in Groß Schönebeck 16 using two research wells (Huenges et al., 2009). 17
The US in its recent clean energy initiatives has included large EGS research, development, and 18 demonstration components as part of a revived national geothermal program. One of the main goals 19 for EGS in the short term is to upscale to several tens of MWe. 20
The availability of financing, water, transmission and distribution infrastructure and other factors 21 will play major roles in regional growth trends of EGS projects. In the US, Australia, and Europe, 22 EGS concepts are being field tested and deployed, providing advantages for accelerated deployment 23 in those regions as risks and uncertainties are reduced. In other rapidly developing regions in Asia, 24 Africa, and South America, factors that would affect deployment are population density, distance to 25 market, electricity and heating and cooling demand. 26
4.4.3 Status of direct uses of geothermal resources 27
Direct heat supply temperatures are typically close to actual process temperatures in district heating 28 systems which range from approximately 60 to 120°C. As a result, only a small degradation of the 29 thermodynamic quality of the geothermal heat occurs. The main types (and relative percentages) of 30 direct applications in annual energy use are: space heating of buildings (63%, of which three 31 quarters are from heat pumps), bathing and balneology (25%), horticulture (greenhouses and soil 32

2nd Order Draft Contribution to Special Report Renewable Energy Sources (SRREN)
Do Not Cite or Quote 19 of 45 Chapter 4 SRREN_Draft2_Ch04 16-Jun-10
heating) (5%), industrial process heat and agricultural drying (3%), aquaculture (fish farming) (3%) 1 and snow melting (1%) (Lund et al., 2010). 2
Heating of building spaces, including district heating schemes, is among the most important direct 3 applications. When the resource temperature is too low for direct use, it is possible to use a 4 geothermal heat pump (GHP). Also space cooling can be provided by geothermal resources, and 5 GHP devices can heat and cool with the same equipment. 6
Bathing, swimming and balneology utilizing geothermal water have a long history and are globally 7 wide-spread. In addition to the thermal energy the chemicals dissolved in the geothermal fluid are 8 also important for treating various skin and health diseases. 9
Geothermally heated greenhouses allow cultivation of flowers and vegetables in colder climates 10 where commercial greenhouses would not normally be economical. Heating soil in outdoor 11 agricultural fields has also been applied at several places such as Iceland and Greece. 12
A variety of industrial processes utilise heat applications, including drying of forest products, food, 13 and minerals industries as in the United States, Iceland and New Zealand. Other applications are 14 process heating, evaporation, distillation, sterilisation, washing, CO2 and salt extraction. 15
Aquaculture using geothermal heat allows better control of pond temperatures, which is of great 16 importance for optimal growth. Tilapia, salmon and trout are the most common fish raised, but 17 unusual species such a tropical fish, lobsters, shrimp or prawns, and alligators are also reported. 18
Snow melting or de-icing by using low temperature geothermal water is applied in some colder 19 climate countries. City streets, sidewalks, and parking lots are equipped with buried piping systems 20 carrying hot geothermal water. In some cases, this is return water from geothermal district heating 21 systems as in Iceland, Japan and the United States. 22
The world installed capacity of geothermal direct use is currently estimated to be 50.6 GWt (Table 23 4.5), with a total thermal energy usage of about 121.7 TWht/y (0.438 EJ/y), distributed in 78 24 countries, with an annual average capacity factor of 27.8%. Geothermal heat pumps (GHP) 25 contributed with 70% (35.2 GWt) of the worldwide installed capacity (Lund et al., 2010). 26
4.4.4 Impact of policies 27
To bring geothermal to its full capacity in climate change mitigation it is necessary to address the 28 following main barriers, described according to the taxonomy of barriers used in this report. 29
I1 (Clarity in concepts [knowledge, understanding]). Lack of clarity in understanding geothermal is 30 often a barrier. Improvements could include programmes to standardise on reliable and efficient 31 geothermal technologies, to enhance public knowledge, to encourage more informed acceptance of 32 geothermal energy use, and to conduct further research towards the avoidance or mitigation of 33 induced hazards and adverse effects. 34
I2 (RE know-how systems). Efficient deployment of geothermal technologies relies on the 35 availability of skilled installation and service companies with well-trained personnel. For deep 36 geothermal drilling and reservoir management, such services are currently concentrated in a few 37 countries. For GHP installation and district heating, there is also a correlation between local 38 availability and awareness of service companies, and technology uptake. To increase development 39 rates, this constraint could be overcome by improved global infrastructure of services. 40
T3 (Transport and accessibility). Distributions of potential geothermal resources vary from being 41 almost site-independent (for GHP technologies and EGS) to being much more site-specific (for 42 hydrothermal sources). The distance between electricity markets or centres of heat demand and 43

2nd Order Draft Contribution to Special Report Renewable Energy Sources (SRREN)
Do Not Cite or Quote 20 of 45 Chapter 4 SRREN_Draft2_Ch04 16-Jun-10
geothermal resources, as well as the availability of transmission capacity, can be a significant factor 1 in the economics of power generation and direct use. 2
E2 (Cost structure and accounting) & E3 (Project appraisal and financing). Reducing costs and 3 increasing the efficiency of supplying geothermal energy will enhance its market competitiveness. 4 Policies set to drive uptake of geothermal energy work better if local demand and risk factors are 5 taken into account. For example, large numbers of small domestic heat customers can be satisfied 6 using GHP technologies, requiring relatively small budgets. For other countries, district heating 7 systems and industrial heat applications are more efficient and provide greater mitigation of CO2 8 emissions, but these markets typically require larger scale investments and a different policy 9 framework. 10
P3 (Energy subsidy, taxing, other support policies). Policies that support improved applied research 11 and development would benefit all geothermal technologies, but especially emerging technologies 12 such as EGS. Public investment in higher-risk geothermal research and exploration drilling is likely 13 to lead to a significant acceleration in follow-up commercial deployment. Specific incentives for 14 geothermal development can include subsidies, guarantees, and tax write-offs to cover the risks of 15 initial deep drilling. Policies to attract energy-intensive industries to known geothermal resource 16 areas can also be useful. Feed-in tariffs with confirmed geothermal prices have been very successful 17 in attracting commercial investment in some countries (e.g. Germany). Direct subsidies for new 18 building heating, refurbishment of existing buildings with GHP, and for district heating systems, 19 may be more applicable in other settings. 20
P4 (Regulations and rules impeding RE). Experience has shown that the relative success of 21 geothermal development in particular countries is closely linked to their government’s policies, 22 regulations, incentives and initiatives. Successful policies have taken into account the benefits of 23 geothermal energy, such as its independence from weather conditions and its suitability for base-24 load power. Another important policy consideration is the opportunity to subsidize the price of 25 geothermal kWh (both power and direct heating and cooling) through the mechanism of direct or 26 indirect CO2 emission taxes. A funding mechanism that subsidizes the commercial upfront 27 exploration costs, including the higher-risk initial drilling costs, would also be useful. In this regard, 28 a tax write-off provision for unsuccessful exploration drilling costs can, and has been, a useful 29 incentive. Government legislation, regulations, policies and programs that target increased use of 30 RE and lower greenhouse gas emissions will generally provide support to the increased use of 31 geothermal resources. 32
4.5 Environmental and social impacts 33
One of the strongest arguments for using geothermal energy is its limited environmental impact. 34 Sound practices protect natural thermal features that are valued by the community, and minimise 35 any adverse effects from disposal of geothermal fluids and gases, induced seismicity and ground 36 subsidence. Good practice can also optimize water and land use, while improving long-term 37 sustainability of production. The following sub-sections address these issues in more detail. 38
4.5.1 CO2 and other gas and liquid emissions while operating geothermal plants 39
Geothermal systems involve natural phenomena, and typically discharge gases mixed with steam 40 from surface features, and minerals dissolved in water from hot springs. Apart from CO2, 41 geothermal fluids can, depending on the site, contain a variety of other gases, such as H2S, H2, CH4, 42

2nd Order Draft Contribution to Special Report Renewable Energy Sources (SRREN)
Do Not Cite or Quote 21 of 45 Chapter 4 SRREN_Draft2_Ch04 16-Jun-10
NH3 and N2. Mercury, arsenic, radon and boron may be present. The amounts depend on the 1 geological, hydrological and thermodynamic conditions of the geothermal field1. 2
In high temperature hydrothermal fields, measured direct CO2 emission from the operation of 3 conventional power or heating plants is widely variable, from 0 to 740 g/kWhe, but averages about 4 120 g/kWhe (weighted average of 85% of the world power plant capacity, according to Bertani and 5 Thain, 2002, and Bloomfield et al., 2003). The gases are often extracted from a steam turbine 6 condenser or two-phase heat exchanger and released through a cooling tower. CO2, on average, 7 constitutes 90% of these non-condensable gases (Bertani and Thain, 2002). 8
Of the remaining gases, H2S is toxic, but is rarely sufficiently concentrated to be harmful after 9 venting to the atmosphere and dispersal. Removal of H2S released from geothermal power plants is 10 practiced in parts of the US and Italy. Elsewhere, H2S monitoring is a standard practice to provide 11 assurance that concentrations after venting and atmospheric dispersal are not harmful. CH4 is also 12 present in relatively small concentrations (typically a few percent of the CO2 concentration). 13
In low-temperature applications (<100°C), direct CO2 emission from geothermal fluid is about 0-1 14 g/kWh (electric) depending on the carbonate content of the water. If the extracted geothermal fluid 15 is passed through a heat exchanger and then completely injected (such as in a closed-loop pumped 16 system), then CO2 emission is nil. Other gas emissions from low-temperature geothermal resources 17 are normally much less than the emissions from the high-temperature fields. 18
In Enhanced Geothermal Systems power plants are likely to be designed as closed-loop circulation 19 systems, with zero direct emissions. (If boiling occurs within the circulation loop, then some non-20 condensable gas extraction and emission is likely.) 21
The possibility of using CO2 as a working fluid in geothermal reservoirs is also under investigation. 22 The fact that the rock volume of active commercial sized geothermal reservoirs is of the order of a 23 cubic kilometre per well would enable storage of a large volume of supercritical CO2 underground. 24 If this method is successfully developed, it could provide a means for enhancing the effect of 25 geothermal energy deployment for lowering CO2 emissions beyond just generating electricity with a 26 carbon-free renewable resource. 27
In direct uses (heating) emissions of CO2 from low-temperature geothermal fluids are usually 28 negligible (Fridleifsson et al., 2008). In Reykjavik (Iceland), the CO2 content of thermal 29 groundwater used for district heating (0.05 mg/kWht) is lower than that of the cold groundwater. In 30 China (Beijing, Tianjin and Xianyang) it is less than 1 g CO2/kWh. In the Paris Basin (a 31 sedimentary basin), the geothermal fluid is kept under pressure within a closed circuit (the 32 geothermal ‘doublet’) and injected into the reservoir without any degassing taking place. 33 Conventional geothermal district heating schemes (such as Klamath Falls, Oregon, US) commonly 34 produce brines which are also injected into the reservoir and thus never release CO2 into the 35 environment. CO2 is also used in greenhouses to improve plant growth and extracted for use in 36 carbonated beverages –such in Iceland. 37
Most hazardous chemicals in geothermal fluids are concentrated in the water phase. If present, 38 boron and arsenic are likely to be harmful to ecosystems if released at the surface, so geothermal 39 brine is usually injected into the reservoir. This avoids contamination of surface waterways. In the 40 past, surface disposal of separated water has occurred at a few fields, but today it happens only in 41 exceptional circumstances such as equipment failure. If the discharge is significantly in excess of 42
1 Note that SO2, unlike H2S, is a common source of acid rain, but is not usually present in geothermal emissions.

2nd Order Draft Contribution to Special Report Renewable Energy Sources (SRREN)
Do Not Cite or Quote 22 of 45 Chapter 4 SRREN_Draft2_Ch04 16-Jun-10
natural hot spring discharges, and is not strongly diluted, then the net effects on ecology of rivers, 1 lakes or marine environments can be adverse. Shallow groundwater aquifers of potable quality may 2 also need to be protected from contamination by injected fluids or from soakage ponds by using 3 cemented casings or impermeable liners. Monitoring is undertaken to investigate, and if necessary 4 mitigate, such adverse effects (Bromley et al., 2006). 5
After separation and condensation, surplus steam condensate may be suitable for stock drinking 6 water or irrigation purposes instead of injection. At Wairakei, New Zealand, the steam condensate 7 has been approved by environmental regulating agencies for irrigation purposes, but each case will 8 be chemically different and must be judged on its own merits. 9
4.5.2 Life-cycle assessment 10
Life-cycle assessment (LCA) analyses the whole life cycle of a product “from cradle to grave”. For 11 geothermal power plants all gas emission impacts directly and indirectly related to the construction, 12 operation and deconstruction of the plant are considered in LCA. 13
Kaltschmitt et al. (2006) calculated CO2-equivalent emissions of between 59 and 79 g/kWh for 14 closed loop binary power plants. Pehnt (2006) calculated a LCA CO2-equivalent of 41 g/kWh. Nill 15 (2004) analysed the learning curve effects on the life cycle and predicts a reduction in CO2-16 equivalent from binary plants from 80 g/kWh to 47 g/kWh between 2002 and 2020. Frick et al. 17 (2010) compare two binary plants of the same capacity (1.75 MWe) with resources at different 18 depths and temperatures, and calculated a CO2-equivalent between 23 and 66 g/kWh. Binary closed 19 loop systems are expected to have a greater use in future. They also presented other LCA 20 environmental indicators, which are compared to those of a central European reference mix in Table 21 4.6, where it is observed that the geothermal CO2-equivalent is between 4 and 12% of this reference 22 mix. At sites with above-average geological conditions, CO2-equivalent emissions can be less than 23 1%. The breakdown of the reference mix is: 26% lignite coal, 26% nuclear power, 24% hard coal, 24 12% natural gas, 4% hydropower, 4% wind power, 1% crude oil, 3% other fuels (Frick et al., 2010). 25
Table 4.6 Environmental impact indicators for a reference electricity mix and for typical geothermal 26 binary power plants (Prepared with data from Frick et al., 2010). 27
LCA indicator Reference electricity mix Binary geothermal plants (1.75 MWe)
Finite energy resources 8.9 MJ/kWh 0.4‐1.0 MJ/kWh
CO2‐equivalent 566 g/kWh 23‐66 g/kWh
Using life cycle assessments for geothermal direct uses, Kaltschmitt (2000) published figures of 4-28 16 tonnes CO2-equivalent /TJ (14.3-57.6 g/kWht) for low-temperature district heating systems, and 29 50-56 tonnes CO2-equivalent/TJ (180-202 g/kWht) for heat pumps. 30
The life cycle of intermediate- to low-temperature geothermal developments is dominated by large 31 initial material and energy inputs during the construction of the wells, power plant and pipelines. To 32 maximize net-energy output and minimize emissions these can be optimised during the construction 33 period. For hybrid electricity/district heating applications, more direct use of the heat optimizes the 34 environmental benefits. 35
In conclusion, the LCA assessments show that geothermal is similar to other RE (hydro and wind) 36 in total life-cycle emissions, and it has significant environmental advantages relative to a reference 37 electricity mix dominated by fossil fuel sources. 38
4.5.3 Potential hazards of induced seismicity and others 39
Local hazards arising from natural phenomena, such as micro-earthquakes, hydrothermal steam 40 eruptions and ground subsidence may be influenced by the operation of a geothermal field. Pressure 41
2nd Order Draft Contribution to Special Report Renewable Energy Sources (SRREN)
Do Not Cite or Quote 23 of 45 Chapter 4 SRREN_Draft2_Ch04 16-Jun-10
or temperature changes induced by stimulation, production or injection of fluids can lead to geo-1 mechanical stress changes and these can then affect the subsequent rate of occurrence of these 2 natural phenomena. A geological risk assessment can help avoid or mitigate these hazards. 3
With respect to induced seismicity, felt ground vibrations or noise have been an environmental and 4 social issue associated with some EGS demonstration projects, particularly in populated areas (e.g. 5 Soultz in France, Basel in Switzerland [subsequently suspended] and Landau in Germany). Such 6 events have not lead to human injury or major property damage, but routine seismic monitoring is 7 used as a diagnostic tool and management and protocols have been prepared to measure, monitor, 8 and manage systems pro-actively as well as to inform the public of any hazards (Majer et al., 2008). 9 Collaborative research initiated by the IEA-GIA (Bromley and Mongillo, 2008), and in Europe 10 (GEISER, 2010), the US and Australia, is aimed at better understanding and mitigating induced 11 seismicity hazards, and providing risk-management protocols. 12
During 100 years of development, although turbines have been tripped off-line, no buildings or 13 structures within a geothermal operation or local community have been significantly damaged 14 (more than superficial cracks) by shallow earthquakes originating from either geothermal 15 production or injection activities. The process of high pressure injection of cold water into hot rock, 16 which is the preferred EGS method of stimulating fractures to enhance fluid circulation, generates 17 local stress changes which usually trigger small seismic events through hydro-fracturing or thermal 18 stress redistribution. Proper management of this issue will be an important step to facilitating 19 significant expansion of future EGS projects. 20
Hydrothermal steam eruptions have, in the past, been triggered at a few locations by shallow 21 geothermal pressure changes (both increases and decreases). Such eruptions are generally caused by 22 rapid boiling in a near-surface water body generating expansion forces that lift rock out of an 23 expanding crater. These risks can be mitigated by prudent field design and operation. 24
Land subsidence has been an issue at a few high temperature geothermal fields, particularly in New 25 Zealand. Pressure decline can affect some poorly consolidated formations (e.g. high porosity 26 mudstones or clay deposits) causing them to compact anomalously and form local subsidence 27 ‘bowls’. Management by targeted injection to maintain pressures at crucial depths and locations has 28 succeeded in minimizing subsidence effects in the Imperial Valley (US) where maintaining levels to 29 allow for irrigation drainage is important. 30
4.5.4 Benefits and impacts – economic, environmental, social 31
A potential economic benefit for geothermal power projects is the possibility to access the United 32 Nations’ Clean Development Mechanism (CDM). The CDM provides a clear, market-driven 33 valuation for the very low GHG emissions of geothermal power plants, and the revenue from 34 certified emission reductions (CER) –carbon credits generated by CDM projects– can be used to 35 reduce the price that would otherwise be charged to consumers of the electricity. The CERs, where 36 each credit represents a reduction of one tonne of CO2 or equivalent, are calculated by comparing 37 the CO2 emissions factor for the electricity generator, in tonnes per MWh, with that of the grid to 38 which the electricity will be supplied. A recent, actual example of that is the Darajat III geothermal 39 project, which was developed by a private company in Indonesia under prevailing international 40 market conditions. This project started to operate in 2007 with 110 MWe and was registered by the 41 CDM. The Darajat III plant is currently producing about 650,000 CERs per year. After factoring in 42 the uncertainties of the CER market and the risks of continued CER revenue in the post-Kyoto 43 (post-2012) period, the CDM reduces the life-cycle cost of geothermal energy by about 2 to 4% 44 (Newell and Mingst, 2009). 45

2nd Order Draft Contribution to Special Report Renewable Energy Sources (SRREN)
Do Not Cite or Quote 24 of 45 Chapter 4 SRREN_Draft2_Ch04 16-Jun-10
A good example of the environmental benefits of geothermal direct use is the city of Reykjavik, 1 Iceland, which has eliminated heating with fossil fuels, significantly reducing air pollution, and 2 avoided about 100 Mt of cumulative CO2 emissions (i.e., around 2 Mt annually) (Fridleifsson et al., 3 2008). Other examples are at Galanta in Slovakia (Fridleifsson et al., 2008), Pannonian Basin in 4 Hungary (Arpasi, 2005), and Paris Basin in France (Laplaige et al., 2005). 5
The successful realization of geothermal development projects often depends on the level of 6 acceptance by the local people. Prevention or minimization of detrimental impacts on the 7 environment, and on land occupiers, as well as the creation of benefits for local communities, is 8 indispensable to obtain social acceptance. Local people are often aware of the risks and benefits of 9 geothermal projects and of their rights to protect their environment by participating in the 10 management of resources in their territory. The necessary prerequisites to secure agreement of local 11 people are: i) Prevention of adverse effects on people’s health, ii) Minimization of environmental 12 impacts, iii) Creation of direct and ongoing benefits for the resident communities. 13
Geothermal development often creates job opportunities for locals. This can be helpful for poverty 14 alleviation in developing countries. Geothermal developments, particularly in Asian, Central and 15 South American, and African developing nations, are often located in remote mountainous areas. 16 Because drilling and plant construction must be done at the site of a geothermal resource, use of a 17 local workforce can lead to better employment opportunities. Some geothermal companies and 18 government agencies have approached social issues by improving local security, building roads, 19 schools, medical facilities and other community assets, which may be funded by contributions from 20 profits obtained from operating the power plant. 21
Multiple land-use arrangements that promote employment by integrating subsurface geothermal 22 energy extraction with labour-intensive agricultural activities are also useful. In many developing 23 countries, geothermal is also an appropriate energy source for small-scale distributed generation, 24 helping accelerate development through access to energy in remote areas. 25
4.5.5 Land use 26
Environmental impact assessments for geothermal developments consider a range of land and water 27 use impacts during both construction and operation phases that are common to most energy projects 28 (e.g. noise, vibration, dust, visual impacts, surface and ground water impacts, ecosystems, 29 biodiversity) as well as specific geothermal impacts (e.g. effects on outstanding natural features 30 such as springs, geysers and fumaroles). 31
Land use issues in many settings (e.g. Japan, the US and New Zealand) can be a serious impediment 32 to further expansion of geothermal development. National Parks, for example, have often been 33 established in remote volcanic tourist areas where new geothermal prospects also exist. Despite 34 good examples of unobtrusive, scenically-landscaped developments (e.g. Matsukawa, Japan), and 35 integrated tourism/energy developments (e.g. Wairakei, New Zealand and Blue Lagoon, Iceland), 36 land use issues still seriously constrain new development options in some countries. Potential 37 pressure and temperature interference between adjacent geothermal developers or users can be 38 another issue that affects all types of heat and fluid extraction, including heat pumps and EGS 39 power projects. Regional planning takes this into account, through appropriate simulation models, 40 when allocating permits for energy extraction. 41
Another measure of optimum land use that is relevant in some settings is the ‘footprint’ occupied by 42 geothermal installations. Table 4.7 presents the typical footprint for common conventional 43 geothermal power plants, taking into account surface installations (drilling pads, roads, pipelines, 44 fluid separators and power-stations). The subsurface resource that is accessed by directional or 45 vertical geothermal boreholes typically occupies an area equivalent to about 10 MWe/km2. 46

2nd Order Draft Contribution to Special Report Renewable Energy Sources (SRREN)
Do Not Cite or Quote 25 of 45 Chapter 4 SRREN_Draft2_Ch04 16-Jun-10
Therefore, about 95% of the land above a typical geothermal resource is not needed for surface 1 installations, and can be used for other purposes (e.g., farming, horticulture and forestry at Mokai 2 and Rotokawa in New Zealand, and a game reserve at Olkaria, Kenya). 3
Table 4.7 Land requirements for typical geothermal power generation options. 4
Land Use Type of power plant
m2/MWe m2/GWh/year
110‐MWe geothermal flash plants (excluding wells) 1260 160
56‐MWe geothermal flash plant (including wells, pipes, etc.) 7460 900
49‐MWe geothermal FC‐RC plant (excluding wells) 2290 290
20‐MWe geothermal binary plant (excluding wells) 1415 170
FC: Flash cycle, RC: Rankine cycle (Data from Tester et al., 2006). 5
4.6 Prospects for technology improvement, innovation, and integration 6
4.6.1 Technological and process challenges 7
Successful development and deployment of improved geothermal technologies will mean 8 significantly higher energy recovery, longer field lifetimes and much more widespread availability 9 of geothermal energy. Achieving that success will require sustained support and investment into 10 technology development from governments and the private sector for the next 10 to 20 years. 11
With time, better technical solutions are expected to improve power plant performance and reduce 12 maintenance down-time. More advanced approaches for resource development, including advanced 13 geophysical surveys, reinjection optimization, scaling/corrosion inhibition, and better reservoir 14 simulation modelling, will help reduce the resource risks by better matching installed capacity to 15 sustainable generation capacity. 16
While conventional, high-temperature, naturally-permeable geothermal reservoirs are profitably 17 deployed today for power production and direct uses, the success of the EGS-concept would lead to 18 widespread utilization of lower grade resources. EGS requires innovative methods for exploring, 19 stimulating and exploiting geothermal resources at any commercially viable site. Development of 20 these methods will likely improve conventional geothermal technologies. The challenges facing 21 EGS developers encompass several tracks (Tester et al., 2006): 22
1. Development of exploration technologies and strategies to reliably locate prospective EGS. 23
2. Improvement and innovation in well drilling, casing, completion and production 24 technologies for the exploration, appraisal and development of deep geothermal reservoirs 25 (as generalised in Table 4.4). 26
3. Improvement of methods to hydraulically stimulate reservoir connectivity between injection 27 and production wells to attain sustained, commercial production rates. 28
4. Development/adaptation of data management systems for interdisciplinary exploration, 29 development and production of geothermal reservoirs, and associated teaching tools to foster 30 competence and capacity amongst the people who will work in the geothermal sector. 31
5. Improvement of numerical simulators for production history matching and predicting 32 coupled thermal-hydraulic-mechanical-chemical processes during developing and 33 exploitation of reservoirs. 34
6. Improvement in assessment methods to enable reliable predictions of chemical interaction 35 between geo-fluids and geothermal reservoirs rocks, geothermal plant and geothermal 36 equipment, enabling optimised, well-, plant- and field-lifetimes. 37

2nd Order Draft Contribution to Special Report Renewable Energy Sources (SRREN)
Do Not Cite or Quote 26 of 45 Chapter 4 SRREN_Draft2_Ch04 16-Jun-10
7. Performance improvement of thermodynamic conversion cycles for a more efficient 1 utilisation of the thermal heat sources in district heating and power generation applications. 2
The required technology development would clearly reflect assessment of environmental impacts 3 including land use and induced micro-seismicity hazards or subsidence risks (see section 4.5). 4
4.6.2 Improvements in exploration technologies 5
In exploration, R&D is required for hidden geothermal systems and EGS prospects. Rapid 6 reconnaissance geothermal tools will be essential to identify new prospects, especially those with no 7 surface manifestations such as hot springs and fumaroles. Satellite-based hyper-spectral, thermal 8 infra-red, high-resolution panchromatic and radar sensors are most valuable at this stage, since they 9 can provide data inexpensively over large areas. 10
Once a regional focus area has been selected, success will depend upon the availability of cost-11 effective reconnaissance survey tools to detect as many geothermal indicators as possible. Airborne-12 based hyper-spectral, thermal infra-red, magnetic and electromagnetic sensors are valuable at this 13 stage, providing rapid coverage of the geological environment being explored, at an appropriate 14 resolution. Ground-based verification, soil sampling and geophysical surveys (magneto-telluric, 15 resistivity, gravity, seismic and/or heat flow measurements) should follow. 16
4.6.3 Accessing and engineering the reservoirs 17
Special research is needed in large diameter drilling through plastic, creeping or swelling 18 formations such as salt or shale. Abnormally high fluid pressure in such formations causes 19 abnormal stresses that differ considerably from those found in hydrostatic pressure gradients. To 20 provide long-life completion systems in ductile formations, new cementing technologies regarding 21 the geo-mechanical behaviour of plastic rock need to be defined, especially for deviated wells. 22
Drilling must minimise formation damage that occurs as a result of a complex interaction of the 23 drilling fluid (chemical, filtrate and particulate) with the reservoir fluid and formation. The 24 objectives of new-generation geothermal drilling and well construction technologies are to reduce 25 the cost and increase the useful life of geothermal production facilities through an integrated effort 26 (see Table 4.4). 27
The international Iceland Deep Drilling Project (IDDP) is a long-term program to improve the 28 efficiency and economics of geothermal energy by harnessing deep unconventional geothermal 29 resources (Fridleifsson et al., 2010). Its aim is to produce electricity from natural supercritical 30 hydrous fluids from drillable depths. Producing supercritical fluids will require drilling wells and 31 sampling fluids and rocks to depths of 3.5 to 5 km, and at temperatures of 450-600°C. 32
All tasks related to the engineering of the reservoir require sophisticated modelling of the reservoir 33 processes and interactions to be able to predict reservoir behaviour with time, to recommend 34 management strategies for prolonged field operation, and to minimize potential environmental 35 impacts. 36
In the case of EGS, reservoir stimulation procedures need to be refined to significantly enhance the 37 hydraulic productivity, while reducing the risk of seismic hazard. Imaging fluid pathways induced 38 by hydraulic stimulation treatments through innovative technology would facilitate this. New 39 visualisation and measurement methodologies (imaging of borehole, permeability tomography, 40 tracer technology, coiled tubing technology) should become available for the characterisation of the 41 reservoir. 42
2nd Order Draft Contribution to Special Report Renewable Energy Sources (SRREN)
Do Not Cite or Quote 27 of 45 Chapter 4 SRREN_Draft2_Ch04 16-Jun-10
4.6.4 Efficient production of geothermal power, heat and/or cooling 1
Technical equipment needed to provide heating/cooling and/or electricity from geothermal wells is 2 already available on the market. However, the efficiency of the different system components can 3 still be improved, especially for low-enthalpy power plant cycles, cooling systems, heat exchangers 4 and production pumps for the brine. 5
Thermodynamic cycles can be improved, and thermal heat sources utilised more efficiently, both in 6 district heating and in conversion to electrical power. For power generation, a modular low-7 temperature cycle could be set up allowing for conventional and new working fluids to be 8 examined. 9
New and cost-efficient materials are required for pipes, casing liners, pumps, heat exchangers and 10 for other components to be used in geothermal cycles to reach higher efficiencies and develop 11 cascade uses. 12
The potential development of valuable by-products may improve the economics of geothermal 13 development, such as recovery of the condensate for industrial applications after an appropriate 14 treatment, and in some cases recovery of valuable minerals from geothermal brines (such as lithium, 15 zinc, high grade silica, and in some cases gold). 16
4.7 Cost trends 17
Geothermal projects have typically high up-front capital costs (mainly due to the cost of drilling 18 wells and constructing surface power plants) and low operational costs. These operational costs 19 vary from one project to another due to size and quality of the geothermal fluids, but are relatively 20 predictable in comparison with power plants of traditional energy sources which are usually subject 21 to market fluctuations in fuel price. This section describes the capital costs of geothermal-electric 22 projects, the levelised cost of geothermal electricity and the historic and probable future trends, and 23 also presents costs for direct uses of geothermal energy. It should be noted that that the following 24 costs may have wide variations (up to 20-25%) between countries (e.g. between Indonesia, US and 25 Japan). 26
4.7.1 Costs of geothermal-electric projects and factors that affect it 27
One of the main factors affecting the cost of a geothermal-electric project is the type of project: 28 field expansion projects may cost 10-15% less than a new (greenfield) project, since investments 29 have already been made in infrastructure and exploration and valuable resource information is 30 available (learning effect) (Stefansson, 2002; Hance, 2005). 31
The cost structure of a geothermal-electric project is composed of the following components: a) 32 exploration and resource confirmation, b) drilling of production and injection wells, c) surface 33 facilities and infrastructure, and d) power plant. 34
The first component (a) includes lease acquisition, permitting, prospecting (geology and 35 geophysics) and drilling of exploration and test wells. Drilling of this type of wells has a success 36 rate typically about 50-60% (Hance, 2005), even though some sources reduce the percentage 37 success to 20-25% (GTP, 2008). Confirmation costs are affected by: well parameters (depth and 38 diameter), rock properties, well productivity, rig availability, time delays in permitting or leasing 39 land, and interest rates. This first component represents between 10 and 15% of the total capital cost 40 (capex) (Bromley et al., 2010) but for expansion projects may be as low as 1-3%. 41
Drilling of production and injection wells (component b) has a success rate of 60 to 90% (Hance, 42 2005; GTP, 2008). Factors influencing the cost include: well productivity (permeability and 43

2nd Order Draft Contribution to Special Report Renewable Energy Sources (SRREN)
Do Not Cite or Quote 28 of 45 Chapter 4 SRREN_Draft2_Ch04 16-Jun-10
temperature), well depths, rig availability, vertical or directional design, the use of air or special 1 circulation fluids, the use of special drilling bits, number of wells and financial conditions in a 2 drilling contract (Hance, 2005; Tester et al., 2006). This component (b) represents 20-35% of the 3 total capex (Bromley et al., 2010). 4
Surface facilities and infrastructure (component c) includes gathering steam and process brine, 5 separators, pumps, pipelines and roads. Vapour-dominated fields have lower facilities costs since 6 brine handling is not required. Factors affecting this component are: reservoir fluid chemistry, 7 commodity prices (steel, cement), topography, accessibility, slope stability, average well 8 productivity and distribution (pipeline diameter and length), and fluid parameters (pressure, 9 temperature, chemistry) (Hance, 2005). Surface facilities and infrastructure represent 10-20% of the 10 capex (Bromley et al., 2010). 11
The power plant (component d) includes turbines, generator, condenser, electric substation, grid 12 hook-up, steam scrubbers, and pollution abatement systems. Power plant design and construction 13 costs depend upon type (flash, back-pressure, binary, dry steam, or hybrid), as well as the type of 14 cooling cycle used (water or air cooling). Other factors affecting power plant costs are: fluid 15 enthalpy (resource temperature) and chemistry, location, cooling water availability, and the 16 economies of scale (larger size is cheaper). This component varies between 40 and 81% of the 17 capex (Hance, 2005; Bromley et al., 2010). 18
In the Table 4.8 are referred capital costs for typical geothermal-electric projects. 19
Table 4.8 Historic and current capital costs for typical turnkey (installed) geothermal-electric 20 projects (2005 US$). 21
Type of project and plant Capacity (MWe)
Year Total Capex (2005
US$/kW) References
Condensing flash plants:
1. Greenfield (New) n.s. 1997 1743 EPRI, 1997 (a)
2. Greenfield (New) n.s. 2000 1631 Kutscher, 2000 (a)
3. Greenfield (New) n.s. 2002 1143‐2114 Stefansson, 2002 (a)
4. Greenfield (New) n.s. 2003 1579‐2053 Several included in (a)
5. Greenfield (New) 25‐50 2004 2315‐2666 California Energy Commission, 2004 (a)
6. Greenfield (New) 100 2006 ~2200 Hjartarson & Einarsson, 2010
7. Greenfield (New) 50 2008 3244 Taylor, 2009 (b)
8. Greenfield (New) (worldwide average)
n.s. 2008 1778‐3556 Bromley et al., 2010.
9. Expansion project 25 2009 2486 CFE internal data.
Binary cycle plants:
10. Greenfield (New) n.s. 1997 2548 EPRI, 1997 (a)
11. Greenfield (New) n.s. 2000 2362 Kutscher, 2000 (a)
12. Greenfield (New) n.s. 2002 2274 Owens, 2002 (a)
13. Greenfield (New) n.s. 2003 1829‐2906 Several included in (a)
14. Greenfield (New) 10‐30 2004 3076‐3383 California Energy Commission, 2004 (a)
15. Greenfield (New) 20 2008 3556 GTP, 2008
16. Greenfield (New) (worldwide average)
n.s. 2008 2133‐5244 Bromley et al., 2010.
n.s.: Not specified. (a) References cited in: Hance, 2005. (b) Reference cited in: Cross and Freeman, 2009. 22

2nd Order Draft Contribution to Special Report Renewable Energy Sources (SRREN)
Do Not Cite or Quote 29 of 45 Chapter 4 SRREN_Draft2_Ch04 16-Jun-10
Labour and material costs are estimated to account for 40% each of total project construction costs. 1 Labour costs can increase by 10% when a resource is remotely located. In addition to raw materials 2 and labour, choice of power plant size is a key factor in determining the ultimate cost of a plant, but 3 the optimum size of single units on a per-MW basis varies (Dickson and Fanelli, 2003; Entingh and 4 Mines, 2006). 5
4.7.2 Levelised cost of geothermal electricity 6
The levelised cost of geothermal power corresponds to the sum of two major components: levelised 7 cost of capital investment (LCCI) and operation and maintenance costs (O&M). The LCCI 8 corresponds to the cost of the initial capital investment (i.e. site exploration and development & 9 power plant construction) and its related financial costs, divided by the total output of the facility 10 throughout the entire payback period (typically 25-30 years). Note, however, that payback period 11 allows for refurbishment or replacement of aging surface plant, but is not equivalent to economic 12 resource lifetime, which is typically more than 50 years, e.g. Larderello, Wairakei, The Geysers. In 13 most cases, the LCCI represents a major part (about 65-80%) of the levelised cost of energy 14 (LCOE) of geothermal projects. 15
Operating and maintenance (O&M) costs consist of fixed and variable costs directly related to the 16 electricity production phase. O&M per annum costs include field operation (labour and equipment), 17 well operation and work-over and facility maintenance. For geothermal plants, an additional factor 18 is the cost of make-up wells, i.e. new wells to replace failed wells and restore lost production or 19 injection capacity. Make-up wells can be considered equivalent to O&M costs since the purpose of 20 make-up drilling is to maintain the full production capacity of the power plants (Hance, 2005). 21 Costs of these wells are typically lower than those for the original wells, and their success rate is 22 higher. Make-up drilling typically increases with time, but if distributed across the economic 23 lifetime of a development, its cost, on average, amounts to an increase of about 30% in O&M costs 24 per MWh. 25
Geothermal-electric O&M costs, including make-up wells, have been calculated for the US to be 26 between 18.5 and 22.6 US$/MWh (Lovekin, 2000; Owen, 2002), and Hance (2005) proposed an 27 average cost of 24.6 US$/MWh. Current O&M costs are ranged between 152 and 187 US$/kW per 28 year, and then with an annual capacity factor of 71% (current worldwide average) those costs vary 29 between 24.4 and 30.0 US$/MWh, but with an annual capacity factor of 90% can be as low as 19.3 30 and 23.7 US$/MWh. In other countries, O&M costs can be significantly lower than these figures. 31 For example, in New Zealand operating experience shows that total costs are 10-14 US$/MWh for 32 20-50 MWe plant capacity (Barnett and Quinlivan, 2009). 33
Current LCOE (i.e., including LCCI and O&M costs) in 2005 US$/MWh for some of the typical 34 geothermal-electric plants listed in Table 4.8 were calculated according to the methodology 35 described in Chapter 1 [TSU: Annex II], using version 6 of the calculator developed by Verbruggen 36 and Nyboer (2009), and are presented in Figure 4.6. In all cases the project lifetime was calculated 37 to be 25 years and the capacity factor (plant performance) was 80%, which is the expected for new 38 projects. For greenfield projects it was estimated that the plant starts to operate at the beginning of 39 the fifth year after exploration starts, and for expansion projects the plant is commissioned by the 40 third year. “Average flash” is the current worldwide average for greenfield projects and flash plants, 41 and correspond to the middle value of the Case 8 rank in Table 4.8 (2667 US$/kWe); it was 42 considered a plant of 100 MWe. “Average binary” is the correspondent middle value for binary 43 plants in Case 16 in Table 4.7 (capex 3689 US$/kWe), considering a plant of 10 MWe. 44
There are significant variations in LCOE depending on the discount rate used, yet in general terms 45 the LCOE for flash plants in high temperature fields is lower than for binary cycle plants in low to 46
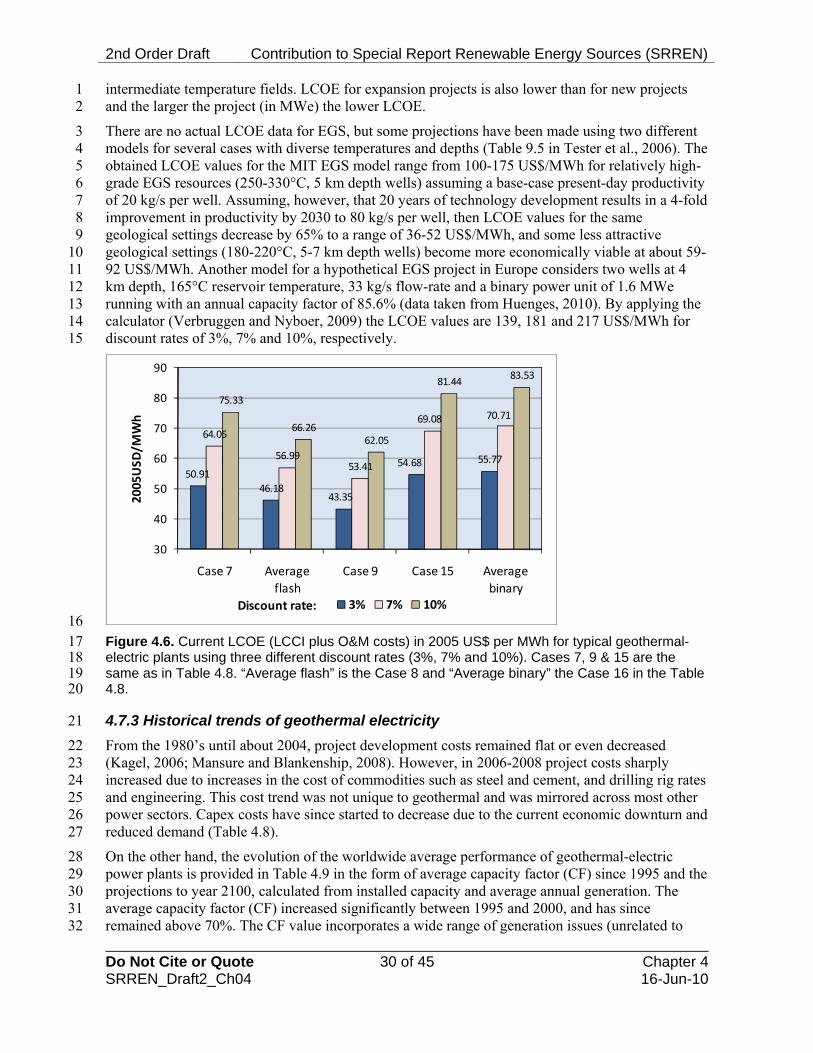
2nd Order Draft Contribution to Special Report Renewable Energy Sources (SRREN)
Do Not Cite or Quote 30 of 45 Chapter 4 SRREN_Draft2_Ch04 16-Jun-10
intermediate temperature fields. LCOE for expansion projects is also lower than for new projects 1 and the larger the project (in MWe) the lower LCOE. 2
There are no actual LCOE data for EGS, but some projections have been made using two different 3 models for several cases with diverse temperatures and depths (Table 9.5 in Tester et al., 2006). The 4 obtained LCOE values for the MIT EGS model range from 100-175 US$/MWh for relatively high- 5 grade EGS resources (250-330°C, 5 km depth wells) assuming a base-case present-day productivity 6 of 20 kg/s per well. Assuming, however, that 20 years of technology development results in a 4-fold 7 improvement in productivity by 2030 to 80 kg/s per well, then LCOE values for the same 8 geological settings decrease by 65% to a range of 36-52 US$/MWh, and some less attractive 9 geological settings (180-220°C, 5-7 km depth wells) become more economically viable at about 59-10 92 US$/MWh. Another model for a hypothetical EGS project in Europe considers two wells at 4 11 km depth, 165°C reservoir temperature, 33 kg/s flow-rate and a binary power unit of 1.6 MWe 12 running with an annual capacity factor of 85.6% (data taken from Huenges, 2010). By applying the 13 calculator (Verbruggen and Nyboer, 2009) the LCOE values are 139, 181 and 217 US$/MWh for 14 discount rates of 3%, 7% and 10%, respectively. 15
50.91
46.1843.35
54.68 55.77
64.05
56.9953.41
69.08 70.71
75.33
66.2662.05
81.4483.53
30
40
50
60
70
80
90
Case 7 Average
flash
Case 9 Case 15 Average
binary
2005USD
/MWh
3% 7% 10%Discount rate: 16
Figure 4.6. Current LCOE (LCCI plus O&M costs) in 2005 US$ per MWh for typical geothermal-17 electric plants using three different discount rates (3%, 7% and 10%). Cases 7, 9 & 15 are the 18 same as in Table 4.8. “Average flash” is the Case 8 and “Average binary” the Case 16 in the Table 19 4.8. 20
4.7.3 Historical trends of geothermal electricity 21
From the 1980’s until about 2004, project development costs remained flat or even decreased 22 (Kagel, 2006; Mansure and Blankenship, 2008). However, in 2006-2008 project costs sharply 23 increased due to increases in the cost of commodities such as steel and cement, and drilling rig rates 24 and engineering. This cost trend was not unique to geothermal and was mirrored across most other 25 power sectors. Capex costs have since started to decrease due to the current economic downturn and 26 reduced demand (Table 4.8). 27
On the other hand, the evolution of the worldwide average performance of geothermal-electric 28 power plants is provided in Table 4.9 in the form of average capacity factor (CF) since 1995 and the 29 projections to year 2100, calculated from installed capacity and average annual generation. The 30 average capacity factor (CF) increased significantly between 1995 and 2000, and has since 31 remained above 70%. The CF value incorporates a wide range of generation issues (unrelated to 32

2nd Order Draft Contribution to Special Report Renewable Energy Sources (SRREN)
Do Not Cite or Quote 31 of 45 Chapter 4 SRREN_Draft2_Ch04 16-Jun-10
resource availability), including: grid connection failures (e.g. from storm damage), load following 1 on smaller grids, and turbine failures. (Some operating geothermal turbines have exceeded their 2 economic lifetime, so require longer periods of shut-down for maintenance or replacement.) 3 Furthermore, a lack of make-up drilling to sustain long-term steam supply is sometimes due to 4 financial constraints. Also, a substantial number of new power plants started during 2009, but their 5 generation contributed for only part of the year. 6
Table 4.9 World installed capacity, electricity production and capacity factor of geothermal power 7 plants 1995-2010 and forecasts for 2015-2050 (adapted from data from Bertani, 2010). 8
Year Installed Capacity (GWe) actual or mean forecast
Electricity Production (GWh/y) Actual or mean forecast
Capacity Factor (%)
1995 6.8 38,035 64 2000 8.0 49,261 71 2005 8.9 56,786 73 2010 10.7 67,246 71 2015 18.5 121,600 75 2020 25.9 181,800 80 2030 51.0 380,000 85 2040 90.5 698,000 88 2050 160.6 1,266,400 90
Therefore, by projecting a further increase in CF, and assuming no such grid or load constraints for 9 new developments, long-term CF of 80% to 95% can be expected (Fridleifsson et al., 2008). 10 Several geothermal power plants are currently operating at CF of 90% and more. 11
4.7.4 Future costs trends 12
The future costs for geothermal electricity are likely to encompass a wide range because future 13 deployment will probably include an increasing percentage of unconventional development types 14 (such as EGS), which are currently in commercial demonstration mode and only limited cost data 15 are presently available. However, considering the projected average capacity factor shown in Table 16 4.9 by 2020, 2030 and 2050, future LCOE for the cases before mentioned were calculated using the 17 same calculator developed by Verbruggen and Nyboer (2009). The results are shown in Figure 4.7 18 using a discount rate of 7%, as used for all RE future cost trends in this report. 19
Some assumptions remained the same: the commissioning year for greenfield projects is the fifth 20 year after exploration starts, while for expansion projects it is in the third year. However, the project 21 lifetime was considered 27 years, considering improvements in materials, operation and 22 maintenance and the fact that some actual plants currently in operation have achieved that lifetime. 23 Figures for 2009 are those already presented in Figure 4.6. For 2020 it was assumed that the drilling 24 cost (which represents between 20 and 45% of total capital costs) does not change but by 2030 this 25 cost was estimated to be 7% lower and by 2050 15% lower than present costs, in all cases at 2005 26 US$. These decreasing costs are expected to occur due to better technologic practices in the drilling 27 industry and to competition resulting from a greater availability of drilling rigs. Worldwide average 28 capacity factor for 2020, 2030 and 2050 was assumed to be 80%, 85% and 90%, respectively, 29 according to Table 4.9. All the remaining aspects and costs were considered, on balance, to be 30 unchanging. Improvements in exploration, surface installations, materials and power plants are 31 likely, and should lead to reduced costs, but these are expected to balance against increased 32 commodity costs (especially steel and cement). 33
LCOE costs are therefore expected to decrease in an average of 1.7% by 2020, 8.5% by 2030 and 34 14.7% by 2050 (Fig. 4.7). 35
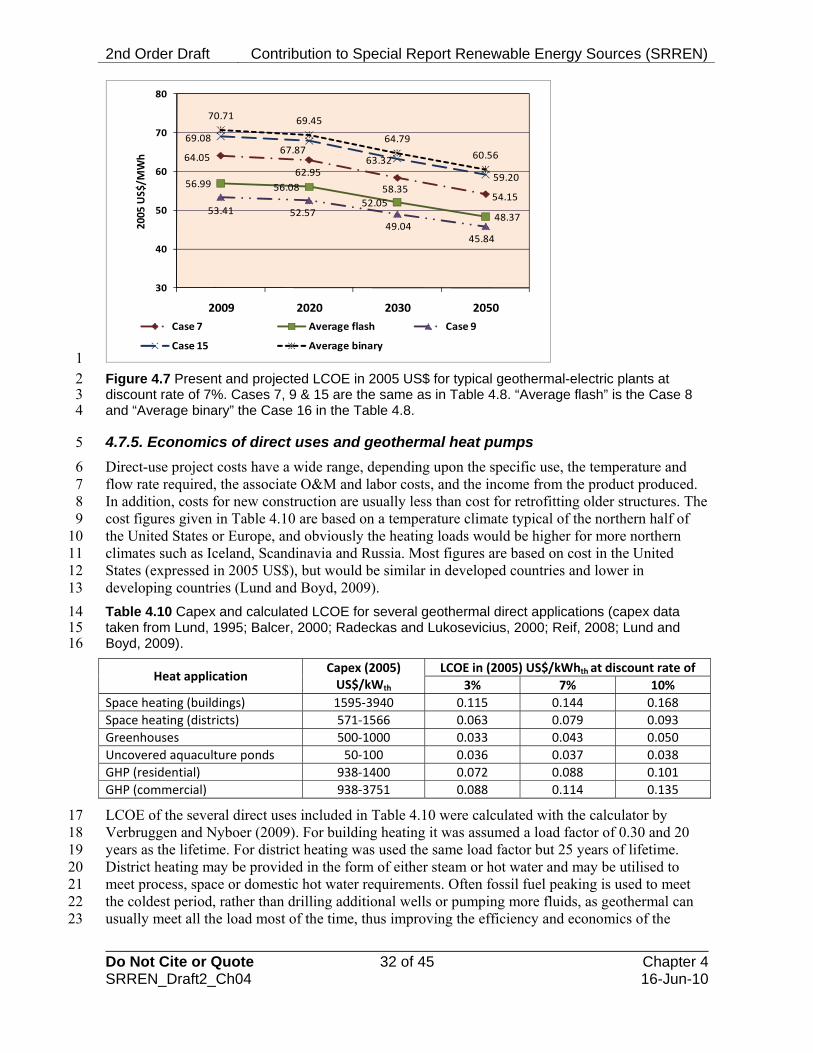
2nd Order Draft Contribution to Special Report Renewable Energy Sources (SRREN)
Do Not Cite or Quote 32 of 45 Chapter 4 SRREN_Draft2_Ch04 16-Jun-10
64.05
62.95
58.3554.15
56.99 56.08
52.05
48.3753.41 52.57
49.0445.84
69.0867.87
63.32
59.20
70.71 69.45
64.79
60.56
30
40
50
60
70
80
2009 2020 2030 2050
2005
US$/M
Wh
Case 7 Average flash Case 9
Case 15 Average binary 1
Figure 4.7 Present and projected LCOE in 2005 US$ for typical geothermal-electric plants at 2 discount rate of 7%. Cases 7, 9 & 15 are the same as in Table 4.8. “Average flash” is the Case 8 3 and “Average binary” the Case 16 in the Table 4.8. 4
4.7.5. Economics of direct uses and geothermal heat pumps 5
Direct-use project costs have a wide range, depending upon the specific use, the temperature and 6 flow rate required, the associate O&M and labor costs, and the income from the product produced. 7 In addition, costs for new construction are usually less than cost for retrofitting older structures. The 8 cost figures given in Table 4.10 are based on a temperature climate typical of the northern half of 9 the United States or Europe, and obviously the heating loads would be higher for more northern 10 climates such as Iceland, Scandinavia and Russia. Most figures are based on cost in the United 11 States (expressed in 2005 US$), but would be similar in developed countries and lower in 12 developing countries (Lund and Boyd, 2009). 13
Table 4.10 Capex and calculated LCOE for several geothermal direct applications (capex data 14 taken from Lund, 1995; Balcer, 2000; Radeckas and Lukosevicius, 2000; Reif, 2008; Lund and 15 Boyd, 2009). 16
LCOE in (2005) US$/kWhth at discount rate of Heat application Capex (2005) US$/kWth 3% 7% 10%
Space heating (buildings) 1595‐3940 0.115 0.144 0.168
Space heating (districts) 571‐1566 0.063 0.079 0.093
Greenhouses 500‐1000 0.033 0.043 0.050
Uncovered aquaculture ponds 50‐100 0.036 0.037 0.038
GHP (residential) 938‐1400 0.072 0.088 0.101
GHP (commercial) 938‐3751 0.088 0.114 0.135
LCOE of the several direct uses included in Table 4.10 were calculated with the calculator by 17 Verbruggen and Nyboer (2009). For building heating it was assumed a load factor of 0.30 and 20 18 years as the lifetime. For district heating was used the same load factor but 25 years of lifetime. 19 District heating may be provided in the form of either steam or hot water and may be utilised to 20 meet process, space or domestic hot water requirements. Often fossil fuel peaking is used to meet 21 the coldest period, rather than drilling additional wells or pumping more fluids, as geothermal can 22 usually meet all the load most of the time, thus improving the efficiency and economics of the 23

2nd Order Draft Contribution to Special Report Renewable Energy Sources (SRREN)
Do Not Cite or Quote 33 of 45 Chapter 4 SRREN_Draft2_Ch04 16-Jun-10
system (Bloomquist et al., 1987). Thermal load density (heating load per unit of land areas) is 1 critical to the feasibility of district heating because it is one of the major determinants of the 2 distribution network capital and operating costs. Thus, downtown, high rise buildings are better 3 candidates than single family residential area. Generally a thermal load density about 1.2 x 10⁹ 4 J/hr/ha is recommended. 5
For LCOE calculation of greenhouses it was assumed a load factor of 0.50 and for aquaculture 6 ponds and tanks of 0.60, with the same lifespan of 20 years. Covered ponds and tanks would have 7 higher capital cost than uncovered, but lower heating requirements. 8
Geothermal (ground-source) heat pump projects costs vary between residential installation and 9 commercial/institutional installations, as the larger the building to be heated and/or cooled, the 10 lower the unit (US$/kWt) investment and operating costs. In addition, the type of installation, 11 closed loop (horizontal or vertical) or open loop using ground water, has a large influence on the 12 installed cost (Lund and Boyd, 2009). The LCOE reported in Table 4.10 assumed 0.30 as load 13 factor and 20 years as operational lifetime. 14
Industrial applications are more difficult to quantify, as they vary widely depending upon the 15 energy requirements and the product to be produced. These plants normally require higher 16 temperatures and often compete with power plant use; however, they do have a high load factor of 17 0.40 to 0.70, which improves the economics. Industrial applications vary from large food, timber 18 and mineral drying plants (US and New Zealand) to pulp and paper plant (New Zealand). As an 19 example, a large onion dehydration plant in the US (Nevada) uses 210 x 1012 J/year for drying 4500 20 kg/hour of wet onions over a 250 day period. This plant cost MUS$ 12.5 with the geothermal 21 system, including wells adding MUS$ 3.37. The annual operation cost is MUS$ 5.63 and annual 22 energy savings of MUS$ 1.5. With annual sales of MUS$ 5.63, a positive cash flow is realised in 23 about two years (Lund, 1995). 24
4.8 Potential Deployment 25
Geothermal energy can contribute to near- and long-term carbon emissions reduction. In 2008 the 26 worldwide geothermal-electric generation was 67.2 TWhe (Sections 4.4.1 and 4.7.3) and the heat 27 generation from geothermal direct-uses was 121.7 TWht (Section 4.4.3). These amounts of energy 28 are equivalent to 0.24 and 0.44 EJ/y, respectively, for a total of 0.68 EJ/y (direct equivalent 29 method). This represents only ~0.13% of the global primary energy demand in 2007. However, on a 30 global basis, by 2050 geothermal could supply 2.5-4.1% of the global electricity demand and almost 31 5% of the global demand of heat-cooling, as it is shown in section 4.8.2. 32
This section starts by presenting the near-term (2015) global and regional deployments expected for 33 geothermal energy (electricity and heat) based on current geothermal-electric projects under 34 construction or planned, observed historic growth rates, as well as the forecast generation of 35 electricity and heat. Subsequently, this section presents the long-term (2020, 2030, 2050) global and 36 regional deployments comparing it to the IPCC AR4 estimate, includes results from scenarios 37 provided by Chapter 10 of this report, and discusses their feasibility in terms of technical potential, 38 regional conditions, supply chain aspects, technological-economic conditions, integration-39 transmission issues and environmental and social concerns. Finally, the section presents a short 40 conclusion regarding the potential deployment. 41
4.8.1 Near-term forecasts 42
Historic growth rates of geothermal-electric capacity in the world over the past 40 years were 43 presented in Table 4.5, as well as the growth rates of geothermal direct uses (heat) in the last 35 44 years. For power, the historic average annual rate is 7.0% and for direct uses 11%. 45
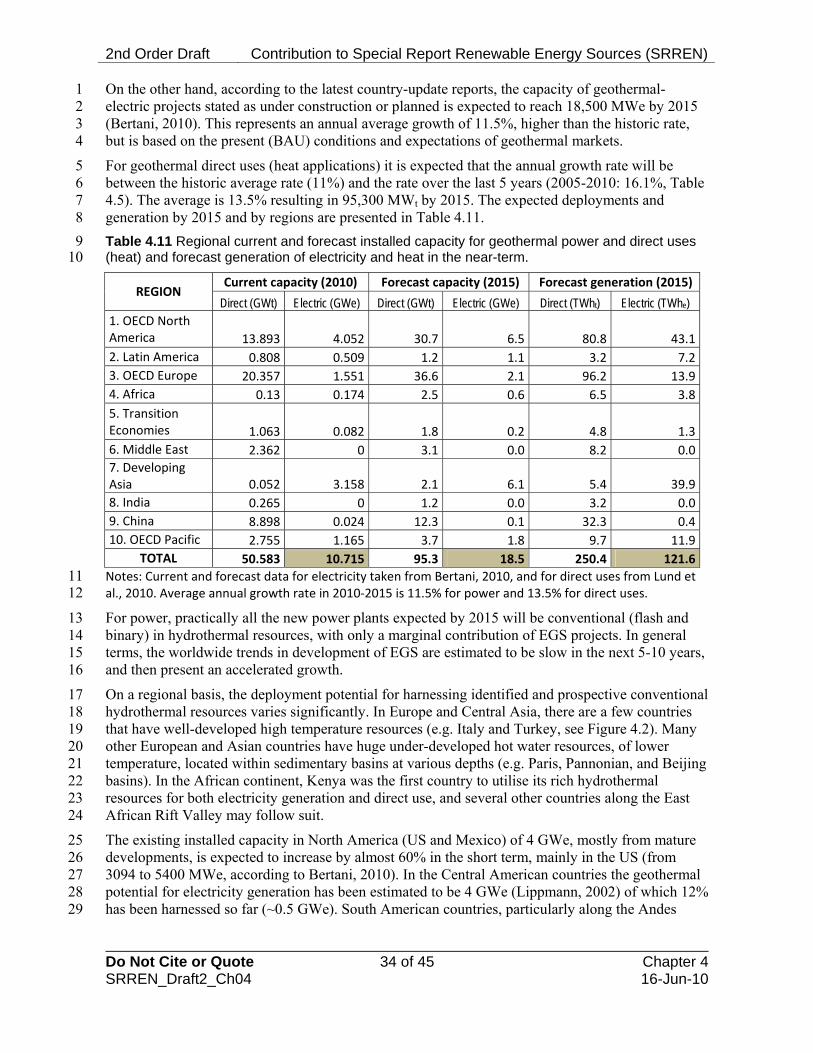
2nd Order Draft Contribution to Special Report Renewable Energy Sources (SRREN)
Do Not Cite or Quote 34 of 45 Chapter 4 SRREN_Draft2_Ch04 16-Jun-10
On the other hand, according to the latest country-update reports, the capacity of geothermal-1 electric projects stated as under construction or planned is expected to reach 18,500 MWe by 2015 2 (Bertani, 2010). This represents an annual average growth of 11.5%, higher than the historic rate, 3 but is based on the present (BAU) conditions and expectations of geothermal markets. 4
For geothermal direct uses (heat applications) it is expected that the annual growth rate will be 5 between the historic average rate (11%) and the rate over the last 5 years (2005-2010: 16.1%, Table 6 4.5). The average is 13.5% resulting in 95,300 MWt by 2015. The expected deployments and 7 generation by 2015 and by regions are presented in Table 4.11. 8
Table 4.11 Regional current and forecast installed capacity for geothermal power and direct uses 9 (heat) and forecast generation of electricity and heat in the near-term. 10
Current capacity (2010) Forecast capacity (2015) Forecast generation (2015) REGION
Direct (GWt) Electric (GWe) Direct (GWt) Electric (GWe) Direct (TWht) Electric (TWhe) 1. OECD North America 13.893 4.052 30.7 6.5 80.8 43.1
2. Latin America 0.808 0.509 1.2 1.1 3.2 7.2
3. OECD Europe 20.357 1.551 36.6 2.1 96.2 13.9
4. Africa 0.13 0.174 2.5 0.6 6.5 3.8
5. Transition Economies 1.063 0.082 1.8 0.2 4.8 1.3
6. Middle East 2.362 0 3.1 0.0 8.2 0.0
7. Developing Asia 0.052 3.158 2.1 6.1 5.4 39.9
8. India 0.265 0 1.2 0.0 3.2 0.0
9. China 8.898 0.024 12.3 0.1 32.3 0.4
10. OECD Pacific 2.755 1.165 3.7 1.8 9.7 11.9
TOTAL 50.583 10.715 95.3 18.5 250.4 121.6
Notes: Current and forecast data for electricity taken from Bertani, 2010, and for direct uses from Lund et 11 al., 2010. Average annual growth rate in 2010‐2015 is 11.5% for power and 13.5% for direct uses. 12
For power, practically all the new power plants expected by 2015 will be conventional (flash and 13 binary) in hydrothermal resources, with only a marginal contribution of EGS projects. In general 14 terms, the worldwide trends in development of EGS are estimated to be slow in the next 5-10 years, 15 and then present an accelerated growth. 16
On a regional basis, the deployment potential for harnessing identified and prospective conventional 17 hydrothermal resources varies significantly. In Europe and Central Asia, there are a few countries 18 that have well-developed high temperature resources (e.g. Italy and Turkey, see Figure 4.2). Many 19 other European and Asian countries have huge under-developed hot water resources, of lower 20 temperature, located within sedimentary basins at various depths (e.g. Paris, Pannonian, and Beijing 21 basins). In the African continent, Kenya was the first country to utilise its rich hydrothermal 22 resources for both electricity generation and direct use, and several other countries along the East 23 African Rift Valley may follow suit. 24
The existing installed capacity in North America (US and Mexico) of 4 GWe, mostly from mature 25 developments, is expected to increase by almost 60% in the short term, mainly in the US (from 26 3094 to 5400 MWe, according to Bertani, 2010). In the Central American countries the geothermal 27 potential for electricity generation has been estimated to be 4 GWe (Lippmann, 2002) of which 12% 28 has been harnessed so far (~0.5 GWe). South American countries, particularly along the Andes 29
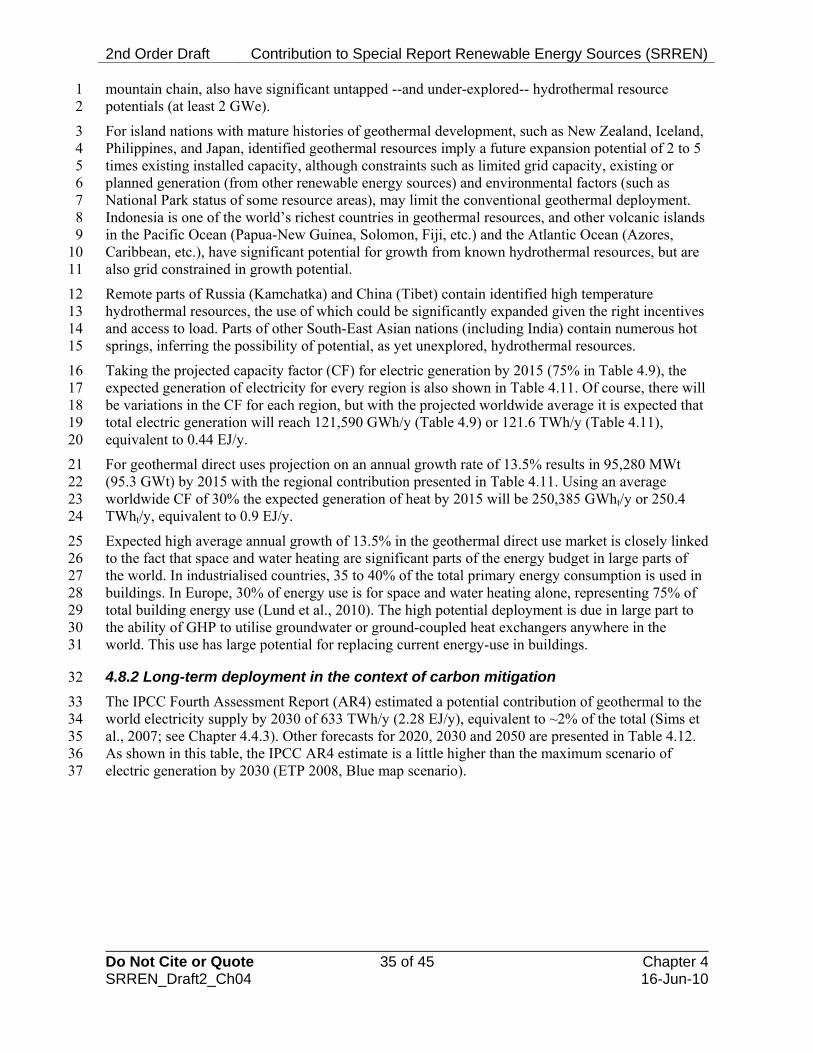
2nd Order Draft Contribution to Special Report Renewable Energy Sources (SRREN)
Do Not Cite or Quote 35 of 45 Chapter 4 SRREN_Draft2_Ch04 16-Jun-10
mountain chain, also have significant untapped --and under-explored-- hydrothermal resource 1 potentials (at least 2 GWe). 2
For island nations with mature histories of geothermal development, such as New Zealand, Iceland, 3 Philippines, and Japan, identified geothermal resources imply a future expansion potential of 2 to 5 4 times existing installed capacity, although constraints such as limited grid capacity, existing or 5 planned generation (from other renewable energy sources) and environmental factors (such as 6 National Park status of some resource areas), may limit the conventional geothermal deployment. 7 Indonesia is one of the world’s richest countries in geothermal resources, and other volcanic islands 8 in the Pacific Ocean (Papua-New Guinea, Solomon, Fiji, etc.) and the Atlantic Ocean (Azores, 9 Caribbean, etc.), have significant potential for growth from known hydrothermal resources, but are 10 also grid constrained in growth potential. 11
Remote parts of Russia (Kamchatka) and China (Tibet) contain identified high temperature 12 hydrothermal resources, the use of which could be significantly expanded given the right incentives 13 and access to load. Parts of other South-East Asian nations (including India) contain numerous hot 14 springs, inferring the possibility of potential, as yet unexplored, hydrothermal resources. 15
Taking the projected capacity factor (CF) for electric generation by 2015 (75% in Table 4.9), the 16 expected generation of electricity for every region is also shown in Table 4.11. Of course, there will 17 be variations in the CF for each region, but with the projected worldwide average it is expected that 18 total electric generation will reach 121,590 GWh/y (Table 4.9) or 121.6 TWh/y (Table 4.11), 19 equivalent to 0.44 EJ/y. 20
For geothermal direct uses projection on an annual growth rate of 13.5% results in 95,280 MWt 21 (95.3 GWt) by 2015 with the regional contribution presented in Table 4.11. Using an average 22 worldwide CF of 30% the expected generation of heat by 2015 will be 250,385 GWht/y or 250.4 23 TWht/y, equivalent to 0.9 EJ/y. 24
Expected high average annual growth of 13.5% in the geothermal direct use market is closely linked 25 to the fact that space and water heating are significant parts of the energy budget in large parts of 26 the world. In industrialised countries, 35 to 40% of the total primary energy consumption is used in 27 buildings. In Europe, 30% of energy use is for space and water heating alone, representing 75% of 28 total building energy use (Lund et al., 2010). The high potential deployment is due in large part to 29 the ability of GHP to utilise groundwater or ground-coupled heat exchangers anywhere in the 30 world. This use has large potential for replacing current energy-use in buildings. 31
4.8.2 Long-term deployment in the context of carbon mitigation 32
The IPCC Fourth Assessment Report (AR4) estimated a potential contribution of geothermal to the 33 world electricity supply by 2030 of 633 TWh/y (2.28 EJ/y), equivalent to ~2% of the total (Sims et 34 al., 2007; see Chapter 4.4.3). Other forecasts for 2020, 2030 and 2050 are presented in Table 4.12. 35 As shown in this table, the IPCC AR4 estimate is a little higher than the maximum scenario of 36 electric generation by 2030 (ETP 2008, Blue map scenario). 37

2nd Order Draft Contribution to Special Report Renewable Energy Sources (SRREN)
Do Not Cite or Quote 36 of 45 Chapter 4 SRREN_Draft2_Ch04 16-Jun-10
Table 4.12 Available scenarios of geothermal-electric installed capacity and generation of 1 electricity in the long-term. 2
Forecast installed capacity (GWe) Forecast electric generation (TWh/y) Year
Min Mid Max Min Mid Max
2020 (Reference) 19 (a) 33 (b) 57 (c) 128 (a) 231 (b) 392 (c)
2030 (Reference) 28 (a) 71 (b) 87 (c) 199 (a) 488 (b) 611 (c)
2050 (Reference) 38 (d) 134 (e) 152 (c) 264 (d) 934 (e) 1059 (c)
References: (a): IEA‐WEO 08 (550 ppm policy scenario), (b): EREC‐GPI 08, (c): ETP 2008 (Blue map scenario); 3 (d): ETP 2008 (Base scenario); (e): ETP 2008 (ACT scenario). 4
A number of different scenarios with the contribution of geothermal resources have been modelled 5 from the integrated assessment models presented in Chapter 10 of this report, taking into account 6 the stabilization categories of CO2 emissions regarded by the IPCC AR4 and grouping them into 7 three: categories I+II (300-440 ppm), III+IV (440-600 ppm) and V+VI (600-1000 ppm). Results are 8 presented in Figure 4.8; Primary Energy is provided as direct-equivalent, i.e. each unit of heat or 9 electricity from RE (except from biomass) is accounted for as one unit at the primary energy level. 10
Projections of geothermal energy contribution to the global primary energy supply span a very 11 broad range: up to 11.9 EJ/y in 2020, 21.3 EJ/y in 2030 and 50.1 EJ/y in 2050, taking the more 12 stringent carbon mitigation policies (300-440 ppm in all years), and are sensitive to the carbon 13 policy assumed by each projected year. Medians of all those scenarios are also sensitive to the 14 carbon policy, ranging 0.39-0.68 EJ/y by 2020, 0.22-1.2 EJ/y by 2030 and 1.09-3.85 EJ/y by 2050, 15 in all cases considering the baseline (600-1000 ppm) and the 300-440 ppm scenarios (Fig. 4.8). 16
2020 2020 2020 2030 2030 2030 2050 2050 2050
01
02
03
04
05
0
Primary Energy: Geothermal
EJ
600-1000 ppm (Baselines)440-600 ppm (Cat III + IV)300-440 ppm (Cat I + II)
17 Figure 4.8 Primary energy from geothermal resources in the context of carbon mitigation for 2020, 18 2030 and 2050. Thick black line is the median, the coloured box corresponds to interquantile range 19 25th-75th percentile, and whiskers correspond to the total range across all scenarios. [TSU: 20 adapted from Krey and Clarke, 2010 (source will have to be included in reference list); see also 21 Chapter 10.2] 22

2nd Order Draft Contribution to Special Report Renewable Energy Sources (SRREN)
Do Not Cite or Quote 37 of 45 Chapter 4 SRREN_Draft2_Ch04 16-Jun-10
These amounts are not completely comparable with the IPCC AR4 estimate by 2030, since this 1 included only geothermal-electric generation without reference to the geothermal contribution for 2 heat supply. But even so, it is clear that the 2.28 EJ/y of electric generation estimated by the IPCC 3 AR4 by 2030 results well above the medians considered by 2030, but lies in the 25-75% percentile 4 for the more restricted scenario (Fig. 4.8). 5
Based on the current geothermal-electric and direct uses installed capacity and the near-term 6 projections presented in Table 4.11, the long-term regional deployments presented in Table 4.13 7 were obtained. For electric power deployment, it was assumed that the average annual rate growth 8 for 2015-2030 will be the historic rate (7%), and for 2030-2050 an annual rate growth of 5.9% is 9 expected. Both rates are lower than the near-term rate (2010-2015) of 11.5%. All of these forecasts 10 include EGS projects deployment. 11
For direct uses deployment, the assumed average annual rate growths were: 11% for 2015-2020 12 (historic rate, see Table 4.5), 9% for 2020-2030, 5.5% for 2030-2040 and 2.5% for 2040-2050, 13 reflecting an expected decrease in the average annual rate of growth. 14
Table 4.13 Regional long term forecasts of installed capacity for geothermal power and direct uses 15 (heat) and global forecast of electric and direct uses (heat) generation. 16
2020 2030 2050 REGION
Direct (GWt) Electric (GWe) Direct (GWt) Electric (GWe) Direct (GWt) Electric (GWe) 1. OECD North America 51.8 9.2 121.6 16.7 234.5 45.4
2. Latin America 2.1 1.5 5.1 3.0 10.2 8.5
3. OECD Europe 62.2 3.0 151.0 5.8 305.9 25.3
4. Africa 4.1 0.8 11.1 1.6 18.4 7.0
5. Transition Economies 3.1 0.3 5.1 0.6 10.2 4.8
6. Middle East 4.1 0.0 5.2 0.1 7.1 2.2
7. Developing Asia 4.2 8.5 10.0 15.3 20.4 35.2
8. India 2.1 0.0 5.1 0.2 10.2 2.8
9. China 20.7 0.1 50.7 2.8 127.5 13.7
10. OECD Pacific 6.2 2.5 15.2 5.0 86.7 15.7
TOTAL 160.5 25.9 380.1 51.0 831.1 160.6
TWht/y TWhe/y TWht/y TWhe/y TWht/y TWhe/y
421.9 181.8 998.8 380.0 2184.0 1266.4
EJ/y EJ/y EJ/y EJ/y EJ/y EJ/y
Expected global generation (thermal and electric) in: 1.52 0.65 3.60 1.37 7.86 4.56
Comparing the global forecasts for electric power with those presented in Table 4.12, one can see 17 they are located between the minimum and medium estimates for 2020 and 2030, but are higher 18 than the maximum estimates for 2050. For 2030, the projected electric generation (380 TWh/y or 19 1.37 EJ/y) is lower than the IPCC AR4 estimate of 633 TWh/y or 2.28 EJ/y. 20
Considering that the world electricity demand is projected to be between 25,743 (IEA-WEO 08) 21 and 27,708 TWh/y (EREC-GPI 08) by 2020, geothermal would share around 0.7%of the total. For 22 2030 projections go from 28,997 to 33,265 TWh/y (IEA-WEO 08), and thus geothermal would 23 share between 1.1% and 1.3% of the total electric demand. For 2050 estimates are between 30,814 24
2nd Order Draft Contribution to Special Report Renewable Energy Sources (SRREN)
Do Not Cite or Quote 38 of 45 Chapter 4 SRREN_Draft2_Ch04 16-Jun-10
(EREC-GPI 08) and 50,606 TWh/y (IEA-WEO 08), and then geothermal electricity would 1 contribute with 2.5%-4.1% of the global electricity demand. 2
On the other hand, ERC-GPI 08 projects the global demand of heating-cooling by 2020 to be 156.8 3 EJ/y, by 2030 to be 162.4 EJ/y and by 2050 to be 161.7 EJ/y. Then, geothermal generation of heat 4 by direct applications would supply about 1% of the total demand by 2020, 2.2% by 2030, and 5 4.9% by 2050. 6
According to the estimates in Table 4.13, total contribution (thermal and electric) of geothermal 7 energy would be 2.17 EJ/y by 2020, 4.97 EJ/y by 2030, and 12.42 EJ/y by 2050. Considering each 8 unit of heat or electricity accounted for as one unit at the primary energy level, these estimates are 9 placed in the 75th-100th percentile of the Figure 4.8. Therefore, the estimates included in that figure 10 in the 25th-75th percentile, including the mean, are feasible for 2020, 2030 and 2050. 11
To achieve the potential deployments presented in Table 4.13 and even the more conservative 12 deployments shown by Fig. 4.8, economic incentive policies to reduce GHG emissions and increase 13 RE will probably be necessary. Policy support for research and development would assist some 14 geothermal technologies to demonstrate and commercialise EGS and other non-conventional 15 geothermal resource development. This policy support could include subsidies, guarantees and tax 16 write-offs to cover the risks of initial deep drilling and long term productivity. Feed-in tariffs with 17 confirmed geothermal prices, and direct subsidies for district and building heating would also help 18 to accelerate deployment. In addition, the following issues are worth to be highlighted. 19
Resource potential: Even the highest estimates for long-term contribution of geothermal energy to 20 the global primary energy supply (50.1 EJ/y by 2050, Fig. 4.8), are well within the technical 21 potentials described in section 4.2 (91 up to 1043 EJ/y for electricity and 10 up to 322 EJ/y for heat, 22 Fig. 4.1). Thus, technical resource potential is not likely to be a barrier to reach the most aggressive 23 levels of geothermal deployment (electricity and direct uses) in a global or regional basis. 24
Regional deployment: Forecast long-term (2020, 2030 and 2050) deployments for the IEA regions 25 are presented in Table 4.13. The worldwide average annual rates of growth estimated for electricity 26 deployment and for direct uses deployments are not the same for every region. Availability of 27 financing, water, transmission and distribution infrastructure and other factors will play major roles 28 in regional deployment rates. For instance, in the US, Australia, and Europe, EGS concepts are 29 already being field tested and deployed, providing advantages for accelerated deployment in those 30 regions as risks and uncertainties are reduced. In other rapidly developing regions in Asia, Africa, 31 and South America, factors that would affect deployment are population density, market distance, 32 electricity and heating and cooling demand. 33
Supply chain issues: Regional differences in technology development (for instance, deep drilling 34 and reservoir management) may affect the adequate supply of labour and materials for geothermal 35 deployment, but no relevant middle- or long-term constraints to materials supply, labour availability 36 or manufacturing capacity are foreseen from a global perspective. 37
Technology and economics: Direct heating technologies using GHP, district heating and EGS 38 methods are available, with different degrees of maturity. GHP systems have the widest market 39 penetration, and an increased deployment will be supported by improving the coefficient of 40 performance and installation efficiency. The direct use of thermal fluids from deep aquifers, and 41 heat extraction using EGS, can be increased by further technical advances associated with accessing 42 and engineering fractures in the geothermal reservoirs. Reducing sub-surface exploration risks will 43 contribute to more efficient and sustainable development. Better reservoir management will 44 optimize reinjection strategy, avoid excessive depletion, and plan future make-up well 45 requirements, to achieve sustainable production. Improvement in energy utilisation efficiency from 46

2nd Order Draft Contribution to Special Report Renewable Energy Sources (SRREN)
Do Not Cite or Quote 39 of 45 Chapter 4 SRREN_Draft2_Ch04 16-Jun-10
cascaded use of geothermal heat is an important deployment strategy. Evaluating the performance 1 of geothermal plants, including heat and power EGS installations, will consider heat quality of the 2 fluid by differentiating between the energy and the exergy or availability content (that part of the 3 energy that can be converted to electric power). All of these technological improvements will lead 4 to significantly reduce the capital costs and the LCOE of geothermal energy. 5
Integration and transmission: Due to the site-specific geographic location of conventional 6 hydrothermal resources, there are some current transmission constraints for further deployments. 7 However, no integration problems have been observed once transmission issues are solved, due to 8 the base-load characteristic of geothermal electricity. In a long-term perspective, no transmission 9 constraints are foreseen since EGS developments are less geography-dependant, even though the 10 EGS’s resource grades can vary substantially on a regional basis. 11
Social and environmental concerns: Concerns expressed about geothermal energy development 12 include the possibility of induced local seismicity associated with hydro-fracturing in EGS, water 13 usage by geothermal power plants in arid regions, land subsidence in some circumstances, fear of 14 water and soil contamination, and potential impacts of facilities on scenic quality and use of natural 15 areas and features (as geysers) that might otherwise be used for tourism. However, sound practices 16 protect natural thermal features valued by the community, minimise any adverse effects from 17 disposal of geothermal fluids and gases, induced seismicity and ground subsidence, and can 18 optimize water and land use. 19
4.8.3 Conclusions regarding deployment 20
Overall, the geothermal-electric market appears to be accelerating compared to previous years, as 21 indicated by the trends in both the number of new megawatts of power capacity installed and under 22 development (Bertani, 2010). The gradual introduction of new technology improvements including 23 EGS is expected to boost the growth rate exponentially after 10-20 years, reaching an expected 24 global target of ~160 GWe by 2050 (Table 4.13). Some of the new technologies are entering the 25 field demonstration phases to prove commercial viability (EGS), or early investigation stages to test 26 practicality (utilization of supercritical temperature and submarine hydrothermal vents or off-shore 27 resources). Power generation with binary plants opens up the possibility of producing electricity in 28 countries which do not have high-temperature resources or may have requirements for total 29 injection. 30
Direct use of geothermal energy for heating and cooling is currently commercially competitive, 31 using accessible, hydrothermal resources. A moderate increase is expected in the future 32 development of such hydrothermal resources for direct use, but a sustained compound annual 33 growth is expected with the deployment of GHP and direct use in lower grade regions, which can be 34 used for heating and/or cooling in most parts of the world, reaching up to 815 GWt by 2050 (Table 35 4.13). Marketing the cost/benefit advantages of direct use, including the inclusion of GHPs in 36 programs, will support the uptake of RE and increase efficiencies of using existing electricity 37 supplies by creating necessary infrastructure for widespread deployment. 38
Projections suggest that geothermal energy can provide 1.2% of the total electric demand by 2030 39 and between 2.5% and 4.1% by 2050. It also can provide 2.2% of the global demand for heat-40 cooling in 2030 and 4.9% by 2050. 41
Evidence suggests that the global and regional availability of geothermal resources is enough to 42 meet the results of the modelled scenarios, and also that projected market penetration seems to be 43 reasonable. With its natural thermal storage capacity, geothermal is especially suitable for supplying 44 base-load power, and thus is uniquely positioned to play a key role in climate change mitigation 45 strategies. 46

2nd Order Draft Contribution to Special Report Renewable Energy Sources (SRREN)
Do Not Cite or Quote 40 of 45 Chapter 4 SRREN_Draft2_Ch04 16-Jun-10
REFERENCES 1
Arpasi, M., 2005. Geothermal update of Hungary 2000-2004. Proceedings World Geothermal 2 Congress 2005, Antalya, Turkey, April 24-29, 2005. (ISBN 9759833204) 3
Axelsson, G., V. Stefánsson, G. Björnsson, and Liu, J., 2005. Sustainable management of 4 geothermal resources and utilisation for 100 – 300 years. Proceedings World Geothermal Congress 5 2005, Antalya, Turkey, April 24-29, 2005. (ISBN 9759833204) 6
Axelsson, G.V., C.J. Bromley, M.A. Mongillo, and L. Rybach, 2010. Sustainability task of the 7 International Energy Agency’s Geothermal Implementing Agreement. Proceedings World 8 Geothermal Congress 2010, Bali, Indonesia, April 25-30, 2010. 9
Balcer, M., 2000. Infrastruktura techniczna zakladu geotermalnego w Mszczonowie. 10 Miedzynarodowe seminarium na temat: Rola energii geotermalnej w zrуwnowazonym rozwoju 11 regionуw Mazowieckiego i Lodzkiego. Osuchуw 4-6 pazdziernika 2000 r., Krakow 2000, pp.107-12 114. (English translation: Proceedings of the Symposium on the Role of Geothermal Energy in the 13 Sustainable Development of the Mazovian and Lodz Regions. Mineral and Energy Economy 14 Research Institute, Polish Academy of Sciences, Cracow, Poland) 15
Barnett, P., and P. Quinlivan, 2009. Assessment of current costs of geothermal power generation in 16 New Zealand (2007 basis). Report by SKM for New Zealand Geothermal Association. Available at: 17 http://www.nzgeothermal.org.nz\industry_papers.html. 18
Baumgärtner J., H. Menzel, and P. Hauffe, 2007. The geox GmbH Project in Landau. The First 19 Geothermal Power Project in Palatinate/Upper Rhine Valley, at First European Geothermal Review. 20 Geothermal Energy for Electric Power Production, Mainz, Germany. 21
Bertani, R., 2005. World geothermal power generation in the period 2001-2005. Geothermics, 34, 22 pp. 651-690. (ISSN: 0375-6505) 23
Bertani, R., 2010. World Update on Geothermal Electric Power Generation 2005-2009. Proceedings 24 World Geothermal Congress 2010, Bali, Indonesia, April 25-30, 2010. 25
Bertani, R., and I. Thain, 2002. Geothermal power generating plant CO2 emission survey. IGA 26 News, 49, pp. 1-3. (ISSN: 0160-7782) 27
Bloomfield, K.K., J.N. Moore, and R.N. Neilson, 2003. Geothermal energy reduces greenhouse 28 gases. Geothermal Resources Council Bulletin, Vol. 32, No. 2, pp. 77-79. (ISSN 01607782) 29
Bloomquist, R. G., J.T. Nimmons, and K. Rafferty, 1987. District Heating Development Guide – 30 Legal, Institutional, and Marketing Issues, Vol. I. Washington State Energy Office, Olympia, WA, 31 268 p. 32
Bromley, C.J., and M.A. Mongillo, 2008. Geothermal energy from fractured reservoirs: dealing 33 with induced seismicity. IEA OPEN energy technology bulletin, Issue 48: 7 p. Available at: 34 http://www.iea.org/impagr/cip/pdf/Issue48Geothermal.pdf. 35
Bromley, C.J., L. Rybach, M.A. Mongillo, and I. Matsunaga, I., 2006. Geothermal resources- 36 utilization strategies to promote beneficial environmental effects and to optimize sustainability. 37 Proceedings RE 2006, 9-13 October 2006, Chiba, Japan, 4 p. In Science and technology in Japan 38 Vol. 25, No. 100, 2007. (ISSN 0286-0406) 39
Bromley, C.J., M.A. Mongillo, B. Goldstein, G. Hiriart, R. Bertani, E. Huenges, H. Muraoka, A. 40 Ragnarsson, J. Tester, and V. Zui, 2010. IPCC Renewable Energy Report: the Potential 41

2nd Order Draft Contribution to Special Report Renewable Energy Sources (SRREN)
Do Not Cite or Quote 41 of 45 Chapter 4 SRREN_Draft2_Ch04 16-Jun-10
Contribution of Geothermal Energy to Climate Change Mitigation. Proceedings World Geothermal 1 Congress 2010, Bali, Indonesia, April 25-30, 2010. 2
Budd, A.R., F.L. Holgate, E .Gerner, B.F. Ayling, and A. Barnicoat, 2008. Pre-competitive 3 Geoscience for Geothermal Exploration and Development in Australia: Geoscience Australia’s 4 Onshore Energy Security Program and the Geothermal Energy Project, in Gurgenci, H. and A.R. 5 Budd, (editors), Proceedings of the Sir Mark Oliphant International Frontiers of Science and 6 Technology Australian Geothermal Energy Conference, Geoscience Australia, Record 2008/18. 7 (ISBN: 9781921498190) 8
Burgassi, P.D., 1999. Historical Outline of Geothermal Technology in the Larderello Region to the 9 Middle of the 20th Century. In: Stories from a Heated Earth, R. Cataldi, S. Hodgson, J.W. Lund 10 eds., Geothermal Resources Council, Sacramento, CA. pp. 195-219. (ISBN: 0934412197) 11
Cataldi, R., 1999. The Year Zero of Geothermics. In: Stories from a Heated Earth, R. Cataldi, S. 12 Hodgson, J.W. Lund eds., Geothermal Resources Council, Sacramento, CA. pp. 7-17. (ISBN: 13 0934412197) 14
Cross, J., and J. Freeman, 2009. 2008 Geothermal Technologies Market Report. Publication of the 15 Geothermal Technologies Program of the US Department of Energy, July 2009, 46 p. 16
Dickson, M.H., and M. Fanelli, 2003. Geothermal energy: Utilization and technology. Publication 17 of UNESCO, New York, 205 pp. (ISBN: 9231039156) 18
DiPippo, R., 2008. Geothermal power plants: principles, applications, case studies and 19 environmental impact (Second edition). Elsevier, London. 493 p. (ISBN: 9780750686204) 20
DRET (Department of Resources, Energy and Tourism), 2008. Australian Geothermal Industry 21 Development Framework, Commonwealth of Australia. (ISBN 978-1-921516-11-5 [paperback] 22 ISBN 978-1-921516-15-3 [pdf]). Available at: 23 http://www.ret.gov.au/energy/clean_energy_technologies/energy_technology_framework_and_road24 maps/hydrogen_technology_roadmap/Documents/GEOTHERMAL%20FRAMEWORK.pdf. 25
ENGINE (Enhanced Geothermal Innovative Network for Europe), 2008. Propositions for the 26 definition of research areas on Enhanced Geothermal Systems. ENGINE Newsletter No. 11 – June 27 2008. Available at: http://engine.brgm.fr/bulletins/ENGINE_Newsletter11_062008.pdf. 28
Entingh, D.J., and G. Mines, 2006. A Framework for Evaluating Research to Improve U.S. 29 Geothermal Power Systems. Transactions of the Geothermal Resources Council, Vol. 30, pp. 741-30 746. (ISSN: 0193-5933) 31
EPRI, 1978. Geothermal energy prospects for the next 50 years. ER-611-SR, Special Report for the 32 World Energy Conference 1978. 33
Frick, S., G. Schröder, and M. Kaltschmitt, 2010. Life cycle analysis of geothermal binary power 34 plants using enhanced low temperature reservoirs. Energy, Vol. 35, Issue 5, pp. 2281-2294. (ISSN: 35 0360-5442) 36
Fridleifsson, G.O., Pálsson, B., Stefánsson, B., Albertsson, A., Gunnlaugsson, E., Ketilsson, J., 37 Lamarche, R. and Andersen, P.E., 2010. Iceland Deep Drilling Project. The first IDDP Drill Hole 38 Drilled and Completed in 2009. Proceedings World Geothermal Congress 2010, Bali, Indonesia, 39 April 25-29, 2010. 40
Fridleifsson, I.B. and Ragnarsson, A., 2007. Geothermal Energy. In: 2007 Survey of Energy 41 Resources, 427-437. World Energy Council 2007. Available at http://www.worldenergy.org. 42

2nd Order Draft Contribution to Special Report Renewable Energy Sources (SRREN)
Do Not Cite or Quote 42 of 45 Chapter 4 SRREN_Draft2_Ch04 16-Jun-10
Fridleifsson, I.B., R. Bertani, E. Huenges, J.W. Lund, A. Ragnarsson, and L. Rybach, 2008. The 1 Possible Role and Contribution of Geothermal Energy to the Mitigation of Climate Change. IPCC 2 Scoping Meeting on Renewable Energy Sources, Luebeck, Germany 21-25 January 2008. 36 p. 3 Available at: http://www.ipcc.ch/pdf/supporting-material/proc-renewables-lubeck.pdf 4
Gawell, K., and G. Greenberg, 2007. 2007 Interim Report. Update on World Geothermal 5 Development. Publication of the Geothermal Energy Association. Available at the GEA website: 6 http://www.geo-energy.org. 7
GEISER, 2010. Geothermal Engineering Integrating Mitigation of Induced Seismicity in 8 Reservoirs. EU project. Available at: http://www.gfz-potsdam.de. 9
German, C.R., G.P. Klinkhammer, and M.D. Rudnicki, 1996. The Rainbow Hydrothermal Plume, 10 36°15’N, MAR. Geophysical Research Letter, 23(21), pp. 2979–2982. (ISSN: 0094-8276) 11
Goldstein, B.A., A. Long, A.R. Budd, B. Ayling, and B. Bendall, 2010. Annual Update – 12 Geothermal Energy in Australia, 3rd. Australian Geothermal Energy Conference, Adelaide (in 13 press). 14
Goldstein, B.A., A.J. Hill, A. Long, A.R. Budd, B. Ayling, and M. Malavazos, 2009. Hot Rocks 15 Down Under – Evolution of a New Energy Industry, Transactions of the Geothermal Resources 16 Council, Vol. 33. (ISSN: 0193-5933) 17
Grant, M.A., I.G., Donaldson, and P.F. Bixley, 1982. Geothermal reservoir engineering. Academic 18 Press, New York, 1982. 19
GTP (Geothermal Technologies Program), 2008. Geothermal Tomorrow 2008. Publication No. 20 DOE-GO-102008-2633 of the Geothermal Technologies Program of the US Department of Energy, 21 September 2008, 36 p. 22
Hamza, V.M, R.R, Cardoso, and C.F. Ponte Neto, 2008. Spherical harmonic analysis of earth’s 23 conductive heat flow. International Journal of Earth Sciences (Geol Rundsch), 97, pp. 205-226. 24
Hance, C.N., 2005. Factors affecting costs of geothermal power development. Published by the 25 Geothermal Energy Association for the U.S. Department of Energy, August, 2005. 64 p. Available 26 at: http://www.geo-27 energy.org/reports/Factors%20Affecting%20Cost%20of%20Geothermal%20Power%20Developme28 nt%20-%20August%202005.pdf 29
Hernández, I., 2008. Factibilidad técnica de la generación eléctrica con ventilas hidrotermales. Tesis 30 de Licenciatura de la Facultad de Ingeniería, Universidad Nacional Autónoma de México. 88 p. 31 Available at: http://www.impulsa4.unam.mx/pdf/tesis_isaias.pdf 32
Hiriart, G., and L.C.A. Gutiérrez-Negrín, 1994. Geothermal development in Mexico. Transactions 33 of the Geothermal Resources Council, Vol. 18, pp. 269-274. (ISSN: 0193-5933) 34
Hiriart, G., and S. Espíndola, 2005. Aprovechamiento de las ventilas hidrotermales para generar 35 electricidad. Memorias de la VIII Conferencia Anual de la AMEE, Colegio de México, pp. 153-36 159. Available at: http://www.economia-energetica.org.mx/MemoriasVIIIConfAnualAMEE.pdf 37
Hiriart, G., R.M. Prol-Ledesma, S. Alcocer and G. Espíndola, 2010. Submarine Geothermics: 38 Hydrothermal Vents and Electricity Generation. Proceedings World Geothermal Congress 2010, 39 Bali, Indonesia, 25-29 April, 2010. 40
Hjastarson, A., and J.G. Einarsson, 2010. Geothermal resources and properties of HS Orka, 41 Reyjanes Peninsula, Iceland. Independent Technical Report prepared by Mannvit Engineering for 42 Magma Energy Corporation, 151 pp. Available upon request at: http://www.mannvit.com. 43

2nd Order Draft Contribution to Special Report Renewable Energy Sources (SRREN)
Do Not Cite or Quote 43 of 45 Chapter 4 SRREN_Draft2_Ch04 16-Jun-10
Huenges, E., 2010. Geothermal energy systems – Exploration, development and utilization. 1st. 1 edition. E. Huenges (editor). Wiley-VCH, Berlin. April, 2010. 2
Huenges, E., K. Erbas, I. Moeck, G. Blöcher, W. Brandt, T. Schulte, A. Saadat, G. Kwiatek, G. 3 Zimmermann, 2009. The EGS project Groß Schönebeck - Current status of the large scale research 4 project in Germany. Transactions of the Geothermal Resources Council, Vol. 39, pp. 403-404. 5 (ISSN: 0193-5933) 6
IEA-GIA, 2009. IEA-GIA Annual Report (2008). Available at: http://www.iea-7 gia.org/publications.asp. 8
IPGT, 2008. Description of the International Partnership for Geothermal Technologies (IPGT). 9 Available at http://internationalgeothermal.org/ 10
Kagel, A., 2006. A Handbook on the Externalities, Employment, and Economics of Geothermal 11 Energy. Published by the Geothermal Energy Association. Available at: http://www.geo-energy.org. 12
Kaltschmitt, M., 2000. Environmental effects of heat provision from geothermal energy in 13 comparison to other resources of energy. Proceedings World Geothermal Congress 2000, Kyushu-14 Tohoku, Japan, May 28-June 10, 2000. (ISBN: 0473068117) 15
Kaltschmitt, M., A. Wiese, and W. Streicher (Ed.), 2006. Erneuerbare Energien – Systemtechnik, 16 Wirtschaftlichkeit, Umweltaspekte, 4. Auflage. Springer Verlag, Berlin (in German). (ISBN: 978-3-17 540-28204-4) 18
Krewitt, W., K. Nienhaus, C. Klebmann, C. Capone, E. Stricker, W. Grauss, M. Hoggwijk, N. 19 Supersberger, U. Von Winterfeld, and S. Samadi, 2009. Role and potential of renewable energy and 20 energy efficiency for global energy supply. Climate Change, 18, December 2009, 344 pp. (ISSN: 21 1862-4359) 22
Kutscher, C., 2000. The status and future of geothermal electric power. Publication of the National 23 Renewable Energy Laboratory of the US Department of Energy, August 2000. 24
Laplaige, P., J. Lemale, S. Decottegnie, A. Desplan, O. Goyeneche, and G. Delobelle, 2005. 25 Geothermal resources in France – current situation and prospects. Proceedings World Geothermal 26 Congress 2005, Antalya, Turkey, April 24-29, 2005. (ISBN 9759833204) 27
Lippmann, M.J., 2002. Geothermal and the electricity market in Central America. Transactions of 28 the Geothermal Resources Council, Vol. 26, pp. 37-42. (ISSN: 0193-5933) 29
Lovekin, J., 2000. The economics of sustainable geothermal development. Proceedings World 30 Geothermal Congress 2000, Kyushu-Tohoku, Japan, May 28-June 10, 2000. (ISBN: 0473068117) 31
Lund, J. W., D.H. Freeston, and T.L. Boyd, 2010. Direct Utilization of Geothermal Energy 2010 32 Worldwide Review. Proceedings World Geothermal Congress 2010, Bali, Indonesia, 25-30 April 33 2010. 34
Lund, J.W., 1995. Onion Dehydration. Transactions of the Geothermal Resources Council, Vol. 19, 35 pp. 69-74. (ISSN: 0193-5933) 36
Lund, J.W., and T.L. Boyd, 2009. Geothermal Utilization on the Oregon Institute of Technology 37 Campus, Klamath Falls, Oregon. Proceedings of the 34th Workshop on Geothermal Reservoir 38 Engineering, Stanford University, CA (CD-ROM). (ISBN: 9781615673186) 39
Lund, J.W., B. Sanner, L. Rybach, R. Curtis, and G. Hellström, 2003. Ground-Source Heat Pumps – 40 A World Overview, Renewable Energy World, Vol. 6, No. l4 (July-August), pp. 218-227. (ISSN 41 1462-6381 z) 42
2nd Order Draft Contribution to Special Report Renewable Energy Sources (SRREN)
Do Not Cite or Quote 44 of 45 Chapter 4 SRREN_Draft2_Ch04 16-Jun-10
Lund, J.W., D.H. Freeston, and T.L. Boyd, 2005. Direct application of geothermal energy: 2005 1 Worldwide Review. Geothermics, 34, pp. 691-727. (ISSN 0375-6505) 2
Lupton, J., 1995. Hydrothermal Plumes: Near and Far Field. Geophysical Monograph, American 3 Geophysical Union, 91, pp. 317-346. (ISSN 0065-8448, ISBN 0875900488) 4
Majer, E., E. Bayer, and R. Baria, 2008. Protocol for induced seismicity associated with enhanced 5 geothermal systems. International Energy Agency – Geothermal Implementing Agreement 6 (incorporating comments by: C. Bromley, W. Cumming, A. Jelacic and L. Rybach). Available at: 7 http://www.iea-gia.org/publications.asp. 8
Mansure, A.J., and D.A. Blankenship, 2008. Geothermal Well Cost Analyses. Transactions of the 9 Geothermal Resources Council, Vol. 31. (ISSN: 0193-5933) 10
Newell, D., and A. Mingst, 2009. Power from the Earth. Trading Carbon, Vol. 2, No. 10, p. 24. 11 (ISSN 1756-1655) 12
Nill, M., 2004. Die zukünftige Entwicklung von Stromerzeugungstechniken, Eine ökologische 13 Analyse vor dem Hintergrund technischer und ökonomischer Zusammenhänge, Fortschritt-Berichte 14 VDI Nr. 518. Düsseldorf, D: VDI-Verlag, 346 (in German). (ISSN: 0178-9414) 15
O’Sullivan, M., and W. Mannington, 2005. Renewability of the Wairakei-Tauhara Geothermal 16 Resource. Proceedings World Geothermal Congress 2005, Antalya, Turkey, April 24-29, 2005. 17 (ISBN 9759833204) 18
Owens, B., 2002. An economic valuation of a geothermal production tax credit. Publication of the 19 National Renewable Energy Laboratory of the US Department of Energy, April 2002. 20
Pehnt, M., 2006. Dynamic life cycle assessment (LCA) of renewable energy technologies. 21 Renewable Energy, 31, pp. 55-71. (ISSN 0960-1481) 22
Pritchett, R., 1998. Modeling post-abandonment electrical capacity recovery for a two-phase 23 geothermal reservoir. Transactions of the Geothermal Resources Council, Vol. 22, pp. 521-528. 24 (ISSN 0193-5933) 25
Pruess, K., 2009. TOUGH2. Retrieved from the website of the Lawrence Berkeley Laboratory, US: 26 http://esd.lbl.gov/TOUGH2/. 27
Radeckas, B., and V. Lukosevicius, 2000. Klaipeda Geothermal demonstration project. Proceedings 28 World Geothermal Congress 2000. Kyushu-Tohoku, Japan, May 28-June 10, 2000, pp. 3547-3550. 29 (ISBN: 0473068117) 30
Reif, T., 2008. Profitability analysis and risk management of geothermal projects. Geo-Heat Center 31 Quarterly Bulletin, 28/4, pp. 1-4. 32
Rybach, L., 2005. The advance of geothermal heat pumps world-wide. IEA Heat Pump Centre 33 Newsletter, 23, pp. 13-18. (ISSN: 0724-7028) 34
Rybach, L., and M.A. Mongillo, 2006. Geothermal Sustainability – A Review with Identified 35 Research Needs. Transactions of the Geothermal Resources Council, Vol. 30, pp. 1083-1090. 36 (ISSN: 0193-5933) 37
Sims, R.E.H., R.N. Schock, A. Adegbululgbe, J. Fenhann, I. Konstantinaviciute, W. Moomaw, H.B. 38 Nimir, B. Schlamadinger, J. Torres-Martínez, C. Turner, Y. Uchiyama, S.J.V. Vuori, N. 39 Wamukonya, X. Zhang, 2007. Energy supply. In Climate Change 2007: Mitigation. Contribution of 40 Working Group III to the Fourth Assessment Report of the Intergovernmental Panel on Climate 41 Change [B. Metz, O.R. Davidson, P.R. Bosch, R. Dave, L.A. Meyer (eds)], Cambridge University 42 Press, Cambridge, United Kingdom and New York, NY, USA. (ISBN-13: 9780521705981) 43

2nd Order Draft Contribution to Special Report Renewable Energy Sources (SRREN)
Do Not Cite or Quote 45 of 45 Chapter 4 SRREN_Draft2_Ch04 16-Jun-10
Stefansson, V., 2000. The renewability of geothermal energy. Proceedings World Geothermal 1 Congress 2000, Kyushu-Tohoku, Japan, May 28-June 10, 2000, pp. 883-888. (ISBN: 0473068117) 2
Stefansson, V., 2002. Investment cost for geothermal power plants. Geothermics, 31, pp. 263-272. 3 (ISSN: 0375-6505) 4
Stefansson, V., 2005. World geothermal assessment. Proceedings World Geothermal Congress 5 2005, Antalya, Turkey, April 24-29, 2005. (ISBN 9759833204) 6
Tester, J.W., B.J. Anderson, A.S. Batchelor, D.D. Blackwell, R. DiPippo, and E.M. Drake (eds.), 7 2006. The Future of Geothermal Energy Impact of Enhanced Geothermal Systems on the United 8 States in the 21st century. Prepared by the Massachusetts Institute of Technology, under Idaho 9 National Laboratory Subcontract No. 63 00019 for the U.S. Department of Energy, Assistant 10 Secretary for Energy Efficiency and Renewable Energy, Office of Geothermal Technologies. 358 p. 11 (ISBN-10: 0486477711, ISBN-13: 978-0486477718) 12
Tester, J.W., E.M. Drake, M.W. Golay, M.J. Driscoll, and W.A. Peters, 2005. Sustainable Energy – 13 Choosing Among Options, MIT Press, Cambridge, MA, 850 p. 14
Verbrugeen, A., and J.G. Nyboer, 2009. Calculator for determination of Levelized Cost per unit of 15 Energy. Developed for use of the SRREN authors. Unpublished. 16
WEC, 1994. New renewable energy sources. Kogan Page Ltd., London, 1994. 17