chapter 3 training in information technology skills...
TRANSCRIPT
84
CHAPTER 3
TRAINING IN INFORMATION TECHNOLOGY SKILLS
TO SHG WOMEN TO ESTABLISH AND MAINTAIN
INFORMATION KIOSKS
3.1 INTRODUCTION
The Centre for the Empowerment of Women, Anna University,
Chennai, in association with the Tamil Nadu Women’s Corporation for
Development of Women limited planned to train SHG Women to establish
and maintain Information Kiosk in the year 2005 (from September 2005 till
December 2005). The objective of this program is to empower and equip
SHG Women with the necessary skills and techniques, required for
establishing and operating the Information kiosk.
This training program focused on both process and behavioral
skills. The main objective of the training programme was to empower and
equip the SHG women, with the necessary skills and techniques required for
the setting up and smooth functioning of information kiosks and to handhold
them till the objective is attained. The Tamilnadu Corporation for
Development of Women Ltd. intended to develop a scheme for trained
women to set up Information Kiosks with financial assistance.

85
3.2 TRAINING METHODOLOGY
During the Course, the trainees were given training by different
experts. Each participant was provided with a Training Kit, that is prepared
exclusively for them, by experts from the concerned field and consists of
twelve training manuals and twelve Computer Based Tutorials. They were
also provided with hands-on training is computers operation during the Lab
sessions. The training material prepared for them were in their Regional
language Tamil. On successful completion with a Certificate from the Centre
for Empowerment of Women, Anna University, Chennai.
3.2.1 Duration and Venue
This training program was held in 30 districts in Tamil Nadu. The
duration of the program was 2 weeks from Monday to Saturday. The Timings
were fixed as 10 am to 5pm.Totally, 48 sessions were planned for each
training programme.
3.2.2 Content of the Training Programme
These training programs were designed to prepare the self-help
group women in the following three major areas. The training concentrated
mainly an software skills, which took up the major part of the forty sessions.
Five sessions were devoted to hardware, and the last three sessions to
entrepreneurial management.
3.2.2.1 Subjects covered under hardware maintenance
The following topics were covered in the hardware session
maintenance, and trouble shooting of the following was completed. They are
Phone, Fax, Printer, Scanner, Xerox, CD Burning and Computer Installation.

86
3.2.2.2 Subjects covered under software maintenance
The following topics were covered in software maintenance, they
are an introduction to computers, networking & LAN Concept, MS Office –
Word, PP, Excel, Access ,Internet – Mail, Chat, Voice Chat, Web Cam,
Search, Downloading – both Internet and TV, Accounting Package – Tally,
DTP, PageMaker, Photoshop, and Recent Trends in the KIOSK and
Computers with education on the Opportunities, followed by conclusion and
evaluation.
3.2.2.3 Subjects covered under entrepreneurship management
The following topics were completed under entrepreneur
management General knowledge about the Kiosk, Annual Maintenance
Contract (AMC), Business Accounting, Insurance, Marketing (Promoting),
Customer Relations and Management.
In 2005, Tamil Nadu, had 30 districts, hence, the training
programme was held in 40 Engineering Colleges affiliated to Anna University
in 30 Districts, and this training programme was a residential one. The
training was given for 12 days from 10am to 5pm. Twelve Training Materials
along with the Computer Based Tutorials (CBTs) were distributed to all the
trainees for their future reference.
3.3 EVALUATION OF COURSE MATERIAL
A one-day workshop was conducted for trainers from the selected
forty engineering colleges on the programme and the teaching methodology.
The trainers were also briefed about the various sessions and the topics to be
covered during the training programme. The following Table 3.1 shows the
list of course materials prepared in the one day training programme for the
trainers.

87
\Table 3.1 List of course material published and Distributed during
the training
S. No. Topics
1 Hardware Maintenance and Trouble Shooting
2 Computer Basics
3 MS WORD
4 MS POWERPOINT
5 MS EXCEL
6 MS ACCESS
7 Internet
8 DTP - 1
9 DTP - 2
10 Tally
11 Kiosk – An Introduction
12 Management Skills
The timetable for the 12 days’ training was given to 40 Engineering
Colleges to maintain uniformity. They were given the rough draft of the
training materials and their feedback was obtained and incorporated in the
same. The training programme was conducted as per the schedule. The
participants were asked to answer the questionnaire before the start of the
programme, and the same was administered with some additional questions,
to assess the awareness of the ICT and their ability to start the kiosk after the
training. The data collected were analyzed to make certain decisions.

88
Table 3.2 List of training manuals published for the 12 days training of
SHG women
S. No. Topics Authors
1Hardware Maintenance and
Trouble ShootingMr. R.V. Pathy
2Introduction to Computers
Networking & LAN ConceptMr. Thanigai Arasu
3 MS WORD Ms. R. Lavanya
4 MS POWERPOINT Ms. R. Lavanya
5 MS EXCEL Ms. S. Geetha Lakshmi
6 MS ACCESS Ms. S. Geetha Lakshmi
7 Internet Ms. K. Venkatalakshmi
8 DTP - 1 Ms. K. Bhuvaneshwari
9 DTP - 2 Ms. K. Bhuvaneshwari
10 Tally Ms. K. Sunitha
11 KIOSK – An Introduction Ms. K. Venkatalakshmi
12
Managing – Accountancy,
Maintenance and Insurance,
Marketing and Customer Relations
and Management
Ms. K. Bhuvaneshwari and
Mr. Soma Valliappan
3.4 ANALYSIS OF THE TRAINING PROGRAMME
3.4.1 Pre test and Post test on the training programme
The following data has been collected from the participants in the
training programme, and used for further analysis, and understanding, by
giving a questionnaire before the training which is the pre test and a post test
with a different set of question was done after the training to record the
impact of the training programme.
The questionnaires were disturbed and collected as pretest and post
test, before and after the training.

89
The training was attended by 1006 self help group women; so,
totally 2012 questionnaires were distributed in 40 engineering college.
The trainees were 1006 in number, therefore 1006 pretests and
1006 post tests were administered 1642 were acceptable (only 821 trainees
have answered both pre test and post test).
Therefore the data analysis was done for 821 participants.
3.5 AGE OF THE PARTICIPANTS.
The age is an important factor in the analysis; Table 3.3 shows the
age of the SHG members who participated in the training. 51.8% of them
were between 25 and 35 years, 44.2% of them between 18 and 25 years, and
only 5% of them were between 35 and 45.
Table 3.3 Age of the participants
S.No. Age Frequency Percent
1 18-25 363 44.2
2 25-35 425 51.8
3 35-45 33 4.0
Total 821 100.0
3.6 EDUCATIONAL LEVEL OF THE TRAINEES.
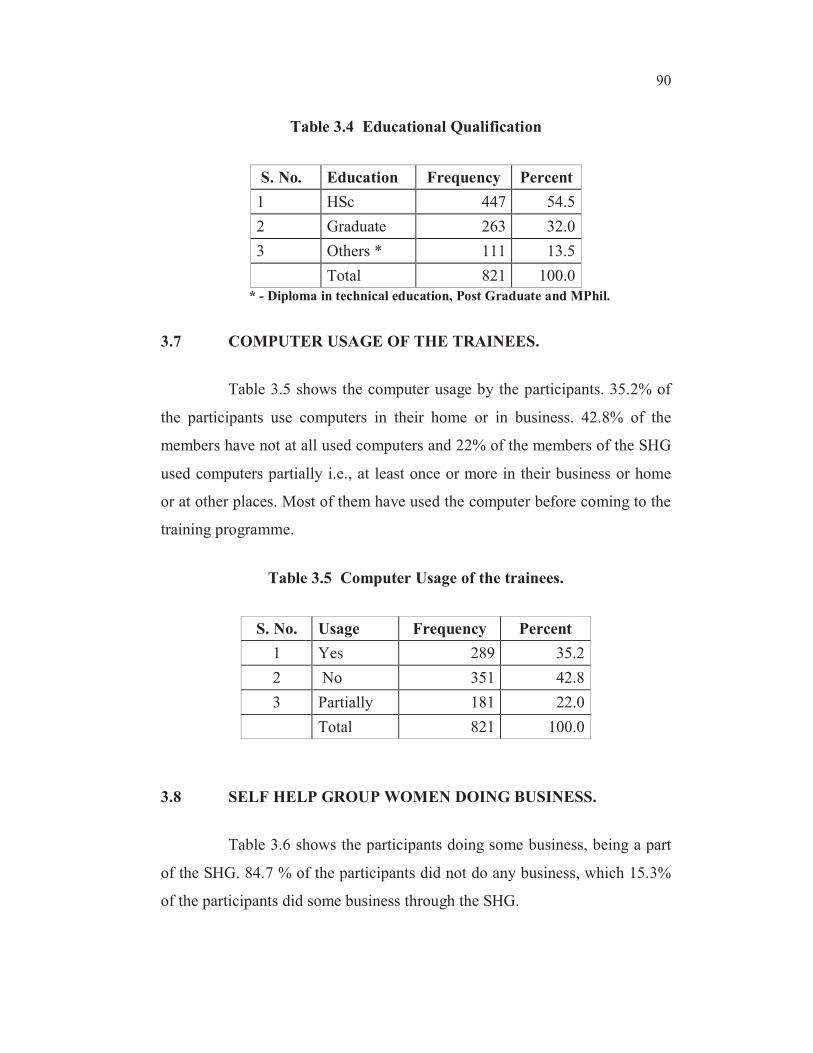
Table 3.4 shows the level of education of the participants. 54.5%
were matriculates; 32% were graduates and 13.5% had higher qualifications.
90
Table 3.4 Educational Qualification
S. No. Education Frequency Percent
1 HSc 447 54.5
2 Graduate 263 32.0
3 Others * 111 13.5
Total 821 100.0
* - Diploma in technical education, Post Graduate and MPhil.
3.7 COMPUTER USAGE OF THE TRAINEES.
Table 3.5 shows the computer usage by the participants. 35.2% of
the participants use computers in their home or in business. 42.8% of the
members have not at all used computers and 22% of the members of the SHG
used computers partially i.e., at least once or more in their business or home
or at other places. Most of them have used the computer before coming to the
training programme.
Table 3.5 Computer Usage of the trainees.
S. No. Usage Frequency Percent
1 Yes 289 35.2
2 No 351 42.8
3 Partially 181 22.0
Total 821 100.0
3.8 SELF HELP GROUP WOMEN DOING BUSINESS.
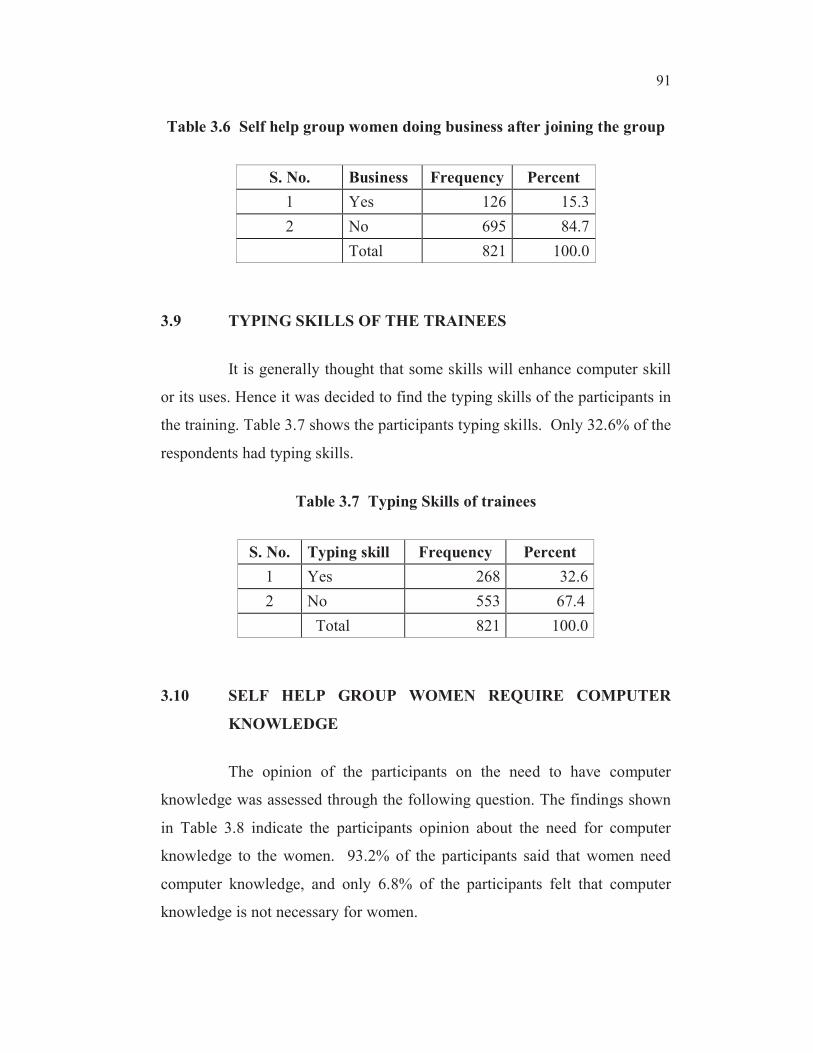
Table 3.6 shows the participants doing some business, being a part
of the SHG. 84.7 % of the participants did not do any business, which 15.3%
of the participants did some business through the SHG.
91
Table 3.6 Self help group women doing business after joining the group
S. No. Business Frequency Percent
1 Yes 126 15.3
2 No 695 84.7
Total 821 100.0
3.9 TYPING SKILLS OF THE TRAINEES
It is generally thought that some skills will enhance computer skill
or its uses. Hence it was decided to find the typing skills of the participants in
the training. Table 3.7 shows the participants typing skills. Only 32.6% of the
respondents had typing skills.
Table 3.7 Typing Skills of trainees
S. No. Typing skill Frequency Percent
1 Yes 268 32.6
2 No 553 67.4
Total 821 100.0
3.10 SELF HELP GROUP WOMEN REQUIRE COMPUTER
KNOWLEDGE
The opinion of the participants on the need to have computer
knowledge was assessed through the following question. The findings shown
in Table 3.8 indicate the participants opinion about the need for computer
knowledge to the women. 93.2% of the participants said that women need
computer knowledge, and only 6.8% of the participants felt that computer
knowledge is not necessary for women.

92
Table 3.8 Self Help Group women need computer knowledge
S. No. Frequency Percent
1 Yes 765 93.2
2 No 56 6.8
Total 821 100.0
3.11 VILLAGES HAVING COMPUTER CENTERS
Access to computers is important for the participants to value the
need for training. Table 3.9 shows the computer centres in the villages. 37.9%
of the participants said that they have computer centres in their villages, and
62.1% of the members said that they do not have a computer centre in their
village. The majority of the participants said that their village has no
computer centres.
Table 3.9 Computer centre
S. No. Computer centre Frequency Percent
1 Yes 311 37.9
2 No 510 62.1
Total 821 100.0
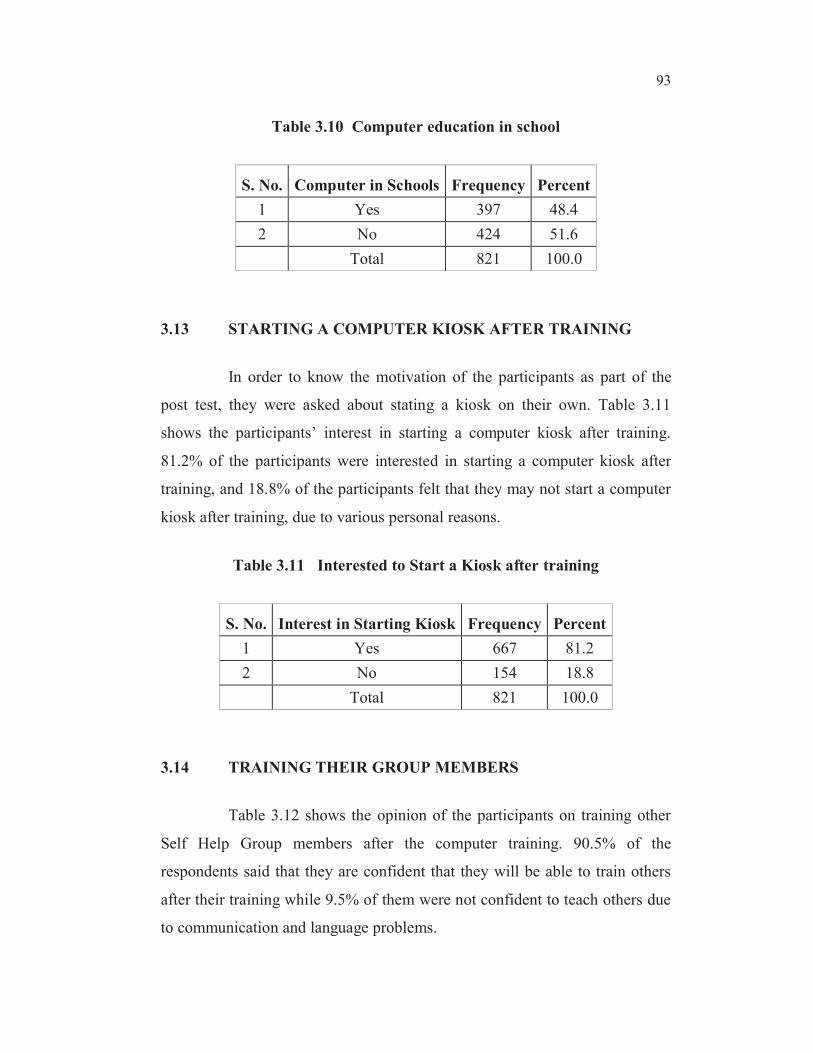
3.12 SCHOOLS HAVING COMPUTERS
Table 3.10 shows the participants opinion about the availability of
computers in the village schools. 48.4% of the participants accepted that they
have computers in their village schools.
93
Table 3.10 Computer education in school
S. No. Computer in Schools Frequency Percent
1 Yes 397 48.4
2 No 424 51.6
Total 821 100.0
3.13 STARTING A COMPUTER KIOSK AFTER TRAINING
In order to know the motivation of the participants as part of the
post test, they were asked about stating a kiosk on their own. Table 3.11
shows the participants’ interest in starting a computer kiosk after training.
81.2% of the participants were interested in starting a computer kiosk after
training, and 18.8% of the participants felt that they may not start a computer
kiosk after training, due to various personal reasons.
Table 3.11 Interested to Start a Kiosk after training
S. No. Interest in Starting Kiosk Frequency Percent
1 Yes 667 81.2
2 No 154 18.8
Total 821 100.0
3.14 TRAINING THEIR GROUP MEMBERS
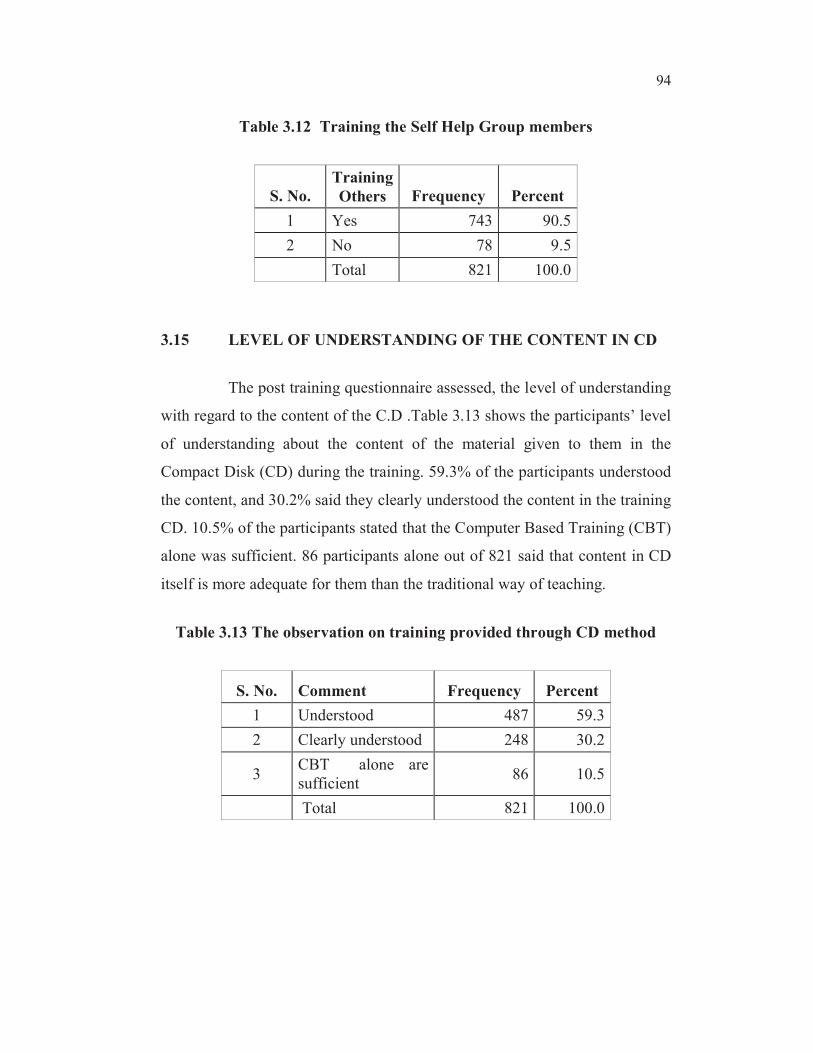
Table 3.12 shows the opinion of the participants on training other
Self Help Group members after the computer training. 90.5% of the
respondents said that they are confident that they will be able to train others
after their training while 9.5% of them were not confident to teach others due
to communication and language problems.
94
Table 3.12 Training the Self Help Group members
S. No.
Training
Others Frequency Percent
1 Yes 743 90.5
2 No 78 9.5
Total 821 100.0
3.15 LEVEL OF UNDERSTANDING OF THE CONTENT IN CD
The post training questionnaire assessed, the level of understanding
with regard to the content of the C.D .Table 3.13 shows the participants’ level
of understanding about the content of the material given to them in the
Compact Disk (CD) during the training. 59.3% of the participants understood
the content, and 30.2% said they clearly understood the content in the training
CD. 10.5% of the participants stated that the Computer Based Training (CBT)
alone was sufficient. 86 participants alone out of 821 said that content in CD
itself is more adequate for them than the traditional way of teaching.
Table 3.13 The observation on training provided through CD method
S. No. Comment Frequency Percent
1 Understood 487 59.3
2 Clearly understood 248 30.2
3CBT alone are
sufficient86 10.5
Total 821 100.0

95
3.16 NEED FOR COMPUTERS IN THE VILLAGE
After the training the trainees were asked in the post test, whether
they need a computer in their village. Table 3.14 shows the participants
views on the need for computers in the village. 93% of the participants’ said
that they need computers in their villages. 7% of the participants said that they
do not need computers in their village, as they were able to access a computer
in other places (near by towns).
Table 3.14 Need of computer in village
S. No.Need of
ComputerFrequency Percent
1 Yes 764 93.0
2 No 57 7.0
Total 821 100.0
3.17 BENEFIT OF TRAINING
During the post test, a question was asked, to find out whether the
participants understood the importance of computers. Table 3.15 shows how
the training made the participants understand the importance of computers.
98% of the participants said that they understood the importance of the
computer after the training. Only 1.8% of them said that they did not
understand the importance of the computer even after the training.

96
Table 3.15 Participants feedback on importance of computer after
training in day to day activities
S. No. Response Frequency Percent
1 Yes 806 98.2
2 No 15 1.8
Total 821 100.0
3.18 EARN PROFIT THROUGH A COMPUTER KIOSK
The confidence of the participants in starting a kiosk was assessed
through a question after the training. Table 3.16 shows the interest of the
participants in running a kiosk and earning profit. 98.4% of the participants
are confident after the training that they can earn a profit through a kiosk.
Table 3.16 Profit earning through Kiosk
S. No. Response Frequency Percent
1 Yes 808 98.4
2 No 13 1.6
Total 821 100.0
3.19 MAIN SOURCE OF INFORMATION
Table 3.17 shows the SHG member’s household's main source of
information. Television is an important source of information for the
member’s households (63%), followed by the Internet (25.4%) and the other
source of information used by the SHG members was the Radio 11.6%.

97
Table 3.17 Source of Information
S. No Medium Frequency Percent
1 Radio 95 11.6
2 TV 517 63.0
3 Internet 209 25.4
Total 821 100.0
3.20 COMPUTER TRAINING NEED FOR SHG WOMEN
Table 3.18 shows the participants’ opinion about the women’s need
for computer training as revealed in the post training question. 96.4% of the
members said that the women’s need computer training. Similar to the one
provided to them and 3.6% of the participants who had undergone the training
insisted there was no need of computer training for women.
Table 3.18 Computer training need for SHG Women
S. No. Response Frequency Percent
1 Yes 791 96.4
2 No 30 3.6
Total 821 100.0
3.21 CROSS TABULATION AND CHI-SQUARE ANALYSIS OF
THE IMPACT OF TRAINING
With a view to analyzing the relationship between the variables
Age group, literacy level of the Self Help Group member, Typing Skills and
Computer knowledge to start a kiosk after training, Earn profit through it
Sources of information, Women’s need for computer training. Cross
tabulation with Chi-square was calculated to know the relation between these
variables.

98
The data collected was imported into the SPSS for a quantitative
analysis. The statistical significance of each hypothesis. In this research
study, a minimum significance level of .05 was used for each test. This means
that the differences will be statistically significant if the results would have
occurred by chance less than 5 times out of 100. It is reported as p < .05.
When the statistical difference is strong, the p value will be reported as
p < .01, which means that the results would have occurred by chance less than
once in 100. If there is no significant difference, the actual p value will be
reported.
The following null hypotheses were framed to test the association
between the variables:
i) The age group of the respondents has no relation with
Women’s need for computer training.
ii) The age group of the respondents has no association with
sources of information.
iii) The age group of the respondents has no relation to the
confidence to start a kiosk after training.
iv) The age group of the respondents has no relation to the
confidence to Earn a Profit through a kiosk.
v) The educational qualification of the respondents has no
association with Women’s need for computer training.
vi) The educational qualification of the respondents has no
relation with the sources of information.
vii) The educational qualification of the respondents has no
association with the confidence to start a kiosk after training.

99
viii) The educational qualification of the respondents has no
association with the confidence to Earn a Profit through a
kiosk.
ix) The typing skills of the respondents have no association with
Women’s need for computer training.
x) The typing skills of the respondents have no association with
the confidence to start a kiosk after training
xi) The typing skills of the respondents have no association with
the confidence to Earn Profit through a kiosk.
3.22 AGE GROUP AND COMPUTER TRAINING NEED FOR
WOMEN
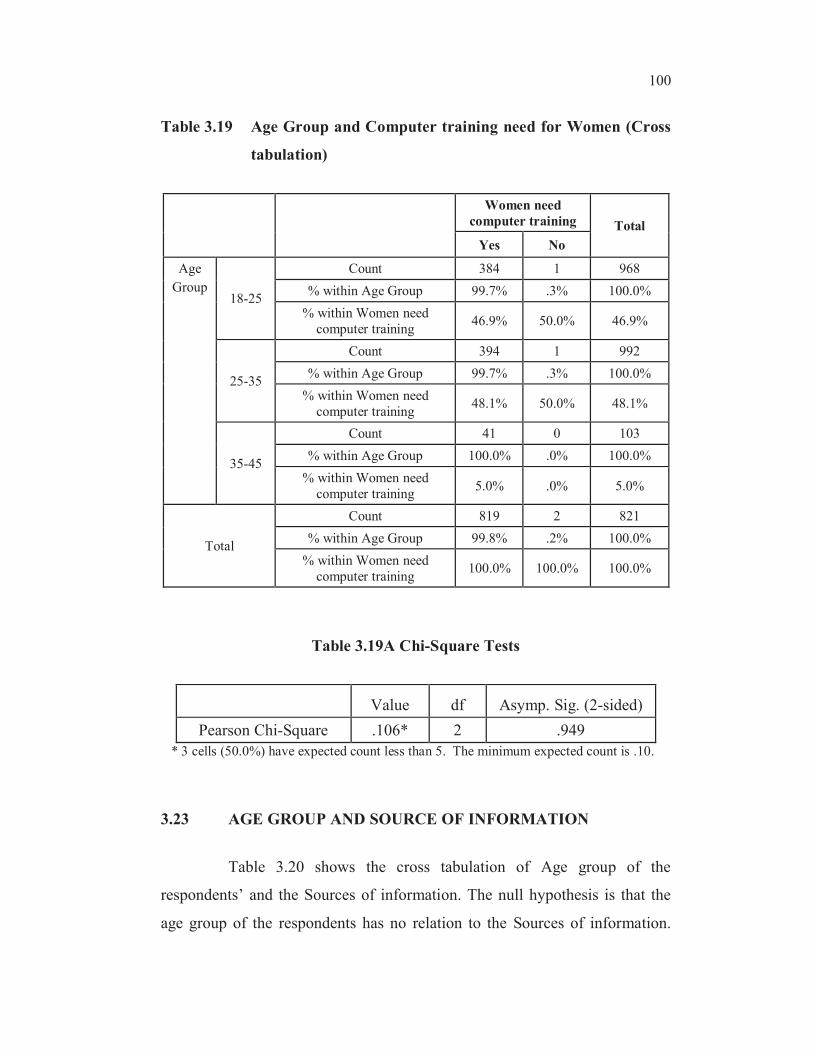
Table 3.19 shows the cross tabulation of Age group of the
respondents and Women’s need for computer training. The null hypothesis is
that the age group of the respondents has no relation to Women’s need for
computer training. 99.7% of the respondents in the age group of 18-25 years,
99.7% of the respondents in the age group of 25-35 years and 100% of the
respondents in the age group of 35-45 years are of the opinion that women
need computer training.
Table 3.19A shows the calculated value of the Chi-square at 2
degrees of freedom (0.949) is greater than 0.05. Therefore, the null hypothesis
is accepted and we conclude that there is no relation between the age group
and women’s need for computer training.
100
Table 3.19 Age Group and Computer training need for Women (Cross
tabulation)
Women need
computer training Total
Yes No
Age
Group18-25
Count 384 1 968
% within Age Group 99.7% .3% 100.0%
% within Women need
computer training46.9% 50.0% 46.9%
25-35
Count 394 1 992
% within Age Group 99.7% .3% 100.0%
% within Women need
computer training48.1% 50.0% 48.1%
35-45
Count 41 0 103
% within Age Group 100.0% .0% 100.0%
% within Women need
computer training5.0% .0% 5.0%
Total
Count 819 2 821
% within Age Group 99.8% .2% 100.0%
% within Women need
computer training100.0% 100.0% 100.0%
Table 3.19A Chi-Square Tests
Value df Asymp. Sig. (2-sided)
Pearson Chi-Square .106* 2 .949
* 3 cells (50.0%) have expected count less than 5. The minimum expected count is .10.
3.23 AGE GROUP AND SOURCE OF INFORMATION
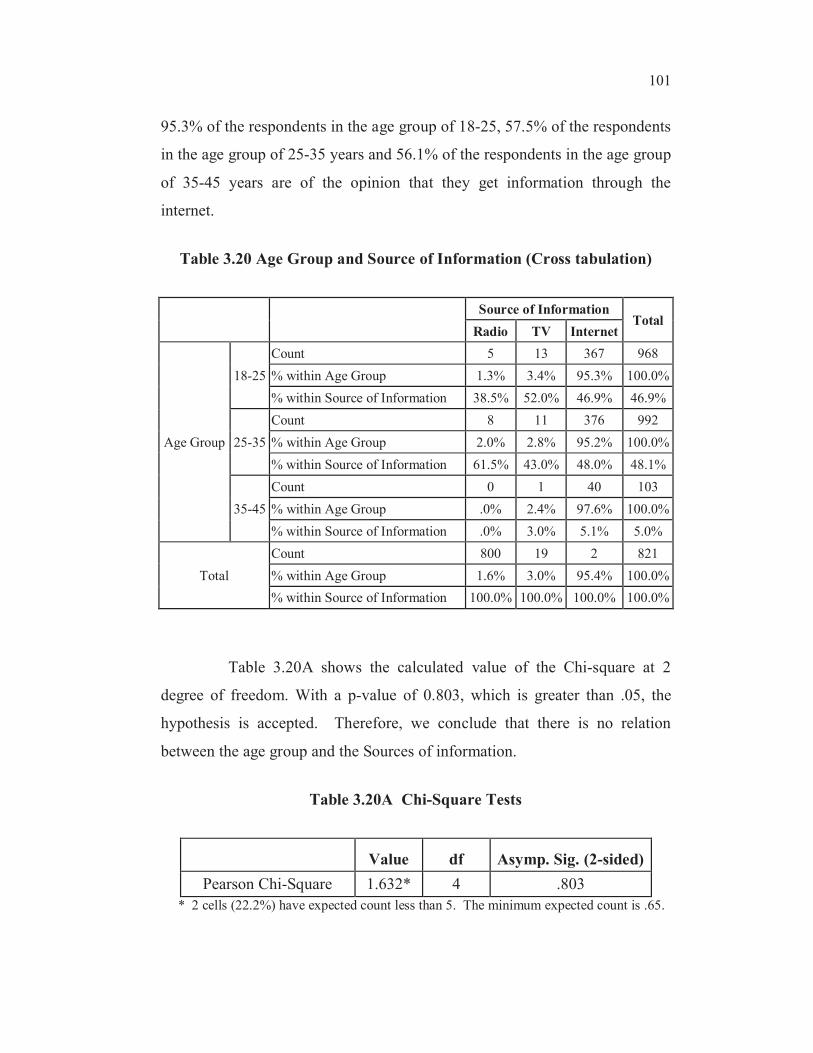
Table 3.20 shows the cross tabulation of Age group of the
respondents’ and the Sources of information. The null hypothesis is that the
age group of the respondents has no relation to the Sources of information.
101
95.3% of the respondents in the age group of 18-25, 57.5% of the respondents
in the age group of 25-35 years and 56.1% of the respondents in the age group
of 35-45 years are of the opinion that they get information through the
internet.
Table 3.20 Age Group and Source of Information (Cross tabulation)
Source of InformationTotal
Radio TV Internet
Age Group
18-25
Count 5 13 367 968
% within Age Group 1.3% 3.4% 95.3% 100.0%
% within Source of Information 38.5% 52.0% 46.9% 46.9%
25-35
Count 8 11 376 992
% within Age Group 2.0% 2.8% 95.2% 100.0%
% within Source of Information 61.5% 43.0% 48.0% 48.1%
35-45
Count 0 1 40 103
% within Age Group .0% 2.4% 97.6% 100.0%
% within Source of Information .0% 3.0% 5.1% 5.0%
Total
Count 800 19 2 821
% within Age Group 1.6% 3.0% 95.4% 100.0%
% within Source of Information 100.0% 100.0% 100.0% 100.0%
Table 3.20A shows the calculated value of the Chi-square at 2
degree of freedom. With a p-value of 0.803, which is greater than .05, the
hypothesis is accepted. Therefore, we conclude that there is no relation
between the age group and the Sources of information.
Table 3.20A Chi-Square Tests
Value df Asymp. Sig. (2-sided)
Pearson Chi-Square 1.632* 4 .803
* 2 cells (22.2%) have expected count less than 5. The minimum expected count is .65.
102
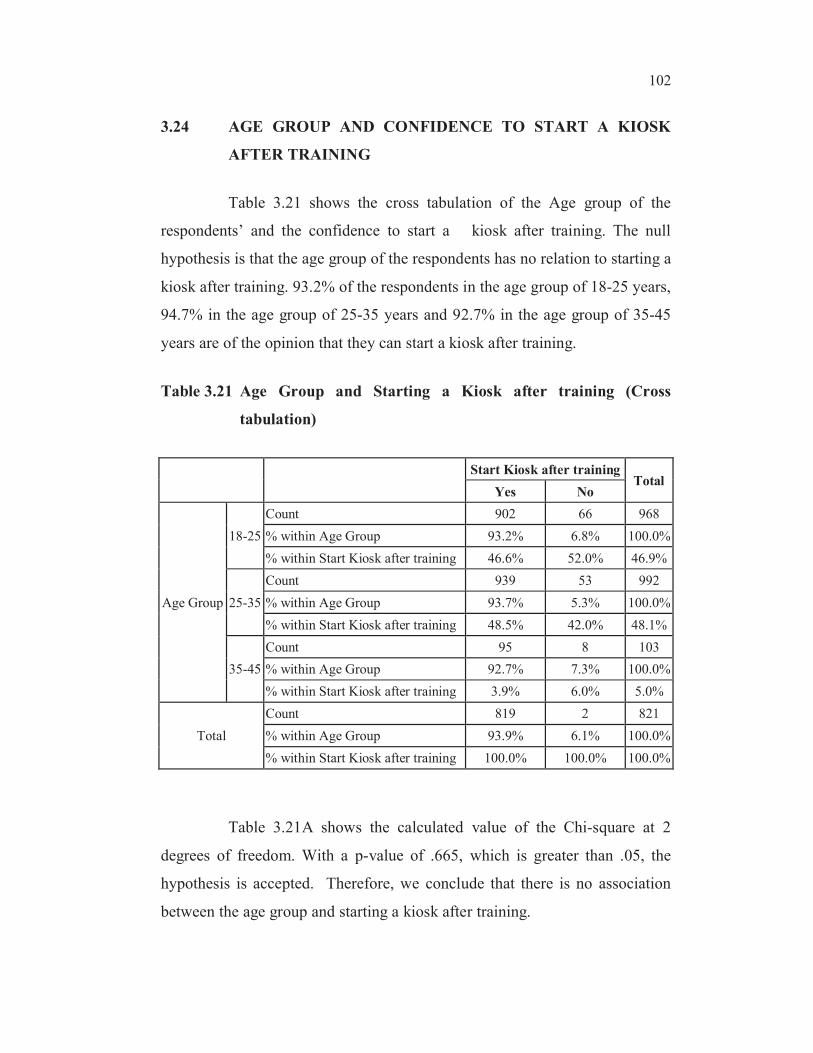
3.24 AGE GROUP AND CONFIDENCE TO START A KIOSK
AFTER TRAINING
Table 3.21 shows the cross tabulation of the Age group of the
respondents’ and the confidence to start a kiosk after training. The null
hypothesis is that the age group of the respondents has no relation to starting a
kiosk after training. 93.2% of the respondents in the age group of 18-25 years,
94.7% in the age group of 25-35 years and 92.7% in the age group of 35-45
years are of the opinion that they can start a kiosk after training.
Table 3.21 Age Group and Starting a Kiosk after training (Cross
tabulation)
Start Kiosk after trainingTotal
Yes No
Age Group
18-25
Count 902 66 968
% within Age Group 93.2% 6.8% 100.0%
% within Start Kiosk after training 46.6% 52.0% 46.9%
25-35
Count 939 53 992
% within Age Group 93.7% 5.3% 100.0%
% within Start Kiosk after training 48.5% 42.0% 48.1%
35-45
Count 95 8 103
% within Age Group 92.7% 7.3% 100.0%
% within Start Kiosk after training 3.9% 6.0% 5.0%
Total
Count 819 2 821
% within Age Group 93.9% 6.1% 100.0%
% within Start Kiosk after training 100.0% 100.0% 100.0%
Table 3.21A shows the calculated value of the Chi-square at 2
degrees of freedom. With a p-value of .665, which is greater than .05, the
hypothesis is accepted. Therefore, we conclude that there is no association
between the age group and starting a kiosk after training.

103
Table 3.21A Chi-Square Tests
Value df Asymp. Sig. (2-sided)
Pearson Chi-Square .817* 2 .665
* 1 cells (16.7%) have expected count less than 5. The minimum expected count
is 2.50.
3.25 AGE GROUP AND CONFIDENCE TO EARN PROFIT
THROUGH KIOSK
Table 3.22 shows the cross tabulation of the Age group of the
respondents’ confidence to earn profit through a kiosk. The null hypothesis is
that the age group of the respondents has no relation to the confidence to earn
profit through a kiosk. 97.9% of the respondents in the age group of 18-25
years opinion that they earn profit through kiosk, 97.5% of the respondents in
the age group of 25-35 years opinion that they earn and 97.6% of the
respondents in the age group of 35-45 years are of the opinion that they earn
profit through a kiosk.
Table 3.22 Age Group and Confidence To Earn Profit through Kiosk
(Cross tabulation)
Earn Profit through KioskTotal
Yes No
Age Group
18-25
Count 948 20 968
% within Age Group 97.9% 2.1% 100.0%
% within Earn Profit through Kiosk 47.0% 42.1% 46.9%
25-35
Count 967 25 992
% within Age Group 97.5% 2.5% 100.0%
% within Earn Profit through Kiosk 48.0% 52.6% 48.1%
35-45
Count 101 2 103
% within Age Group 97.6% 2.4% 100.0%
% within Earn Profit through Kiosk 5.0% 5.3% 5.0%
Total
Count 802 19 821
% within Age Group 97.7% 2.3% 100.0%
% within Earn Profit through Kiosk 100.0% 100.0% 100.0%

104
Table 3.22A shows the calculated value of the Chi-square at 2
degrees of freedom. With a p-value of 0.914, which is greater than .05, the
hypothesis is accepted. Therefore, we conclude that there is no relation
between the age group and the confidence in earning profit through a kiosk.
Table 3.22A Chi-Square Tests
Value Df Asymp. Sig. (2-sided)
Pearson Chi-Square .181* 2 .914
* 1 cells (16.7%) have expected count less than 5. The minimum expected count is .95.
3.26 EDUCATIONAL QUALIFICATION AND COMPUTER
TRAINING NEED FOR WOMEN
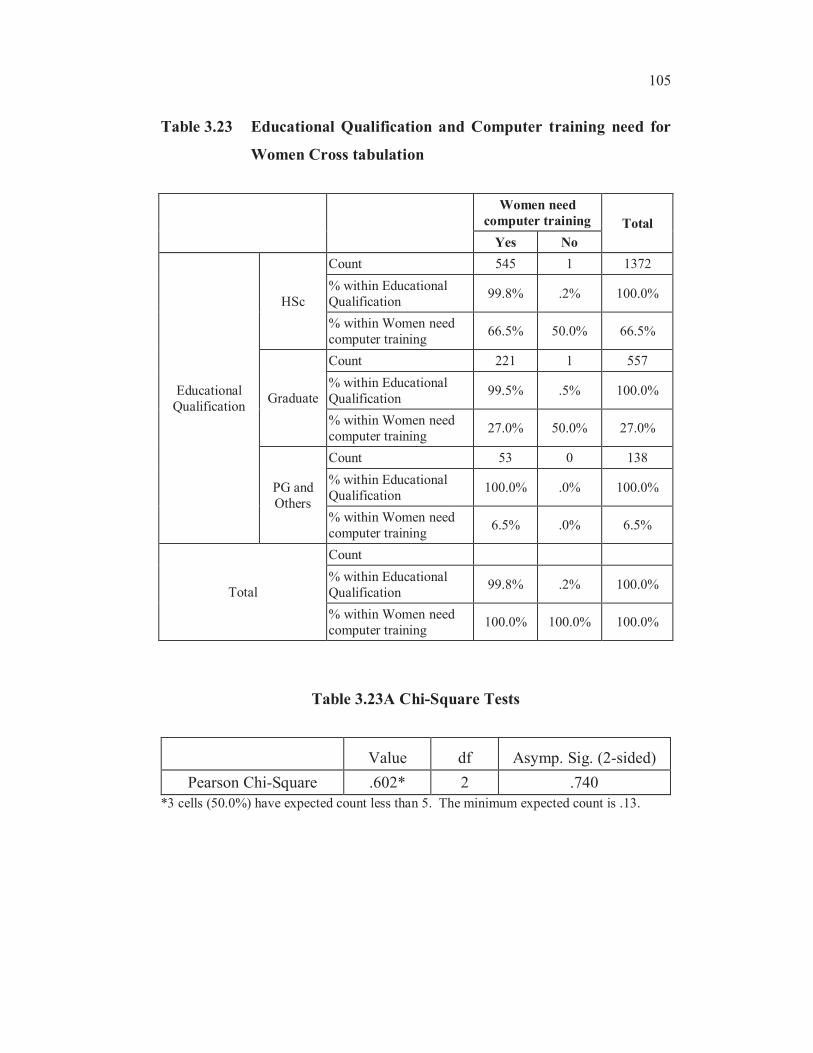
Table 3.23 shows the cross tabulation of the Educational
Qualification of the respondents and Women’s need for computer training.
The null hypothesis is that the Educational Qualification of the respondents
has no relation to Women need for computer training. 99.8% of the
respondents who are matriculates, 99.5% of the respondents who are
graduates and 100% of the respondents who are post graduates are of the
opinion that women need computer training.
Table 3.23A shows the value of the Chi-square at 2 degrees of
freedom (0.740) is more than 0.05. Therefore, the null hypothesis is accepted
and we conclude that there is no relation between the Educational
Qualification of the respondents and the sources of information. This
indicates that the education qualification is not a barrier, and with any
educational qualification women are interested in learning computer.
105
Table 3.23 Educational Qualification and Computer training need for
Women Cross tabulation
Women need
computer training Total
Yes No
Educational
Qualification
HSc
Count 545 1 1372
% within Educational
Qualification99.8% .2% 100.0%
% within Women need
computer training66.5% 50.0% 66.5%
Graduate
Count 221 1 557
% within Educational
Qualification99.5% .5% 100.0%
% within Women need
computer training27.0% 50.0% 27.0%
PG and
Others
Count 53 0 138
% within Educational
Qualification100.0% .0% 100.0%
% within Women need
computer training6.5% .0% 6.5%
Total
Count
% within Educational
Qualification99.8% .2% 100.0%
% within Women need
computer training100.0% 100.0% 100.0%
Table 3.23A Chi-Square Tests
Value df Asymp. Sig. (2-sided)
Pearson Chi-Square .602* 2 .740
*3 cells (50.0%) have expected count less than 5. The minimum expected count is .13.
106
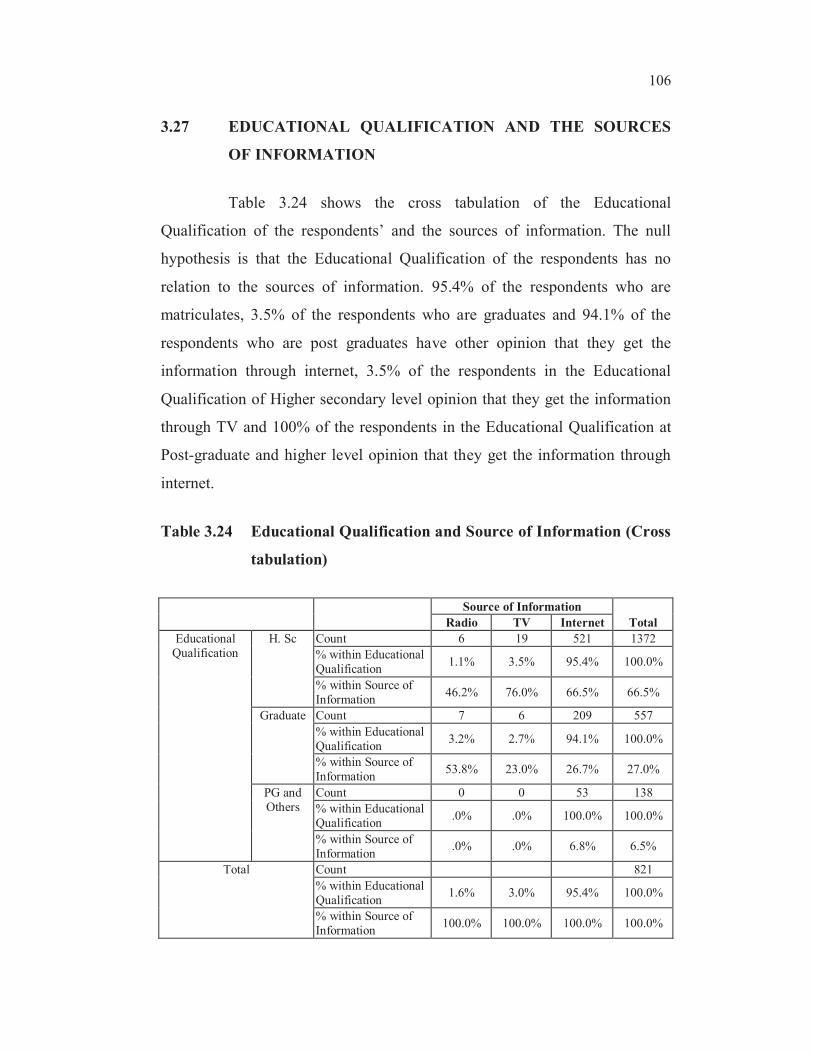
3.27 EDUCATIONAL QUALIFICATION AND THE SOURCES
OF INFORMATION
Table 3.24 shows the cross tabulation of the Educational
Qualification of the respondents’ and the sources of information. The null
hypothesis is that the Educational Qualification of the respondents has no
relation to the sources of information. 95.4% of the respondents who are
matriculates, 3.5% of the respondents who are graduates and 94.1% of the
respondents who are post graduates have other opinion that they get the
information through internet, 3.5% of the respondents in the Educational
Qualification of Higher secondary level opinion that they get the information
through TV and 100% of the respondents in the Educational Qualification at
Post-graduate and higher level opinion that they get the information through
internet.
Table 3.24 Educational Qualification and Source of Information (Cross
tabulation)
Source of Information
TotalRadio TV Internet
Educational
Qualification
H. Sc Count 6 19 521 1372
% within Educational
Qualification1.1% 3.5% 95.4% 100.0%
% within Source of
Information46.2% 76.0% 66.5% 66.5%
Graduate Count 7 6 209 557
% within Educational
Qualification3.2% 2.7% 94.1% 100.0%
% within Source of
Information53.8% 23.0% 26.7% 27.0%
PG and
Others
Count 0 0 53 138
% within Educational
Qualification.0% .0% 100.0% 100.0%
% within Source of
Information.0% .0% 6.8% 6.5%
Total Count 821
% within Educational
Qualification1.6% 3.0% 95.4% 100.0%
% within Source of
Information100.0% 100.0% 100.0% 100.0%

107
Table 3.24A shows the value of the Chi-square at 2 degrees of
freedom (0.121) is more than 0.05. Therefore, the null hypothesis is accepted
and we conclude that there is no association between the Educational
Qualification of the respondents’ and the sources of information. This
indicates that respondents are able to access information through various
sources like television, radio, newspaper and internet and this does not have
any relationship with educational qualification.
Table 3.24A Chi-Square Tests
Value df Asymp. Sig. (2-sided)
Pearson Chi-Square 7.296* 4 .121
* 3 cells (33.3%) have expected count less than 5. The minimum expected count is .83.
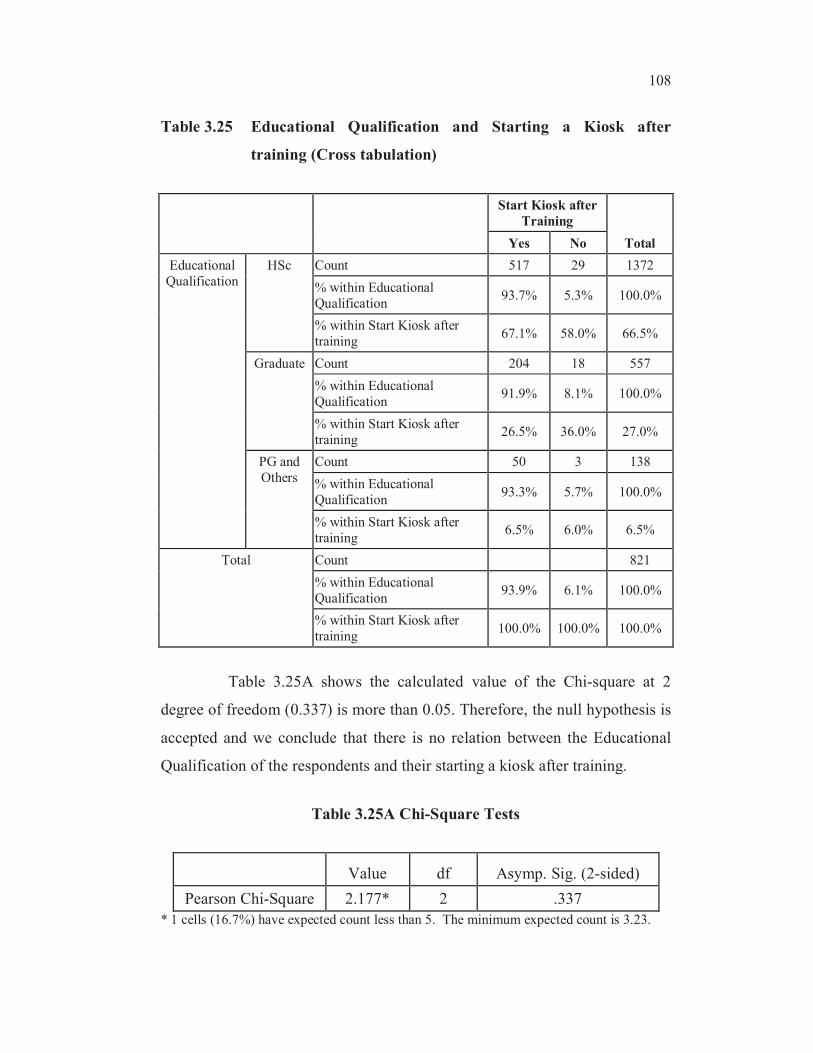
3.28 EDUCATIONAL QUALIFICATION AND STARTING A
KIOSK AFTER TRAINING
Table 3.25 shows the cross tabulation of the Educational
Qualification of the respondents and their starting a kiosk after training. The
null hypothesis is that the Educational Qualification of the respondents has no
relation to their starting a kiosk after training. 94.7% of the respondents who
are matriculates, 91.9% of the respondents who are graduates and 94.3% of
the respondents who are post graduates or have other Educational
Qualifications are of the opinion that they can start a kiosk after training.
108
Table 3.25 Educational Qualification and Starting a Kiosk after
training (Cross tabulation)
Start Kiosk after
Training
TotalYes No
Educational
Qualification
HSc Count 517 29 1372
% within Educational
Qualification93.7% 5.3% 100.0%
% within Start Kiosk after
training67.1% 58.0% 66.5%
Graduate Count 204 18 557
% within Educational
Qualification91.9% 8.1% 100.0%
% within Start Kiosk after
training26.5% 36.0% 27.0%
PG and
Others
Count 50 3 138
% within Educational
Qualification93.3% 5.7% 100.0%
% within Start Kiosk after
training6.5% 6.0% 6.5%
Total Count 821
% within Educational
Qualification93.9% 6.1% 100.0%
% within Start Kiosk after
training100.0% 100.0% 100.0%
Table 3.25A shows the calculated value of the Chi-square at 2
degree of freedom (0.337) is more than 0.05. Therefore, the null hypothesis is
accepted and we conclude that there is no relation between the Educational
Qualification of the respondents and their starting a kiosk after training.
Table 3.25A Chi-Square Tests
Value df Asymp. Sig. (2-sided)
Pearson Chi-Square 2.177* 2 .337
* 1 cells (16.7%) have expected count less than 5. The minimum expected count is 3.23.
109
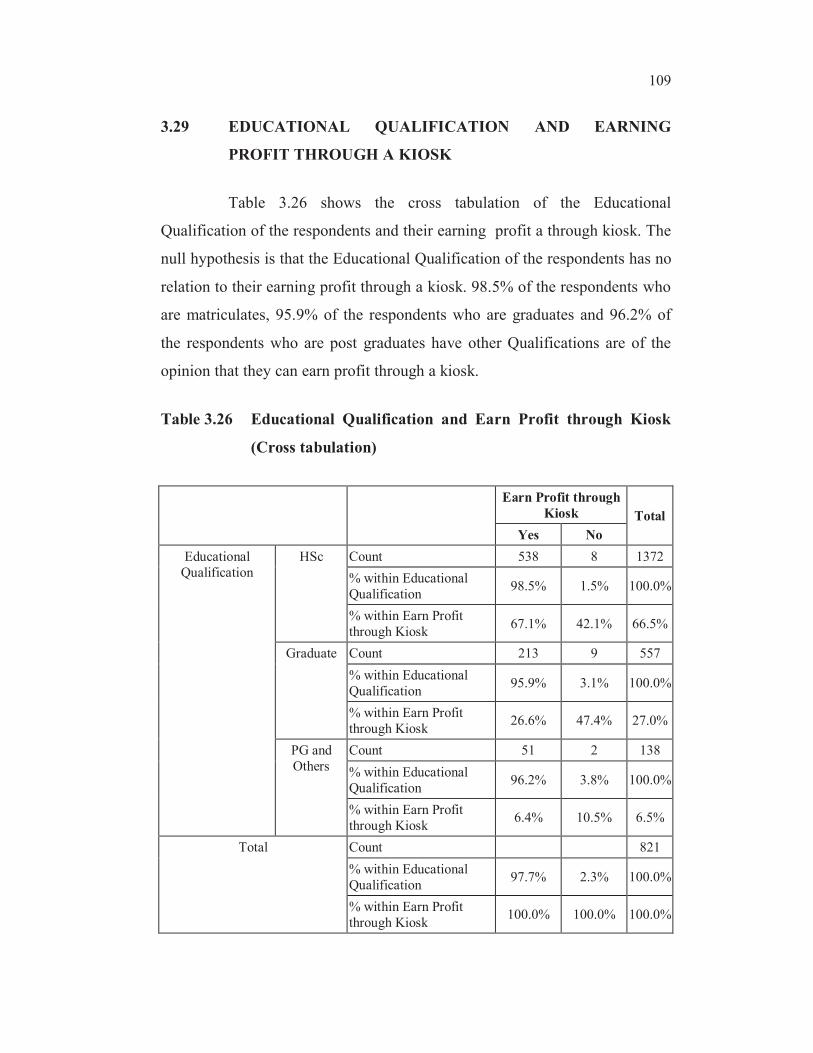
3.29 EDUCATIONAL QUALIFICATION AND EARNING
PROFIT THROUGH A KIOSK
Table 3.26 shows the cross tabulation of the Educational
Qualification of the respondents and their earning profit a through kiosk. The
null hypothesis is that the Educational Qualification of the respondents has no
relation to their earning profit through a kiosk. 98.5% of the respondents who
are matriculates, 95.9% of the respondents who are graduates and 96.2% of
the respondents who are post graduates have other Qualifications are of the
opinion that they can earn profit through a kiosk.
Table 3.26 Educational Qualification and Earn Profit through Kiosk
(Cross tabulation)
Earn Profit through
Kiosk Total
Yes No
Educational
Qualification
HSc Count 538 8 1372
% within Educational
Qualification98.5% 1.5% 100.0%
% within Earn Profit
through Kiosk67.1% 42.1% 66.5%
Graduate Count 213 9 557
% within Educational
Qualification95.9% 3.1% 100.0%
% within Earn Profit
through Kiosk26.6% 47.4% 27.0%
PG and
Others
Count 51 2 138
% within Educational
Qualification96.2% 3.8% 100.0%
% within Earn Profit
through Kiosk6.4% 10.5% 6.5%
Total Count 821
% within Educational
Qualification97.7% 2.3% 100.0%
% within Earn Profit
through Kiosk100.0% 100.0% 100.0%

110
Table 3.26A shows the value of the Chi-square at 2 degrees of
freedom (0.074) is more than 0.05. Therefore, the null hypothesis is accepted
and we conclude that there is no relation between the Educational
Qualification of the respondents and their earning profit through a kiosk.
Table 3.26A Chi-Square Tests
Value df Asymp. Sig. (2-sided)
Pearson Chi-Square 5.213* 2 .074
*1 cells (16.7%) have expected count less than 5. The minimum expected count is 1.23.
3.30 TYPING SKILLS AND COMPUTER TRAINING NEED FOR
WOMEN
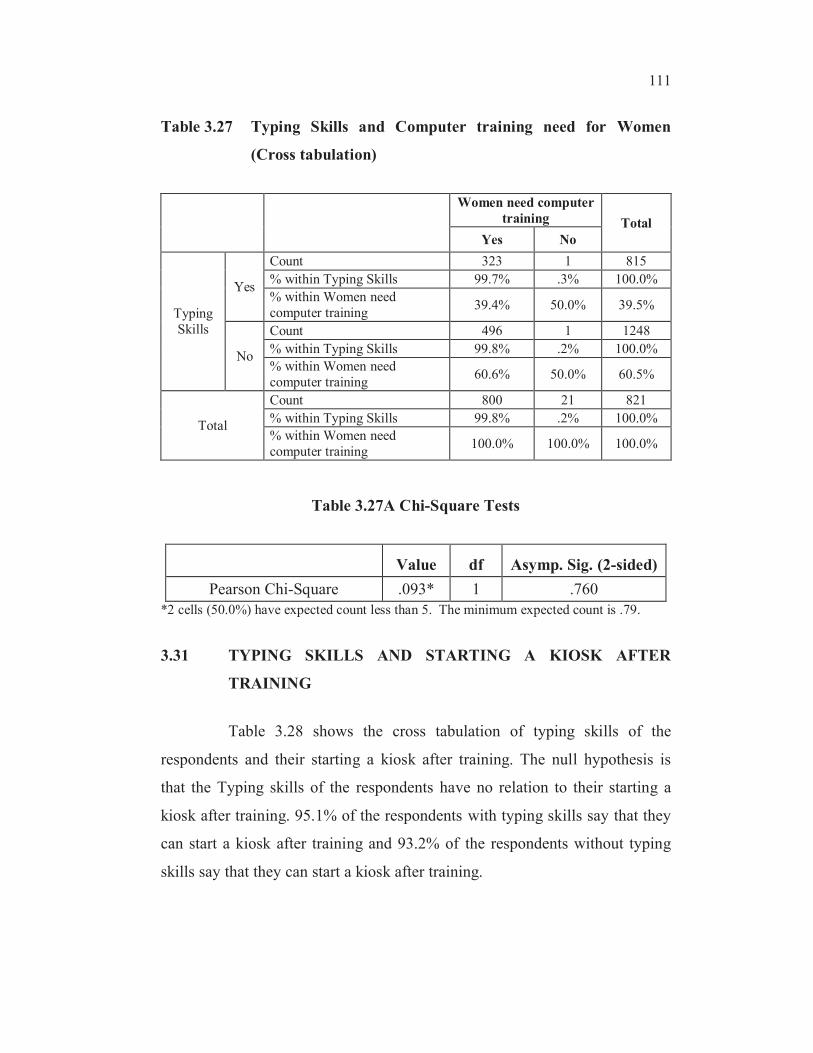
Table 3.27 shows the cross tabulation of the Typing skills of the
respondents and Women’s need for computer training. The null hypothesis is
the Typing skills of the respondents have no relation to Women’s need for
computer training. 99.7% of the respondents with typing skills felt that
Women need computer training, 99.8% of the respondents with typing skills
felt that the Women do no need computer training.
Table 3.27A shows the value of the Chi-square at 2 degrees of
freedom (0.760) is more than 0.05. Therefore, the null hypothesis is accepted,
and we conclude that the Typing skills of the respondents have no relation to
Women’s need for computer training. This indicates that the typing skill is not
the essential skill for computer training; even without typing skills women
can get computer training.
111
Table 3.27 Typing Skills and Computer training need for Women
(Cross tabulation)
Women need computer
training Total
Yes No
Typing
Skills
Yes
Count 323 1 815
% within Typing Skills 99.7% .3% 100.0%
% within Women need
computer training39.4% 50.0% 39.5%
No
Count 496 1 1248
% within Typing Skills 99.8% .2% 100.0%
% within Women need
computer training60.6% 50.0% 60.5%
Total
Count 800 21 821
% within Typing Skills 99.8% .2% 100.0%
% within Women need
computer training100.0% 100.0% 100.0%
Table 3.27A Chi-Square Tests
Value df Asymp. Sig. (2-sided)
Pearson Chi-Square .093* 1 .760
*2 cells (50.0%) have expected count less than 5. The minimum expected count is .79.
3.31 TYPING SKILLS AND STARTING A KIOSK AFTER
TRAINING
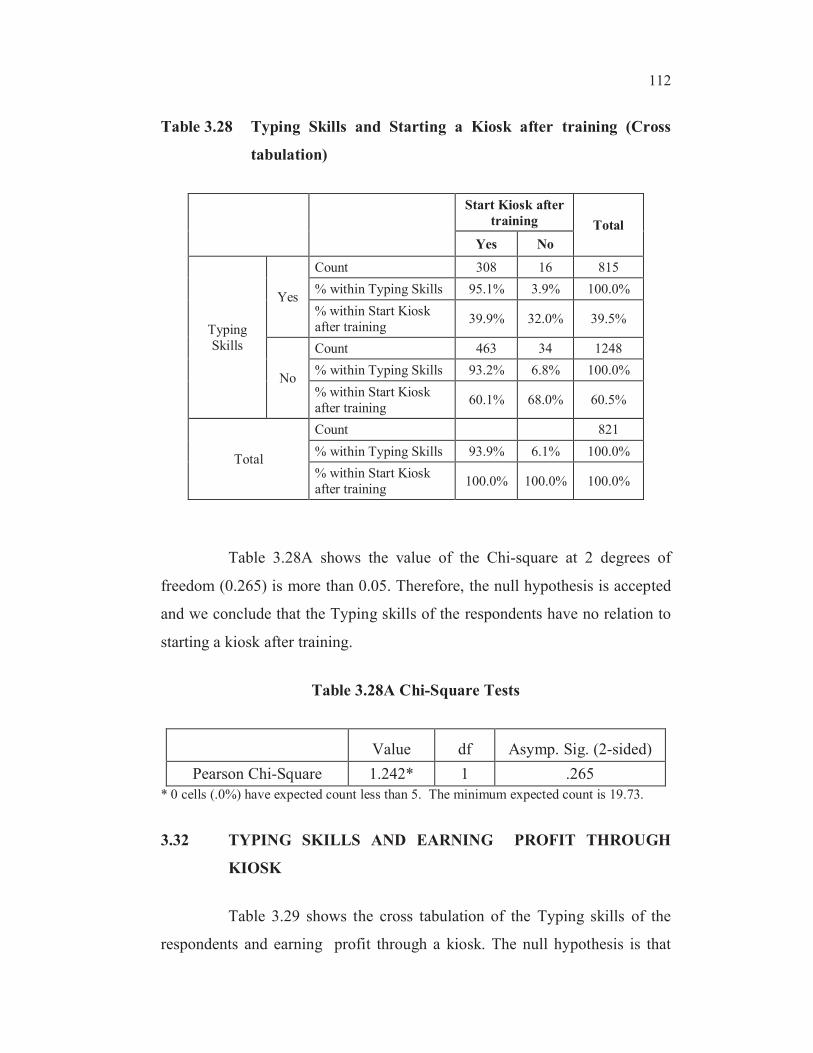
Table 3.28 shows the cross tabulation of typing skills of the
respondents and their starting a kiosk after training. The null hypothesis is
that the Typing skills of the respondents have no relation to their starting a
kiosk after training. 95.1% of the respondents with typing skills say that they
can start a kiosk after training and 93.2% of the respondents without typing
skills say that they can start a kiosk after training.
112
Table 3.28 Typing Skills and Starting a Kiosk after training (Cross
tabulation)
Start Kiosk after
training Total
Yes No
Typing
Skills
Yes
Count 308 16 815
% within Typing Skills 95.1% 3.9% 100.0%
% within Start Kiosk
after training39.9% 32.0% 39.5%
No
Count 463 34 1248
% within Typing Skills 93.2% 6.8% 100.0%
% within Start Kiosk
after training60.1% 68.0% 60.5%
Total
Count 821
% within Typing Skills 93.9% 6.1% 100.0%
% within Start Kiosk
after training100.0% 100.0% 100.0%
Table 3.28A shows the value of the Chi-square at 2 degrees of
freedom (0.265) is more than 0.05. Therefore, the null hypothesis is accepted
and we conclude that the Typing skills of the respondents have no relation to
starting a kiosk after training.
Table 3.28A Chi-Square Tests
Value df Asymp. Sig. (2-sided)
Pearson Chi-Square 1.242* 1 .265
* 0 cells (.0%) have expected count less than 5. The minimum expected count is 19.73.
3.32 TYPING SKILLS AND EARNING PROFIT THROUGH
KIOSK
Table 3.29 shows the cross tabulation of the Typing skills of the
respondents and earning profit through a kiosk. The null hypothesis is that
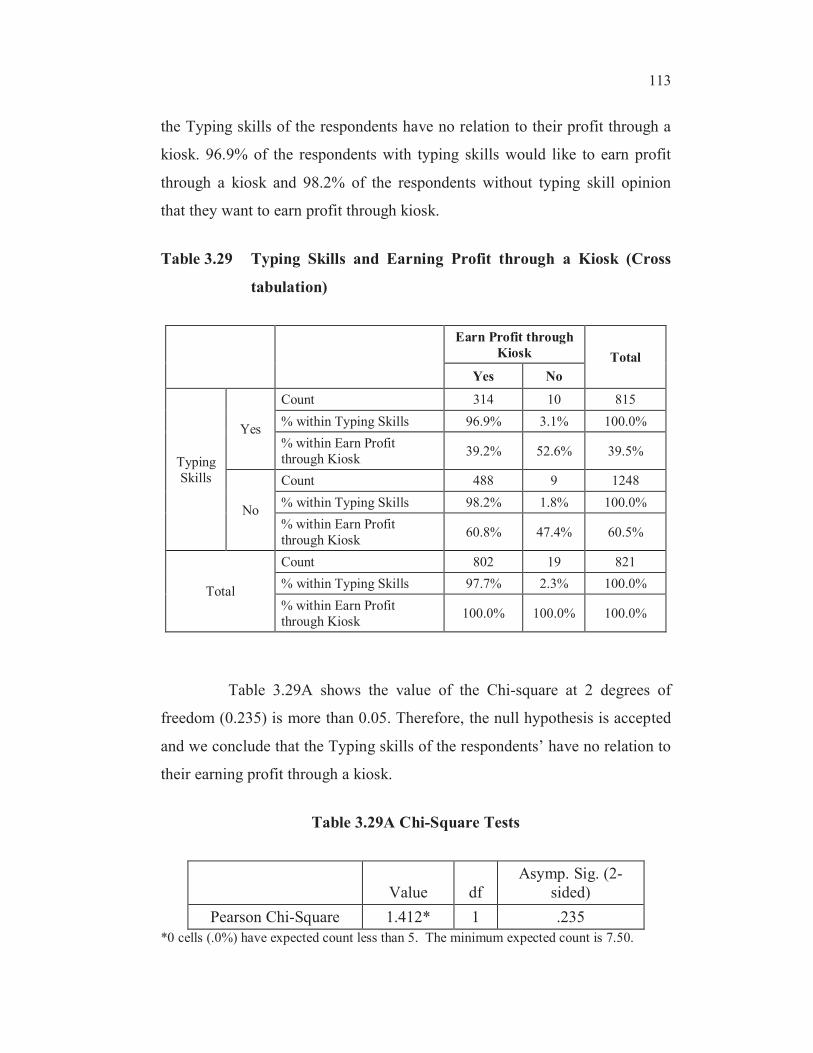
113
the Typing skills of the respondents have no relation to their profit through a
kiosk. 96.9% of the respondents with typing skills would like to earn profit
through a kiosk and 98.2% of the respondents without typing skill opinion
that they want to earn profit through kiosk.
Table 3.29 Typing Skills and Earning Profit through a Kiosk (Cross
tabulation)
Earn Profit through
Kiosk Total
Yes No
Typing
Skills
Yes
Count 314 10 815
% within Typing Skills 96.9% 3.1% 100.0%
% within Earn Profit
through Kiosk39.2% 52.6% 39.5%
No
Count 488 9 1248
% within Typing Skills 98.2% 1.8% 100.0%
% within Earn Profit
through Kiosk60.8% 47.4% 60.5%
Total
Count 802 19 821
% within Typing Skills 97.7% 2.3% 100.0%
% within Earn Profit
through Kiosk100.0% 100.0% 100.0%
Table 3.29A shows the value of the Chi-square at 2 degrees of
freedom (0.235) is more than 0.05. Therefore, the null hypothesis is accepted
and we conclude that the Typing skills of the respondents’ have no relation to
their earning profit through a kiosk.
Table 3.29A Chi-Square Tests
Value df
Asymp. Sig. (2-
sided)
Pearson Chi-Square 1.412* 1 .235
*0 cells (.0%) have expected count less than 5. The minimum expected count is 7.50.

114
3.33 COMPUTER KNOWLEDGE FOR THE WOMEN TO START
A KIOSK AFTER TRAINING
Table 3.30 shows the cross tabulation of Women’s need for
computer knowledge to start a kiosk after training. The null hypothesis is that
the women’s need for computer knowledge has no relation to the starting of a
kiosk after training. 93.9% of the respondents felt that Women need computer
knowledge to start a kiosk after training, 94.7% of the respondents felt that
Women do not need computer knowledge to start a kiosk after training.
Table 3.30 Women need computer knowledge to Start a Kiosk after
training (Cross tabulation)
Start Kiosk after
training Total
Yes No
Women need
computer knowledge
Yes
Count 753 49 2016
% within Women needcomputer knowledge
93.9% 6.1% 100.0%
% within Start Kiosk after
training97.7% 98.0% 97.7%
No
Count 18 1 47
% within Women needcomputer knowledge
93.7% 5.3% 100.0%
% within Start Kiosk after
training2.3% 2.0% 2.3%
Total
Count 771 50 821
% within Women need
computer knowledge93.9% 6.1% 100.0%
% within Start Kiosk after
training100.0% 100.0% 100.0%
Table 3.30A shows that the value of the Chi-square at 2 degrees of
freedom (0.879) is more than 0.05. Therefore, the null hypothesis is accepted
and we conclude that the Typing skills of the respondents have no relation to
Women’s need for computer training.

115
Table 3.30A Chi-Square Tests
Value df Asymp. Sig. (2-sided)
Pearson Chi-Square .023* 1 .879
* 1 cells (25.0%) have expected count less than 5. The minimum expected count is 1.16.
3.34 FINDINGS FROM TRAINING OF SHG WOMEN
It is found that the majority of the respondents do not use a
computer, through most of them are willing to learn to use it. The SHG
members, irrespective of the age group, are interested to start kiosk after
training. Most of the respondents felt that the village requires computers to
get information on health and Government services. The level of education
and the media are important barriers in the access to ICT tools by the SHG
members.
The SHG women members invariably watch television, which is
the primary medium through which they get their information. A majority of
the SHG member feel that the TV is the most useful medium through which
they get the information. Majority of the SHG members face the problem with
telecommunication facility in their villages. Lack of education and training is
the major problem for the SHGs.
The members were not quite aware of the ICT tools and their
benefits. It is therefore concluded that Television is the important medium to
be used to create awareness of the ICT among the SHG members. Sometimes
magazines and newspaper advertisements may also create awareness among
the members who are using these media to get the information.
Almost all the null hypotheses, framed to find the relationship
between Age group, literacy level of the Self Help Group members, Typing
116
Skills and Computer knowledge to start a kiosk after training, Earn profit
through kiosk, Sources of information, Need of computer training for women,
have been accepted, and we conclude that there is no relation between these
variables. They are independent.
The pre test and post test results show that training was useful for
the respondents and age was not a barrier for learning computers. Again, the
Educational levels were different among the respondents, but the computer
training undergone by the SHGs was effective. The content was sufficiently
simple for women with higher secondary education (HSC) level of education.
Middle aged women of over 35-45 also participated with enthusiasm. A
majority has at least partial exposure to the use of computers. Many have no
experience in daily business, but took part in the training. A majority have no
typing experience but were able to use computers effectively, and were also
confident in starting their own kiosk.
The Government should take necessary steps to initiate the ICT
awareness in Self Help Group through the NGOs, who are already established
in Tamil Nadu. The success stories of the SHG women may be shot as short
films and telecasted, so that they reach the majority of the SHG women
because from the research it was found that the SHG women spend more time
watching television. It will be a motivation to the SHG members, if they learn
from the success stories of other members and increase their confidence level,
which will pave the way for the improved socio-economic life of the
women.
3.35 PERCEPTION OF THE TRAINERS ABOUT THE
TRAINING
The outcome of the training was assessed after three years. But, an
in-depth analysis had already been made by the observation method, during

117
the course of the training. Interviews with trainers from various institutions
conducting the programme were also done. The opinion of the trainees
revealed the following,
3.35.1 Educational Background of the Self Help Group Women
The trainers felt that it was very easy to teach these women, as they
had the basic educational qualification. The trainees also agreed that even
though they were unable to follow the Instructions in English, it was easy to
learn as the teachers taught them in their Regional language Tamil; their basic
qualification helped them to grasp the computer terminologies easily.
3.36 ADVANTAGES OF RESIDENTIAL TRAINING
Accommodation was provided in 36 engineering colleges, except in
4 colleges in Chennai, Tamil Nadu. A few trainees in Chennai felt that they
were able to attend the training, only because it is not a residential one. Most
of the trainees felt it would have been better if it had been a residential one.
Those who are single and have no commitments, are ready to take up the
residential training programme for their career growth, but for married
women, they felt difficult to leave their family and take up the residential
training programme. But almost everybody felt that, only because of the
residential training, they were able to concentrate on their training.
According to the Chennai trainees, even though they were allowed
to practice on the computers beyond 5pm, they were not able to do so, as they
have to reach home early and take care of the household. Other trainees felt
that they would not care about the timings and would work late in the night
and keep themselves away from all their personal worries.
118
One of the SHG women from Coimbatore said that, she felt very
proud for getting selected for training. But she was able to concentrate more
on the training with given food and snacks in the residential training program.
This training program helped her to discuss and learn from others, which
would not have been possible in the other case.
3.37 TRAINING CONTENT AND TEACHING METHODOLOGY
The training was given in hardware maintenance, software skills,
and entrepreneurial management. Five sessions were allotted for teaching
hardware maintenance, and forty-one sessions for training in software skills
and for instructions on entrepreneurial management 2 sessions were allotted.
Each session was for one and a half an hour. They said that the
sessions on hardware maintenance and entrepreneurship were good. But they
felt that even after getting the practical exposure, they do not have enough
confidence, as the duration was less.
The trainees in the programme were very proud that they were
learning from prestigious engineering colleges, which they never imagined
even in their dreams. They further expressed that as they have studied only till
Xth std or XIIth std, they never expected that they will enter an engineering
college and use its facilities for improving their knowledge. They felt very
happy that they are learning from those who are teaching engineering
students.
One of the participants said that, she has not seen the computer
before the training programme and she didn’t even knew how to switch it on,
and use the mouse. She continued saying that, she was able to learn faster and
easier only because of the individual attention, given to them. The participant
said that she received continuous encouragement and the support she got from

119
the engineering staff. Another SHG woman said that, even before this training
programme, she had the aim of setting up the kiosk, for which she attended
the computer training class from a private institute. She said that the class was
for one hour, but they would teach them only for half an hour and that too,
was not clear. And there were not enough resources and they were not given
individual attention. She continued saying that when she heard about this
training programme, she thought that this would also be of the same kind. She
said that to her surprise, even though the classes were scheduled only till 5pm,
they were allowed to work till eight in the night. She also expressed her
sincere gratitude to all the staff, who helped them to clear all their doubts and
left the lab open till every participant left. She says confidently, that now she
will surely be able to run the kiosk. She says she was also happy to hear from
the college, that they can come back at anytime for clearing their doubts even
after the training programme is over.
3.38 TRAINING MATERIALS
According to the trainees, even though the CBT was more
interactive and provided an easier and faster way to understand the concept
than the training materials, it was useful to only 37 percent of them. The
others preferred the training materials. They felt that the training materials
were easy for them to refer back at anytime, whereas to learn from CBT, they
need a computer, which most of them does not have access to. The SHG
women felt that the training materials written in Tamil were very helpful to
them, as many of them were not good in English.
3.39 OTHER CONCERNS EXPRESSED BY TRAINEES
Trainers felt that, it would have been useful and informative to the
trainees, if the training materials had included topics like virus, antivirus,
benefits of licensed software, where to get the software and its price.
120
Further topics like how to instal, repair and uninstal any software would
enlighten the trainees. They further expressed the threats faced in owning a
Kiosk. For example, each kiosk has to maintain a logbook, containing the
details of those who are coming to browse. In case any mishap happens, all
these details have to be submitted to the police.
3.40 FOCUS GROUP DISCUSSION
Three years after the training programme that is during 2008, again
a sample of 100 SHG women who attended the training were invited for a
focus group discussion. The SHG women were from Chennai. The sample
size of the study is 78 SHG women who had participated in focus group were
the trainees from nearly 36 of them said that, they had the hope and
confidence of setting up a kiosk. They have also taken of few steps like
contributing some amount towards setting up kiosk, but unfortunately it was
not successful. Nearly 75% percent of them have chosen this training
programme expecting to get a computer job, or to start a new business. Only
50% percent of them chose this programme for improving their computer
knowledge. Even though 97% percent of the SHG women said that the
training was good, when asked if they had benefited from the programme,
only 36 were interested in starting their own kiosk; they wanted some kind
of motivation from the government or NGO, in the form of finance and
monitoring the business.
In The sample of 78 SHG women 47 percent felt that if given a data
entry job they would like to start their own kiosk. 35 percent were interested
to start a kiosk if the infrastructure and computer were provided by the
government or NGOs. In which 12 % felt that if bank loans were provided for
establishing a kiosk, and data entry work is given, then they will be interested
to start their own kiosk. 98 % felt training is essential before starting a kiosk,

121
and they require guidance from the government or NGO even after the
establishment of a kiosk.
This leads to the inference that the women SHG members were
benefited from the intensive training; but to establish a kiosk, they need
further help. What emerges out of the focus group discussion is that they need
financial support and assured job orders, which shows that they are not ready
to take the risk of starting a business.
3.41 SURVEY METHOD
The focus group method indicates that SHG women who had under
gone the training were not able to start their own kiosk; so to know the
obstacles and barriers faced by the SHG women, a survey method was used.
A structured questionnaire was distributed among SHG women of two
districts near Chennai region viz., Kancheepuram and Thiruvallur. This
survey was done during 2010, in which the SHG women were questioned on
four segments, demographics, source of information, computer usage, and
obstacles and barriers.
3.42 CONCLUSION
The Self Help Group women were provided with a training
programme, and based on this, it can be concluded that SHG women who
were always were associated with traditional business like tailoring, soft toy
making, food preparation, etc were given a new perspective to minimize their
digital and gender divides.
Information technology should bring about a revolution in their life.
Therefore, Tamilnadu government with the Centre for Empowerment of
Women, Anna University, trained 1006 SHG women, which was very useful

122
to them, but it did not pave the way to start a kiosk on their own. So in order
to know what was happening after training, a follow up study was taken up
during 2008, and the focus group discussion made the researcher think about
doing a further study about SHG women, to find out the obstacles and
barriers faced by them .
The pre test and post test concluded that the training provided to
them was successful. 98% of the participants said that they understood the
importance of the computer after the training. The training helped them in
gaining knowledge about the computer, it made them confident; not only
would they teach their children, but they would also teach the other Self Help
Group members, with the help of the training material and computer based
tutorials.
The training was successful, but after two years it was a surprise to
find that not even a single person had started her own kiosk ,in a sample of 78
trained Self Help Group women from Chennai region.
This triggered us to do a further study, to find the barriers and
obstacles faced by Self Help Group women in starting a kiosk of their own.