chapter - 3 traffic survey and analysis -...
TRANSCRIPT

Final Feasibility Report Page 3 - 1
Feasibility study for two-laning of Bhawi-Pipar-Khimsar (H-IV) STUP Consultants Pvt. Ltd.
CHAPTER - 3
TRAFFIC SURVEY AND ANALYSIS
3.1 Homogenous Sections
Based on the project road features settlements along the road, traffic volume etc. the
project road has been divided only in one homogenous section as given in Table 3.1 below:
Table 3.1: Homogenous Sections
Homogenous Section Chainage
(Km-Km) Length (km)
HS-1 0.000 - 31.000 (Bhawi - Sathin) 31
HS-2 Km. 31-55(Sathin to Bhopalgarh) 24
HS-3 Km. 55-71(Bhopalgarh to Palri) 16
HS-4 Km. 75-97(Lawari Piou to Khimsar) 22
Based on the above mentioned homogenous section, traffic surveys were conducted at
following location and as per schedule given below in Table 3.2:
Table 3.2: Traffic Survey locations and Schedule
Survey details Chainage Location Period of Survey Remarks
(Duration)
Classified Traffic
7 days
SH-86C KM-1+500 12.12.14 – 18.12.14 7 days
SH-86C -KM-55-500 10.12.14 – 16.12.14 7 days
SH-86C Mangeria (Km.87) 09.12.14 – 15.12.14 7 days
SH-86C Ghana Magra (Km.6) 16.12.14 – 22.12.14 7 days
Turning
Movement
Bhopalgarh Chowk 09.12.14 1 day
Lawari Chowk 04.12.14 1 day
SH-86C KM-1.300 15.12.14 1 day
Palri 04.12.14 1 day
Axle load survey SH-86C KM-55+500 11.12.14 1 day
SH-86C KM-02 12.12.14 1 day
These locations are shown in fig 3.1.
3.2 Classified Traffic Volume Count
The classified traffic volume counts were carried out at 3locations along the project road for
7 days. The vehicle classification was done as per IRC: SP 19-1991 and IRC: 9-1972

Final Feasibility Report Page 3 - 2
Feasibility study for two-laning of Bhawi-Pipar-Khimsar (H-IV) STUP Consultants Pvt. Ltd.
guidelines and vehicle category added / revised as per toll policy. The seven day count will
give average Daily Traffic (ADT). The value is then converted to passenger car units (PCUs)
for capacity Analysis. The vehicle type and PCU factors adopted are presented in Table
3.3below:
Table 3.3: Classification of vehicle for Traffic Surveys
Motorized Vehicles
Vehicle Type PCU Factor
Car / Jeep / Taxi 1.00
2-Wheeler 0.50
3-Wheeler 1.00
Bus 3.00
Mini Bus 1.50
LCV 1.50
2-Axle Truck 3.00
3-Axle Truck 3.00
MAV (4-6 Axle 4.50
MAV > 6 Axle 4.50
EME / HCM 4.50
Tractor Without Trailer 1.50
Tractor with Trailer 4.50
Non Motorised Vehicle
Cycle 0.50
Cycle Riskshaw 2.00
Animal drawn 4.00
The traffic count data would be used to interpret the existing trends regarding traffic flow at
mid blocks to determine average daily traffic, peak hour traffic, traffic composition and
variation of hourly traffic / day wise.

Final Feasibility Report Page 3 - 3
Feasibility study for two-laning of Bhawi-Pipar-Khimsar (H-IV) STUP Consultants Pvt. Ltd.
3.3 Mid Block Volume Analysis
The magnitude of traffic at each mid block (7 days) is represented in Table 3.4:
Table 3.4– ADT
Average Daily Traffic (ADT)
Vehicle Type PCU
Factor
SH-86C KM-1+500
SH-86C KM-55+500
SH-86C Mangeria
(Km. 87.000)
SH-86C Ghana Magra
(Km. 6.000)
ADT PCU ADT PCU ADT PCU ADT PCU
Tolled
Car / Jeep / Taxi / Van / utility
1.0 536 536 343 306 45 45 36 36
Mini Buses 1.5 4 6 1 1 0 0 0 0
Standard Buses 3.0 84 252 33 80 13 39 11 32
Mini LCV 1.5 164 246 158 211 31 47 28 41
LCV 1.5 24 36 54 66 1 2 1 2
Trucks - 2 Axle 3.0 205 615 221 544 12 36 10 31
Trucks - 3 Axle 3.0 219 657 67 164 4 12 3 10
MAV (4-6 Axle) 4.5 153 689 23 86 0 0 0 0
MAV (6+ Axle) 4.5 0 0 0 2 0 0 0 0
HCM / EME 4.5 5 23 5 19 0 0 0 0
Tractor 1.5 11 17 13 17 2 3 2 2
Tractor with Trailer
4.5 133 599 66 244 28 126 22 97
Total 1538 3674 984 1739 136 309 112 251
Exempted
2-Wheeler 0.5 1776 888 1762 787 224 112 118 59
3-Wheeler 1.0 31 31 2 2 1 1 1 1
Cycle 0.5 48 24 13 6 15 8 11 6
Cycle Rickshaw 2.0 0 0 0 0 1 2 1 1
Animal Cart 6.0 0 0 0 1 1 6 1 3
Total 1855 943 1777 797 242 129 131 70

Final Feasibility Report Page 3 - 4
Feasibility study for two-laning of Bhawi-Pipar-Khimsar (H-IV) STUP Consultants Pvt. Ltd.
Exempted
Car / Jeep / Van 1.0 7 7 3 3 1 1 1 1
Ambulance / Fire Tenders / Funeral
Vans 1.0 0 0 0 0 0 0 0 0
Bus 3.0 1 3 1 2 0 0 0 0
LCV 1.5 0 0 0 0 0 0 0 0
Truck 3.0 0 0 0 0 0 0 0 0
Total 8 10 4 5 1 1 1 2
Grand Total (Tolled+Exempted)
3401 4627 2765 2541 379 439 245 323
The traffic variations at all locations are given in fig. 3.2:
Fig.: 3.2
Car /Taxi
MiniBuses
Standard
Buses
MiniLCV
LCVTrucks
- 2Axle
Trucks- 3
Axle
MAV(4-6Axle)
MAV(6+
Axle)
HCM /EME
Tractor
Tractor withTrailer
MDR-75 KM-1+500 536 4 84 164 24 205 219 153 0 5 11 133
MDR-90 KM-55+500 343 1 33 158 54 221 67 23 0 5 13 66
MDR - 90 Mangeria 45 0 13 31 1 12 4 0 0 0 2 28
MDR-90 Ghana Magra 36 0 11 28 1 10 3 0 0 0 2 22
0
100
200
300
400
500
600
Traf
fic
No
s.
Traffic Variation at All Locations

Final Feasibility Report Page 3 - 5
Feasibility study for two-laning of Bhawi-Pipar-Khimsar (H-IV) STUP Consultants Pvt. Ltd.
Tollable traffic compositions at all locations are given in fig 3.3 to 3.5:
Fig.: 3.3
Fig.: 3.4
Car /Taxi34.85%
Mini Buses0.26%
Standard Buses5.46%
Mini LCV10.66%
LCV1.56%
Trucks - 2 Axle13.33%
Trucks - 3 Axle14.24%
MAV (4-6 Axle)9.95%
MAV (6+ Axle)0.00%
HCM / EME0.33%
Tractor0.72%
Tractor with Trailer8.65%
Tollable Traffic Composition at SH-86C KM-1+500
Car /Taxi34.86%
Mini Buses0.10%
Standard Buses3.35%
Mini LCV16.06%
LCV5.49%
Trucks - 2 Axle22.46%
Trucks - 3 Axle6.81%
MAV (4-6 Axle)2.34%
MAV (6+ Axle)0.00%
HCM / EME0.51%
Tractor1.32%
Tractor with Trailer6.71%
Tollable Traffic Composition at SH-86C KM-55+500

Final Feasibility Report Page 3 - 6
Feasibility study for two-laning of Bhawi-Pipar-Khimsar (H-IV) STUP Consultants Pvt. Ltd.
Fig.: 3.5
Average Day Hourly variation of traffic / daywise variation of Traffic / Average Day Traffic
Composition of all locations are shown in Fig. 3.6to3.14
Fig.: 3.6
Car /Taxi33.09%
Mini Buses0.00%
Standard Buses9.56%
Mini LCV22.79%
LCV0.74%
Trucks - 2 Axle8.82%
Trucks - 3 Axle2.94%
MAV (4-6 Axle)0.00%
MAV (6+ Axle)0.00%
HCM / EME0.00%
Tractor1.47%
Tractor with Trailer20.59%
Tollable Traffic Composition at SH-86C Mangeria (Km. 87.000)
0
50
100
150
200
250
300
350
8:0
0 t
o 9
:00
9:0
0 t
o 1
0:0
0
10
:00
to
11
:00
11
:00
to
12
:00
12
:00
to
13
:00
13
:00
to
14
:00
14
:00
to
15
:00
15
:00
to
16
:00
16
:00
to
17
:00
17
:00
to
18
:00
18
:00
to
19
:00
19
:00
to
20
:00
20
:00
to
21
:00
21
:00
to
22
:00
22
:00
to
23
:00
23
:00
to
24
:00
24
:00
to
1:0
0
1:0
0 t
o 2
:00
2:0
0 t
o 3
:00
3:0
0 t
o 4
:00
4:0
0 t
o 5
:00
5:0
0 t
o 6
:00
6:0
0 t
o 7
:00
7:0
0 t
o 8
:00
Average Day Hourly Variation of Traffic at SH-86C KM-1+500
Vehicle
PCU

Final Feasibility Report Page 3 - 7
Feasibility study for two-laning of Bhawi-Pipar-Khimsar (H-IV) STUP Consultants Pvt. Ltd.
Fig.: 3.7
Fig.: 3.8
0
50
100
150
200
250
8:0
0 t
o 9
:00
9:0
0 t
o 1
0:0
0
10
:00
to
11
:00
11
:00
to
12
:00
12
:00
to
13
:00
13
:00
to
14
:00
14
:00
to
15
:00
15
:00
to
16
:00
16
:00
to
17
:00
17
:00
to
18
:00
18
:00
to
19
:00
19
:00
to
20
:00
20
:00
to
21
:00
21
:00
to
22
:00
22
:00
to
23
:00
23
:00
to
24
:00
24
:00
to
1:0
0
1:0
0 t
o 2
:00
2:0
0 t
o 3
:00
3:0
0 t
o 4
:00
4:0
0 t
o 5
:00
5:0
0 t
o 6
:00
6:0
0 t
o 7
:00
7:0
0 t
o 8
:00
Average Day Hourly Variation of Traffic at SH-86C KM-55+500
Vehicle
PCU
0
5
10
15
20
25
30
35
40
45
8:0
0 t
o 9
:00
9:0
0 t
o 1
0:0
0
10
:00
to
11
:00
11
:00
to
12
:00
12
:00
to
13
:00
13
:00
to
14
:00
14
:00
to
15
:00
15
:00
to
16
:00
16
:00
to
17
:00
17
:00
to
18
:00
18
:00
to
19
:00
19
:00
to
20
:00
20
:00
to
21
:00
21
:00
to
22
:00
22
:00
to
23
:00
23
:00
to
24
:00
24
:00
to
1:0
0
1:0
0 t
o 2
:00
2:0
0 t
o 3
:00
3:0
0 t
o 4
:00
4:0
0 t
o 5
:00
5:0
0 t
o 6
:00
6:0
0 t
o 7
:00
7:0
0 t
o 8
:00
Average Day Hourly Variation of Traffic at SH-86C Mangeria (Km. 87.000)
Vehicle
PCU

Final Feasibility Report Page 3 - 8
Feasibility study for two-laning of Bhawi-Pipar-Khimsar (H-IV) STUP Consultants Pvt. Ltd.
Fig.: 3.9
Fig.: 3.10
0
1000
2000
3000
4000
5000
6000
Friday Saturday Sunday Monday Tuesday Wednesday Thursday
Day Wise Traffic Variation at SH-86C KM-1+500
Vehicle
PCU
0
500
1000
1500
2000
2500
3000
3500
4000
4500
Wednesday Thursday Friday Saturday Sunday Monday Tuesday
Day Wise Traffic Variation at SH-86C KM-55+500
Vehicle
PCU
Final Feasibility Report Page 3 - 9
Feasibility study for two-laning of Bhawi-Pipar-Khimsar (H-IV) STUP Consultants Pvt. Ltd.
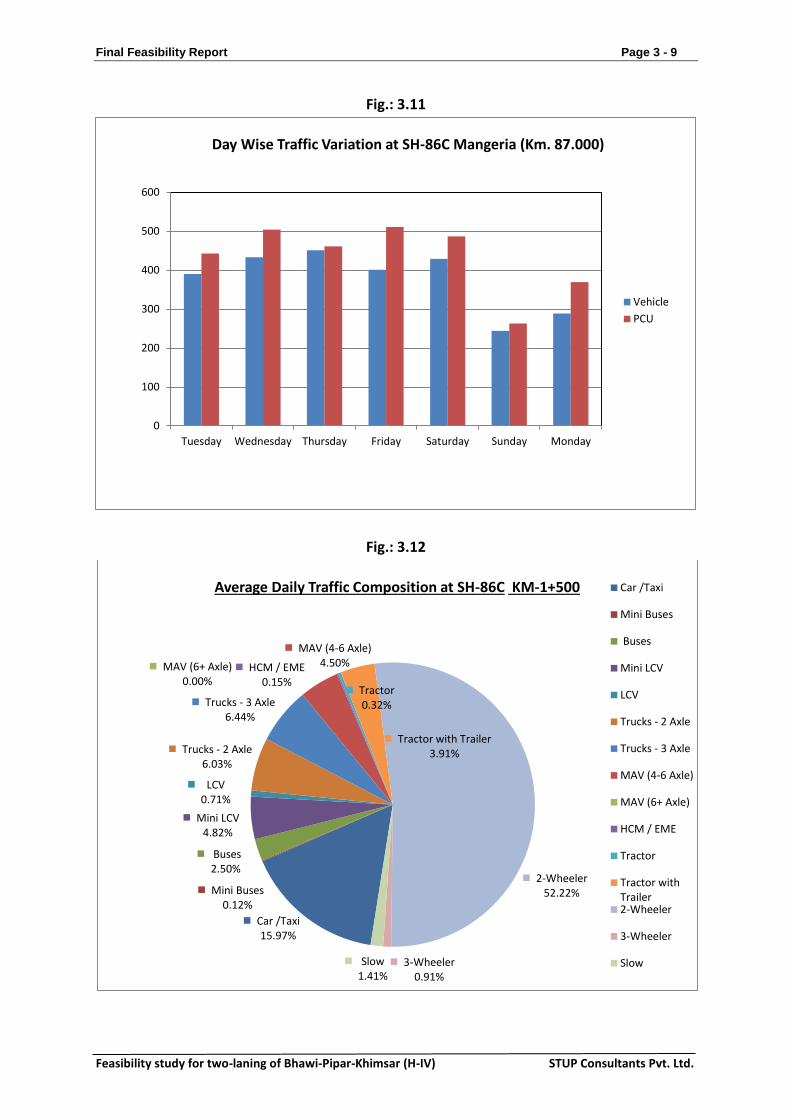
Fig.: 3.11
Fig.: 3.12
0
100
200
300
400
500
600
Tuesday Wednesday Thursday Friday Saturday Sunday Monday
Day Wise Traffic Variation at SH-86C Mangeria (Km. 87.000)
Vehicle
PCU
Car /Taxi15.97%
Mini Buses0.12%
Buses2.50%
Mini LCV4.82%
LCV0.71%
Trucks - 2 Axle6.03%
Trucks - 3 Axle6.44%
MAV (4-6 Axle)4.50%MAV (6+ Axle)
0.00%HCM / EME
0.15%Tractor0.32%
Tractor with Trailer3.91%
2-Wheeler52.22%
3-Wheeler0.91%
Slow1.41%
Average Daily Traffic Composition at SH-86C KM-1+500 Car /Taxi
Mini Buses
Buses
Mini LCV
LCV
Trucks - 2 Axle
Trucks - 3 Axle
MAV (4-6 Axle)
MAV (6+ Axle)
HCM / EME
Tractor
Tractor withTrailer2-Wheeler
3-Wheeler
Slow

Final Feasibility Report Page 3 - 10
Feasibility study for two-laning of Bhawi-Pipar-Khimsar (H-IV) STUP Consultants Pvt. Ltd.
Fig.: 3.13
Fig.: 3.14
Car /Taxi12.51%
Mini Buses0.04%
Buses1.23%
Mini LCV5.71%
LCV1.95%
Trucks - 2 Axle7.99%
Trucks - 3 Axle2.42%
MAV (4-6 Axle)0.83%
MAV (6+ Axle)0.00%
HCM / EME0.18%
Tractor0.47%
Tractor with Trailer2.39%
2-Wheeler63.73%
3-Wheeler0.07%
Slow0.47%
Average Daily Traffic Composition at SH-86C KM-55+500Car /Taxi
Mini Buses
Buses
Mini LCV
LCV
Trucks - 2 Axle
Trucks - 3 Axle
MAV (4-6 Axle)
MAV (6+ Axle)
HCM / EME
Tractor
Tractor withTrailer2-Wheeler
3-Wheeler
Slow
Car /Taxi12.14%
Mini Buses0.00%
Buses3.43%
Mini LCV8.18%
LCV0.26%
Trucks - 2 Axle3.17%
Trucks - 3 Axle1.06%
MAV (4-6 Axle)0.00%
MAV (6+ Axle)0.00%
HCM / EME0.00%
Tractor0.53%
Tractor with Trailer7.39%
2-Wheeler59.10%
3-Wheeler0.26%
Slow4.49%
Average Daily Traffic Composition at SH-86C Mangeria (Km. 87.000)Car /Taxi
Mini Buses
Buses
Mini LCV
LCV
Trucks - 2 Axle
Trucks - 3 Axle
MAV (4-6 Axle)
MAV (6+ Axle)
HCM / EME
Tractor
Tractor withTrailer2-Wheeler
3-Wheeler
Slow

Final Feasibility Report Page 3 - 11
Feasibility study for two-laning of Bhawi-Pipar-Khimsar (H-IV) STUP Consultants Pvt. Ltd.
3.4 Average Annual Daily Traffic (AADT)
For the analysis, traffic data in terms of Average Annual Daily Traffic (AADT) is needed. This
is obtained by applying Seasonal Correction Factor (SCF) to ADT. The SCF has been
calculated based on Petrol / Diesel Sales Data as collected from the Petrol pumps along the
Project Road. This data and the working out of SCF is given in Table 3.5 calculation of SCF
based on Diesel / Petrol sales date:
Table 3.5A Calculation of SCF based on Diesel / Petrol Data
Month Year
IOCL Pump At Pipar City(Km.21.000)
Seasonal Correction Factor (SCF)
Diesel (in KL)
Petrol (in KL)
Total Fuel Sale in (KL)
Diesel Petrol
April 2013 139 28 167 1.07 1.17
May 2013 147 30 177 1.02 1.09
June 2013 163 35 198 0.92 0.94
July 2013 137 20 157 1.09 1.64
August 2013 112 29 141 1.33 1.13
September 2013 135 40 175 1.11 0.82
October 2013 261 37 298 0.57 0.89
November 2013 184 38 222 0.81 0.86
December 2013 115 35 150 1.30 0.94
January 2014 147 36 183 1.02 0.91
February 2014 112 34 146 1.33 0.97
March 2014 140 32 172 1.07 1.03
Total 1792 394
Average 149 33
Table 3.5B Calculation of SCF based on Diesel / Petrol Data
Month Year
Indian oil Petrol Pump At Bhopalgarh(Km54.400)
Seasonal Correction Factor(SCF)
Diesel (in KL)
Petrol (in KL)
Total Fuel Sale in
(KL) Diesel Petrol
April 2013 138 38 176 1.01 1.16
May 2013 148 49 197 0.94 0.90

Final Feasibility Report Page 3 - 12
Feasibility study for two-laning of Bhawi-Pipar-Khimsar (H-IV) STUP Consultants Pvt. Ltd.
June 2013 162 47 209 0.86 0.94
July 2013 138 57 195 1.01 0.77
August 2013 122 50 172 1.14 0.88
September 2013 135 48 183 1.03 0.92
October 2013 160 43 203 0.87 1.02
November 2013 170 42 212 0.82 1.05
December 2013 132 25 157 1.05 1.76
January 2014 115 42 157 1.21 1.05
February 2014 113 44 157 1.23 1.00
March 2014 138 43 181 1.01 1.02
Total 1671 528
Average 139 44
Table 3.5C Calculation of SCF based on Diesel / Petrol Data
Month Year
IOCLl Pump at Lavarl (km 64.250)
Seasonal Correction Factor(SCF)
Diesel (in KL)
Petrol (in KL)
Total Fuel Sale in KL
Diesel Petrol
April 2013 28 8 36 1.07 1.01
May 2013 24 10 34 1.25 0.81
June 2013 45 8 53 0.66 1.01
July 2013 22 5 27 1.36 1.62
August 2013 21 8 29 1.42 1.01
September 2013 25 10 35 1.20 0.81
October 2013 65 9 74 0.46 0.90
November 2013 36 8 44 0.83 1.01
December 2013 26 9 35 1.15 0.90
January 2014 22 8 30 1.36 1.01
February 2014 15 6 21 1.99 1.35
March 2014 30 8 38 1.00 1.01
Total 359 97
Average 30 8

Final Feasibility Report Page 3 - 13
Feasibility study for two-laning of Bhawi-Pipar-Khimsar (H-IV) STUP Consultants Pvt. Ltd.
Since the consultant conducted the survey in Dec. 2014, the SCF and consequently the AADT
have been calculated based on the sale in the month of Nov. The values of AADT (at all
locations) thus calculated are given in the Table 3.6:
Table 3.6: AADT
Average Annual Daily Traffic (AADT)
Vehicle Type
PCU Factor
SH-86C KM-1+500 SH-86C
KM-55+500 SH-86C Mangeria
(Km. 87.000)
SH-86C Ghana Magra
(Km. 6.000)
SCF AADT PCU SCF AADT PCU SCF AADT PCU SCF AADT PCU
Tolled
Car / Jeep / Taxi
1.00 1.03 552 552 1.02 350 350 1.01 45 45 1.03 37 37
Mini Buses 1.50 1.07 4 6 1.01 1 2 1.00 0 0 1.07 0 0
Standard Buses
3.00 1.07 90 270 1.01 33 100 1.00 13 39 1.07 11 34
Mini LCV 1.50 1.03 169 253 1.02 161 242 1.01 31 47 1.03 28 43
LCV 1.50 1.07 26 39 1.01 55 82 1.00 1 2 1.07 1 2
Trucks - 2 Axle
3.00 1.07 219 658 1.01 223 670 1.00 12 36 1.07 11 33
Trucks - 3 Axle
3.00 1.07 234 703 1.01 68 203 1.00 4 12 1.07 3 10
MAV (4-6 Axle)
4.50 1.07 164 737 1.01 23 105 1.00 0 0 1.07 0 0
MAV (6+ Axle)
4.50 1.07 0 0 1.01 0 0 1.00 0 0 1.07 0 0
HCM / EME 4.50 1.07 5 24 1.01 5 23 1.00 0 0 1.07 0 0
Tractor 1.50 1.07 12 18 1.01 13 20 1.00 2 3 1.07 2 3
Tractor with Trailer
4.50 1.07 142 640 1.01 67 300 1.00 28 126 1.07 23 104
Total 1618 3900 999 2094 137 310 118 266
Non Tolled
2-Wheeler 0.5 1.03 1829 915 1.02 1797 899 1.01 226 113 1.03 122 61
3-Wheeler 1.0 1.03 32 32 1.02 2 2 1.01 1 1 1.03 1 1
Cycle 0.5 48 24 13 7 15 8 15 8
Cycle Rickshaw
2.0 0 0 0 0 1 2 1 2
Animal Cart 6.0 0 0 0 0 1 6 1 6
Total 1909 971 1812 907 244 130 139 77

Final Feasibility Report Page 3 - 14
Feasibility study for two-laning of Bhawi-Pipar-Khimsar (H-IV) STUP Consultants Pvt. Ltd.
Exempted
Car / Jeep / Van
1.0 1.03 7 7 1.02 3 3 1.01 1 1 1.03 1 1
Ambulance / Fire
Tenders / Funeral
Vans
1.0 1.03 0 0 1.02 0 0 1.01 0 0 1.03 0 0
Bus 3.0 1.07 1 3 1.01 1 3 1.00 0 0 1.07 0 0
LCV 1.5 1.07 0 0 1.01 0 0 1.00 0 0 1.07 0 0
Truck 3.0 1.07 0 0 1.01 0 0 1.00 0 0 1.07 0 0
Total 8 10 4 6 1 1 2 2
Grand Total (Tolled+Non
Tolled+Exempted) 3535 4881 2815 3008 382 441 259 345
3.5 Intersection Data Analysis
3.5 Approach Traffic
The location wise traffic at sathin intersection is presented in Table 3.7. The traffic
flow diagram at intersection location is presented in figure 3.15 – 3.18below.
Table 3.7 : Location wise traffic at each intersection
S.
No. Location Location Name
Approach
Roads
Total
Vehicles Total PCU
Approach
Traffic
1 INT – 01 Bhopalgarh
Sathin 1130 1316
8905 Asop 2860 3690
Palri 3025 3899
2 INT – 02 Palri
Bhopalgarh 433 539
3396 Gotan 838 1107
Ratri 1073 1431
Asanda 374 320
3 INT - 03 Lawari Piou
Palri 635 719
1627 Asop 596 708
Gaj Singh
pura 216 200
4 INT – 04 Pipar Bypass
Sathin 1500 1918
6301 Merta City 942 1488
Jodhpur 2055 2895

Final Feasibility Report Page 3 - 15
Feasibility study for two-laning of Bhawi-Pipar-Khimsar (H-IV) STUP Consultants Pvt. Ltd.
3.6 Axle Load Survey
Axle load Survey was conducted at the same location where TVC was done i.e. at MDR-75
KM-37+500. The Axle load Spectrum is generated by preparing a frequency distribution of
axle loads. By multiplying the respective axle load with the equivalent factor, the vehicle
damage factor (VDF) is estimated. The VDF so calculated are tabulated in table 3.8 below:
Table 3.8 Axle Load Survey
Location
Vehicle Type
Bus Mini
Bus
Mini
LCV LCV
2-Axle
truck
3-Axle
Truck
4-6 Axle
vehicle
SH-86C KM-1+500 1.27 0.28 0.045 1.61 8.87 6.64 4.83
SH-86C KM-55+500 1.11 - 0.055 1.86 11.62 9.72 6.50
3.7 Million Standard Axle (MSA)
The design traffic is considered in terms and cumulative number of standard Axle to be
carried out during the design life of the road.
Design traffic in Million Standard Axle for 10 years and 15 years (post construction) is given
belowin table 3.9:
Table 3.9 Million Standard Axle (MSA)
Homogenous Section
Km. 0.00 –Km. 31.000 Length (Km.)
10 years (Design
traffic) into MSA
15 years Design
traffic in MSA
SH-86C KM-1+500 31 12.173 20.270
SH-86C KM-55+500 41 10.220 17.018
3.8 Traffic Projections
7 days classified traffic survey has been carried out at 3locations. The traffic (AADT) at these
locations has been projected adopting growth rate of 5%.
The projection of traffic, vehicle / location wise is shown in Table 3.12 to 3.15 and the
projection in total AADT / PCU (all Traffic & tollable Traffic) are shown in Table 3.10 & 3.11.