chapter 3 the wheat-to-bread value chain - … · · 2004-08-203.4 unpacking the wheat-to-bread...
TRANSCRIPT
Part 4
CHAPTER 3
THE WHEAT-TO-BREAD VALUE CHAIN
3.1 Industry Overview
Wheat is produced mainly for human consumption with only small quantities of
poorer quality wheat marketed as stock feed. Originally, wheat was only produced in
the winter rainfall area in the Cape but was since the 1970s also cultivated in the Free
State region and increasingly under irrigation in many other production regions.
The Wheat Board controlled wheat marketing until 1997, after which market forces
prevailed to determine prices. This has left producers with more opportunities but also
with more risks. Prices, overall, are more volatile since they fluctuate between export
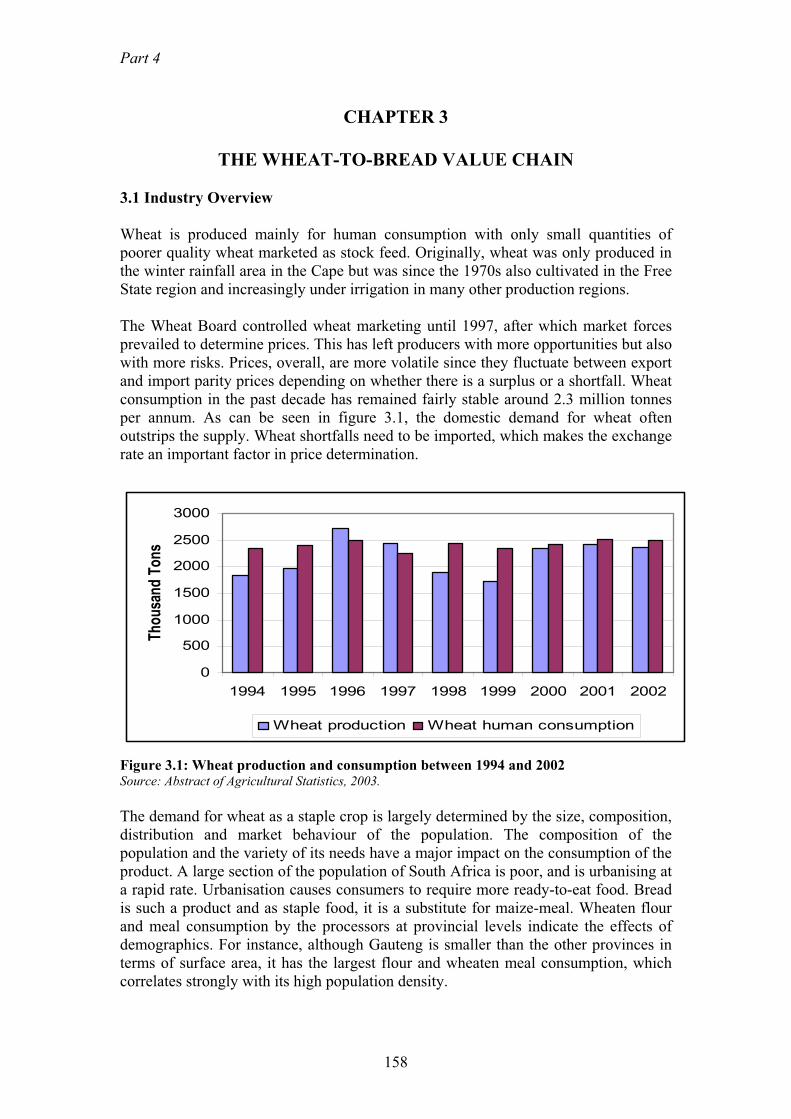
and import parity prices depending on whether there is a surplus or a shortfall. Wheat
consumption in the past decade has remained fairly stable around 2.3 million tonnes
per annum. As can be seen in figure 3.1, the domestic demand for wheat often
outstrips the supply. Wheat shortfalls need to be imported, which makes the exchange
rate an important factor in price determination.
0
500
1000
1500
2000
2500
3000
1994 1995 1996 1997 1998 1999 2000 2001 2002
Th
ou
san
d T
on
s
Wheat production Wheat human consumption
Figure 3.1: Wheat production and consumption between 1994 and 2002Source: Abstract of Agricultural Statistics, 2003.
The demand for wheat as a staple crop is largely determined by the size, composition,
distribution and market behaviour of the population. The composition of the
population and the variety of its needs have a major impact on the consumption of the
product. A large section of the population of South Africa is poor, and is urbanising at
a rapid rate. Urbanisation causes consumers to require more ready-to-eat food. Bread
is such a product and as staple food, it is a substitute for maize-meal. Wheaten flour
and meal consumption by the processors at provincial levels indicate the effects of
demographics. For instance, although Gauteng is smaller than the other provinces in
terms of surface area, it has the largest flour and wheaten meal consumption, which
correlates strongly with its high population density.
158

Analysis of selected food value chains
3.2 Market structure
Figure 3.2 illustrates the structure of the wheat-to-flour and bread supply chain.
Baking Industry
Silos
Farmer
Co-operative
Wheat
Milling Industry
Consumer
Import and
Export Markets
Animal Feed
Industry
Local Market
Retailer
Input Suppliers
Research &
Biotechnology
Figure 3.2: The wheat industry structure (Value chain)Source: Adopted from a report completed for the Competition Commission
3.2.1 Primary Industry
FarmersThe number of commercial farmers involved in wheat production in South Africa
ranges currently between 5000 and 6000. The eastern Free State and Western Cape
are the main wheat production areas. Deregulation has caused some shifts in
production areas. The Western Cape, although a fairly stable production area, is far
away from markets, a factor that increases transport costs. The Free State is closer to
the major markets but production is more erratic because it is a summer rainfall region
159

Part 4
in which a larger variety of crops can be planted. It should also be noted that more and
more wheat is grown under irrigation.
3.2.2 Secondary Industry
The secondary industry consists of the wheat milling and baking industries. The
animal feed sector does not play a major role in the demand for wheat as only poorer
quality wheat that is unsuitable for baking goes to this sector.
Market structure and concentration in the milling industry
After many years of single channel marketing, the grain industry exhibits a large
degree of concentration, the result of rationalization and improved capacity utilisation
as well as the restrictive registration of millers and bakers during the period of
controlled marketing. With the entry into market of small millers deregulation
competition within the milling industry has grown. This, in turn, has increased costs
as capacity utilization within the industry has decreased from 92% to 78%. The
number of large industrial millers declined from 6 in 1996/97 to 4 in 1998/99, with
the number of milling units declining from 137 to 109 in the same periods. Currently,
the four main milling companies are Genfoods, Pioneer, Tiger and Ruto. Their
approximate market shares are 30% for Genfoods, 27% for Pioneer, 20% for Tiger
and 10% for Ruto. The remaining 13% of the market share is attributable to the small
millers. Aside from increased competition, deregulation has also increased a
procurement risk and has forced the milling divisions into a more important role,
since price risk management strategies needed to be implemented to minimise the
risk.
Most of the major millers have vertically integrated with the plant bakeries. The
milling of wheat is a more expensive process than that of maize. Because of the
minimum tonnage specified on SAFEX contracts, small-scale millers might find the
financing needed to purchase raw material a problem. In addition, imports might also
be difficult to finance and small-scale millers might lack bargaining power. Due to the
high costs involved in milling wheat, small millers find vertical integration with
bakeries too difficult, as it might be impossible to compete with large-scale millers in
controlling procurement costs and economies of scale.
In theory, if mills run at full capacity South African mills should, generally, be able to
take advantage of economies of scale. This is however not happening, as South
African mills do not use their full capacity. Another difficulty is that South African
mills will have to compete with subsidised products being imported from the US and
EU.
Milled wheat
The milling industry converts wheat to flour for various baking purposes. The main
products are cake flour, brown bread flour and white bread flour. Cake flour and
white bread flour constitute approximately 70% of the total sales.
160

Analysis of selected food value chains
As can be seen from figure 3.3, very little growth in the sale of flour has occurred
over the past 8 years. On average imported wheat constitutes 23% of the wheat milled
for human consumption (SAGIS 2003). Sales to plant bakeries that are linked to mills
have also gone down since gradually more chain stores and other retailers have
opened their own in-house bakeries.
0
500000
1000000
1500000
2000000
2500000
3000000
1994 1995 1996 1997 1998 1999 2000 2001 2002
Wheat processed for human consumption
Wheat imported for human consumption
Figure 3.3: Wheat imported for human consumption, and wheat processed for
human consumption (tons)
The baking industry market structure and concentration
The baking industry is the major client of the milling industry. According to the South
African Chamber of Baking, bakers can be defined as: wholesale bakers who operate
industrial bakeries, independent bakers who operate stand-alone bakeries, retail
bakers who operate in-store bakeries, and emerging bakers originating from
previously disadvantaged groups using less than 1000 kg of flour per week.
Clearly, deregulation also had an impact on the baking industry, with the main effect
being an explosion of the number of bakeries. At time of deregulation, approximately
3000 bakers were registered with the Wheat Board with approximately 80% of the
bread production in the hands of 6 large baking groups. Currently, the number of
baking units is estimated at 7900, of these 85 are wholesale bakeries, 600 are in-store
corporate bakeries, 3700 are independent bakers, and 3500 are franchise bakers (this
includes franchise in-store bakeries, biscuit, pie and pizza outlets). The main growth
in the number of bakeries arose from the franchise in-store bakeries. It is estimated
that 53,200 informal bakers operate in non-licensed premises (note: this includes
people baking for home industries and cake decorators).
According to the National Chamber of Milling, bread flour sales decreased by 3% for
the period 1990-92 to 1999-2001, while in the same period the cake flour sales
increased by 87%, the increase of which was caused by the rapid growth of baking
outlets. This is an interesting phenomenon, particularly when it has also been noted
161

Part 4
that the sale of white and brown bread loaves grew by 5.2% and 25%, respectively.
The main reason for this is the decrease in the statutory bread mass from 800g to 700g
per loaf.
Wholesale
16%
Industrial
Bakeries
6%
Other
Consumers
19%OTC/In-Store
11%
Plant Bakeries
48%
Figure 3.4: Domestic share of flour consumption by baker category, 1995/96
Source: BTT 1999
3.3 Price formation at various levels in the supply chain
Similarly to maize, the South African market for wheat and wheat products was until
recently, controlled in a single channel system, with producer and consumer prices set
by Government. In those days, there were no price risks and there was no need for
traders. These days, the producer price of wheat is determined in a way similar to that
of maize through the SAFEX futures market, as discussed in Chapter 1.
3.4 Unpacking the wheat-to-bread value chain
A sound understanding of the dynamic functioning of the wheat-to-bread supply chain
requires the unpacking of the supply chain into five main levels through which value
adding occurs. The five main levels are the farmers, the millers, the bakers, the
retailers, and the consumers.
3.4.1 The methodology, the definitions and the results
The different prices in the five main levels in the value chain are: the average
producer price that the farmer receives as reported by SAFEX; the mill door price; the
bakers’ wholesale price; and the consumer price as reported in the AC Nielsen
database. As previously stated, the number of role players in the milling and baking
industry has expanded, although the industrial large-scale millers and bakers still have
the largest portion of the market share in the production and sales of bread. It is for
this reason that calculations of the mill door and bakers wholesale prices are based on
information supplied by both the Chamber of Milling and the South African Chamber
of Baking. The information supplied to the Committee included costs of production
and distribution. As with the maize-to-maize meal supply chain, certain assumptions
needed to be made. These assumptions were:
162
Analysis of selected food value chains
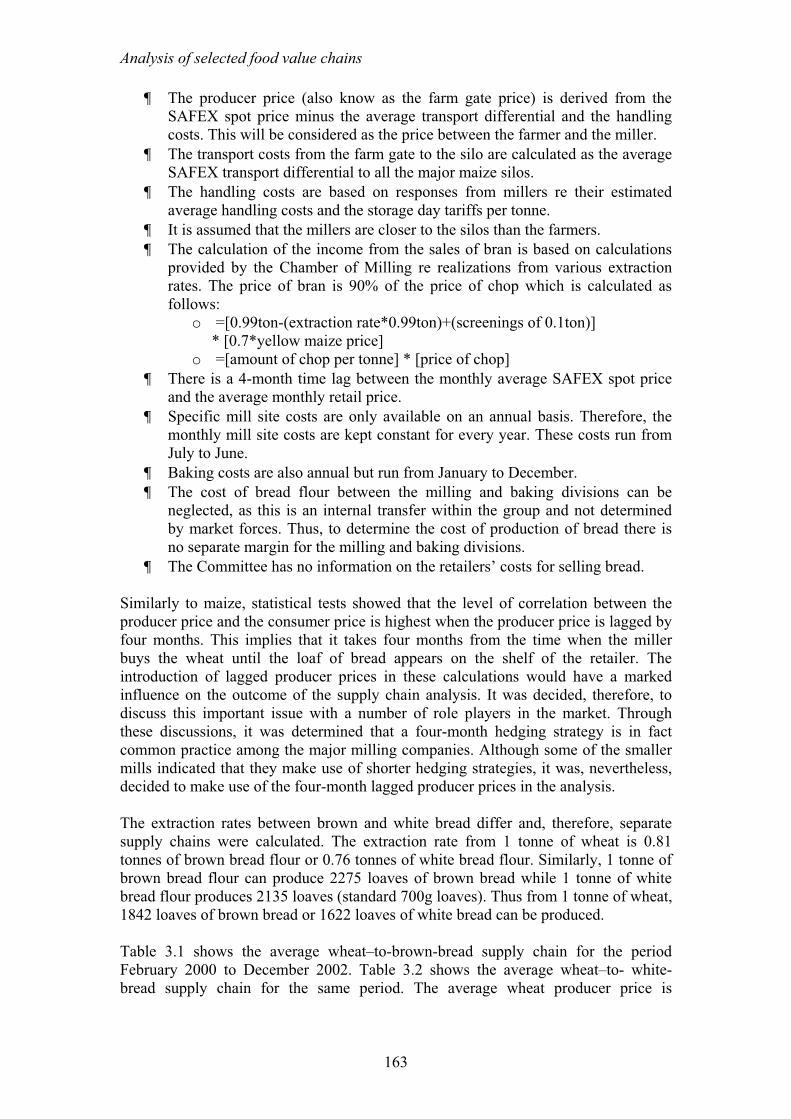
¶ The producer price (also know as the farm gate price) is derived from the
SAFEX spot price minus the average transport differential and the handling
costs. This will be considered as the price between the farmer and the miller.
¶ The transport costs from the farm gate to the silo are calculated as the average
SAFEX transport differential to all the major maize silos.
¶ The handling costs are based on responses from millers re their estimated
average handling costs and the storage day tariffs per tonne.
¶ It is assumed that the millers are closer to the silos than the farmers.
¶ The calculation of the income from the sales of bran is based on calculations
provided by the Chamber of Milling re realizations from various extraction
rates. The price of bran is 90% of the price of chop which is calculated as
follows:
o =[0.99ton-(extraction rate*0.99ton)+(screenings of 0.1ton)]
* [0.7*yellow maize price]
o =[amount of chop per tonne] * [price of chop]
¶ There is a 4-month time lag between the monthly average SAFEX spot price
and the average monthly retail price.
¶ Specific mill site costs are only available on an annual basis. Therefore, the
monthly mill site costs are kept constant for every year. These costs run from
July to June.
¶ Baking costs are also annual but run from January to December.
¶ The cost of bread flour between the milling and baking divisions can be
neglected, as this is an internal transfer within the group and not determined
by market forces. Thus, to determine the cost of production of bread there is
no separate margin for the milling and baking divisions.
¶ The Committee has no information on the retailers’ costs for selling bread.
Similarly to maize, statistical tests showed that the level of correlation between the
producer price and the consumer price is highest when the producer price is lagged by
four months. This implies that it takes four months from the time when the miller
buys the wheat until the loaf of bread appears on the shelf of the retailer. The
introduction of lagged producer prices in these calculations would have a marked
influence on the outcome of the supply chain analysis. It was decided, therefore, to
discuss this important issue with a number of role players in the market. Through
these discussions, it was determined that a four-month hedging strategy is in fact
common practice among the major milling companies. Although some of the smaller
mills indicated that they make use of shorter hedging strategies, it was, nevertheless,
decided to make use of the four-month lagged producer prices in the analysis.
The extraction rates between brown and white bread differ and, therefore, separate
supply chains were calculated. The extraction rate from 1 tonne of wheat is 0.81
tonnes of brown bread flour or 0.76 tonnes of white bread flour. Similarly, 1 tonne of
brown bread flour can produce 2275 loaves of brown bread while 1 tonne of white
bread flour produces 2135 loaves (standard 700g loaves). Thus from 1 tonne of wheat,
1842 loaves of brown bread or 1622 loaves of white bread can be produced.
Table 3.1 shows the average wheat–to-brown-bread supply chain for the period
February 2000 to December 2002. Table 3.2 shows the average wheat–to- white-
bread supply chain for the same period. The average wheat producer price is
163
Part 4
calculated by taking the SAFEX price and subtracting the farmers’ transport to the
silo, as well as the handling and storage costs. This is the price that farmers actually
get for their wheat. The mill door price, or the cost to the millers of actually getting
the wheat to the mill is calculated in a similar way. It is the SAFEX price plus
transport, handling and storage costs from the silo to the mill, less the income from
bran. From the mill door price it is possible to calculate the cost of milling which in
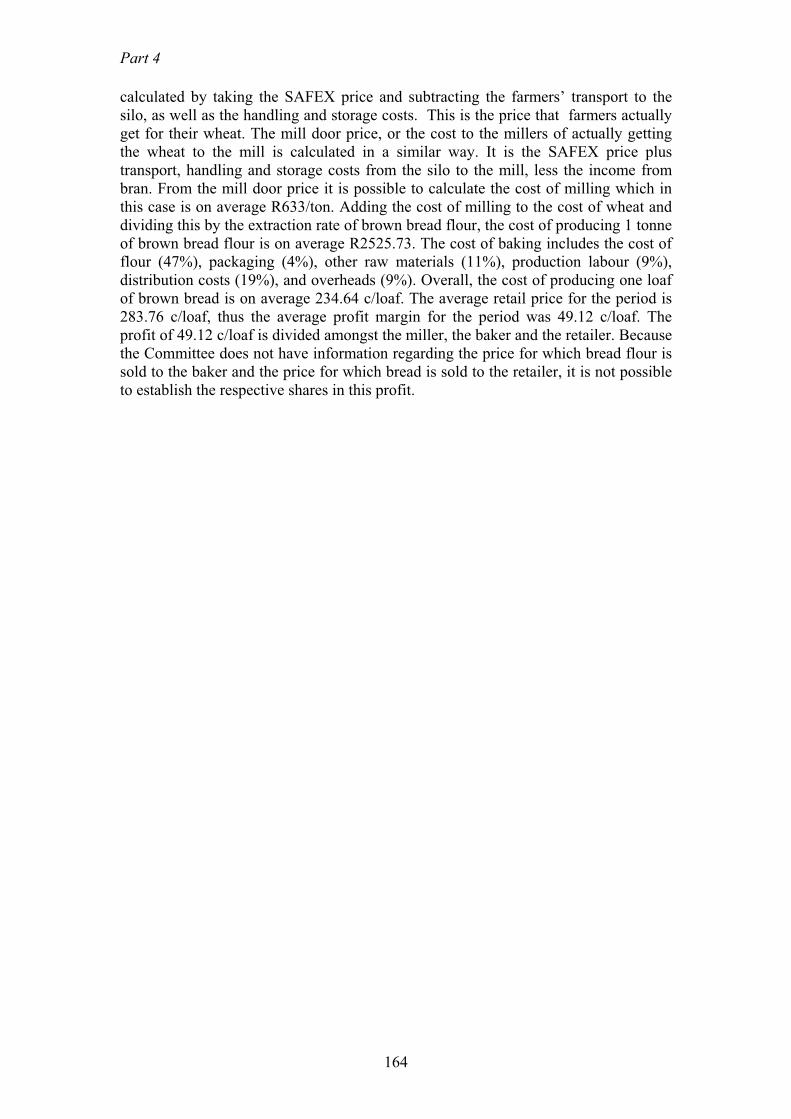
this case is on average R633/ton. Adding the cost of milling to the cost of wheat and
dividing this by the extraction rate of brown bread flour, the cost of producing 1 tonne
of brown bread flour is on average R2525.73. The cost of baking includes the cost of
flour (47%), packaging (4%), other raw materials (11%), production labour (9%),
distribution costs (19%), and overheads (9%). Overall, the cost of producing one loaf
of brown bread is on average 234.64 c/loaf. The average retail price for the period is
283.76 c/loaf, thus the average profit margin for the period was 49.12 c/loaf. The
profit of 49.12 c/loaf is divided amongst the miller, the baker and the retailer. Because
the Committee does not have information regarding the price for which bread flour is
sold to the baker and the price for which bread is sold to the retailer, it is not possible
to establish the respective shares in this profit.
164

Analysis of selected food value chains
Table 3.1: Average wheat to brown bread supply chain for the period February 2000 to
December 2002
Source Units
1. Wheat avg. producer price lagged 4 months calculated R/ton 1356.43
1a)Transport cost: Farm gate to silo estimated R/ton 96.57
1b) Handling & storage cost: Costs of farmer estimated R/ton 16.40
2. Wheat avg. nearby contract lagged 4 months SAFEX R/ton 1469.40
2a)Transport cost: Silo to Mill door estimated R/ton 76.57
2b) Handling & storage cost: Costs of miller estimated R/ton 20.40
Income from sales of bran calculated (nolag)
R/ton bran 154.16
3. Mill door price (1+ 1a + 1b +...) calculated R/ton grain 1412.21
Wheat millers cost: conversion from wheat to wheatflour
Production cost (milling cost) NAMM R/ton grain 86.83
Packing cost NAMM R/ton grain 13.66
Administration, Warehouse and selling NAMM R/ton grain 148.60
4. Mill site costs R/ton grain 249.10
Distribution costs NAMM R/ton grain 126.10
Total mill site costs NAMM R/ton grain 375.20
Fixed Capital cost NAMM R/ton grain 54.82
Floating Capital costs NAMM R/ton grain 203.61
Total Millers Costs Calculated R/ton grain 633.63
5. Cost of production of wheat flour for brownbread
Conversion cost Calculated R/ton grain 633.63
Average cost of wheat (Mill door price) Calculated R/ton grain 1412.21
Total wheat flour cost for brown bread calculated R/ton grain 2045.84
Average extraction rate for brown bread flour NAMM 0.81
6. Brown bread bakers cost of production
Average cost of brown bread flour calculated R/ton meal 2525.73
Extraction rate of brown bread from 1 ton flour SACB loaves/ton 2275.00
Cost of flour per loaf calculated c/loaf 111.02
Packaging SACB c/loaf 10.30
Other Raw Materials SACB c/loaf 26.74
Production Labour SACB c/loaf 21.59
Distribution SACB c/loaf 44.84
Overheads SACB c/loaf 20.14
7. Cost of producing brown bread calculated c/loaf 234.64
8. Brown bread retail price AC Nielsen c/loaf 283.76
Brown bread profit margin from miller to retailer 49.12
Table 3.2: Average wheat-to-white-bread supply chain for the period February 2000 to
December 2002.
Source Units
165

Part 4
1. Wheat avg. producer price lagged 4 months CalculatedR/ton
1356.43
1a)Transport cost: Farm gate to silo Estimated R/ton 96.57
1b) Handling & storage cost: Costs of farmer Estimated R/ton 16.40
2. Wheat avg. nearby contract lagged 4 months SAFEX R/ton 1469.40
2a)Transport cost: Silo to Mill door Estimated R/ton 76.57
2b) Handling & storage cost: Costs of miller Estimated R/ton 20.40
Income from sales of bran Calculated (no lag)
R/ton bran 176.83
3. Mill door price (1+ 1a + 1b +...) Calculated R/ton grain 1389.54
Wheat millers cost of conversion from wheat to wheatflour
Production cost (milling cost) NAMM R/ton grain 86.83
Packing cost NAMM R/ton grain 13.66
Administration, Warehouse and selling NAMM R/ton grain 148.60
4. Mill site costs R/ton grain 249.10
Distribution costs NAMM R/ton grain 126.10
Total mill site costs NAMM R/ton grain 375.20
Fixed Capital cost NAMM R/ton grain 54.82
Floating Capital costs NAMM R/ton grain 203.61
Total millers costs R/ton grain 633.63
5. Cost of production of wheat flour for whitebread
Conversion cost Calculated R/ton grain 633.63
Average cost of wheat (mill door price) Calculated R/ton grain 1389.54
Total wheat flour cost for white bread Calculated R/ton grain 2023.17
divided by average extraction for white bread NAMM 0.76
6. White bread bakers cost of production
Average cost of white bread flour Calculated R/ton meal 2662.07
Extraction rate of brown bread from 1 ton flour SACB loaves/ton 2135.00
Cost of flour per loaf Calculated c/loaf 124.69
Packaging SACB c/loaf 10.30
Other Raw Materials SACB c/loaf 26.74
Production Labour SACB c/loaf 21.59
Distribution SACB c/loaf 44.84
Overheads SACB c/loaf 20.14
7. Cost of producing white bread Calculated c/loaf 248.30
8. White bread retail price AC Nielsen c/loaf 327.84
White bread profit margin from miller to retailer Calculated c/loaf 79.54
The calculations performed above were duplicated for white bread production, the
main differences being the extraction rates. Due to the different extraction rate the
cost of producing a loaf of white bread is on average 248.17 c/loaf, 13.66 c/loaf more
than the cost of producing brown bread. The average retail price of white bread is
327.84 c/loaf, thus the profit margin for the miller, baker and retailer combined is
79.54 c/loaf, 32.42 cents more per loaf compared to a loaf of brown bread. Although
this may seem high the reader is reminded that VAT is paid on white bread and not on
brown bread. Thus if VAT is removed from the average retail price of white bread the
profit margin is 39.27 cents per loaf, 9.85 c/loaf less than the profit on brown bread.
166

Analysis of selected food value chains
The higher cost of producing white bread is mainly attributable to the different
extraction rate.
3.4.2 Trends in margins and spreads
Although it is not possible at this time to differentiate the various profit margins
within the supply chain, it is possible to look at how the profit margin has changed
over time. Figure 3.5 shows how the profit margin on brown bread (based on the
calculations above) has changed between February 2000 and December 2002 (data
not available for 2003). On the graph a line was drawn indicating the average profit
margin for the period Feb 00-Feb02. February 2002 was chosen because it is here
(with the 4 month time lag) that the SAFEX wheat prices increased rapidly. The
average profit margin for the period was 43.60 c/loaf. As can be seen in the figure the
profit margin increased to a maximum value of 88.47 c/loaf, a 102.9% increase in
profit margin.
0.00
20.00
40.00
60.00
80.00
100.00
120.00
Feb-0
0
Apr-0
0
Jun-
00
Aug
-00
Oct-0
0
Dec
-00
Feb-0
1
Apr-0
1
Jun-
01
Aug
-01
Oct-0
1
Dec
-01
Feb-0
2
Apr-0
2
Jun-
02
Aug
-02
Oct-0
2
Dec
-02
Feb-0
3
Apr-0
3
Jun-
03
Brown bread profit margin from miller to retailer
Brown Bread Profit margin
average Feb00-Nov01
41.52cents
151%
Figure 3.5: Brown bread profit margin from miller to retailer: Feb 2000-June 2003
Similarly to brown bread, the calculation was done for white bread with the results
presented in figure 3.6 below.
167
Part 4
0.00
20.00
40.00
60.00
80.00
100.00
120.00
140.00
Fe
b-0
0
Ma
r-0
0
Ap
r-0
0
Ma
y-0
0
Ju
n-0
0
Ju
l-0
0
Au
g-0
0
Se
p-0
0
Oct-
00
No
v-0
0
De
c-0
0
Ja
n-0
1
Fe
b-0
1
Ma
r-0
1
Ap
r-0
1
Ma
y-0
1
Ju
n-0
1
Ju
l-0
1
Au
g-0
1
Se
p-0
1
Oct-
01
No
v-0
1
De
c-0
1
Ja
n-0
2
Fe
b-0
2
Ma
r-0
2
Ap
r-0
2
Ma
y-0
2
Ju
n-0
2
Ju
l-0
2
Au
g-0
2
Se
p-0
2
Oct-
02
No
v-0
2
De
c-0
2
Ja
n-0
3
Fe
b-0
3
Ma
r-0
3
Ap
r-0
3
Ma
y-0
3
Ju
n-0
3
c/lo
af
White bread profit margin from miller to retailer
Average profit of 76.36 c/loaf
Feb 00-Feb 02
72%
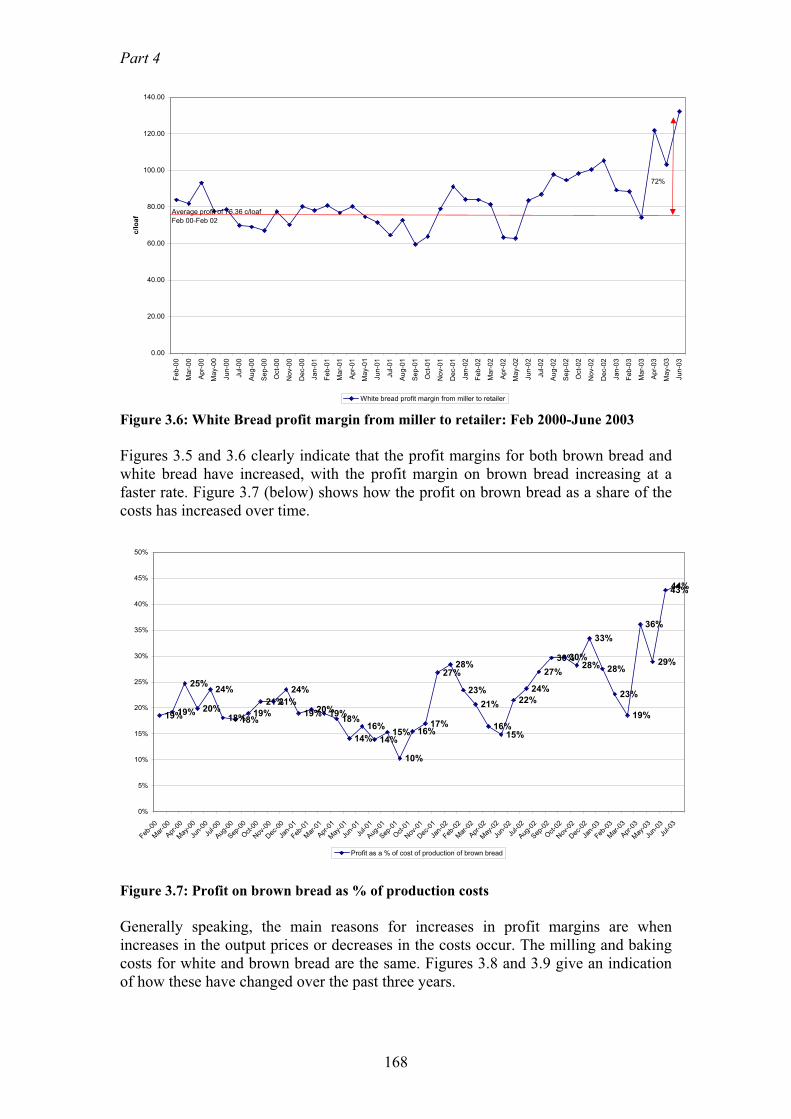
Figure 3.6: White Bread profit margin from miller to retailer: Feb 2000-June 2003
Figures 3.5 and 3.6 clearly indicate that the profit margins for both brown bread and
white bread have increased, with the profit margin on brown bread increasing at a
faster rate. Figure 3.7 (below) shows how the profit on brown bread as a share of the
costs has increased over time.
19%19%
25%
20%
24%
18%18%19%
21%21%
24%
19%20%19%18%
14%
16%
14%15%
10%
16%17%
27%28%
23%
21%
16%15%
22%
24%
27%
30%30%28%
33%
28%
23%
19%
36%
29%
43%44%
0%
5%
10%
15%
20%
25%
30%
35%
40%
45%
50%
Feb-0
0
Mar
-00
Apr
-00
May
-00
Jun-
00
Jul-0
0
Aug
-00
Sep
-00
Oct-0
0
Nov
-00
Dec
-00
Jan-
01
Feb-0
1
Mar
-01
Apr
-01
May
-01
Jun-
01
Jul-0
1
Aug
-01
Sep
-01
Oct-0
1
Nov
-01
Dec
-01
Jan-
02
Feb-0
2
Mar
-02
Apr
-02
May
-02
Jun-
02
Jul-0
2
Aug
-02
Sep
-02
Oct-0
2
Nov
-02
Dec
-02
Jan-
03
Feb-0
3
Mar
-03
Apr
-03
May
-03
Jun-
03
Jul-0
3
Profit as a % of cost of production of brown bread
Figure 3.7: Profit on brown bread as % of production costs
Generally speaking, the main reasons for increases in profit margins are when
increases in the output prices or decreases in the costs occur. The milling and baking
costs for white and brown bread are the same. Figures 3.8 and 3.9 give an indication
of how these have changed over the past three years.
168
Analysis of selected food value chains
540.00
560.00
580.00
600.00
620.00
640.00
660.00
680.00
700.00
720.00
740.00
R/ton
2000 2001 2002 2003
Conversion cost of wheat to flour
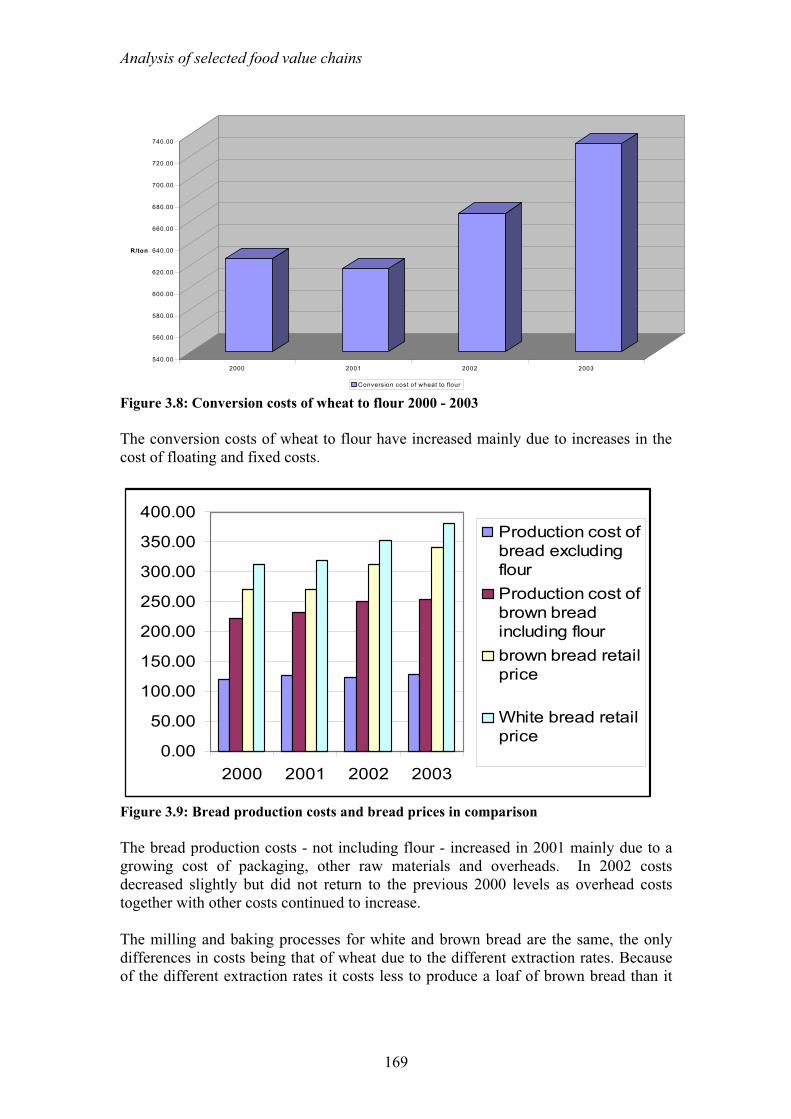
Figure 3.8: Conversion costs of wheat to flour 2000 - 2003
The conversion costs of wheat to flour have increased mainly due to increases in the
cost of floating and fixed costs.
0.00
50.00
100.00
150.00
200.00
250.00
300.00
350.00
400.00
2000 2001 2002 2003
Production cost of
bread excluding
flour
Production cost of
brown bread
including flour
brown bread retail
price
White bread retail
price
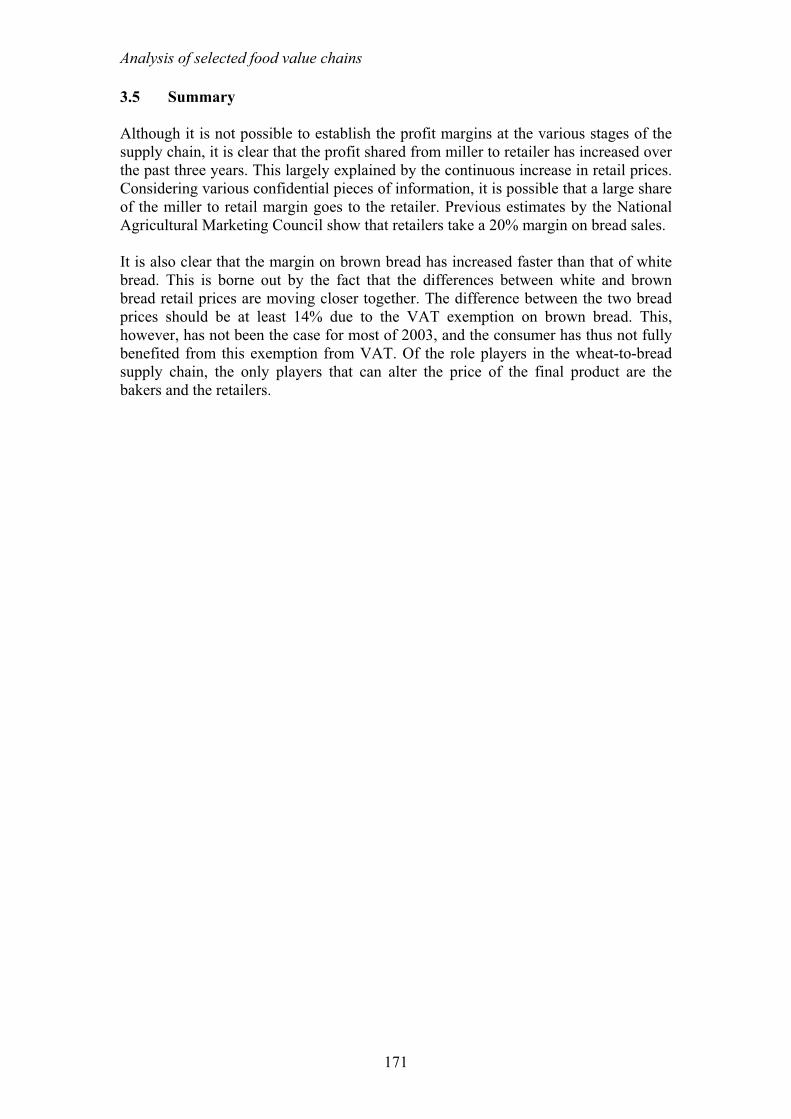
Figure 3.9: Bread production costs and bread prices in comparison
The bread production costs - not including flour - increased in 2001 mainly due to a
growing cost of packaging, other raw materials and overheads. In 2002 costs
decreased slightly but did not return to the previous 2000 levels as overhead costs
together with other costs continued to increase.
The milling and baking processes for white and brown bread are the same, the only
differences in costs being that of wheat due to the different extraction rates. Because
of the different extraction rates it costs less to produce a loaf of brown bread than it
169

Part 4
does to produce a loaf of white bread. The difference is approximately 13.66 c/loaf.
Based on the fact that it is cheaper to produce a loaf of brown bread than white, and
that no VAT is paid on brown bread, it is expected that brown bread is cheaper for the
consumer than white bread. This is in fact the case. Because of the VAT issue, it is
expected that the difference in price would be at least 14%. Figure 3.10 shows the
percentage difference in retail price between white and brown bread for the period
February 2000 to October 2003.
22%
20%
19%
18%
14%
16%16%
14%
16%
13%
15%
18%18%
17%
19%
20%
17%17%
19%19%
15%
19%
15%
11%
15%16%
13%
14%14%
13%14%
10%
11%
13%
10%9%
13%13%13%
14%
12%
10%
11%12%11%
0%
5%
10%
15%
20%
25%
Feb-0
0
Apr
-00
Jun-
00
Aug
-00
Oct-0
0
Dec
-00
Feb-0
1
Apr
-01
Jun-
01
Aug
-01
Oct-0
1
Dec
-01
Feb-0
2
Apr
-02
Jun-
02
Aug
-02
Oct-0
2
Dec
-02
Feb-0
3
Apr
-03
Jun-
03
Aug
-03
Oct-0
3
%
% Difference between white and brown bread retail prices
Figure 3.10: The percentage difference between brown and white bread retail prices
The figure indicates that the “gap” between the two retail prices is getting smaller.
The percentage difference in retail prices in February 2000 was 22% but in July 2003
only 10%. The first time the price difference went below 14% was in November 2000,
then again in January 2002 and again in April 2002, after which it consistently
remained below 14%. Thus, the two prices are converging below the 14% VAT
difference. The retail price of brown bread (although cheaper to produce and not
carrying VAT) appears to get closer to the more expensive white bread. One
explanation for this can be derived from what was stated previously, namely that the
profit margin on brown bread has increased at a much faster rate than that of white
bread. Could it be that someone in the supply chain is pushing up the price of brown
bread faster than that of white bread in the hope that the consumer will not notice
because the goods are so similar?
170
Analysis of selected food value chains
3.5 Summary
Although it is not possible to establish the profit margins at the various stages of the
supply chain, it is clear that the profit shared from miller to retailer has increased over
the past three years. This largely explained by the continuous increase in retail prices.
Considering various confidential pieces of information, it is possible that a large share
of the miller to retail margin goes to the retailer. Previous estimates by the National
Agricultural Marketing Council show that retailers take a 20% margin on bread sales.
It is also clear that the margin on brown bread has increased faster than that of white
bread. This is borne out by the fact that the differences between white and brown
bread retail prices are moving closer together. The difference between the two bread
prices should be at least 14% due to the VAT exemption on brown bread. This,
however, has not been the case for most of 2003, and the consumer has thus not fully
benefited from this exemption from VAT. Of the role players in the wheat-to-bread
supply chain, the only players that can alter the price of the final product are the
bakers and the retailers.
171