chapter 3 surface activity of bisphosphate gemini...
TRANSCRIPT
Chapter 3
Surface Activity of Bisphosphate
Gemini Surfactants
43

3.1 Introduction
This chapter deals with the investigation of interfacial properties of anionic gemini sur-
factants at the air/water interface. The static or equilibrium surface tension was mea-
sured and estimated the surface activity of newly synthesized m−3−m and m−5−m
types of geminis. The critical micellar concentration (CMC) values were confirmed in-
vestigates using specific conductance studies and also by dye solvatochromism method.
The Dynamic behaviour of aqueous solutions of geminis was also investigated. The
equilibrium and dynamic surface tension parameters were correlated to the foamability
of these surfactants.
3.2 Materials and Methods
In this study the bisphosphate geminis were used, the synthesis procedure was discussed
in earlier chapter. The aqueous solutions were prepared using distilled water. Eosin-Y
dye was used for dye micellization. Eosin-Y was obtained from M/s. Acros, Belgium.
3.3 Equilibrium Surface Tension
The equilibrium surface tension was measured on a Kruss K-11 automated tensiometer
with an accuracy of ±0.2 mN/m, using Wilhelmy Plate Method. In this method a
Platinum plate is attached to a very sensitive balance. A height adjustable sample carrier
is used to bring the liquid to be measured in contact with the probe. A test sample
(liquid), was poured in the sample vessel. The sample vessel is made of Quartz. When
the platinum plate is immersed in the liquid, a force acting on the plate is traced by the
balance. If the wetting length of the plate is known, the force measured by the balance
can be used to calculate the surface tension. The surface tension can be calculated by
equation;
γ =F
Lcosθ(3.1)
44

Considering the plate is completely wet, the contact angle of the plate, θ = 00, cosθ
is approximately 1.
The instrument was calibrated using distilled water. All the measurements were
performed at 25.0±0.10 C. All the measurements were repeated thrice. Measurements
were carried out using aqueous solutions of gemini surfactants. Distilled water was
used to prepare the solutions. CMC values of the gemini surfactants were estimated
from the surface tension versus surfactant concentration plots. The maximum surface
excess concentration Γmax, was estimated, by fitting Szyskowski equation (3.2), to the
surface tension plots.
(γ0− γ) = π = nRT Γmax× ln(1+K× c) (3.2)
In this equation, γ0 is the surface tension of pure water, γ the surface tension of
surfactant solution, π is the surface presssure, Γmax the maximum surface excess con-
centration of surfactant, c concentration of surfactant solution, R the universal gas con-
stant, T the absolute temperature, K adsorption constant and n the number of ionic
species whose concentration at the interface varies with the change in the surfactant
concentration in the solution. In the case of dimeric surfactant having divalent surfac-
tant ion and two univalent counter ions, the value of n employed is 3. The minimum
surface area per molecule (Amin), was calculated using the equation (3.3).
Amin =1016
(Γmax×NA)(3.3)
Where, NA is the Avogadro number.
The efficiency i.e. pC20, of the synthesized gemini surfactants was also estimated,
the pC20 value is the negative logarithm of surfactant concentration (C20), required to
depress the surface tension by 20 mN m−1.
45

3.3.1 Dye Micellization
The CMC measurements was carried out using dye micellization technique. It was stud-
ied using a water soluble, Eosin-Y dye. The ultraviolet visible spectrums were recorded
on a single beam UV-Visible spectrophotometer (Agilent-8453). The Eosin dye shows
shift in absorbance due to the presence of micelles. Plot of surfactant concentration
versus the absorbance, at wavelength (λmax) 517 nm and fixed dye concentration (0.01
mM) was used to estimate the CMC values of synthesized gemini surfactants.
3.3.2 Conductivity measurements
The electrical conductivity method is widely used for studying the micellization be-
havior of ionic surfactants in aqueous and non aqueous media. In this method critical
micellization concentration (CMC) values of ionic surfactants are determined generally
by plotting specific conductivity versus concentration. Besides this graphical approach,
different analytical approaches are also used to determine the micellization parameters
of ionic surfactants from their specific conductivity data. Since cmc values of surfac-
tants lie in the low concentration region, normally measurement of specific conductiv-
ity of ionic surfactants in different media is made in the low concentration region only
[Seredyuk and Holmberg, 2001; Boda et al. , 2000; Sikiri et al. , 2002; Sugimoto et al. ,
1996]. Extension of specific conductivity measurements of ionic surfactants to the high
concentration region is, however, restricted due to low solubility of these surfactants,
especially in water and pure non aqueous liquids.
Conductivity of the gemini surfactant solutions was measured as a function of con-
centration with a low frequency conductivity analyzer LT-23 conductometer (Labtron-
ics, India Ltd., accuracy of ±1%) at 25.0±0.10C.
3.3.2.1 The Degree of Micelle Ionization (α)
The counterion distribution in a micellar solution can be assessed from electrical con-
ductivity versus surfactant concentration plots. The counterion binding to micelles was
determined from the ratio between the slopes above and below the CMC [Bradley et al.
46

, 1988; Thomas and Penfold, 1996; Lu et al. , 1993; Rosen et al. , 1999; Lu, 1997;
Cheah and Cilliers, 2005]. In the low concentration domain, the change of (k) is due to
a larger concentration of free cations and anions of surfactants solutions, whereas the
break in the plot account for onset of micellization.
3.4 Dynamic Surface Tension
Dynamic behavior of surfactants can be investigated by dynamic surface tension mea-
surements. The equilibrium surface tension of a surfactant solution is not achieved
instantaneously. For example, when a fresh interface is formed, surfactant molecules
must first diffuse from the bulk to the interface, and then adsorb, whilst also achieving
the correct orientation. A freshly formed interface of a surfactant solution has a surface
tension, very close to that of the solvent. Over a period of time, surface tension will
decay to the equilibrium value, and this period of time can range from milliseconds to
days depending on the surfactant type and concentration. This dynamic surface tension
is an important property as it governs many important industrial and biological pro-
cesses[Fainerman, 1991; Frese et al. , 2004; Patist et al. , 1998]. In the photographic
industry the formulation of thin gelatin films requires high flow velocities, and hence
DST needs to be monitored during the fabrication process to prevent film deformation
and irregularities. DST is also important in the printing industry [Hua and Rosen, 1988;
Fielden et al. , 2001; Fainerman and Miller, 1994]. It is also of importance in agrochem-
icals where fast wettability plays a role in the easy spreading of pesticides onto leaves.
DST also plays a crucial part in metal, paper and textile production. Coating is also a
one of the important application [Zana, 2002a; Zana, 2002b; Patist et al. , 1998]. One
biological process where the control of DST is essential is in the lung, where low DST
is necessary for effective functioning of the alveoli, and phospholipids are the main sur-
face active ingredients. It is, of course, important in other emulsifiers, wetting agents
and foaming agents [Zana, 2002a; Nagayama et al. , 1974; James Smith et al. , 2007;
Buzzacchi et al. , 2006].
47

The dynamic surface tension measurements were carried out using maximum bub-
ble pressure method. The maximum bubble pressure method involves measurement of
the pressure in the bubble as a function of bubble size. It is possible to measure the
surface tension as a function of time by measuring pressure in the bubble at different
times [Reymond, 1971; Kalekar and Bhagwat, 2006; Kalekar and Bhagwat, 2007] i.e.
dynamic surface tension. In this method, a gas is allowed to flow in to the needle, while
monitoring its pressure [Fainermann et al. , 1998]. A sample quantity of 20 ml liq-
uid was used for this study. The bubble formation rate was controlled by adjusting the
airflow rate. The pressure was measured by a pressure transducer connected to an oscil-
loscope. In this method, a curved liquid-gas interface forms inside the needle. Pressure
in the system rises until the bubble forms a hemisphere at the tip of the needle. The
maximum pressure (corresponding to a hemispherical bubble) is directly proportional
to the surface tension. As soon as the bubble diameter increases, the pressure falls
dramatically. When the bubble has formed fully and it breaks away (Figure 3.1), the
liquid momentarily surges back up into the needle. Area of the interface (once formed)
remains constant. Surface age can be varied by varying the bubble frequency. Measure-
ments were conducted with effective surface ages from 1 ms to 30 s. Young Laplace
equation (3.4), was used to calculate the dynamic surface tension.
Pmax =2γ f
r+hρg (3.4)
where, f is the correction factor for nonsphericity of the bubble.
48

Figure 3.1: Working principle of Maximum Bubble Pressure Method(rb is the radius of bubble & rc is the radius of capillary)
49

3.4.1 Experimental set up for Maximum Bubble Pressure Method
The setup essentially consists of three major units.
1) Gas introduction unit (bubble formation unit),
2) Pressure sensing unit and
3) Data acquisition unit.
Figure 3.2: Setup of Maximum Bubble Pressure method
1) Gas introduction unit:
The gas introduction unit consists of three components.
a) Pressure vessel (gas source),
b) Flow controllers and
c) Needle (for bubble formation).
a) Pressure vessel:
A thick walled conical flask is used as gas source. It is made air tight by means of a
rubber stopper. Manometer attached to the flask shows the pressure inside the flask. As
air used was atmospheric air, it contains water vapors, which may harm the electronic
pressure sensor. To avoid this, flakes of calcium chloride were kept in the flask which
50
absorbs water vapors from moist air, and supplies relatively dry air to bubble formation
unit and to sensor.
b) Flow controllers: Close controlling device is necessary to regulate the air flow
rate. Needle valve is used in the setup, which satisfactorily controls the air flow rate.
Desired adsorption times can be obtained by precisely controlling air flow.
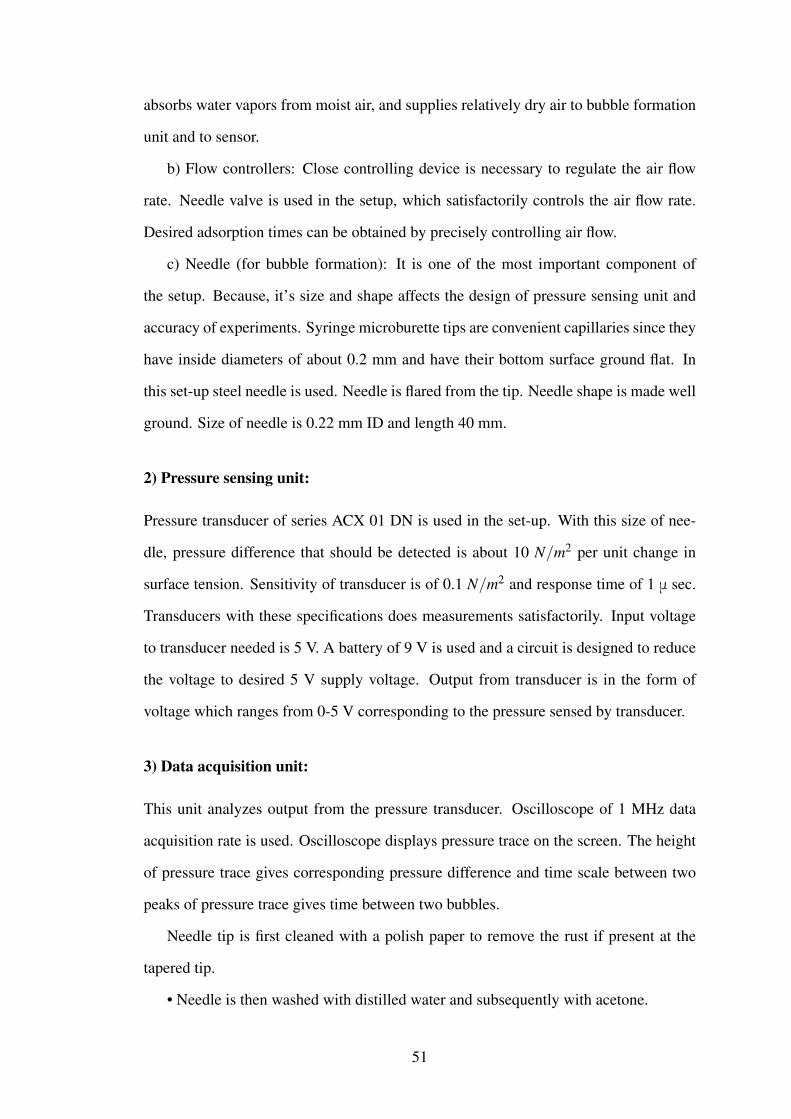
c) Needle (for bubble formation): It is one of the most important component of
the setup. Because, it’s size and shape affects the design of pressure sensing unit and
accuracy of experiments. Syringe microburette tips are convenient capillaries since they
have inside diameters of about 0.2 mm and have their bottom surface ground flat. In
this set-up steel needle is used. Needle is flared from the tip. Needle shape is made well
ground. Size of needle is 0.22 mm ID and length 40 mm.
2) Pressure sensing unit:
Pressure transducer of series ACX 01 DN is used in the set-up. With this size of nee-
dle, pressure difference that should be detected is about 10 N/m2 per unit change in
surface tension. Sensitivity of transducer is of 0.1 N/m2 and response time of 1 μ sec.
Transducers with these specifications does measurements satisfactorily. Input voltage
to transducer needed is 5 V. A battery of 9 V is used and a circuit is designed to reduce
the voltage to desired 5 V supply voltage. Output from transducer is in the form of
voltage which ranges from 0-5 V corresponding to the pressure sensed by transducer.
3) Data acquisition unit:
This unit analyzes output from the pressure transducer. Oscilloscope of 1 MHz data
acquisition rate is used. Oscilloscope displays pressure trace on the screen. The height
of pressure trace gives corresponding pressure difference and time scale between two
peaks of pressure trace gives time between two bubbles.
Needle tip is first cleaned with a polish paper to remove the rust if present at the
tapered tip.
• Needle is then washed with distilled water and subsequently with acetone.
51

• Surfactant solutions of desired concentration were prepared and small 3-4 glass
bottles were prepared of same concentration and used one after another. This is to insure
that the measurements are on the same concentration. If the bulk concentration is low,
it may happen that at fast bubble rate, within measurement time significant quantity of
surfactant may be carried with foam affecting the bulk concentration.
• Pressure vessel is filled with air till it reaches pressure up to 2600 N/m2 (20 mm
Hg) .
• Glass bottle containing sample is placed on set-up base in such a position that im-
mersion height of needle is 10 mm, which is kept constant throughout the experiments.
• Air is passed to the solution through needle by opening the valve. As pressure in
the vessel is higher, there is no need to make special arrangement for introduction of
gas to form bubbles.
• Bubble formation rate is controlled by the needle valve. Oscilloscope shows the
pressure trace as shown in Figure 3.1. The bubble formation rate is measured either by
means of stopwatch or by monitoring the time line on the oscilloscope.
• Peak height and time is measured on the oscilloscope screen during the experi-
mental run. The time between two peaks is the time between two successive bubbles,
and height of the pressure trace gives pressure difference across the bubble interface
which is in proportion with surface tension.
• For surface tension calculation, peak height is compared with height from known
surface tension. Peak height of water (surface tension = 72 mN/m, measured on K-
11) is determined and solving Young Laplace equation to account peak heights, surface
tension is calculated.
γsample =peak height (sample)peak height (water)
×72mN/m (3.5)
52

3.5 Foaming power
Foaming power of the synthesized gemini surfactants was measured by the Ross Miles
pour foam test method, as per standard ASTM designation D-1173-53. Foaming test
was carried out by pouring 50 ml of the test solution into a glass column (100 cm high,
ID 5.0 cm) from the side wall, so that it will not produce foam (initial solution was 50
ml). A 200-ml pipette is positioned in the centre so that its lower end lies exactly 90 cm
above the liquid surface in the glass. The orifice of the pipette has an ID of 2.9 mm and
breaks up the liquid flowing through it into drops. The test solution filled in the pipette
is allowed to fall by its own weight into the glass column, foam develops. The initial
height of the foam is read immediately and again after every 5 minutes till completion
of 30 minutes. Foam formation and foam stability was studied for all the phosphate
geminis at fixed concentration (2 mM).
3.6 Results and Discussions
3.6.1 Equilibrium surface tension
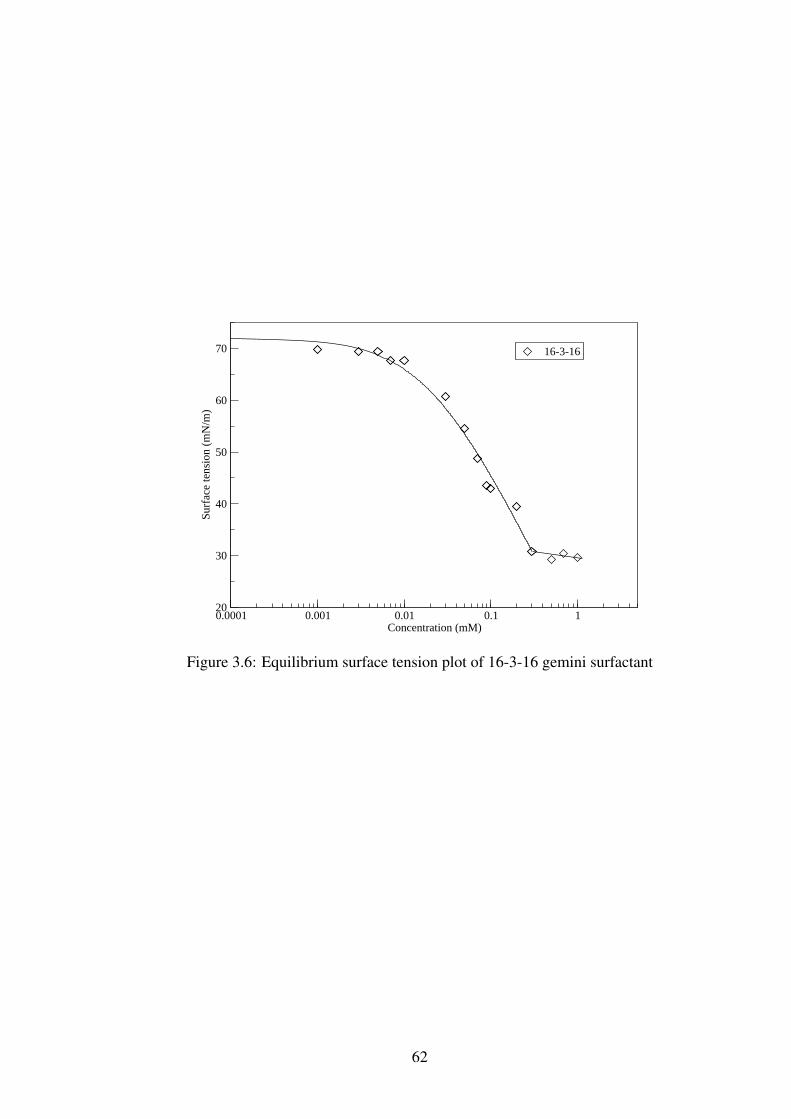
Surface tension measurements were carried out as mentioned in the section 3.1. The
surface tension versus surfactant concentration plots were used to find out CMC val-
ues. The CMC values were taken as the point of inflection in surface tension values,
as shown in Figure 3.4 - 3.9. It was observed that, m− 3−m type geminis, CMC in-
creases with the increasing chain length, which is quite unusual trend. The CMC varies
in the order 12-3-12>16-3-16>10-3-10 (0.51 mM, 0.30 mM, 0.12 mM respectively).
These CMC values were cross verified by dye micellization and conductivity methods.
The horizontal line in Figures 3.18-3.20, shows the absorbance of Eosin-Y dye in the
absence of surfactant. A line was drawn from the inflection point of absorbance and
extrapolated to the horizaontal line. The intercept was taken as CMC point. The CMC
values obtained was found to be in the order of 12-3-12>16-3-16>10-3-10 (0.44 mM,
0.30 mM, 0.2 mM respectively). These values are in close agreement with the CMC
53

values obtained from the surface tension measurements. Specific conductivity mea-
surements were also carried out to find CMC values. The CMC values were found to
be 0.11 mM, 0.22 mM, and 0.10 mM for 10-3-10, 12-3-12, 16-3-16 gemini surfactants
respectively.
In the case of m− 5−m geminis, the CMC values decreases linearly with the in-
creasing number of carbon atoms in the tail group, as 10-5-10>12-5-12>16-5-16 (0.76
mM, 0.26 mM, 0.11 mM respectively). The CMC values obtained from the conductiv-
ity method also follows the same trend, 10-5-10 > 12-5-12 > 16-5-16 (0.79 mM, 0.33
mM, 0.11 mM respectively). The two phosphate head groups connected by the short
chain spacer group causes electrostatic repulsion between the head groups so the gemi-
nis fold back at the air-water interface [Tyagi and Tyagi, 2011], thereby decreasing the
CMC value. This effect was also observed through large variance between the Amin
values for the m− 3−m and m− 5−m geminis. The increased hydrophobicity of the
gemini molecules influence the adsorption, as the Γmax decreases and consequently Amin
increases. The minimum area per molecule was found to be abruptly changed for 12-3-
12 and 10-5-10 gemini. A theoretical explaination suggested to the variation of the Amin
with the spacer chain is the balance of attractive interactions between the hydrophobic
tails, the repulsive interactions between the head groups, and the conformational en-
tropy of the sapcer chain [Diamant and Andelmann, 1994; Diamant and Andelmann,
1995]. the low Γmaxvalues for the geminis with C10 chain lengths indicate that in ad-
sorbing at the interface, these molecules are the most effective and efficient among the
six geminis. The CMC of monodecyl phosphate (MAP) surfactant, as reported in liter-
ature is 53 mM, at 200C [Schulz, 1976] and that of disodium dodecyl phosphate (SDP),
is 57 mM at 250C [Arakawa and Pethica, 1980]. Where as the geminis 10-3-10, 10-5-10
has CMC values (0.12 mM and 0.76 mM), several fold lower than the monomeric sur-
factants having same carbon chain lengths. Geminis 12-3-12 and 12-5-12 also possess
CMC, (0.51 mM and 0.26 mM), far lower than that of SDP. The effect of carbon num-
bers in the spacer group of geminis m−5−m over m−3−m can be seen as the addition
of two methyl groups in the spacer of m−5−m geminis makes them hydrophobic than
54

the m− 3−m geminis. Usually for the ionic surfactants, efficiency pC20, decreases
with the increase in alkyl chain length, reflecting the negative free energy of transfer of
methylene group from bulk to the interface [Rosen, 1978]. The efficiency, pC20 value
of the m− 3−m geminis found to be in the order of 10-3-10>16-3-16>12-3-12. Sim-
ilarly for m−5−m geminis, the efficiency increases with the increase in alkyl length,
which is in the order of 10-5-10>16-5-16>12-5-12. This indicates, unlike the conven-
tional monomeric surfactants, the increasing chain length of m−5−m geminis results
in the energetically less favorable diffusion of these gemini molecules at the interface.
12-3-12 was found to be more efficient than rest of the geminis. Surfactant effective-
ness is the maximum reduction in surface tension attainable, γcmc. Initially for both the
m−3−m and m−5−m type of geminis it decreases gradually and increases for gemini
with C16 chain length. The gemini with C12 chain lengths, are found to have low γcmc,
that is, more effective than the rest of the geminis.
The conductivity plots for m−3−m and m−5−m gemini surfactants were shown in
figures 3.10 - 3.15. Above the cmc, the change in the specific conductivity has a smaller
slope. The decreased slope may be due to two reasons: (1) the detention of a fraction
of the counter ions around micelle surface and consequently there is an effective loss
of free ions or (2) the micelles can also contribute to charge transport to a lesser extent
than the free ions due to their lower mobility. The degree of counter ion dissociation
(α) were obtained from the ratio of the slope above and below the break indicative of
the cmc and the degree of counter ion binding (β ) to micelles is equal to 1 −α [Bradley
et al. , 1988; Buijnsters et al. , 2002; Menger et al. , 2000; Seredyuk and Holmberg,
2001; Esumi et al. , 1996]. The larger the α smaller the β , means the weaker ability
of counter ion binding to micelles. The values of the degree of micelle ionization, α ,
for m− 3−m geminis found to be in the order of 16-3-16 > 12-3-12 > 10-3-10 (0.91,
0.76, 0.59 respectively) and the αvalues for m−5−m geminis found to be in the order
of 10-5-10 > 16-5-16 > 12-5-12 (0.49 > 0.30 > 0.25). The counter ion binding for the
m− 5−m geminis increased probably due to a decrease in the charge density at the
micellar surface caused by the decrease in the aggregation number of the micelles.
55

3.6.2 Dynamic surface tension
The dynamic surface tension i.e., the change in surface tension (with time) until it
reaches to equilibrium value, was measured by using maximum bubble pressure method.
It involves the measurement of maximum pressure needed to detach a bubble from the
tip of a capillary. The surface tension was determined from Young-Laplace equation
(3.4) for a bubble. The change in surface tension reduction with time contains four re-
gions: An induction region (I), Rapid fall region (II), Mesoequilibrium region (III), and
Equilibrium (IV). This is schematically illustrated in figure 3.3. Equation 3.6 fits the
three dynamic regions.
I
II
III
IV
72
0
log t
Surf
ace
tens
ion
(mN
/m)
Figure 3.3: Effect of surface age on dynamic surface tension
Dynamics of the aqueous soluitions of gemini surfactants was studied by means
of adsorption rate at fixed concentration, (1mM) that is above the CMC value for all
geminis. It was observed that, with increasing surface age, the dynamic surface tension
tends to reduce, approaching the equilibrium surface tension at long time. The change
in the surface tension with respect to time is represented in Figure 3.21. The rate of
adsorption for both type of geminis m−3−m and m−5−m, decreases with increasing
hydrophobicity in the molecule, i. e. increasing the carbon number in alkyl tail groups.
The meso equilibrium surface tension, γm, of the system can be obtained from long time
data by extrapolation of a plot of dynamic surface tension, i. e. γt versus t−1/2 to the
56

ordinate (t=infinity). Geminis 16-3-16 and 16-5-16 showed very slow dynamics, as the
t∗ values are very high, beyond the range measured, possibly more than 1000 sec. The
n and t∗ values were obtained by the equation (3.6) [Gao and Rosen, 1994; Hua and
Rosen, 1998].
log(γ0− γt)(γt− γm)
= nlog( t
t∗
)(3.6)
where γm is the mesoequilibrium surface tension of the solution (where γt shows
only a small change with time), γ0 is the equilibrium surface tension of the solvent
(72 mN/m for water), t∗ is the time when the variation of γt is maximum and n is
a dimensionless constant. The values for t∗, n and were obtained from the plots of
log[(γ0− γt)/(γt − γm)] i.e. reduced dynamic surface tension (RDST) versus log t (Fig-
ure 3.21) and are reported in Table 3.1. From Table 3.1, the value of t∗ is the time
required for the gt to reach half of the value between γ0 and γm and is related to the
surfactant concentration, as the surfactant concentration increases t∗ decreases. It has
been suggested that n is related to the difference between the energies of adsorption and
desorption of the surfactant [Hua and Rosen, 1998]. The n and t∗ values increases with
increasing hydrophobicity of the molecule [Rosen and Gao, 1995]. The effect of spacer
groups and the increasing carbon chain length of the gemini molecules, can be seen as
the t∗ values increases with increasing hydrophobicity of the molecules.
3.6.3 Foaming Power
The monoalkyl phosphate surfactants (MAPs), possess good foaming power at low con-
centration. The MAPs at 5 mM concentration produces good foam (C10MAP = 44 mm,
C12MAP = 213 mm, C16MAP = 50 mm). The percent foam stability after 10 minutes
was found to be very low i.e. 52.3, 30 and 74 [Imokawa and Tsutsumi, 1978]. How-
ever the geminis at higher concentration (2 mM), showed very low foam height with
stable foam, compared to MAPs. The foamability parameters were listed in Table 3.2.
The overall foaming power of these geminis compared to that of monomeric surfac-
57

tants [Imokawa and Tsutsumi, 1978], was found to be very low that is only about 8
to 10 percent that of MAPs. Authors Zhu et al. [Zhu et al. , 1991] had reported the
diphosphonate gemini surfactants with small, oxyethylene spacer groups showing low
foamability.
Gemini 10-5-10 shows better foam stability than the rest of the geminis. This ob-
servation tallies with the very low t∗ value of 10-3-10 gemini surfactant. The faster
(within less time) a molecule adsorbs at the micelle-water interface, it stabilizes the
foam film better, which results in stable foam. Whereas the slow adsorption of sur-
factant molecules to the interface allows rupture of foam film and the foam stability
reduces consequently. The foam stability was found to decrease with increasing carbon
number in the tail group. The t∗ values also increase with the chain length for both
the m− 3−m and m− 5−m geminis. A high surface density results in higher foam
stability, as more number of adsorbed monomers are available at the interface. This
was observed for m−5−m geminis. The foamability studies revealed that, the synthe-
sized bisphosphate geminis are of a class of low foam producing surfactants. The low
foamability can be the result of small, branched spacers and the increased electrostatic
repulsion between the head groups of surfactant molecules adsorbed at the foam film.
3.6.4 Wettability
The term wetting agent is applied to any substance that increases the ability of water or
an aqueous solution to displace air from a liquid or solid surface. Wetting is a process
involving surfaces and interfaces, and the modification of the wetting power of water
is a surface property shown to some degree by all surface-active agents, although the
extent to which they exhibit this phenomenon varies greatly [Rosen, 1989]. The wetta-
bility alteration of hydrophobic surfaces such as glass, teflon and stainless steel, using
aqueous gemini surfactant solutions (of fixed concentration i.e. 2 mM) was studied, by
contact angle measurement technique, using Kruss K-10 goniometer. Contact angles
on finely divided solids are more difficult to measure, but are often more desired and
more important than those on large solid surfaces. Generally, if the contact angle of
58

pure water is smaller than 90°, then the surface is called hydrophilic and if the contact
angle is larger than 90°, the solid surface is considered hydrophobic. It was observed
that gemini 16-5-16 has very low contact angle (17°) on glass surface than rest of the
geminis, the contcat angle of pure water on glass surface was found 30°. The contact
angle of 10-3-10, 12-3-12 and 10-5-10 geminis on the teflon surface, found very less
than that of pure water on teflon surface which comes 120°. 12-3-12 and 12-5-12 gem-
inis found to wet the stainless steel surface more than rest of the geminis. The contact
results were taken as an average of five measurements and was listed in Table 3.3.
59
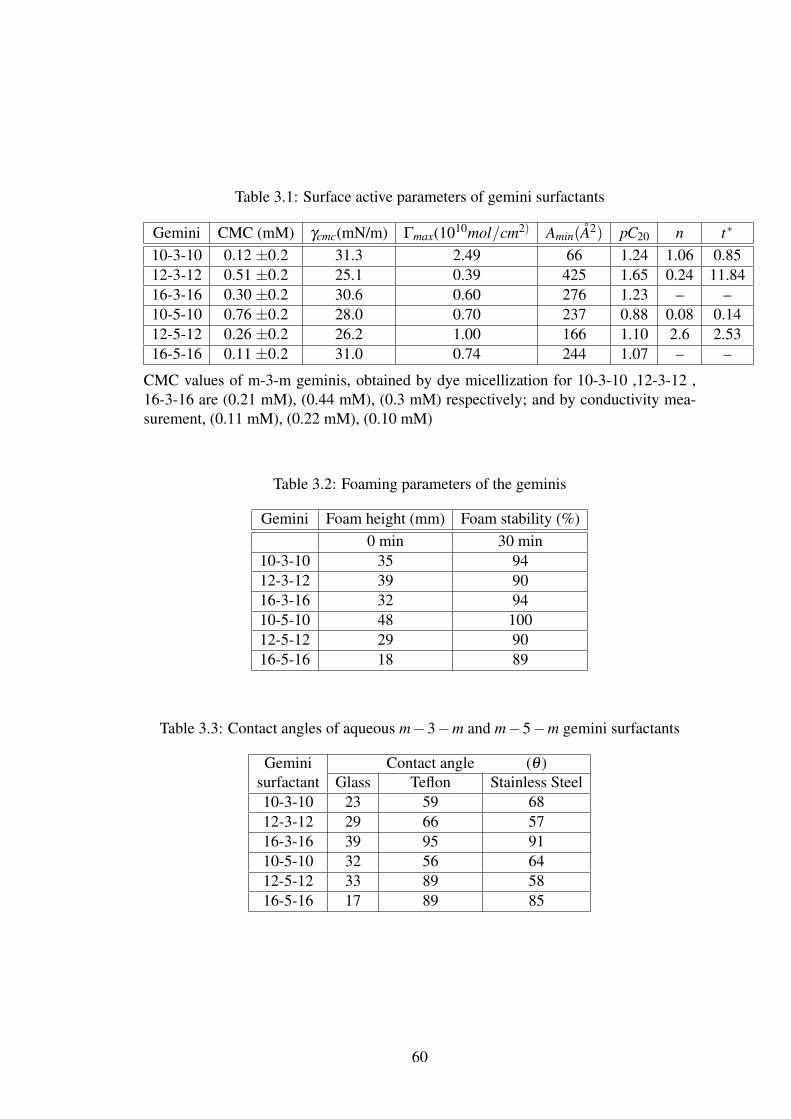
Table 3.1: Surface active parameters of gemini surfactants
Gemini CMC (mM) γcmc(mN/m) Γmax(1010mol/cm2) Amin(A2) pC20 n t∗
10-3-10 0.12 ±0.2 31.3 2.49 66 1.24 1.06 0.8512-3-12 0.51 ±0.2 25.1 0.39 425 1.65 0.24 11.8416-3-16 0.30 ±0.2 30.6 0.60 276 1.23 – –10-5-10 0.76 ±0.2 28.0 0.70 237 0.88 0.08 0.1412-5-12 0.26 ±0.2 26.2 1.00 166 1.10 2.6 2.5316-5-16 0.11 ±0.2 31.0 0.74 244 1.07 – –
CMC values of m-3-m geminis, obtained by dye micellization for 10-3-10 ,12-3-12 ,16-3-16 are (0.21 mM), (0.44 mM), (0.3 mM) respectively; and by conductivity mea-surement, (0.11 mM), (0.22 mM), (0.10 mM)
Table 3.2: Foaming parameters of the geminis
Gemini Foam height (mm) Foam stability (%)0 min 30 min
10-3-10 35 9412-3-12 39 9016-3-16 32 9410-5-10 48 10012-5-12 29 9016-5-16 18 89
Table 3.3: Contact angles of aqueous m−3−m and m−5−m gemini surfactants
Gemini Contact angle (θ )surfactant Glass Teflon Stainless Steel10-3-10 23 59 6812-3-12 29 66 5716-3-16 39 95 9110-5-10 32 56 6412-5-12 33 89 5816-5-16 17 89 85
60

0.01 0.1 1Concentration (mM)
20
30
40
50
60
70Su
rfac
e te
nsio
n (m
N/m
)10-3-10
Figure 3.4: Equilibrium surface tension plot of 10-3-10 gemini surfactant
0.001 0.01 0.1 1 10Concentration (mM)
20
30
40
50
60
70
Surf
ace
tens
ion
(mN
/m)
12-3-12
Figure 3.5: Equilibrium surface tension plot of 12-3-12 gemini surfactant
61
0.0001 0.001 0.01 0.1 1Concentration (mM)
20
30
40
50
60
70
Surf
ace
tens
ion
(mN
/m)
16-3-16
Figure 3.6: Equilibrium surface tension plot of 16-3-16 gemini surfactant
62
0.01 0.1 1Concentration (mM)
20
30
40
50
60
70Su
rfac
e te
nsio
n (m
N/m
)10-5-12
Figure 3.7: Equilibrium surface tension plot of 10-5-10 gemini surfactant
0.01 0.1 1Concentration (mM)
20
30
40
50
60
70
Suur
face
tens
ion
(mN
/m)
12-5-12
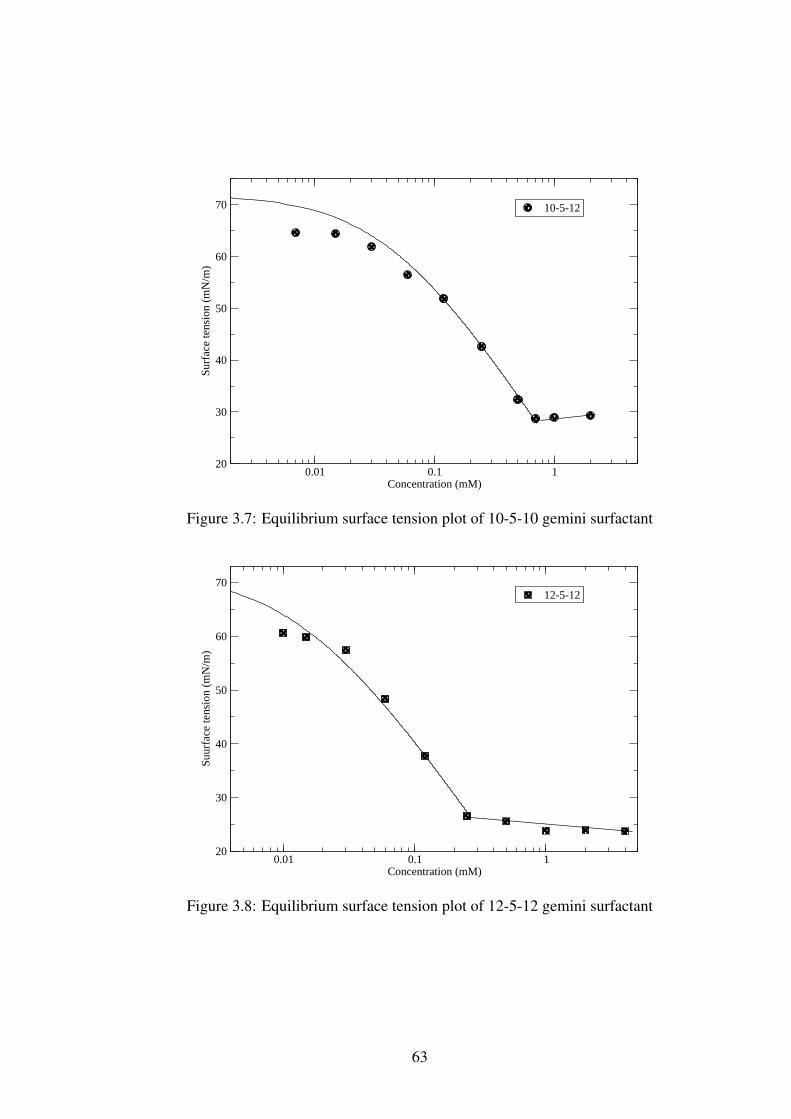
Figure 3.8: Equilibrium surface tension plot of 12-5-12 gemini surfactant
63

0.001 0.01 0.1 1Concentration (mM)
20
30
40
50
60
70
Surf
ace
tens
ion
(mN
/m)
16-5-16
Figure 3.9: Equilibrium surface tension plot of 16-5-16 gemini surfactant
64

0 0.5 1 1.5 2 2.5Concentration (mM)
0
0.2
0.4
0.6
0.8
Spec
ific
con
duct
ance
(x
10-3
S cm
-1)
10-3-10
slope 1 = 0.706
slope 2 = 0.421
Figure 3.10: Conductivity plot of 10-3-10 gemini surfactant
Figure 3.11: Conductivity plot of 12-3-12 gemini surfactant
65

0 0.2 0.4 0.6 0.8 1Concentration (mM)
0
50
100
150
200
250
300
Spec
ific
con
duct
ivity
(10
-6 S
cm
-1)
16-3-16
slope 2 = 206.02
slope 1 = 225.12
Figure 3.12: Conductivity plot of 16-3-16 gemini surfactant
0 0.2 0.4 0.6 0.8 1 1.2 1.4 1.6 1.8 2Concentration (mM)
0
50
100
150
200
Spec
ific
con
duct
ance
(10
-6 S
cm
-1)
10-5-10
slope 2 = 63.185
slope 1 = 128.27
Figure 3.13: Conductivity plot of 10-5-10 gemini surfactant
66

0 1 2 3Concentration (mM)
0
50
100
150
200
Spec
ific
con
duct
ivity
(10
-6 S
cm
-1)
12-5-12
slope 2 = 40
slope 1 = 154.78
Figure 3.14: Conductivity plot of 12-5-12 gemini surfactant
0.2 0.4 0.6 0.8 1Concentration (mM)
0
50
100
150
200
250
300
Spec
ific
con
duct
ance
(10
-6 S
cm
-1)
16-5-16
slope 2 = 270.73
slope 1 = 896.16
Figure 3.15: Conductivity plot of 16-5-16 gemini surfactant
67

Figure 3.16: UV-visible spectrum of Eosin-Y dye
O
COO
HO
Br
Br
Br
O
Br
Figure 3.17: Structure of Eosin -Y dye
68

0.001 0.01 0.1 1Concentration (mM)
0.1
0.15
0.2
0.25
0.3
0.35
0.4A
bsor
banc
e (a
t 517
nm
)10-3-10
(Horizontal dashed line represents absorbance value of Eosin-Y dye, without surfactant)
cmc
Figure 3.18: Dye micellization plot of 10-3-10 gemini surfactant
0.01 0.1 1Concentration (mM)
0
0.1
0.2
0.3
0.4
0.5
Abs
orba
nce
( at
517
nm
)
12-3-12
cmc
(The horizontal dashed line represents absorbance value of Eosin-Y, without surfactant.)
Figure 3.19: Dye micellization plot of 12-3-12 gemini surfactant
69

0.01 0.1 1Concentration (mM)
0
0.1
0.2
0.3
0.4
0.5
0.6
Abs
orba
nce
(at 5
17 n
m)
16-3-16
cmc
Figure 3.20: Dye micellization plot of 16-3-16 gemini surfactant
70

0.1 1 10 100Time (sec)
55
60
65
70
Surf
ace
tens
ion
(mN
/m)
10-3-1012-3-1216-3-16
0.1 1 10 100Time (sec)
30
40
50
60
70
80
Surf
ace
tens
ion
(mN
/m)
10-5-1012-5-1216-5-16
Figure 3.21: Dynamic surface tension plots of m-3-m and m-5-m gemini surfactants
0.1 1 100.1
1
10
0.1 1 100.1
1
10
0.1 1 100.1
1
1 100.1
1
10
Red
uced
dyn
amic
sur
face
tens
ion
Time
10-3-10 10-5-10
12-3-1212-5-12
Figure 3.22: Reduced dynamic surface tension plots of m-3-m and m-5-m geminis
71

Table 3.4: Esquilibrium surface tension data of m−3−m gemini surfactants
10-3-10 12-3-12 16-3-16Conc. γ Conc. γ Conc. γ
(mM) (mN/m) (mM) (mN/m) (mM) (mN/m)0.03 67.59 0.005 68.62 0.001 69.760.05 52.41 0.009 63.76 0.003 69.480.07 47.08 0.012 54.96 0.005 69.440.09 41.47 0.025 48.52 0.007 67.730.1 38.13 0.07 39.20 0.01 67.730.3 31.73 0.09 37.49 0.03 60.750.5 30.45 0.12 36.95 0.05 54.490.7 29.13 0.25 31.32 0.07 48.711 30.16 0.5 27.61 0.09 43.48
1.3 29.20 0.7 25.12 0.1 42.971.5 29.44 1 25.90 0.2 39.561.7 30.77 1.3 25.49 0.3 30.732 29.36 1.5 24.44 0.5 29.32
1.7 24.51 0.7 30.492 25.00 1 29.60
Table 3.5: Esquilibrium surface tension data of m−5−m gemini surfactants
10-5-10 12-5-12 16-5-16 16-5-16Conc. γ Conc. γ Conc. γ Conc. γ
(mM) (mN/m) (mM) (mN/m) (mM) (mN/m) (mM) (mN/m)0.007 64.59 0.01 60.67 0.009 60.34 0.1 31.730.015 64.42 0.015 59.81 0.01 58.67 0.2 29.730.03 61.88 0.03 57.38 0.02 54.98 0.3 28.480.06 56.45 0.06 48.36 0.03 51.27 0.4 27.90.12 51.87 0.12 37.78 0.04 47.64 0.5 27.460.25 42.62 0.25 26.54 0.05 44.55 0.6 26.730.5 32.44 0.5 25.59 0.06 41.55 0.8 26.090.7 28.7 1 23.86 0.07 39.82 0.9 26.571 28.98 2 23.97 0.08 37.73 1 26.052 29.31 4 23.73 0.09 32.64
72

Table 3.6: Conductivity data of m−3−m geminis
10-3-10 12-3-12 16-3-16Conc. k Conc. k Conc. k(mM) (µScm−1) (mM) (µScm−1) (mM) (µScm−1)0.03 4 0.005 10 0.001 40.05 16 0.007 24 0.005 50.07 30 0.009 28 0.007 50.09 44 0.012 29 0.009 60.1 54 0.025 40 0.01 70.3 144 0.05 76 0.03 80.5 227 0.07 107 0.05 130.7 298 0.09 136 0.07 171 427 0.12 162 0.09 23
1.3 571 0.25 295 0.1 291.5 659 0.5 575 0.2 501.7 719 0.7 801 0.3 662 853 1 1336 0.5 110
1.3 1536 0.7 1521.5 1692 1 210
73

Table 3.7: Conductivity data of m−5−m geminis
10-5-10 12-5-12 16-5-16Conc. k Conc. k Conc. k(mM) (µScm−1) (mM) (µScm−1) (mM) (µScm−1)0.007 7 0.01 7 0.009 70.015 8 0.015 10 0.01 100.03 9 0.03 13 0.02 130.06 12 0.06 15 0.03 160.12 18 0.12 28 0.04 260.25 39 0.25 45 0.05 380.5 69 0.5 64 0.06 460.7 95 0.1 84 0.07 580.9 112 1.5 107 0.08 691 122 2 126 0.09 75
1.2 134 2.5 146 0.1 891.5 152 3 163 0.2 1191.7 164 0.3 146
0.4 1700.5 2050.6 2270..8 278
74

Table 3.8: Absorbance data of m−3−m gemini surfactants at 517 nm
10-3-10 12-3-12 16-3-16Conc.(mM) Abs. Conc.(mM) Abs. Conc.(mM) Abs.
0.001 0.16190 0.005 0.18859 0.005 0.193540.005 0.16529 0.01 0.19996 0.01 0.190450.007 0.16617 0.03 0.19848 0.03 0.199610.01 0.16323 0.05 0.22559 0.05 0.205460.03 0.16549 0.1 0.20039 0.07 0.209940.05 0.17194 0.3 0.22334 0.09 0.204470.07 0.16520 0.5 0.22309 0.3 0.233040.1 0.16793 0.7 0.25151 0.5 0.311290.2 0.17572 0.9 0.30853 0.7 0.385670.3 0.19440 1 0.37357 0.9 0.444850.5 0.24553 1.2 0.40804 1 0.476880.7 0.32185 1.3 0.41460 1.2 0.541100.9 0.33912 1.5 0.51632 1.3 0.572471 0.33620 1.5 0.64091
75

Table 3.9: Dynamic surface tension data of m−3−m gemini surfactants
10-3-10 12-3-12 16-3-16t γ t γ t γ
(sec) (mN/m) (sec) (mN/m) (sec) (mN/m)0.1 67.2 0.14 63.11 0.11 69.460.3 67.2 0.16 63.32 0.12 69.46
0.41 67.2 0.2 63.53 0.27 68.40.5 67.2 0.22 63.53 2 67.8
0.53 67.2 0.3 61.84 3 67.71 67.2 0.61 57.6 4 67.7
1.15 67.2 1.12 55.91 5 67.73 65.6 2 54.85 6 67.75 65.6 2.85 54.21 8 67.7
6.8 62.4 4.08 54.21 10 67.77.4 62.4 5.27 53.36 15 67.710 62.4 6 53.36 20 67.715 60.8 8 53.36 25 67.7
20.5 60.8 9 53.36 30 67.722 59.2 10 53.36
25.4 56 15 53.3631.6 56 20 53.36
25 53.3630 53.36
76

Table 3.10: Dynamic surface tension data of m−5−m gemini surfactants
10-5-10 12-5-12 16-5-16t γ t γ t γ
(sec) (mN/m) (sec) (mN/m) (sec) (mN/m)0.12 50.82 0.13 60.56 0.12 61.840.26 47.44 0.19 60.99 0.5 61.840.39 46.59 0.25 60.99 0.93 61.840.62 42.35 0.35 60.99 1 61.840.82 41.51 1.31 55.06 2.6 61.841.02 40.66 1.34 55.91 3.75 61.841.97 37.69 1.35 55.06 3.77 61.842.14 37.27 1.64 53.36 4 61.84
5 35.2 1.69 52.52 4.24 61.848 35 1.79 51.67 4.62 61.84
10 35 2.07 49.13 4.97 61.8415 35 2.13 48.28 5.6 61.8420 35 3.24 44.89 6.49 59.2925 35 3.3 45.74 10.75 59.2930 35 6.07 38.96 13 59.29
6.3 38.12 15 59.296.43 38.12 17 59.298.9 34.73 18 59.2910 34.5 19 59.2913 34.3 20.7 59.2915 34.01 25 59.2920 34.01 30 59.2925 34.0130 34.01
77