chapter 3 privatization of insurance sector in...
TRANSCRIPT

Chapter 3
Privatization of Insurance Sector in India
3.1 Introduction
3.2 Liberalization and Privatization Concepts
3.2.1 Rationale of Privatization
3.2.2 Shortcomings of Privatization
3.3 Privatization in India
3.4 Economic & Financial Sector Reforms
3.5 Insurance Sector Reforms
3.5.1 Malhotra Committee
3.5.2 Insurance Regulatory and Development Authority of India
3.5.3 Milestones in Post Reform Period
3.6 Growth and Development of Indian Insurance Sector during Post Privatization
3.6.1 Growth of Life Insurance Sector
3.6.2 Growth of Non-life Insurance Sector
3.7 Conclusion

84
Chapter 3
Privatization of Insurance Sector in India
3.1 Introduction
Privatization has been extended over large part of the world in past two
decades embracing the industrial economies, transition economies of East Europe and
less developed world (Ram Mohan, 2005). In recent years, many industrially
advanced countries as well least developed countries have been taken macroeconomic
reforms, which involved structure adjustment programme. The financial sector which
typically owned or controlled by the state itself was the focal point of attention. The
developing countries like India along with other semi industrialised countries have
opened up their financial sector (Mitra & Ghosh, 2010b). The Twentieth Century
A.D. beheld two great transformations, nationalization in the first half of the century,
the process of which extended to considerably large portion of the century and
privatization in the last two decades of the century, the process of which is still rolling
on (Faiz, 2008).
When nationalization went down in line, countries believed that the change of
the ownership from private to public would be able to solve most of the social,
economic and political problems of the economies (Faiz, 2008). State-led policies,
programs, and performance earmarked for critics because of the growing resentment
among citizens with bureaucratic inefficiencies, diminishing performance of public
enterprises, shrinking public confidence in government institutions, worsening
situation of inflation allegedly caused by public sectors deficits and endorsement for
market-driven remedies. This criticism for state-centred policy was reinforced further
by the decay of major socialist states and the worldwide adoption of market ideology.
Therefore, the period between early 1980s and late 1990s saw the escalation of
market-centred policies all over the world. In developing countries, the market-driven
policies such as liberalization, deregulation and privatization were embraced or forced
under stabilization and structural adjustment programs. Among these policies,
however, the privatization of public resources, projects, and services has been one of
the most persuasive and noticeable changes in the recent history of strategic reforms.
Such a pivotal policy change justified on various grounds and brought by various

85
national and international factors has serious economic, political, and social
implications for developing nations (Haque, 2001).
“Is globalization good?” is a moot point among economists. To some people,
globalization is a brave new world with no barriers, while to others it spells doom and
disaster (Lamsal, n.d.). Neoclassical economists hold that countries should deregulate
industries and liberalise markets. In the theory, this will stimulate greater efficiency,
greater professionalism in the market, proliferation of more products and services and
expansion of market. Contrary to this, a growing number of economists are
challenging the benefit of deregulation (Devi, 2011).
3.2 Liberalization and Privatization Concepts
Liberalization is a process through which market forces gain priorities in
resource allocation and price setting in contrast with government (Roland, 2008).
Liberalization, especially economic liberalization is purging and trimming of state
monopolies in the economic sphere. Privatization has been perceived as a centrepiece
of economic liberalization and bracing public sector efficiency by ensuring private
sector participation in the economy. At the micro level, privatization is the handover
of responsibilities, management and ownership held by the government sector to
private sector. At a macro level, privatization may be considered as transformation of
public sector led mixed or socialist economy into a private sector-dominated market
economy. At the broadest level, privatization is economic liberalization bringing
market forces into the economy (Lamsal, n.d.).
Privatization is indeed a product of the 1980s. The word found its way into a
standard dictionary in 1983 (Ram Mohan, 2005). The term ‘privatization’ was devised
long before but the privatization as policy is the product of the 1980s. The term was
coined in 1936 in a chronicle published in the Economist (Faiz, 2008). Privatization in
simple words refers to the process of transfer of ownership of state-owned or public
owned property to individuals or groups that intend to utilize it for private benefits
and run entities with the aim of profit maximization (Kousadikar, 2013). Privatization
may also be considered as any material transaction by which the state’s ownership of
corporate establishment is reduced (OECD, 2009). The word “Privatization” has been
receiving much attention in business, government and academic community all over
the world. Actually, the language and programme of privatization have spread so

86
rapidly throughout the world that the phenomenon can be linked to a revolution or a
boon (Faiz, 2008).
During the past two decades, various forms of privatization regardless of their
economic conditions, ideological positions and political orientations were launched by
the governments all over the world. This current trend represents a reversal of the
traditional post war policy based on the belief of welfare state, planned development
and public-sector-oriented economic growth which prevailed in both developed and
developing nations during the period between the 1950s and 1970s (Haque, 2001). It
is generally hold that the private sector has higher efficiency in their working since it
seeks to maximize profit and in such a condition limited resources of society are
utilized optimally and efficiently. Now if privatization process is considered as a basic
step towards economic growth and opulence of industrial market economies, it can be
hoped that higher economic growth and development will be achieved as the
privatization spread in the countries (Rahbar, Sargolzaei, Ahmadi, & Ahmadi, 2012).
3.2.1 Rationale of Privatization
Many industrial advanced countries, socialist economies and developing
countries belonging to Asia, Africa and Latin America have introduced mammoth
agenda of privatization during the last two-three decades. Many industrial market
economies have brought out the programme of privatization on their own privilege,
while many developing countries were obligatory to undertaken privatization as a
condition for assistance under the economic stabilisation and structural adjustment
programmes by International Monetary Fund (IMF) and World Bank. Privatization is
generally perceived to have positive outcome. Privatization has ameliorated welfare,
profitability, returns to owners and stakeholders, and economic efficiency. But public
perceptions of privatization are generally negative and they are getting worse
(Birdsall & Nellis, 2005).
There are two broad groups about the possible outcomes of this reform process
pointed at financial liberalization: the Goldsmith- McKinnon-Shaw school and
Keynes-Tobin-Stiglitz (also called the Structuralist and Neostructuralists School).
Each of these groups provides background, rationale and intellectual justification for
financial liberalization. McKinnon and Shaw made it clear that the lack of financial
deepening was a major hurdle to growth and development (Sen & Vaidya, 1998).

87
Financial liberalization stimulates productivity in the economy by providing higher
incentives to save and enhancing the allocation of funds to the most productive and
profitable projects (Ahmed & Islam, 2010). This view is opposed by the Keynesian-
Tobin-Stiglitz school of thought. This group (called neostructuralists) has brought
forward a number of economic rationales to justify government intervention in the
area of prudential regulation and supervision, particularly due to the de facto role of
government as an insurer of the financial system (Ahmed & Islam, 2010).
According to the some scholar on privatization, the rationale for privatization
is as follows:
Positive Rationale
In general, privatization has been undertaken under the aegis of increasing
economic efficiency, streamlining public sector, lessening government borrowing,
reducing deficits, generating government revenues, reducing state influence in
economy, persuading market forces, enhancing competition, amplifying customers’
choices and upgrading service quality (Ghosh, 2013; Haque, 2001). In most countries
and sectors around the world privatization yields great benefits at the firm level and
macroeconomic level and there is strong correlation between liberalization and return
to growth (Nellis, n.d.). Financial liberalization helps to raise growth rate through a
number of direct and indirect channels (Sadak, 2005). Some of these directly affect
the drivers of economic growth by enhancement of domestic savings, reduction in the
cost of capital and transfer of information & communication technology. Indirect
channels which in some cases could be even more important than the direct ones
include production specialization, better risk management and improvement in
macroeconomic policies (Hrab, 2004).
The rationale behind privatization programs in the developing world is the
belief that it will increase efficiency through entrepreneurial management and
competition, foster economic growth, increase flow of goods and services
underpinned by the developments of technology, and enlarge job opportunities in
domestic market (Bhattacharya, 2004; Errunza & Mazumdar, 2000). Ahmed and
Islam (2010) have briefly discussed some areas where we can have some changes as a
result of financial liberalization (a) increase in propensity to save and more savings
available to investors, (b) allocative efficiency and improved performance of

88
investment, (c) reduction of corruption and rent-seeking activities, (d) level of
competitiveness, and (e) curb market rate. Some other important reasons for
privatization are development of product markets, factor markets and security
markets. Welfare economist assumed that efficiency can be reached through
competitive marketplace. If privatization stimulates competition, privatization can
lead to greater efficiency (Parker & Saal, 2003).
Some scholars tend toward the major rationales of privatization in terms of the
following four categories (a) the efficiency argument, which assumes state enterprises
responsible for inefficiencies and advocates privatization for better outcomes (Haque,
2001; Walle, 1989), (b) the property ownership argument, which makes the allegation
that public ownership is discouraging managers in public enterprises to work
efficiently since they have no stake in them (Haque, 2001), (c) the distortion
argument, which assumes government intervention liable for creating distortion in
resource allocation (Haque, 2001), and (d) the fiscal argument, which considers
excessive government intervention as the root cause of budgetary deficits. It is
perceived that divestiture will cut government expenditures and help to restore
budgetary balance (Haque, 2001; Walle, 1989).
Critical Rationale
Beyond the formal or positive rationale of privatization, there are some
pushing factors both internal as well as external behind this radical policy change.
1- The decision to privatize was mainly taken because of fiscal necessity,
rather than desire for improved efficiency. Government had raised huge amount by
selling state owned enterprise which could be seen as a potential solution to reduce
fiscal deficit in many countries or to improve government’s finances. Therefore,
Privatization can be a result of failure of state ownership (Katsoulakos & Likoyanni,
2002; Parker & Saal, 2003; Sunderland, 2011). In India, when economic reforms
began in 1991, the country had confronted with severe balance of payments crisis.
Countries that privatized at full tilt did so either because of critical macroeconomic
conditions that include hyperinflation, declining GDP, and balance of payments crisis
or a sharp political discontinuity leading to a regime change. Under these
circumstances, hard economic healing was up to mark. Privatization was a convenient

89
way to reduce the fiscal deficit and raise foreign exchange, e.g., by selling state
enterprises to foreign investors and increase FDI (Kapur & Ramamurti, 2002).
2- In most countries, privatization usually reflects the prevailing state ideology
which has been marked as neoconservative, neoliberal or new right position holding
pro-market assumptions and favouring market-oriented policies such as privatization,
deregulation, subsidy cuts, free trade, market-based interest and exchange rates,
foreign direct investment and secured property rights. It has already been
acknowledged by some scholars that in advanced developed nations such as Canada,
U.K. and U.S., privatization has been an ideologically charged phenomenon which
came into the force not due to its intrinsic strengths but due to the influence of
neoconservative political leaders and highbrows believing that the private sector is
surpassing the public sector. More specifically, the prominent political leaders of the
1980s including Margaret Thatcher in the U.K., Ronald Reagan in the U.S., and Brian
Mulroney in Canada allegedly had such neoliberal or neoconservative ideological
predispositions (Faiz, 2008; Haque, 2001).
3- Beyond the ideological influence on top policy makers, there were various
forms of external pressure which led to the proliferation of privatization in developing
countries. Especially for Latin American countries, the propagation of neoliberal
approach profoundly was due to rigorous international pressure aggravated by their
huge external debts. It has already been pointed out by some experts that vogue of
privatization in developing countries went beyond ideological belief, and was
considerably determined by international agencies and multinational banks (Haque,
2001). Liberalization and privatization can also be a result of bilateral/multilateral
arrangements. The mammoth players in the global marketplace have a crucial interest
in liberalization particularly due to saturation in industrialized countries, strong
growth in emerging countries, potential future growth in emerging markets, expected
efficiency gains through diversification, economics of scale, etc.
4- Finally, The leading political parties have tried to gain public support and
win elections by using the privatization rhetoric (Haque, 2001). Therefore,
Privatization can also be a political decision taken without proper analysis or
consideration of possible short or long-term impact on poverty and income
distribution (Nixson & Walters, 2004).

90
3.2.2 Shortcomings of Privatization
Privatization has plausible implication on social, economical and political
landscape of a country but it also has certain critical implications on developing
countries.
1- Firstly, in terms of internal economic implications: It is generally argued
that the privatization by no means saw any significant improvement in the developing
world in terms of expunging poverty, reducing unemployment, bridling trade
imbalance, accelerating economic growth and bring down external debt and
dependence. Private enterprises tend to retrench workers, introduce capital-intensive
technology, hire foreign labour demanding lower wages and worsen unemployment
(Haque, 2001). Privatized economy is most of time confronted with a situation where
levels of poverty and inequality is rising and overall growth rate in current and
projected income per capita become too low to dwarf the increases in inequality and
poverty (Nixson & Walters, 2004).
2- Secondly, with regard to adverse social implications: Privatization is
usually exacerbated income gaps and creating loathsome distributional effects in
developing countries. It is all because when the profit-making state enterprises are
privatized, the incomes generally shift from public exchequer representing all tax-
paying citizens to few opulent investors. Private firms are focus more on profits,
prices and costs rather than social objectives (Bayliss, 2002; Kousadikar & Singh
2013). At the centre of all criticism is the notion that privatization has been hard-
pressed the poor, beleaguered workers, and privileged the few affluent and powerful.
Privatization is throwing people out of work or squeeze them to accept jobs with
lower pay and less security, raise prices of goods and services, bestow opportunities
to corrupt, and generally makes the rich more richer and the poor more poorer
(Birdsall & Nellis, 2005).
3- Finally, in terms of critical political implications: There has been a concern
that privatization may be antithetical to democratic institutions due to the shrinking
public support for such a policy that may have adverse impact on various state-led
social programs. Another political implication of market-based policy has been the
increasing power of organized capital and the diminishing power of the working class.
This is particularly due to the shift of resources and decisions from the public sector

91
to the private sector as well as delineation of trade unions (Haque, 2001; Walle,
1989).
3.3 Privatization in India
After independence, India got a choice of how to run the economy. Jawaharlal
Nehru, the first prime minister of India, was enormously influenced by avowed
success of Soviet planning. He believed that capital intensive industries ought to be
handled by the state. This socialist bent led to nationalization of banks, coal, insurance
and other industries (Sinha, n.d.). Rajiv Gandhi became the Prime Minister of India
initiated a process of simplifying licensing process in the budget of 1985–86 which
lasted in 1987 when reform was abandoned. But, the regulations were nevertheless
unaffected. Liberalization eventually returned to India in a much more dramatic and
lasting form in 1991 (Jenkins, 2003).
In India, it is unlikely that the Narasimha Rao government would have
embraced economic reforms out of a genuine desire to lift the performance of the
Indian economy if the macroeconomic crisis of 1990–91 had not pushed the country
to the stage of near bankruptcy. The economy tread on the heels of crisis due to some
policies followed during the 1980s. This forced the Rao government to accept
International Monetary Fund and World Bank help on the condition of economic
reforms (Chai & Roy, 2006). Fiscal imbalances in India which assumed serious
proportions since the mid 1980s had two important facets. First, the outpacing of
revenues growth by expenditure growth considerably restrained the resources
available for public investment in the economy. Second, the increasing diversion of
household savings to meet public consumption requirements not only expand public
debt to unfeasible levels, but also reduced the resources available for private
investment and resulted in unprecedented balance of payments crisis (Bajpai, 2002).
The debilitating blow of rising fiscal deficits and the steep rise in oil prices
during the Gulf crisis of 1990 had put pressure on exchange rate and fuelling
expectations about imminent devaluation of the currency. Political instability in 1990,
as reflected in two changes of prime ministers within a year led to lack of confidence
of Non-Resident Indians (NRIs) in the government's ability to manage the economy.
The expectation of devaluation of rupee and the fall in confidence led to withdrawal
of deposits in Indian banks by NRIs and withdrawal of capital by other external

92
investors. Foreign exchange reserves dwindled to a level that was less than the cost of
two weeks’ worth of imports. The spectre of default on short-term external loans
loomed and led to downgrading of India’s credit rating (Srinivasan, 2003). To burst
out of this dire macroeconomic and balance of payments situation, India’s new
government got to grips with a fairly comprehensive policy reform package. The
reforms tried to consciously fashion the new policy. Long time critics of India’s
development strategy widely welcomed this change (Nagaraj, 1997).
The major thrusts of reforms were (a) stabilization and macro-economic
balance through fiscal, monetary and exchange rate policies, (b) liberalized trade
regime with no import licensing and tariff rates, (c) an exchange rate system which
makes rupee convertible at least for current account transactions of balance of
payments, (d) a competitive financial system with sound regulations, (e) an industrial
sector free of many controls, and (f) an autonomous, competitive and streamlined
public sectors (Satija, 2009). The Indian government had undertaken fundamental
changes in the content and approach to economic policy through pro-market policies,
which are classified into (a) fiscal policy reforms including tax reforms, expenditure
management, restructuring of the public sector and fiscal & monetary coordination,
(b) financial sector reforms including banking sector and capital market, (c) industrial
policy and abolition of the license system, (d) foreign investment policy reforms, (e)
reforms in the external sector covering foreign trade and exchange rate policies, and
(f) agricultural sector reforms regarding internal and external trade in agricultural
commodities (Ghosh, 2013).
Extending the ongoing reforms, the Government of India promulgated in the
budget of 1998-99 that stake of Government would fall to 26 per cent in PSEs (Public
Sector Enterprises) except in the strategic enterprises where the Government will
continue to hold the majority of shares. In the same year, the Government of India
announced that the strategic enterprises only covered (a) arms, ammunition and
defence equipments, (b) atomic energy except use of nuclear power in agriculture, and
(c) railway transport (Ram Mohan, 2005). In the following budget of 2000-01, the
state was willing to reduce the Government’s share even below 26 per cent in non-
strategic enterprises if any economic urgency arises (Faiz, 2008).

93
3.4 Economic & Financial Sector Reforms
Financial liberalization is a pre-eminent part of the process of economic
liberalization. Financial sector reforms were started in India in 1992–93 to promote a
diversified, efficient and competitive financial system. India’s financial sector
liberalization has been a comprehensive program involving issues related to banking,
capital market, fiscal policy and international financial integration (Sadak, 2009).
Financial sector reforms include banking sector and non-bank financial sector. The
non-bank financial sector includes reforms relating to the capital market, development
finance institutions, insurance and mutual funds and liberalization of capital flows
(Joshi, 1996).
The three influential reports by the Chakravarty Committee (1985), the
Vaghul Committee (1987) and the Narasimham Committee (1991) & (1998) gave
impetus to financial sector reforms. The first committee suggested ways of activating
treasury bills market so that open market operations could gradually become the
dominant instrument of monetary policy. The second committee recommended
phased decontrol of money markets and gradual integration of these markets with
other short-term markets such as the treasury bills market (Sen & Vaidya, 1998). Mr.
M. Narasimham, a former RBI governor was the chairman of the Committee on
Financial Systems (CFS) and the Committee on Banking Sector Reforms (CBSR).
The report of CFS was submitted in 1991 and that of CBSR was submitted in 1998.
The CFS took note of excessive administrative and political interference in internal
management and credit decision making in public sector banks. The CBSR was
formed to review the progress made in reforming banking sector and to chart the
actions needed to strengthen the foundation of banking system. The CFS and CBSR
(henceforth the first and second Narasimham Committees) provided the blueprint for
reforming the financial system (Bery & Singh, 2006).
RBI has implemented several key recommendations of the Chakravarty
committee and the Vaghul committee with introduction of scheme of 182 days
treasury bills in 1986, foundations of The Discount and Finance House of India
(DFHI) in 1988 and introduction of commercial paper and certificates of deposit in
1989. Consequently, by late 1980s, there was inevitable deregulation and
development of short-term segment of financial market with little development in
credit and capital market (Nandy, 2010). More radical reforms had to wait till the

94
endorsement of structural adjustment cum stabilization program by Indian
government in 1991. The pre-eminent reforms included deregulation of interest rates,
advancement of securities markets, building a credible risk-free yield curve, greater
reliance on open market operations, auctions of government securities, phased
decontrol of the capital account and streamlining supervision of banking sector with
international standards & practices. However, neither committee took up the cudgels
for denationalization (Bery & Singh, 2006).
Banking sector reforms were major point of attention in Rao government.
Consequently, a number of measures specific to banking system were undertaken to
ameliorate its long term viability as a commercial entity. The self determination of
price for banking products on commercial considerations, moderation in various
balance sheet restrictions in the form of statutory pre-emption and introduction of
prudential norms pertaining to income recognition, asset classification and capital
adequacy were some measures of banking sector reforms. The early manoeuvre in
banking sector was geared towards withdrawing the functional & operational
constraints encroaching on banks’ operations and providing them greater operational
autonomy (Misra, 2007).
As far as capital market reforms are concerned, several plans have been
prepared in past few years to ensure smooth functioning of capital market. The capital
market reforms witnessed first move when the Capital Issues (Control) Act of 1947
was rescinded and the office of Controller of Capital Issues abolished. The Securities
and Exchange Board of India was established to ensure limpidity of trading practices,
speedy settlement procedures, full disclosure for investor protection and supervising
market intermediaries in the capital markets (Gupta, 1998; Vashisht, 2002;
Vijayakumar, 2012). Some important initiatives taken as part of reform process
opened up doors of capital market for foreign institutional investors and allowed
Indian companies to access international capital markets by the mechanism of global
depository receipts and favourable tax treatment (Ahluwalia, n.d.). To provide greater
transparency, anonymity and lower transaction cost, a nationwide ‘screen-based
trading’ system was introduced in 1992, through establishment of National Stock
Exchange (NSE) (Ansari, 2006).
As far as external payment regime is concerned, most of restrictions on current
transactions were withdrawn. The exchange rate regime is officially described as

95
market driven with no target rate, but RBI reserves the right to intervene in the market
and guide the exchange rate in the directions of appropriate competitiveness (Bery &
Singh, 2006).
One can broadly classify the financial sector reforms as being three-pronged
aimed at (a) liberalizing the overall macroeconomic and regulatory environment
within which financial institutions function, (b) strengthening the institutions and
improving their efficiency & competitiveness, and (c) establishing and strengthening
the regulatory framework and institutions for overseeing the financial system
(Chanda, 2008). As a corollary of these reforms, there has been a rapid growth in the
extent of monetization and financial intermediation in the economy. Various financial
entities outside the banking segment including mutual funds, non-banking financial
companies and primary dealers have come to play an important role in resource
mobilization and allocation. The role of the private sector has also been increased.
3.5 Insurance Sector Reforms
The Indian insurance industry was revolved around two public sector players,
viz., Life Insurance Corporation of India and General Insurance Corporation of India.
LIC has been operated in the life segment lodge in the people brain by providing wide
range of services, building an extensive network of branches and offering
employment to a large number of agents. The non-life insurance sector was
overwhelmingly dominated by GIC. One of the major impetuses for the
nationalization of insurance companies in 20th century was to channel greater
resources towards development programs. It also sought to increase insurance market
penetration and bring down incidence of failures of insurance companies which were
thought to be a result of mismanagement. But, in the post-nationalization period, GIC
and LIC funds were nevertheless used to finance government deficits and this
severely constrained their operations. Moreover, these corporations were also asked to
channel funds towards meeting social objectives. With the initiation of reforms in
financial sector in early 1990s, the need to restructure insurance sector was realized
(Gupta, n.d).
3.5.1 Malhotra Committee
A move to liberalise insurance sector was taken in April 1993 with
establishment of Malhotra committee so called committee on insurance sector

96
reforms. Malhotra committee was headed by R. N. Malhotra, a former finance
secretary and governor of Reserve Bank of India. “The Committee was established to
assess insurance sector strengths and weaknesses in terms of the objective of
providing high quality services to the public and serving as an effective instrument for
mobilization of financial resources for development, to review the then existing
structure of regulation and supervision of insurance sector and to suggest reforms for
strengthening and modernizing regulatory system in tune with the changing economic
environment” (“Consultation Paper on Revision of The Insurance Act 1938 & The
Insurance Regulatory and Development Authority of India Act 1999,” 2003;
“Malhotra committee recommendation,” 1998). The Malhotra Committee
recommended introduction of concept of “professionalization” in the insurance sector
(Dutta, 2012). The committee recommended opening of insurance sector to private
players and setting an independent regulatory authority to create a level playing field
for all entities.
The terms of reference of the said committee were:
1. To review present structure of insurance industry and to evaluate its strength and
weakness in term of offering wide-range of insurance products with a high quality
of services to public and operating as an effective means for mobilisation of
financial resources for development of the economy;
2. To formulate recommendation for modifying structure of insurance industry and
general framework of policy consistent with the structural changes in the
economy and financial sector;
3. To make precise proposal regarding the LIC and GIC with a view to improve
their functioning in changing economic environment;
4. To examine present structure of regulations and supervision of insurance sector
and to make suggestions for strengthening and modernising the regulatory system
in dynamic economic environment;
5. To review and make suggestions on the role of surveyors, intermediaries and
ancillaries of the insurance sector;
6. To make suggestions on such other matters as the committee considers relevant
for the growth and development of insurance sector (Sethi & Bhatia, 2007).
The Malhotra Committee came up with the recommendations in January
1994. The committee appointed a private opinion poll agency to conduct a market
97
survey for finding out satisfaction level of users of life insurance and assess their
perceptions on possible liberalization of insurance sector. Based on the findings
of survey, the committee underlined some positive and negative aspects of
development of LIC which are stated as under:
On the positive side,
1. LIC was proliferated insurance culture widely across India,
2. Huge amount of saving was mobilised for national development and fund was
used to finance social sectors such as housing, electricity, water supply,
sewerage, medical and education,
3. LIC was a name of trust among insuring public, and
4. A large pool of talented insurance professionals was built up.
On the negative side,
1. The enormous market and service network of LIC was inadequately
responsive to customer needs,
2. There was lack of insurance awareness among the public,
3. Lack of life insurance product with reference to the customer needs,
4. Term assurance plans were not encouraged and unit linked products were not
available,
5. Price of insurance products were quite high and return from life insurance was
significantly lower than other saving instruments,
6. LIC was facing some serious problem due to mismanagement and poor
structure. The central and zonal offices were excessively overstaffed,
7. Work culture within the organisation was not satisfactory,
8. Trade unions had indulged in restrictive practices,
9. The efficiency of the organisation and quality of customer service had
seriously affected due to lack of computerization (Mitra & Ghosh, 2010b).
“The Malhotra Committee touched both life and general insurance business.
The report of the committee covered three major topics (a) liberalization, restructuring
and regulation of insurance, (b) pricing of product and distribution of services, and (c)
surveyors, reinsurance and ombudsmen (Siddaiah, 2012). The main recommendations
of Malhotra Committee were:

98
Liberalization
Liberalization of insurance industry by permitting domestic and foreign
private players was among the several important recommendations the committee
made so far. Monopolies are awful in themselves especially when they are
government monopolies because they do not keep themselves viable. At the time of
nationalization of insurance business, it could have been known that state monopolies
would not survive over a long time or lead to lack of competition. Yet, at that point of
time, it was believed that control over huge funds and their utilization was absolutely
necessary to ensure fulfilment of state priorities for investment (Palade, Shah, &
Lunawat, 2008). Therefore, Malhotra committee recommended that state monopoly of
insurance sector should be broken up by allowing domestic and foreign private firms
in the market.
The idea behind this measure was to ensure utilization of untapped potential,
introduction of competition, expansion of business and better choices to customers in
terms of variety of products, reduction of prices and efficient customer service. In this
direction, committee recommend certain measures to be taken (a) no firm should be
allowed to do business in both life and general insurance, (b) insurance regulatory
authority should be regulatory authority of insurance companies, (c) auditors of the
insurance company should report to insurance regulatory authority, and (d) entry to
foreign insurance companies should be on selective basis i.e. they should be required
to float an Indian company preferably by way of joint ventures with Indian partners
(Kumar, 2010; Rao, 2000). In order to ensure financial strength of insurance
companies, the committee recommended three basic measures to be taken (a) new
entrant should have minimum paid up capital of Rs 100 crores except in case of state
level co-operative institution, (b) the promoters' holding in a private insurance
company should not be more than 40 per cent of the total and less than 26 per cent,
and (c) no person other than the promoter should be allowed to hold more than 1 per
cent of the equity (Bhaumik, 1999). The limitation on capital ownership would restrict
contribution to those who have a clear sense of responsibility to the corporation.
Nobody should be allowed to have monopoly control over the corporation by owning
a large chunk of the capital (Venugopa, 2007).

99
Supervision and Regulation
On nationalization of life insurance in 1956 and general insurance in 1973,
LIC and GIC were provided with most of the regulatory function which became
previously carried by Controller of Insurance (COI). Though COI a statutory body
attached to the ministry of finance continues to be the supervisory and regulatory
authority for insurance industry. To ensure prudent practices while opening insurance
industry to competition, the committee recommended that COI should be empowered
as prescribed in the Insurance Act. It was also proposed that a multimember statutory
body on similar lines to SEBI having full functional autonomy and operational
flexibility should be established in order to create a level playing field for all insurers.
Therefore, establishment of insurance regulatory authority with supervisory and
regulatory powers covering all aspects of insurers in conducting transparent and
smooth business was among the important recommendation of committee. In brief,
insurance regulatory authority should be act as regulator, controller, supervisor,
initiator, conductor, mediator and detector of insurance industry. In order to keep it as
an autonomous body, the committee recommended that 0.05 per cent of yearly
premium income of insurance companies be levied to finance its establishment and
activities (Rao, 2000).
Restructuring
The committee observed that both life and non life insurance sector is facing
some serious problem due to mismanagement and poor structure. Therefore,
committee proposed restructuring of LIC and GIC.
Life insurance sector: The committee recommended that work should be
divided between central and zonal offices of LIC. Central office should concentrate
on policy formulation, review and evaluation, pricing and actuarial assessment,
product development, personnel policies, investments polices, systems development,
etc. Zonal offices should look after the insurance business and related matters. It is
generally viewed that state ownership lead to delay and rigidity in decisions making.
Therefore, LIC's should be bringing out of state ownership. At that time, LIC had a
capital of Rs. 5 crore, contributed entirely by the central government. This amount is
not adequate for a life insurer giant. Therefore, committee recommended that capital
of Rs 5 crore should be raised to Rs 200 crore, where 50% should be held by the

100
government and the rest by the public at large including company employees (Kapila,
1996).
Non Life insurance sector: The committee recommended that insurance
companies should reorganize the staff structures and hierarchies in their offices. At
that time, the four subsidiary companies were over staffed in their head offices,
regional offices and even divisional offices. Many metropolitan and urban branches
were over-staffed; rural and semi-urban branches were often under-manned.
Therefore, it became necessary to utilized excess staff for strengthening the branches.
There were also numerous restrictive practices which need to be eliminated in order to
revamp work culture and productivity. Furthermore, GIC and its subsidiaries were
come within the definition of “State”, since the total share capital was directly or
indirectly contributed by the Government of India. In the committee’s views, broad
basing their shareholding is needed to operate in a more competitive environment. As
far as GIC is concerned, it was proposed that GIC should cease to be a holding
company of four of its subsidiaries and should act as a national reinsurer. It was
further recommended that share capital of GIC should be raised to Rs. 200 crore from
its present level of Rs.107.50 crore, where 50% of the equity should be held by the
government and the rest by the public at large including employees of GIC. As far as
the four subsidiary companies are concerned, it was proposed that they should operate
as independent companies run by a board. It was further suggested that the equity
capital of each of these companies should be raised to Rs.100 crore with 50% holding
by the government and the rest by the public including employees of the respective
companies (Kapila, 1996).
Investment Regulations
Keeping in view present developments in the capital market and stiff
competition from other saving institutions, the Malhotra committee recommended
certain modifications in mandated investment pattern followed by insurance
companies. The committee recommended that (a) investment in central government
securities should not be less than 20 per cent and the special deposits with government
should continue to be considered as investment in central government securities, (b)
state government securities and government guaranteed securities inclusive of central
government securities should be not less than 40 per cent as compared to the existing
50 per cent, and (c) investments in socially oriented sectors including above should
101
not be less than 50 per cent as compared to the existing 75 per cent. However, no
changes should be made to the present level of investments in other than approved
investments. Furthermore, investments of any insurer should not be more than 5 per
cent of the subscribed equity share of any company (Venugopal, 2006).
Rural Insurance
The committee proposed that life insurance should provide cheap term
insurance coverage to relatively backward sections of society including working
women. For bringing insurance to door step of rural people, institutions including
panchayats, voluntary organisations, mahila mandals and co-operatives should be
sought. Apart from these, new entrants into the life insurance business should be
mandate to underwrite a specified proportion of their business in rural areas and
penalties are to be imposed by the Insurance Regulatory Authority for defaulters. The
sponsored relief-oriented welfare schemes except those having an element of
insurance should be transferred from LIC to concerned government authorities (Rao,
2000). Postal life insurance should be allowed to operate in the rural market.
Pension Funds
Pension fund schemes should be fully exempted from tax. Private pension
funds should be allowed to pay pension to their members under the careful scrutiny of
regulatory authority and unit-linked pension plans should be popularised. The
committee emphasised that contribution to pension funds by self-employed
professionals, traders and workers in the unorganized sectors should be promoted. It is
suggested that substantial concessions should also be available for contributions to
pension funds and this should cover schemes managed by all the insurance companies
as well (Kumar, 2010).
Customer Service
Information and processing technology was insufficient to carry out number of
statistics for efficient rate-setting and supervision of insurance business. There should
be an integrated and effective management information system. The committee was
set up a time limit of 12 to 18 months for comprehensive computerisation in LIC. The
Committee believed that imaginative and prudent use of information technology
would be lead to efficient customer service, effective management and meaningful
regulation (Kapila, 1996). For ensuring efficient customer services, the committee

102
further recommended that LIC should continue as a single entity, pay interest on
delays of claim beyond 30 days, use the revised mortality table and revise premium
after every 10 years. With regard to general insurance industry, the committee
recommended that the institutions of ombudsman should be set up (Bhole &
Mahakud, 2009; Gulati, 2007).
Immediately after the recommendations of Malhotra committee, a new
committee (called Mukherjee committee) was formed in 1995. The Mukherjee
committee submitted its report in 1997, but recommendations of Mukherjee
committee never made public. Information from unofficial sources unfolded that the
committee proposed inclusion of certain ratio in balance sheet of insurance companies
to bring more transparency in accounting standards.
3.5.2 Insurance Regulatory and Development Authority of India
The enactment of any legislation is not facile process. It requires lot of efforts
and time especially with reference to India. Based on the recommendation of
Malhotra committee regarding establishment of a strong, effective and independent
regulatory body to protect interest of policyholders and development of insurance
industry, the Government of India had established interim regulatory authority in
January 1996 through an exclusive order. Later on, this Interim Regulatory Authority
becomes Insurance Regulatory and Development Authority of India (Kumar, 2010).
The constitution of IRDAI is a landmark in landscape of financial sector. The
Insurance Regulatory and Development Authority of India Act provides for
composition of IRDAI, tenure of office chairperson and other members, removal from
office, salary and allowances of chairperson and members, duties, power and function
of IRDAI, finance, account and audit, and other miscellaneous provision (Insurance
Regulatory and Development Authority of India Act, 1999). Insurance Regulatory and
Development Authority of India Act made several amendments to the Insurance Act
1938, LIC Act 1956 and GIC Act 1972 which revoked the monopoly conferred to the
Life Insurance Corporation of India and General Insurance Corporation of India
(Karthikeyan, 2007; Raja Babu, 2012).
IRDAI as an autonomous body was formed on April 19, 1999. IRDAI
entrusted with the task of regulating, supervising and developing insurance and re-
insurance business in India. IRDAI started its functioning on April 19, 2000 headed

103
by N. Rangachary as its first Chairperson with 4 full-time directors, 2 part-time
directors and 25-members in Insurance Advisory Council. The members of the
council represent various industries and professions (Narula, 2012).
IRDAI as a regulatory authority has heavy responsibilities and difficult roles
to play. On the one side, it has to protect against malpractices and secure fair
treatment to policyholders. On the other side, it has to impose restrictions in such a
manner that growth of insurance industry is not hampered. IRDAI regulations cover
minimum requirements for best practices in the area of licensing, prudential
regulations and requirements, supervisory powers, managing asset qualities and
enhancing corporate governance.
Objectives of the Insurance Regulatory and Development Authority of India
1- To protect the interest of policyholders of insurance policies;
2- To bring about speedy and orderly growth of the insurance industry and to
provide long term funds for accelerating growth of the economy;
3- To set, promote, monitor and enforce high standards of integrity, financial
soundness, fair dealing and competence of those it regulates;
4- To ensure speedy settlement of genuine claims, to prevent insurance frauds
and other malpractices and put in place effective grievance redressal
machinery;
5- To promote fairness, transparency and orderly conduct in financial markets
dealing with insurance and build a reliable management information system to
enforce high standards of financial soundness amongst market players;
6- To take action where such standards are inadequate or ineffectively enforced;
7- To bring about optimum amount of self-regulation in day-to-day working of
the industry consistent with the requirements of prudential regulation.
Functions of Insurance Regulatory and Development Authority of India
1- Issue to the applicant a certificate of registration; to renew, modify, withdraw,
suspend or cancel such registration;
2- Protection of the interests of the policy holders in matters concerning
assigning of policy, nomination by policy holders, insurable interest,
104
settlement of insurance claim, surrender value of policy and other terms and
conditions of contracts of insurance;
3- Specifying requisite qualifications, code of conduct and practical training for
intermediary or insurance intermediaries and agents;
4- Specifying the code of conduct for surveyors and loss assessors;
5- Promoting efficiency in the conduct of insurance business;
6- Promoting and regulating professional organisations connected with the
insurance and re-insurance business;
7- Levying fees and other charges for carrying out the purposes of this Act;
8- Calling for information from, undertaking inspection of, conducting enquiries
and investigations including audit of the insurers, intermediaries, insurance
intermediaries and other organisations connected with the insurance business;
9- Control and regulation of the rates, advantages, terms and conditions that may
be offered by insurers in respect of general insurance business not so
controlled and regulated by the Tariff Advisory Committee under section 64U
of the Insurance Act, 1938 (4 of 1938);
10- Specifying the form and manner in which books of account shall be
maintained and statement of accounts shall be rendered by insurers and other
insurance intermediaries;
11- Regulating investment of funds by insurance companies;
12- Regulating maintenance of margin of solvency;
13- Adjudication of disputes between insurers and intermediaries or insurance
intermediaries;
14- Supervising the functioning of the Tariff Advisory Committee;
15- Specifying the percentage of premium income of the insurer to finance schemes for promoting and regulating professional organisations referred to in clause (f);
16- Specifying the percentage of life insurance business and general insurance
business to be undertaken by the insurer in the rural or social sector; and
17- Exercising such other powers as may be prescribed.

105
3.5.3 Milestones in Post Reform Period
1999 Introduction of Insurance Regulatory and Development Authority of India Act, 1999
2000 Constitution of IRDAI on 19th April, 2000 & Framing of Various Regulations
Entry of domestic and foreign private firms into the Indian insurance market
Insurance Regulatory and Development Authority of India (Investment)
Regulations, 2000
2001 Establishment of Life Insurance Council and General Insurance Council
Introducing Third Party Administrators for health insurance services
2002 Regulation on Protection of Policyholders' Interests
Introducing New Insurance Intermediaries: Brokers and Corporate Agents
Four subsidiary companies of GIC became independent companies
2003 Referral Arrangement with Banks
Strengthening of Insurance Councils
2004 Various Committees / Working Groups on issues viz. Earthquake pool,
Intermediaries, and Health Insurance
Regulation on qualifications of actuary
2005 Guidelines on Group Insurance Policies
Introduction of Micro Insurance Regulations
De-Tariffing of Marine Insurance
Guidelines for Unit Linked Insurance products
Report of KPN Committee on Provisions of Insurance Act, 1938
2006 Guidelines on Anti Money Laundering/ Counter Financing of Terrorism
Entry of Stand-Alone Health Insurance Company
2007 Guidelines on Advertisement, Promotion & Publicity of Insurance Companies, and
insurance intermediaries
De-tariffing of General insurance sector
Creation of Motor Pool for Third party Insurance
2008 Benefit Illustrations for Unit Linked Products
Innovation in Products
Strengthening on-site & off-site Monitoring
2009 Guidelines for Corporate Governance
Guidelines on Health plus Life Combi Products
Grievance Redressal Mechanism
2010 Regulations on Treatment of Discontinued Linked Insurance Policies
Regulations on Sharing of Database for Distribution of Insurance Products
Mandating Public Disclosures

106
Creation of IRDAI Grievance Call Centre & Guidelines for Grievance Redressal
2011 Framework for life insurance companies to raise capital through public issue
Insurance Regulatory and Development Authority of India (Scheme of
amalgamation and transfer of general insurance business) Regulations 2011
Insurance Regulatory and Development Authority of India (Issuance of capital by
life insurance companies) Regulations 2011
Creation of Integrated Grievance Management System
Portability of Health insurance policies Mobile application to compare insurance
products and premium rates
Insurance awareness initiative “Bima Bemisaal"
2012 Web Enabled Facility to Ascertain Insurance Particulars of Motor Vehicles
Online application to compare Non Life Insurance products
Revised ULIP Guidelines
Creation of Consumer Education Website-for Public
2013 Insurance Regulatory and Development Authority of India (Issuance of Capital by
General Insurance Companies) Regulations 2013
Insurance Regulatory and Development Authority of India (Health Insurance)
Regulations, 2013
Insurance Regulatory and Development Authority of India (Places of Business)
Regulations, 2013
Linked & Non-linked Life Insurance Regulations
Insurance Repository System for Individual Policy Holders
Common Service Centres to sell simple policies in rural areas
Circular on Insurance Fraud Monitoring Framework
2014 Report of the working group on File & Use guidelines for General insurance
products
2015 The Insurance Laws (Amendment) Act, 2015, which provides for raising the foreign
investment cap from 26 per cent to 49 per cent
Permission to set up IFSC Insurance Office in special economic zones
Norms on maintenance of insurance records
2016 IRDAI (Registration and Operations of Branch Offices of Foreign Reinsurers other
than Lloyd’s) (First Amendment) Regulations, 2016
IRDAI (Lloyd’s India) Regulations, 2016

107
3.6 Growth and Development of Indian Insurance Sector during Post
Privatization
The growth and development of insurance sector has been one of the
important objectives of insurance reforms. The insurance reforms in other countries
resulted into higher growth of the sector. A natural question therefore arises that what
happen to the growth of insurance sector since privatization of Indian insurance sector
in 2000. Growth and development of Indian insurance sector is measured on the basis
of insurance penetration and density, number of insurance companies, premium
underwritten, new policies issued, expenses, profitability, equity capital, insurance
offices and incurred claim ratio. To analyze the impact of insurance reforms on the
growth of the insurance sector the study divides the insurance sector into life and non-
life.
Growth of Life Insurance Sector
Growth of Non-Life Insurance Sector
3.6.1 Growth of Life Insurance Sector
Table 3.1: Life Insurance Penetration and Density in India
Years Penetration (Percentage) Density(USD)
2001-02 2.59 11.7
2002-03 2.26 12.9
2003-04 2.53 15.7
2004-05 2.53 18.3
2005-06 4.10 33.2
2006-07 4.00 40.4
2007-08 4.00 41.2
2008-09 4.60 47.7
2009-10 4.4 55.7
2010-11 3.4 49.0
2011-12 3.17 42.7
2012-13 3.10 41.0
2013-14 2.6 44
Sources: Compiled by Researcher from Various Annual Reports of IRDAI from 2002 to 2015

108
Table 3.1 shows the life insurance penetration and density in India from 2001-
02 to 2013-14. In the year 2001-02 life insurance penetration was 2.59 per cent which
grew to 4.60 in 2008-09, but it finally slipped to 2.6 per cent in 2013-14. Table 3.1
further shows that life insurance density had been consistently gone up from USD
11.7 in 2001-02 to USD 55.7 in 2009-10 and slipped in consequent years to USD 49.0
in 2010-11, USD 42.7 in 2011-12 and further slipping to USD 41.0 in 2012-13.
During the year under review 2014, the life insurance density was USD 44.
Table 3.2: Number of Life Insurance Companies in India
Years Public Private Total
2001-02 1 12 13
2002-03 1 12 13
2003-04 1 13 14
2004-05 1 13 14
2005-06 1 15 16
2006-07 1 16 17
2007-08 1 20 21
2008-09 1 21 22
2009-10 1 22 23
2010-11 1 23 24
2011-12 1 23 24
2012-13 1 23 24
2013-14 1 23 24
2014-15 1 23 24
Sources: Compiled by Researcher from Various Annual Reports of IRDAI from 2002 to 2015
Table 3.2 shows total number of life insurance companies operating in India
from 2001-02 to 2014-15. As the table depicts, there are 24 life insurance companies
presently in operation, one is in public sector namely LIC and twenty three in private
sector.
Table 3.3: Premium Underwritten by Life Insurance Companies in India
(Amount in crore)
Years Public Private Total
2001-02 49821.91 272.55 50094.46
2002-03 54628.49 1119.06 55747.55

109
2003-04 63533.43 3120.33 66653.75
2004-05 75127.29 7727.51 82854.80
2005-06 90792.22 15083.54 105875.76
2006-07 127822.84 28253.00 156075.86
2007-08 149789.99 51561.42 201351.41
2008-09 157288.04 64497.43 221791.26
2009-10 186077.31 79369.94 265450.37
2010-11 203473.40 88165.24 291638.63
2011-12 202889.28 84182.83 287072.11
2012-13 208803.58 78398.91 287202.49
2013-14 236942.30 77340.90 314283.20
2014-15 239667.65 88433.49 328101.14
CAGR 11.87% 51.14% 14.37%
Sources: Compiled by Researcher from Various Annual Reports of IRDAI from 2002 to 2015
Table 3.3 given above shows the premium underwritten by life insurance
companies in India. It can be seen from the table that life insurance industry
underwrote premium of Rs. 50094.46 crore during the financial year 2001-02, which
was increased to Rs. 291638.63 crore in 2010-11, but the total life insurance premium
collection dropped in the year 2011-12 to Rs. 287072.11 crore. However following
the year 2011-12 it increased to Rs. 328101.14 crore in 2014-15. Life insurance
industry grew at a CAGR (Compound Annual Growth Rate) of 14.37 per cent. LIC
recorded a premium income of Rs. 49821.91 crore in 2001-02 which was increased to
Rs. 203473.40 crore in 2010-11, but LIC premium collection slipped to Rs.
202889.28 crore in the year 2011-12. However following the year 2011-12 it
increased to Rs. 239667.65 in 2014-15. LIC premium collection increased at a CAGR
of 11.87 per cent. Private sector recorded a premium income of Rs. 272.55 crore in
2001-02 which was increased to Rs. 88165.24 crore in 2010-11, but private sector
premium collection dropped in the subsequent years to Rs. 77340.90 crore in 2013-
14. However, private sector premium collection was Rs. 88433.49 crore in 2014-15.
Private sector premium collection increased at a CAGR of 51.14 per cent.
110
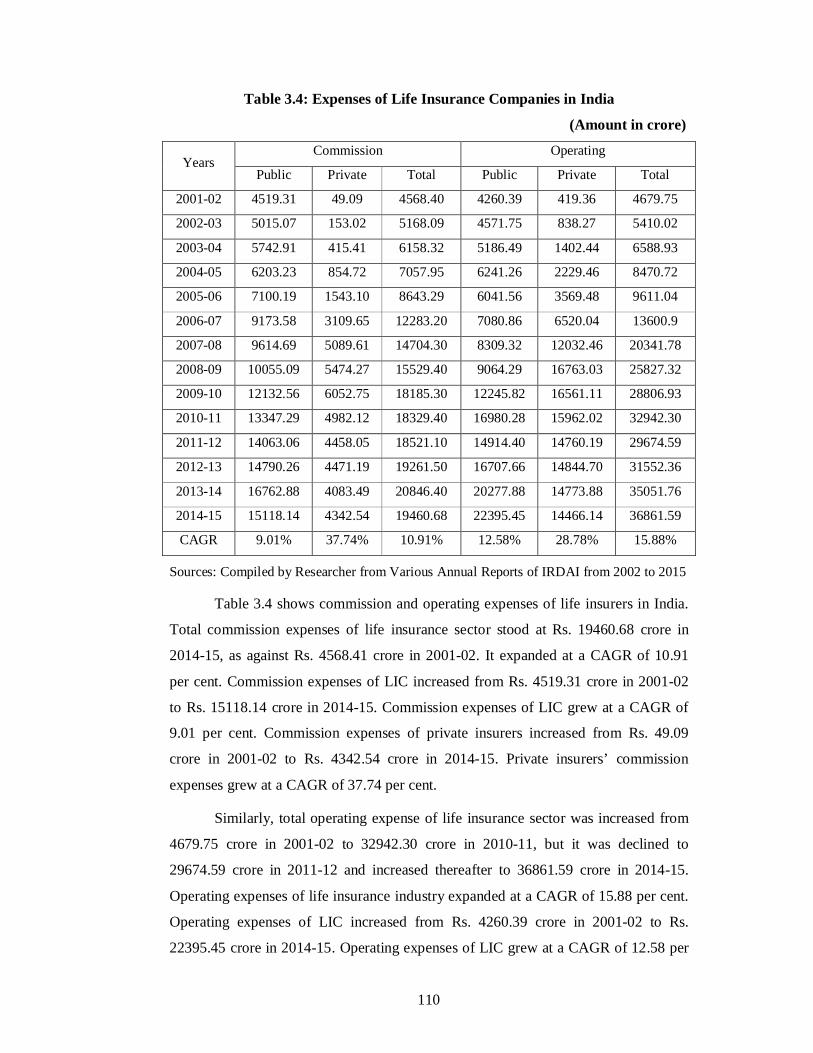
Table 3.4: Expenses of Life Insurance Companies in India
(Amount in crore)
Years Commission Operating
Public Private Total Public Private Total
2001-02 4519.31 49.09 4568.40 4260.39 419.36 4679.75
2002-03 5015.07 153.02 5168.09 4571.75 838.27 5410.02
2003-04 5742.91 415.41 6158.32 5186.49 1402.44 6588.93
2004-05 6203.23 854.72 7057.95 6241.26 2229.46 8470.72
2005-06 7100.19 1543.10 8643.29 6041.56 3569.48 9611.04
2006-07 9173.58 3109.65 12283.20 7080.86 6520.04 13600.9
2007-08 9614.69 5089.61 14704.30 8309.32 12032.46 20341.78
2008-09 10055.09 5474.27 15529.40 9064.29 16763.03 25827.32
2009-10 12132.56 6052.75 18185.30 12245.82 16561.11 28806.93
2010-11 13347.29 4982.12 18329.40 16980.28 15962.02 32942.30
2011-12 14063.06 4458.05 18521.10 14914.40 14760.19 29674.59
2012-13 14790.26 4471.19 19261.50 16707.66 14844.70 31552.36
2013-14 16762.88 4083.49 20846.40 20277.88 14773.88 35051.76
2014-15 15118.14 4342.54 19460.68 22395.45 14466.14 36861.59
CAGR 9.01% 37.74% 10.91% 12.58% 28.78% 15.88%
Sources: Compiled by Researcher from Various Annual Reports of IRDAI from 2002 to 2015
Table 3.4 shows commission and operating expenses of life insurers in India.
Total commission expenses of life insurance sector stood at Rs. 19460.68 crore in
2014-15, as against Rs. 4568.41 crore in 2001-02. It expanded at a CAGR of 10.91
per cent. Commission expenses of LIC increased from Rs. 4519.31 crore in 2001-02
to Rs. 15118.14 crore in 2014-15. Commission expenses of LIC grew at a CAGR of
9.01 per cent. Commission expenses of private insurers increased from Rs. 49.09
crore in 2001-02 to Rs. 4342.54 crore in 2014-15. Private insurers’ commission
expenses grew at a CAGR of 37.74 per cent.
Similarly, total operating expense of life insurance sector was increased from
4679.75 crore in 2001-02 to 32942.30 crore in 2010-11, but it was declined to
29674.59 crore in 2011-12 and increased thereafter to 36861.59 crore in 2014-15.
Operating expenses of life insurance industry expanded at a CAGR of 15.88 per cent.
Operating expenses of LIC increased from Rs. 4260.39 crore in 2001-02 to Rs.
22395.45 crore in 2014-15. Operating expenses of LIC grew at a CAGR of 12.58 per

111
cent. Operating expenses of private insurers increased from Rs. 419.36 crore in 2001-
02 to Rs. 14466.14 crore in 2014-15. Operating expenses of private insurers expanded
at a CAGR of 28.78 per cent.
Table 3.5: Profitability of Life Insurance Companies in India
(Amount in crore)
Years Profit after tax Investment income
Public Private Total Public Private Total
2001-02 821.79 -227.81 593.98 23857.37 11.74 23869.11
2002-03 9761.80 -9651.16 110.64 26038.98 176.6 26215.58
2003-04 10962.60 -11377.2 -414.56 29855.86 267.59 30123.45
2004-05 15884.26 -16049.1 -164.83 37066.76 363.39 37430.15
2005-06 12733 -13185.4 -452.42 40056.35 1222.42 41278.77
2006-07 773.62 -1933.22 -1159.60 46800.52 2747.32 49547.84
2007-08 844.63 -4257.44 -3412.81 56595.06 6602.62 63197.68
2008-09 957.35 -5835.84 -4878.49 42804 10416 53220
2009-10 1060.72 -2049.54 -988.82 112425 42831 155256
2010-11 1171.80 1485.24 2657.04 95949 25718 121667
2011-12 1313.34 4660.19 5973.53 84545 7083 91628
2012-13 1437.59 5510.8 6948.39 117486 28878 146364
2013-14 1656.68 5931.32 7588 143001 43741 186742
2014-15 1823.78 5787.22 7611 168063.58 78701.54 246765.12
Sources: Compiled by Researcher from Various Annual Reports of IRDAI from 2002 to 2015
Profitability of insurance industry has not been showing any consistency
during the period of study. Insurance industry has seen various ups and downs during
last countable years. Profit after tax and investment income has taken as measure of
profitability for life insurance business in India. Profit after tax of life insurers
reported an increase at the end of 2002 & 2003 and reflected negative results for
seven consecutive years, but it again started gaining during 2011 to 2015. Profit after
tax of LIC has reported profit for all years under study while private insurers has
reported profit from 2010-11 onwards.
The investment income of life insurers was increased from Rs. 23869.11 crore
to Rs. 246765.12 crore in 2014-15. In case of LIC, investment income was Rs.
23857.37 crore in 2001-02 which increased to Rs. 168063.58 crore in 2014-15. In

112
case of private insurance industry, investment income was at Rs. 11.74 crore in 2001-
02 which increased to Rs. 78701.54 crores in 2014-15.
Table 3.6: Equity Share Capital of Life Insurance Companies in India
(Amount in crore) Years Public Private Total
2001-02 5.00 1664.00 1669
2002-03 5.00 2229.13 2234.13
2003-04 5.00 3238.71 3243.71
2004-05 5.00 4347.81 4352.81
2005-06 5.00 5887.05 5892.05
2006-07 5.00 8119.41 8124.41
2007-08 5.00 12291.42 12296.42
2008-09 5.00 18249.77 18254.77
2009-10 5.00 21015.00 21020
2010-11 5.00 23656.85 23661.85
2011-12 100.00 24831.92 24931.92
2012-13 100.00 25418.72 25518.72
2013-14 100.00 25838.51 25938.51
2014-15 100.00 26144.14 26244.14
CAGR 23.86% 21.74% 21.75%
Sources: Compiled by Researcher from Various Annual Reports of IRDAI from 2002 to 2015
Total paid up capital of life insurance companies was Rs. 26244.14 crore in
2014-15 which was Rs. 1669.00 crore in 2001-02. Total paid up capital of life
insurance companies grew at a CAGR of 21.75 per cent. Paid up capital of LIC has
Rs. 100.00 crore in 2014-15 which was Rs. 5.00 crore in 2001-02. Total paid up
capital of LIC expanded at a CAGR of 23.86 per cent. Paid up capital of private life
insurers was Rs. 26144.14 crore in 2014-15 which was Rs. 1664.00 crore in 2001-02.
Total paid up capital of private life insurance companies increased at a CAGR of
21.74 per cent.
Table 3.7: Number of Life Insurance Offices in India
Years Public Private Total
2001-02 2190 116 2306
2002-03 2191 254 2445

113
2003-04 2196 416 2612
2004-05 2197 804 3001
2005-06 2220 1645 3865
2006-07 2301 3072 5373
2007-08 2522 6391 8913
2008-09 3030 8785 11815
2009-10 3250 8768 12018
2010-11 3371 8175 11546
2011-12 3455 7712 11167
2012-13 3526 6759 10285
2013-14 4839 6193 11032
2014-15 4877 6156 11033
CAGR 5.89% 32.80% 11.83%
Sources: Compiled by Researcher from Various Annual Reports of IRDAI from 2002 to 2015
Number of life insurance offices had increased from 2001-02 to 2009-10 and
decreased thereafter till 2012-13. The decreasing trend of number of life offices
reverted in 2013-14 and 2014-15. Number of life insurance offices opened by
insurance sector increased at a CAGR of 11.83 per cent. Number of life insurance
offices opened by private sector had increased from 116 in 2001-02 to 8768 in 2009-
10 and decreased thereafter in subsequent years. Number of life insurance offices
opened by private insurance sector grew at a CAGR of 32.80 per cent. The number of
life offices established by LIC had increased to 4877 in 2014-15 from 2190 in 2001-
02. Number of life insurance offices opened by LIC expanded at a CAGR of 5.89 per
cent.
3.6.2 Growth of Non-life Insurance Sector
Table 3.8: Non-Life Insurance Penetration and Density in India Years Penetration (Percentage) Density(USD)
2001-02 0.67 3.0
2002-03 0.62 3.5
2003-04 0.64 4.0
2004-05 0.61 4.4
2005-06 0.60 5.2
2006-07 0.60 6.2
2007-08 0.60 6.2

114
2008-09 0.60 6.7
2009-10 0.71 8.7
2010-11 0.70 10
2011-12 0.78 10.5
2012-13 0.80 11.0
2013-14 0.70 11.0
Sources: Compiled by Researcher from Various Annual Reports of IRDAI from 2002 to 2015
Table 3.8 given above shows non-life insurance penetration and density in
India from 2001-02 to 2013-14. Non life insurance penetration was saw some mix
trend over 2001-02 to 2004-05 which was 0.67 per cent in 2001-02 and 0.61 per cent
in 2004-05, then it became constant at 0.60 per cent during 2005-06 to 2008-09 and
finally increasing 0.70 per cent in 2013-14. During the years from 2002 to 2014, non-
life insurance penetration remained in the range of 0.60-0.80 per cent Non life
insurance density has been continuously increasing from USD 3.0 in 2001-02 to USD
11.0 in 2013-14.
Table 3.9: Number of Non-Life Insurance Companies in India
Years Non life Reinsurer
Public Private Total
2001-02 5* 8 13 1
2002-03 6* 8 14 1
2003-04 6* 8 14 1
2004-05 6* 8 14 1
2005-06 6* 9 15 1
2006-07 6* 11** 17 1
2007-08 6* 14** 20 1
2008-09 6* 15** 21 1
2009-10 6* 18** 24 1
2010-11 6* 18** 24 1
2011-12 6* 21** 27 1
2012-13 6* 21** 27 1
2013-14 6* 22** 28 1
2014-15 6* 22** 28 1 Sources: Compiled by Researcher from Various Annual Reports of IRDAI from 2002 to 2015 *Includes Specialised Insurance Companies ** Includes Standalone Health Insurance Companies

115
Table 3.9 given above shows total number of non life insurance companies
and reinsurance companies operating in India from 2001-02 to 2014-15. As the table
depicts, in 2013-14, there are 28 non-life insurance companies and GIC acts as a sole
national reinsurer. Of the 28 non life insurance-companies, six are in public sector
including two are specialized insurers namely Export Credit Guarantee Corporation of
India Limited and Agriculture Insurance Company of India Limited, and twenty two
in private sector including five standalone health insurance companies.
Table 3.10: Premium Underwritten by Non-Life Insurance Companies in India
(Amount in crore) Years Public Private Total
2001-02 11917.59 467.65 12385.24
2002-03 13520.44 1349.80 14870.24
2003-04 13337.08 2257.83 15594.91
2004-05 13972.96 3507.62 17480.58
2005-06 15976.44 5362.66 21339.1
2006-07 16258.90 8646.57 24905.47
2007-08 16831.84 10991.89 27823.73
2008-09 18030.74 12321.09 30351.83
2009-10 20643.45 13977.00 34620.45
2010-11 25151.85 17424.63 42576.48
2011-12 30560.74 22315.03 52875.77
2012-13 35022.12 27950.53 62972.65
2013-14 38599.71 32010.30 70610.01
2014-15 42549.48 35090.09 77639.57
CAGR 9.52% 36.13% 14.01%
Sources: Compiled by Researcher from Various Annual Reports of IRDAI from
2002 to 2015.
Note: Specialized and Standalone Health Private Insurers are not included.
Table 3.10 given above shows the premium underwritten by non-life insurance
companies in India. There is a steady increase in the total premium collection by the
non-life insurance sector during the period. The total premium collection went to Rs.
77639.57 crore in 2014-15 from Rs. 12385.24 crore in 2001-02. Non-life insurance
industry expanded at a CAGR of 14.01 per cent. Public sector non-life insurers
recorded a premium income of Rs. 11917.59 crore in 2001-02 which was increased to

116
Rs. 42549.48 crore in 2014-15. Public sector non-life insurer’s premium collection
increased at a CAGR of 9.52 per cent. Private sector recorded a premium income of
Rs. 467.65 crore in 2001-02 which was increased to Rs. 35090.09 crore in 2014-15.
Private sector non-life insurance premium collection increased at a CAGR of 36.13
per cent.
Table 3.11: Number of New Policies Issued by Non-Life Insurance Companies
in India
(Amount in crore) Years Public Private Total
2001-02 - - -
2002-03 4.18 0.16 4.34
2003-04 4.44 0.31 4.75
2004-05 4.46 0.51 4.97
2005-06 4.39 0.89 5.28
2006-07 3.39 1.26 4.65
2007-08 3.85 1.87 5.72
2008-09 4.51 2.19 6.7
2009-10 4.51 2.19 6.7
2010-11 4.34 2.40 6.74
2011-12 3.29 5.28 8.57
2012-13 6.89 3.80 10.69
2013-14 6.00 4.24 10.24
2014-15 6.78 5.05 11.83
CAGR 3.79% 30.41% 8.02%
Sources: Compiled by Researcher from Various Annual Reports of IRDAI from
2002 to 2015.
Note: Specialized and Standalone Health Private Insurers are not included.
Number of new policies issued by non-life insurance sector has been increased
throughout the study period. Number of new policies issue in non-life insurance
sector increased from 4.34 crore in 2002-03 to 11.83 crore in 2014-15. New policies
issue in non-life insurance sector increased at a CAGR of 8.02 per cent. Public sector
non-life insurance companies issued 4.18 crore new policies in 2002-03 which
increased to 6.78 crore in 2014-15. New policies issue by Public sector non-life
insurance companies increased at a CAGR of 3.79 per cent. Number of new policies
117
issued by private non-life insurers was increased from 0.16 crore in 2002-03 to 5.05
crore in 2014-15. New policies issue by private life insurers increased at a CAGR of
30.41 per cent.
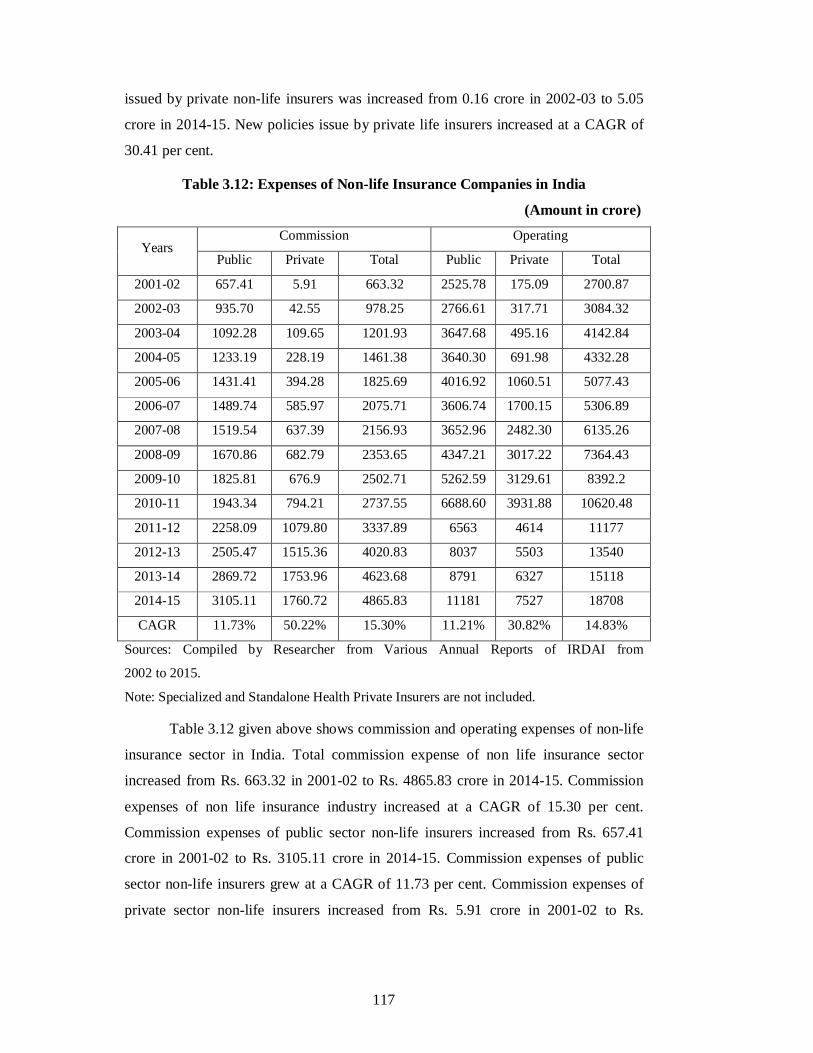
Table 3.12: Expenses of Non-life Insurance Companies in India
(Amount in crore)
Years Commission Operating
Public Private Total Public Private Total
2001-02 657.41 5.91 663.32 2525.78 175.09 2700.87
2002-03 935.70 42.55 978.25 2766.61 317.71 3084.32
2003-04 1092.28 109.65 1201.93 3647.68 495.16 4142.84
2004-05 1233.19 228.19 1461.38 3640.30 691.98 4332.28
2005-06 1431.41 394.28 1825.69 4016.92 1060.51 5077.43
2006-07 1489.74 585.97 2075.71 3606.74 1700.15 5306.89
2007-08 1519.54 637.39 2156.93 3652.96 2482.30 6135.26
2008-09 1670.86 682.79 2353.65 4347.21 3017.22 7364.43
2009-10 1825.81 676.9 2502.71 5262.59 3129.61 8392.2
2010-11 1943.34 794.21 2737.55 6688.60 3931.88 10620.48
2011-12 2258.09 1079.80 3337.89 6563 4614 11177
2012-13 2505.47 1515.36 4020.83 8037 5503 13540
2013-14 2869.72 1753.96 4623.68 8791 6327 15118
2014-15 3105.11 1760.72 4865.83 11181 7527 18708
CAGR 11.73% 50.22% 15.30% 11.21% 30.82% 14.83%
Sources: Compiled by Researcher from Various Annual Reports of IRDAI from
2002 to 2015.
Note: Specialized and Standalone Health Private Insurers are not included.
Table 3.12 given above shows commission and operating expenses of non-life
insurance sector in India. Total commission expense of non life insurance sector
increased from Rs. 663.32 in 2001-02 to Rs. 4865.83 crore in 2014-15. Commission
expenses of non life insurance industry increased at a CAGR of 15.30 per cent.
Commission expenses of public sector non-life insurers increased from Rs. 657.41
crore in 2001-02 to Rs. 3105.11 crore in 2014-15. Commission expenses of public
sector non-life insurers grew at a CAGR of 11.73 per cent. Commission expenses of
private sector non-life insurers increased from Rs. 5.91 crore in 2001-02 to Rs.

118
1760.72 crore in 2014-15. Commission expenses of private sector non-life insurers
expanded at a CAGR of 50.22 per cent.
Similarly, total operating expense of non life insurance sector increased from
Rs. 2700.87 crore in 2001-02 to Rs. 18708 crore in 2014-15. Total Operating
expenses of non-life insurance industry increased at a CAGR of 14.83 crore.
Operating expenses of public sector non-life insures increased from Rs. 2525.78 crore
in 2001-02 to Rs. 11181 crore in 2014-15. Operating expenses of public sector non-
life insurers expanded at a CAGR of 11.21 per cent. Operating expenses of private
sector non-life insurers increased from Rs. 175.09 crore in 2001-02 to Rs. 7527 crore
in 2014-15. Operating expenses of private sector non-life insurers grew at a CAGR of
30.82 per cent.
Table 3.13: Profitability of Non-Insurance Companies in India
(Amount in crore)
Years Profit after tax Investment income
Public Private Total Public Private Total
2001-02 -49.49 -61.77 -111.26 2188.48 67.47 2255.95
2002-03 625.16 6.75 631.91 2519.88 116.94 2636.82
2003-04 1358.32 67.04 1425.36 3818.20 154.32 3972.52
2004-05 1171.60 121.90 1293.5 4330.18 184.42 4514.6
2005-06 1319.28 154.38 1473.66 5610.63 269.47 5880.1
2006-07 2907.36 229.74 3137.1 5784.23 415.04 6199.27
2007-08 2205.48 43.83 2249.31 6247.51 742.05 6989.56
2008-09 498.33 -101.26 397.07 4799.78 1091.20 5890.98
2009-10 1293.07 -88.56 1204.51 6347.27 1334.29 7681.56
2010-11 -161.51 -857.43 -1018.94 7842.20 1539.63 9381.83
2011-12 1152.48 -1120.15 32.33 7424.26 2083.65 9507.91
2012-13 2602.72 679.11 3281.83 8610.52 2991.09 11601.61
2013-14 2899.76 1539.14 4438.9 9394.63 3982.36 13376.99
2014-15 3093.99 1643.51 4737.5 10725.02 4931.01 15656.03
Sources: Compiled by Researcher from Various Annual Reports of IRDAI from
2002 to 2015.
Note: Specialized and Standalone Health Private Insurers are not included.
Profitability of insurance industry has not been showing any consistency
during the period of study. Insurance industry has seen various ups and downs during

119
last countable years. Table 3.13 given above shows profitability of non life insurance
sector in India. Profit after tax and investment income has taken as measure of
profitability for non-life insurance business in India. Profitability of non-life insurance
sector has reported negative results for 2 years out of 14 years. Profit after tax of
public sector non-life insurance companies has reported loss for 2 years out of 14
years. While private sector non-life insurers have reported negative results for 5 years
out of 14 years.
The investment income of non-life insurers was increased from Rs. 2255.95
crore in 2001-02 to Rs. 15656.03 crore in 2014-15. In case of public sector non-life
insurers, investment income was Rs. 2188.48 crore in 2001-02 which increased to Rs.
10725.02 crore in 2014-15. In case of private non-life insurance industry, investment
income was at Rs. 67.47 crore in 2001-02 which increased to Rs. 4931.01 crores in
2014-15.
Table 3.14: Equity Share Capital of Non-Life Insurance Companies in India
(Amount in crore)
Years Public Private Total
2001-02 400 726.50 1126.50
2002-03 400 883.00 1283.00
2003-04 400 1048.96 1448.96
2004-05 450 1048.96 1498.96
2005-06 500 1279.01 1779.01
2006-07 550 1400.87 1950.87
2007-08 550 1801.70 2351.70
2008-09 550 2533.23 3083.23
2009-10 550 3160.04 3710.04
2010-11 550 3955.70 4505.70
2011-12 550 4860.68 5410.68
2012-13 600 5974.72 6574.72
2013-14 600 6226.37 6826.37
2014-15 650 6972 7622
CAGR 3.53% 17.53% 14.63%
Sources: Compiled by Researcher from Various Annual Reports of IRDAI from
2002 to 2015.
Note: Specialized and Standalone Health Private Insurers are not included.

120
Total paid up capital of non-life insurance companies was Rs. 7622 crore in
2014-15 which was Rs. 1126.50 crore in 2001-02. Total paid up capital of non-life
insurance companies increased at a CAGR of 14.63 per cent. Paid up capital of public
sector non-life insurance companies was Rs. 650 crore in 2014-15 which was Rs.
400.00 crore in 2001-02. Total paid up capital of public sector non-life insurance
companies expanded at a CAGR of 3.53 per cent. Paid up capital of private non-life
insurers was Rs. 6972 crore in 2014-15 which is less than that of Rs. 726.50 crore in
2001-02. Total paid up capital of private life insurance companies grew at a CAGR of
17.53 per cent.
3.15: Incurred Claim Ratio of Non-Life Insurance Companies in India
Years Public Private Total
2001-02 90.19 23.03 88.81
2002-03 79.80 52.06 78.27
2003-04 79.91 50.97 77.20
2004-05 81.63 51.16 77.42
2005-06 89.94 54.47 83.03
2006-07 85.22 68.02 81.27
2007-08 90.43 72.21 84.88
2008-09 91.30 76.89 86.30
2009-10 88.27 80.30 85.50
2010-11 97.03 86.71 93.30
2011-12 89.22 88.22 88.85
2012-13 84.79 79.56 82.79
2013-14 83.20 79.58 81.74
2014-15 82.09 79.69 81.15
CAGR -0.67% 9.27% -0.64%
Sources: Compiled by Researcher from Various Annual Reports of IRDAI from
2002 to 2015.
Note: Specialized and Standalone Health Private Insurers are not included.
The incurred claims ratio (net incurred claims to net earned premium) of the
non-life insurance industry was 81.15 per cent during 2014-15 which is less than
88.81 per cent during 2001-02. Incurred claim ratio of non-life insurance companies
exhibited a CAGR of -0.64 per cent. The incurred claims ratio for public sector
insurers was 82.09 for the year 2014-15 which decreased from 2001-02 incurred

121
claims ratio of 90.19, whereas for the private sector incurred claims ratio increased
from 23.03 in 2001-02 to 79.69 in 2014-15. Incurred claim ratio of public sector non-
life insurance companies declined at a CAGR of -0.67 per cent while incurred claim
ratio of private sector non-life insurance companies grew at a CAGR of 9.27 per cent.
3.7 Conclusion
Over the past century, Indian insurance industry has undergone through tremendous
changes. It began as a fully private system with no restriction on foreign participation.
After the independence, the industry went to the other extreme. It became a state-
owned monopoly. In 1991, when rapid changes took place in many parts of the Indian
economy, nothing happened to the institutional structure of insurance, it remained a
monopoly. Only in 1999, a new legislation came into effect signalling a change in the
insurance industry structure. There are numerous reasons that promoted the
government to bring reforms in the insurance sector. Among other convincing
reasons, it was also realized that India has vast potentials, which is waiting to be
tapped, and this could only be achieved when sufficient competition is generated and
it is exposed to the developments in the rest of the world. The Government of India
liberalized the insurance sector which lifted the entry restrictions for private insurance
players, allowing foreign players to enter into the Indian market and start their
operations in India. Each foreign company needed to have a 26% equity capital to
enter into the Indian insurance market. Many foreign companies have joined their
hands with the Indian companies and started their operations in early 2001. Now, FDI
limit has increased to 49%. It is gratifying to note that the new insurance companies
have approached the business in a proper perspective. Both the life and non-life
business is growing beyond the normal expectations. The actual growth is slightly
beyond the forecasted growth of insurance sector. There is substantial increase in the
total premium collection by insurance companies in both life and non-life sector after
privatization. Insurance penetration and insurance density which have been marginal
in both life and non-life sector seems improving. The share of private companies is
continuously improving in both life and non-life sector but an interesting fact is that
the rate of growth of the PSEs in the sector has not shown any trend of decline after
privatization of the sector. The public sector in turn has redrawn its priorities,
redesigned their market strategy and together the public sector and private sector have
enlarged the market.