chapter 3 paper & pulp sub -sector - jica
TRANSCRIPT

Chapter 3 Paper & Pulp Sub-sector
3.1 Detailed Enterprise Study
Case Study P-01 Hoang Van Thu Paper Factory P-1
Case Study P-02 Dong Nai Paper Paper Company (COGIDO) P-15
Case Study P-03 An Binh Ltd. Company P-35
Case Study P-04 Bac Giang Exporting Paper Company P-51
Case Study P-05 Hai Phong Joint Stock Paper Company P-67
1.2 Simplified Enterprise Study
Case Study P-06 Van Diem Paper Factory P-81
Case Study P-07 Hoa Binh Paper Factory P-85
Case Study P-08 Bai Bang Company P-89
Case Study P-09 Viet Tri Paper Factory P-95
Case Study P-10 Thuan Thanh Paper Factory P-101
Case Study P-11 Binh An Paper Company (COGIMEKO P-105
Case Study P-12 Tan Mai Paper Company P-111
Case Study P-13 Vien Dong Paper Company P-117
Case Study P-14 Linh Xuan Paper Company P-123
Case Study P-15 Hanh Linh Paper Ltd.Company P-127
Case Study P-16 Hoa Phuong Industrial-Construction and
Trading Ltd. Company P-131
Case Study P-17 Mai Lan Paper Enterprise P-135
Case Study P-18 Xuan Duc Company P-139
Case Study P-19 Viet Dai Private Enterprise P-143
Case Study P-20 Thanh Long Paper Factory P-149
Case Study P-21 Muc Son Paper Factory P-153

P-1
CASE STUDY P-01
Hoang Van Thu Paper Factory Survey Date: 19 November 1999
6, 7 & 8 March 2000
1. General
1.1 Profile
Hoang Van Thu Paper Factory(HVT-PF) is a state-owned company which was
established, at first, as a first paper production company in Viet Nam in 1913.
The company profile of HVT-PF is summarized in Table 1.
Table 1 Enterprise Profile
Name of Company Hoang Van Thu Paper Factory(HVT-PF)
Ownership State-owned
Address Quan Trieu Quarter Thai Nguyen City
Tel/Fax 02808444548 / 02808445481
Director Mr. Nguyen Van Vui
Established 1913
Corporate Capital
Number of Employees 400
Main Products Paper, Cartons
1.2 Environmental protection department
The Quality Control and Technical Department is the section responsible for
environmental protection, as well as the improvement of production technologies.
1.3 Business Status
Table 2 shows production and sales of HVT-PF.
Table 2 Production and Sales
Product Production (ton) Turnover (million VND)
Paper (gram mage 30-400g/㎡) Carton from Waste Fibers Black Liquor Total
3,612
191 103
16,796
215 51
17,062

P-2
2. Production Technology
2.1 Process
Figure 1 shows a block flow diagram of the whole factory.
River water is used as process water, and the volume of water consumption is
estimated at 900,000 to 1,000,000 ton/year. No flow meters are provided for river
water intake and wastewater.
Figure 1 Block Flow Diagram of the Factory
2.1.1 Pulping Plant (Alkaline Pulp)
1) Bamboo Alkaline Pulp(AP) is cooked by a batch-type ball digester using NaOH
and solid Sulfur(S).
2) Pulping is done using a beater, and then washing is done by the same beater.
3) Cooking liquor and washing wastewater, which contain very high COD levels,
are discharged to the Cau river after removing only fiber material by settling
tank, and a small volume of black liquor from the digester.
2.1.2 Recycle Fiber
Waste paper is pulped by beating only and then is washed in the same “beater”
machine, which is utilized for AP. The factory has no equipment, except for
Jonson screens, with two big holes, for removing dirt material etc.
River water ⑦ Rosin, Alum, Dye
Water chest Boiler
Caustic soda ④⑤
Sulfur Cooking Wahing Refining Paper Product
Bamboo White water recovery
② ②③ Recovery
By-product chest By-product⑥
Wastewater(to River) ⑧
Evaporator
machine

P-3
2.1.3 Two Foudlineer Paper Machines
Each paper machine has a settling tank made of concrete. It is very effective
to recover fiber material for re-use.
2.1.4 Two Cylinder Wire Machines
Both machines have no settling tank.
2.1.5 Black Liquor Evaporator
The factory produces black liquor for concrete use only in small amounts less
than 1/30 of total black liquor. The evaporation process is carried out in a tank
with a steam pipe in the bottom section. Therefore, the ratio of evaporation to
steam consumption is less than 0.8.
2.2 Future Plans for Improvement
HVT-PF has the following future plans for process improvement:
1) If the factory is able to get funding from the state, the factory will increase the
production capacity from 4,000 to 20,000 ton/year in the year 2000.
2) The factory has a plan to introduce a Refiner instead of using the Beater.
3. Management Technology
3.1 Yield of Bamboo Unbleached AP
The factory produces only 36.5 wt% of unbleached paper from BD chips weight.
In general, the yield of unbleached AP for bleached pulp is higher than 44wt%.
Therefore, it is possible to raise the yield of unbleached bamboo pulp to more than
50 wt%. In this way it is possible to save more than 1/3 of chips and to reduce 1/2
of the effluent load.
The reasons for low yield are considered to be as follows;
(1) Pentosan, which is contained in BD chips of more than 25 wt%, does not
remain due to the long cooking time.
(2) The outer side of the chips is over cooked before the inner part of the chips
gets cooked, because steaming of the chips is not done and the remaining
amount of NaOH is not sufficient. The steaming and/or saturation
processes are very important for the inner part of the chip.

P-4
3.2 Unit Consumption and Cost
Table 3 shows consumption and costs of raw materials and utilities, and also
turnover in 1998.
In spite of the very low cost of raw material bamboo, coal and labor, chemicals
and waste paper costs are at the international price. So, the final total cost of
paper, including fixed cost, is calculated to be the same as the average
international price.
Table 3 Unit Consumption, Cost and Turnover in 1998
Used Material Unit Quantity Expenses
million VND
Unit Cost
¥/t
Note
As 130 VND/¥
Ⅰ.For Paper Product t/year ((3,612)) (¥/kWh)
1.Bamboo t/year 9,887 3,322 2,585 <<1/5~1/6
2.Caustic soda t/year 655 2,291 26,923 *Same as Inter. Price
3.Sulfur t/year 24 72 23,077 *Same as Inter. Price
4.Waste Paper t/year 1,338 1,773 10,192 *Same as Inter. Price
5.Rosin Size t/year 52 364 53,615 *Same as Inter. Price
6.Alum t/year 180 288 12,308 *Same as Inter. Price
7.Carbonate t/year 11 21 15,391 *Same as Inter. Price
8.River Water m3/year 950,000 (4000~4500Kcal/Kg)
9.Coal t/year 4,366 816 1,438 <1/2 of Inter. Price
10.Electric Power kWh/year 3,452,439 2,279 5.077 >2 of Inter. Price
Ⅱ.Carton t/year ((190.5))
1.Waste Paper t/year 47 42 6,923 *Same as Inter. Price
2.Electric Power kWh/year 37,000 24 5.077 >2 of Inter. Price
Ⅲ.Black Liquor t/year ((103.4))
1.Coal t/year 136 25 1,436 <1/2 of Inter. Price
Total Fiber t/year 6,329 5,138 44.5% of Total Cost
Total Paper Product t/year ((3,802)) 60.0% of Raw Fiber
Total ((Energy Cost)) 3,120 27.6% of Total Cost
Total Expenses million
VND
11,318 22,846 Running Cost of
Paper
Fiber /Bamboo≒0.45 Salary 3,600 7,284
Finance Cost 1,166 2,359
Total Cost 16,084 32,542 ≒3/4 of Japan Price
Turnover 17,062 34,520
Turnover-T.C 978 1,978 5.73%

P-5
4. Industrial Wastewater Treatment and Discharge
4.1 Industrial Wastewater
Wastewater from each plant is sent to an excavated sedimentation pond, then
discharged to the river as shown in Figure 1. In this study, wastewater samples
were taken at the points shown in Figure 1.
(1) Wastewater Samples Taken in November 1999
Samples were taken on 19 November 1999 as follows:
1. Mixed wastewater from the Chip cooker and evaporator;
2. Wastewater from the by-product recovery line;
3. Wastewater from the washing equipment;
4. Wastewater from the paper machine;
5. Wastewater from the paper machine;
6. Wastewater at the outlet of the wastewater recovery pit;
7. Supply water intake at the Cau river;
8. Wastewater at the final discharge point of the factory.
Table 4 and 5 show the analysis results of the samples mentioned above.

P-6
Table 4 Wastewater Quality (19 November 1999)
Sample number and sampling time Item
Unit ① ② ③ ④ ⑤
Temperature ℃ 21 20.8 20.5 25.8 27.9 pH - 6.9 7.5 6.7 6.4 7.1 Electric conductivity μS/cm 1270 1205 909 249 259 Turbidity NTU 3096 37712 459 144 139 Oil & Grease mg/l 0 0 0 0 0 BOD mg/l 1010 973 985 175 181 COD mg/l 58219 70320 16360 244 399 DO mg/l 7.8 8.1 VSS mg/l 1600 11020 210 58.5 60 TSS mg/l 3160 37800 487 157 146 Total Nitrogen mg/l Residual Chlorine mg/l T 336.8 11.3 T SO42- mg/l S2- mg/l 0.14 0.21 0.19 0.02 Phenol mg/l 4.0 4.0 0.35 0.06 0.05 Cyanogen mg/l Na mg/l 328 120 308 352 220 CaCO3 mg/l 125 134 200 117 110 Cu mg/l Pb mg/l 0.34 0.053 0.296 0.035 0.05 Cd mg/l 0.126 0.011 0.332 0.015 0.019 Hg mg/l Cr(Ⅵ) mg/l Zn mg/l 0.246 0.033 0.428 0.045 T Salt % 0.01

P-7
Table 5 Wastewater Quality(19 November 1999)
Sample number and sampling time TCVN Item
Unit ⑥ ⑦ ⑧ 5945
Temperature ℃ 20.7 24.1 25 40 pH - 8.0 8.3 9.95 5.5-9 Electric Conductivity μS/cm 1341 166 1220 Turbidity NTU 359 22.5 271 Oil & Grease mg/l T 0 T 10 BOD mg/l 338 9.7 319 50 COD mg/l 5160 15.8 5320 100 DO mg/l 6.0 7.7 VSS mg/l 127 9.5 100 100 TSS mg/l 385 26 289 Total Nitrogen mg/l 45.9 18.3 39.0 60 Residual Chlorine mg/l 401 7.8 411.2 2 SO42- mg/l S2- mg/l 0.05 0 0.08 Phenol mg/l 0.50 0.018 0.28 0.001 Cyanogen mg/l T T T Na mg/l 323 335 314 CaCO3 mg/l 232 66 250 Cu mg/l Pb mg/l 0.057 0.048 0.02 Cd mg/l 0.024 0.025 0.024 Hg mg/l Cr(Ⅵ) mg/l 0.01 T Zn mg/l 0.017 0.007 0.007 Salt % 0 0.05
(2) Wastewater Samples Taken in March 2000
Samples were taken on 6 March 2000 as follows:
1. Wastewater at the outlet of the wastewater recovery pit(sample point
⑥);
2. Supply water intake at the Cau River(sample point ⑦);
3. Wastewater at the final discharge point of the factory(sample point ⑧.)
Table 6 shows the analysis results of the wastewater samples taken.

P-8
Table 6 Wastewater Quality (16 March 2000)
Sample number and sampling time TCVN Item
Unit ⑥ ⑦ ⑧ 5945(B)
Temperature ℃ 20.9 20.9 20.6 40 PH - 9.0 8.1 9.4 5.5-9 Electric Cnductivity μS/cm 366 168 487 Turbidity NTU 139 10 168 Oil & Grease mg/l T 0 T 10 BOD mg/l 372 8.1 426 50 COD mg/l 430 12.3 508 100 DO mg/l 6.31 6.64 5.49 VSS mg/l 64 7.4 58.3 100 TSS mg/l 159 19 142 Total Nitrogen mg/l 34.5 13.2 37.8 60 Residual Chlorine mg/l 16.8 0 T 2 SO42- mg/l 61 34 48 S2- mg/l 0.54 0 0.81 0.5 Phenol mg/l 3.35 0.01 2.63 0.001 Cyanogen mg/l T 0 T Na mg/l 286 48 345 CaCO3 mg/l 280 52 310 Cu mg/l 0.64 0.08 0.57 1 Pb mg/l 0.03 0.001 0.04 0.5 Cd mg/l 0.01 0.001 0.027 0.02 Hg mg/l 0.002 0 T 0.005 Cr(Ⅵ) mg/l 0.01 0.01 0.01 0.1 Zn mg/l 0.1 0.093 0.21 2 Salt % 0.01 0 0.02 Ca2+ mg/l 112
Based on the analysis results, HVT-PF’s wastewater is characterized as
follows:
1) COD , BOD and sulfur content in the wastewater are exceeding Viet
Nam wastewater standard (TCVN 5945 B);
2) VSS content is lower than the standard, but TSS is exceeding the 100
mg/l level. It is thought that useful material is leaking out of the
processes.
4.2 Wastewater quality in major processes
In March, 2000, detailed analysis was done on the transition of SS content in

P-9
wastewater of major process as shown below;
(1) Blow pit overflow water and washing water from the digester
The transition of SS content in the digester, blow down liquid overflow from
the blow pit, and washing water from the digester are shown in Table 7 and 8
respectively.
Table 7 SS Content in the Overflow from the Blow Pit(6 March 2000) Sample number and Sampling time(passing time)
Item
Unit BP1 00(min)
BP2 10
BP3 20
BP4 40
BP5 60
BOD mg/l 1960 COD mg/l 58620 VSS mg/l 2733 2940 3755 4107 4984 TSS mg/l 6165 6206 6282 6304 6313 TSS – VSS mg/l 3432 3262 2527 2197 1328
Table 8 SS Content in Washing Water from the Digester(6 March 2000) Sample number and Sampling time (passing time)
Item
Unit W1
00(min) W2 10
W3 30
W4 60
W5 120
BOD mg/l 462 COD mg/l 780 VSS mg/l 356 476 443 409 388 TSS mg/l 394 821 762 625 399 TSS – VSS mg/l 38 345 319 216 11
Based on the above analysis results, separation efficiency of the blow pit and
washing efficiency of the digester are not so good, so useful components for pulp
leak out of the processes.
(2) Wastewater Quality of Paper Machines
Figure 2 shows a schematic drawing of the paper machines and sampling
points. The factory has two paper machines, and samples were taken from each
machine.
Analysis results are shown in Table 9.

P-10
① ②
Slice hip ③ ④ ⑤
⑥
Figure 2 Paper Machine and Sampling Point Scheme
Table 9 Water Quality of the Paper Machine (7、March,2000)
Sample number and Sampling point
Item
Unit
① Head Tank.
② Stock inlet
③ White water
④ White water
⑤ White water
⑥ Over flow
No.1 Paper machine Ash mg/l 185 950 417 382 56 214 TSS mg/l 37530 42520 35780 44600 4125 39130 No.2 Paper machine Ash mg/l 124 124 87 204 52 143 TSS mg/l 20476 25760 19480 23715 13604 29713
Based on the above analysis results, wastewater containing high level of SS
also comes from the paper machines.
5. Countermeasures for Industrial Pollution Prevention
5.1 Current Problems
Current issues in HVT-PF concerning wastewater are summarized as follows:
(1) Almost all of the cooking liquor which contains very high COD levels
(roughly 60,000 mg/l) and all of the washing liquor are discharged to
the river after receiving only sedimentation treatment at the pond;
Stock
Head
Tank
Stock
Inlet
Over Flow

P-11
(2) The yield of unbleached AP is very low, less than 40 %, so, it seems that
the fiber and pentosan are effectively dissolved to cooking liquor;
(3) The wastewater volume is very high, as much as 263 times of product
paper, so, it is reasonable to assume that fresh cold water is used for
washing the pulping machine and the paper machine;
(4) Wastewater from the digester and paper machine contains very high
volumes of SS, and environmental impact is very severe.
.
5.2 Production Technology Improvement
5.2.1 Recovery of Useful Components through Cleaner Production Techniques
It is possible to greatly improve the unit consumption of raw materials by
recycling back useful material recovered from wastewater to the former process.
5.2.2 Apply a New Hot Water Washing Procedure
The washing efficiency will improve by using pressurized hot water ( over 37℃
and 3.0kg/cm2G), instead of fresh cold water. Therefore, it is possible to reduce
the volume of washing water.
5.3 Wastewater Treatment
5.3.1 Design Basis
As for the design basis, total volume of wastewater to be treated is set at 3,300
m3/day, and the qualities of wastewater to be treated are based on analysis results
in this study of samples taken at the final discharge point.
5.3.2 Conceptual Design
Based on the above data, a conceptual design of a wastewater treatment
system was constructed by the Study Team.
Summarizing the results of the conceptual design, the block flow diagram for
the wastewater treatment system is shown in Figure 3.

P-12
Figure 3 Block Flow Diagram of a Wastewater Treatment System
5.3.3 Factory Layout
The site area of the wastewater treatment system is estimated at 3,440 m2.
The factory has no recent drawings of the factory lay out, because the factory
was established in 1913. However, it was confirmed in this survey that the
factory has enough space to install a wastewater treatment system, including
sufficient space for future production expansion plans.
5.3.4 Required Cost
The required construction cost of the wastewater treatment system, based on
the conceptual design, is estimated at 4.8 billion VND.
6. Recommendations
6.1 Short Term Recommendations
On a short term basis, it is recommended that the company take the following
Untreated Wastewater to Mill
Pressure Floatation Separator
Untreated Wastewater Tank
Aeration Tank
Coagulation Sedimentation Tank Treated Water
Dehydrator Suspended Solid

P-13
preparatory actions which will serve as the basis for mid-term countermeasures:
(1) Strict Enforcement of 7S;
(2) Optimization of chip size;
(3) Set shower pipes to suppress floating stock and foam in the cylinder wire vat;
(4) Usage of low Hg content NaOH.
6.2 Mid-Term Basis Recommendations
On a mid-term basis, it is recommended that a wastewater treatment system
be installed as discussed in Section 5.3. In order to minimize the construction cost
of the wastewater treatment system, a reduction in the volume of wastewater and
in the amount of contaminants in the wastewater is mandatory.
Process improvement projects such as;
(1) Usage of hot water for the cleaning shower
(2) Short cycle recovery of white water for each paper machine
should be implemented in parallel with the wastewater treatment project.
It is also recommended that wastewater treatment operation experts be
invited to the company during the test operation stage in order to establish and
optimize operating conditions, especially for the biological treatment system.
6.3 Long Term Basis Recommendations
On a long term basis, it is recommended that optimization of cooking liquor
circulation, recovery and utilization of cooking steam and waste liquor, and
increasing washing efficiency by using hot water be implemented.
In addition, it is most important to maintain stable operation of the
wastewater treatment system.
6.4 Implementation Schedule
By an implementation schedule planned during this study, the test operation
of the wastewater treatment system is expected to commence in the middle of 2003.

P-14

P-15
Case Study P-02
Dong Nai Paper Company
Survey date:30 November 1999
25, 28 & 29 March 2000
1. General
1.1 Company Profile
The Dong Nai Paper Company was established in 1959 and installed three
world class level paper machines in the 60’s. The company owns a 240,000 ㎡ site
in the Bien Hoa Industrial Zone, they have co-generation power equipment that
utilizes steam and handles the needs of the paper machines, and electrolysis
equipment for salt. They also produce half the amount of bleached pulp they need,
using the AP method.
The factory has high level technology and equipment, which includes a coating
machine with the latest technology imported from Germany in 1990. Chemical
collecting equipment for pulp waste was installed in 1997. The company profile is
shown in Table 1.
Table 1 Enterprise Profile Name of the Company Dongnai Paper Company (COGIDO) Address Bienhoa Industrial Zone-Dongnai Province Tel (061)-836201-836193 Fax (061)-826231 Establishment 1959 Number of employees 950 ( 3shifts,300 days operation/Y)
Ownership State-owned
1.2 Environmental management
The technology department consists of managing sections in each production
process, the production management section, and the pollution prevention section.
1.3 Business Status
This company produces bleached paper called “Cobo Pulp” from bamboo and
eucalyptus using the AP method. Utilizing waste paper and imported pulp, they
produce many kinds of paper and cardboard, such as Writing, Printing, Photocopy,
Coating, Board, and Duplex paper.
The total production of this company was 23,823 tons in 1998, which ranked

P-16
fourth in Viet Nam. However, this company ranks second in Viet Nam overall,
and is considered to be a high potential enterprise.
Table 2 shows the production and sales in 1998.
Table 2 Production and Sales in 1998
Product Production/designed Sales (VND) Products Bleached pulp Caustic soda Soda recovery
23,823/23,000 10,045/15,000
1,610/2,400 1,082/6,175
226,429,541,117 For Mill use For Mill use For Mill use
2. Production Technology
2.1 Production Process
Figure 1 shows a block flow diagram of the factory. The main production
equipment is shown in Table 3.
3. Management Technology
3.1 Management of Business Targets
On a large bulletin board in the factory office shown are monthly budgets and
results for production and each unit consumption in order. The basic purpose of
this measure is to promote awareness of employees. Executives are very keen on
production management.

P-17
① D
rin
kin
g w
ater⑥
④
⑨
⑧
③
Sod
a re
cove
ry 2
.97
t/d
⑩
Wat
erS
team
Cl2
,Ca(
OC
l)2,
NaO
Cl 1
53 t
/d
Cau
ster
izin
g2
T/d
Lim
esto
ne
(60%
Cao
O6.
48)
Boi
ler
smok
e,du
st,0
.6 t
/dh
eigh
t
Riv
er w
ater
31,0
22 m
3/d
Alu
m :
0.16
t/d
H2O
2,N
a2S
iO3
1.13
t/d
Mix
ed l
atex
1.08
t/d
Kao
lin
: 0.
7t/d
Alk
alin
e re
cove
rpl
ant
Fil
trat
e pl
ant
17,0
00 m
3/d
Wh
ite
pape
r
R.M
rej
ects
(Kn
ots,
woo
ddu
st 1
t/d
)
Coo
kin
g R
.M(b
ambo
o, w
ood)
119.
7 t/
dN
aOH
14.8
t/d
NaC
l9.
3 t/
d
Fu
el o
il41
,399
l/d
Coo
kin
gE
lect
roly
ze
Ble
ach
ing
plan
t
PM
Was
te w
ater
trea
tmen
t(1
2,00
0 m
3)
Boi
ler
Pro
duct
s
Sm
oke,
dust
, boi
ler,
SO
2,N
O2,
CO
, VO
C2.
3 t/
d
Boi
ler
wat
er
Tre
ated
was
te w
ater
(3,0
00 m
3/d)Riv
er
SS
6t/
ddr
ynes
s 16
%R
iver
Impo
rted
pu
lp 2
9.5
t/d
Fil
ler
8.9
t/d
Was
te p
aper
6.1
2 t/
d
Bla
ck li
quor
rec
over
u19
4 m
3/d
Ste
am
Wat
er
Bas
ed p
aper
Coa
ted
pape
r
Ble
ach
ed p
ulp
33.
5 t/
d
Ste
amW
ater
Was
te w
ater
200
m3/
h
Fin
alpr
odu
cts
②
Fig
ure
1
Blo
ck F
low
Dia
gram
of
the
Fac
tory

P-18
Table 3 Main Equipment
Paper machine No.1 DE PRETTO ESCHER WYSS – Italy – Starting up 9 October 1961 Capacity 7,500 ton/year Speed 150 m/min Trim width 2.3 m
Paper Machine No.2 KARHULA – AHLSTROM - Finland – Starting up: End of 1968 Capacity 9000 ton/year Speed 240 m/min Trim width 2.6 m
Paper Machine No.3 TOMIOKA MACHINERY WORK – Japan Starting up 10 May 1967 Capacity 4,500 ton/year Speed 40 m/min Trim width 1.65 m
Coating Machine OFMANN-SCHWABE KREFELD- Germany Starting up 1990 Capacity 2,000 ton/year Speed 60 m/min Trim width 1.6 m
Electrolysis Plant Starting up: 1973 NaOH Capacity 2,400 ton/year Chlorine Capacity 2,100 ton/year
Pulp Plant Starting up: April 1967 Capacity 15,000 ton/year Brightness 82°- 85°ISO Raw material Bamboo, Eucalyptus Ball Digesters 7 kg/cm2
Chemical Recovery Starting up: December 1997 Capacity 4,000 ton/year Black Liquor 8°Be,500 m3/day
Recovery Boiler 12.7 kg/ cm2,8 ton/hour Stack Height 60 m - concrete
Electrical Generator Starting up: 1961 – 1971 Diesel M.A N 1,000,kVA -2pcs Turbine Escher Wyss 9,000kVA
Boiler Center Starting up: 1971 – 1991 Boiler No.4 Babcok 50 kg/cm2 - 40 ton/hour Boiler No.6 - 7 DKB 9 kg/cm2 - 25 ton/hour
Environmental System Starting up: 1992 Sedimentation Basin 12,000 m3 – Sweden –
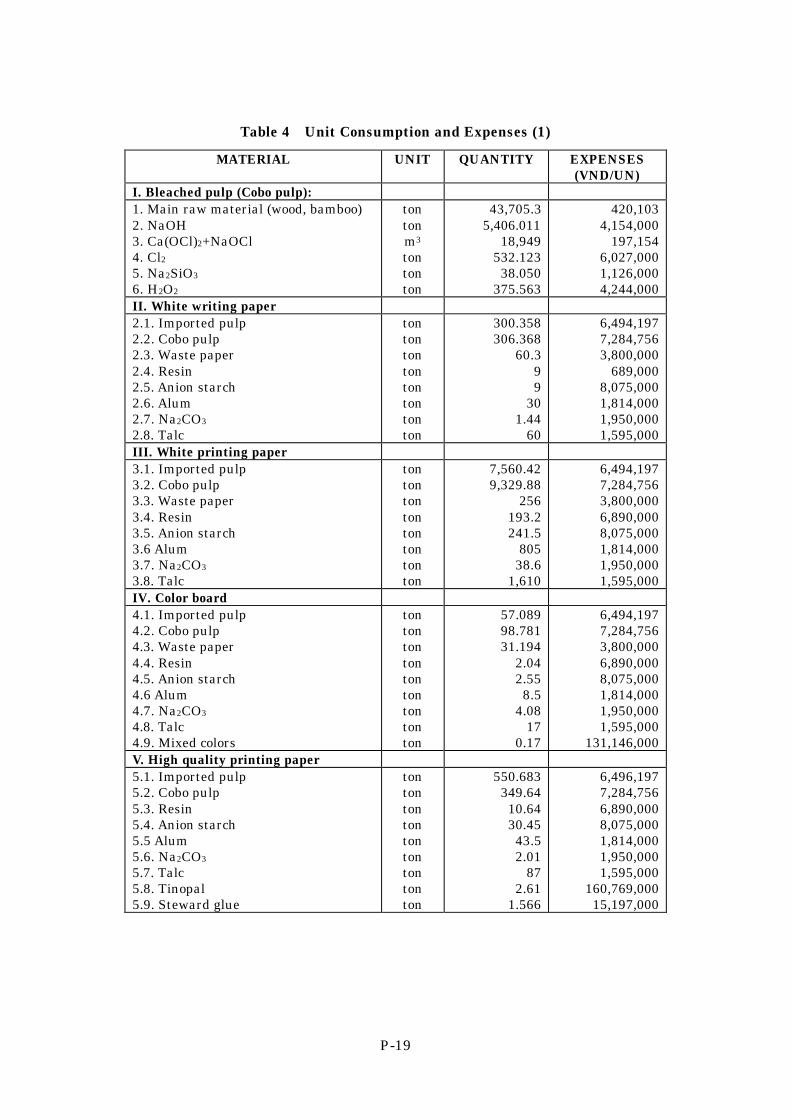
3.2 Unit Consumption
Unit consumption is grasped and analyzed for each product as shown in Table
4.
P-19
Table 4 Unit Consumption and Expenses (1)
MATERIAL UNIT QUANTITY EXPENSES (VND/UN)
I. Bleached pulp (Cobo pulp): 1. Main raw material (wood, bamboo) 2. NaOH 3. Ca(OCl)2+NaOCl 4. Cl2
5. Na2SiO3
6. H2O2
ton ton m3
ton ton ton
43,705.3 5,406.011
18,949 532.123 38.050
375.563
420,103 4,154,000
197,154 6,027,000 1,126,000 4,244,000
II. White writing paper 2.1. Imported pulp 2.2. Cobo pulp 2.3. Waste paper 2.4. Resin 2.5. Anion starch 2.6. Alum 2.7. Na2CO3
2.8. Talc
ton ton ton ton ton ton ton ton
300.358 306.368
60.3 9 9
30 1.44
60
6,494,197 7,284,756 3,800,000
689,000 8,075,000 1,814,000 1,950,000 1,595,000
III. White printing paper 3.1. Imported pulp 3.2. Cobo pulp 3.3. Waste paper 3.4. Resin 3.5. Anion starch 3.6 Alum 3.7. Na2CO3
3.8. Talc
ton ton ton ton ton ton ton ton
7,560.42 9,329.88
256 193.2 241.5
805 38.6
1,610
6,494,197 7,284,756 3,800,000 6,890,000 8,075,000 1,814,000 1,950,000 1,595,000
IV. Color board 4.1. Imported pulp 4.2. Cobo pulp 4.3. Waste paper 4.4. Resin 4.5. Anion starch 4.6 Alum 4.7. Na2CO3
4.8. Talc 4.9. Mixed colors
ton ton ton ton ton ton ton ton ton
57.089 98.781 31.194
2.04 2.55 8.5
4.08 17
0.17
6,494,197 7,284,756 3,800,000 6,890,000 8,075,000 1,814,000 1,950,000 1,595,000
131,146,000 V. High quality printing paper 5.1. Imported pulp 5.2. Cobo pulp 5.3. Resin 5.4. Anion starch 5.5 Alum 5.6. Na2CO3
5.7. Talc 5.8. Tinopal 5.9. Steward glue
ton ton ton ton ton ton ton ton ton
550.683 349.64 10.64 30.45 43.5 2.01
87 2.61
1.566
6,496,197 7,284,756 6,890,000 8,075,000 1,814,000 1,950,000 1,595,000
160,769,000 15,197,000

P-20
Table 4 Unit Consumption and Expenses (2)
MATERIAL UNIT QUANTITY EXPENSES (VND/UN)
VI. White sized board: 6.1. Imported pulp 6.2. Waste Paper 6.3. Resin 6.4. Anion starch 6.5 Alum 6.6. Na2CO3
6.7. Steward glue
ton ton ton ton ton ton ton
396.422 409.01
5.04 6.3
12.6 1.008 2.61
6,494,197 3,800,000 6,890,000 8,075,000 1,814,000 1,950,000
15,197,000 VII. Cartons made from bamboo 7.1. Semi chemical pulp 7.2. Resin 7.3. Anion starch 7.4. Alum 7.5. Na2CO3
ton ton ton ton ton
445.256 1,478.886
12.8 32
2.56
2,401,892 1,670,405 6,890,000 1,814,000 1,950,000
VIII. Coated paper 8.1. Based paper 8.2. Mixed glue 8.3. Kaolin
ton ton ton
2,148.126 395.6 239.8
10,502,771 8,439,000 2,768,000
IX. Water and energy 9.1. Water 9.2. Fuel oil 9.3. Energy
m3
litter kWh
535 1,680
824
11,421,859 15,110,923 39,864,354
4. Industrial Wastewater Treatment and Discharge
4.1 Industrial Wastewater
The water consumption in the factory is about 430 times as high as the paper
production. Wastewater is mostly discharged from the pulping process and the
paper process. For wastewater from the paper process, SS is collected in a settler,
and clean water is reused for the pulping process. Wastewater from pulping
process, in which SS and COD values are usually major concern, is treated through
the use of a 12,000 m3 sized sedimentation tank and SS, filler and the like are
removed and carried out of the factory at an amount of 6 tons per day. However,
the removal of COD is not efficient.
4.1.1 Wastewater Analysis in November 1999
The analysis results of wastewater samples that were taken on 30 November
1999 are shown in Table 5.

P-21
Table 5 The Results of Wastewater Analysis
(30 November 1999)
Sampling No Unit 1 2 3 4 6 8 9 10 Temp ℃ 28.6 20.7 34.4 28.7 33.6 28.9 PH 6.63 9.18 4.62 6.95 6.49 7.11
Elec. Conductivity μS/cm 65 5168 694 53 3140 68 Turbidity NTU 10 68146 154 10 33 10
Oil content mg/l A* A* A* 8.7 8.5 0.9 BOD mg/l 0 632 0 136 196 COD mg/l 5 141639 1102 1416 5 944 669 11 DO mg/l 5.34 0.8 4.6 4.82 2.5 4.16 VSS mg/l 0 5.86 1.142 570 2 316 160 5 TSS mg/l 0 10680 1686 700 5 329 215 13
Total nitrogen mg/l 2.5 11.5 82.1 48.6 21.4 Residual Chlorine mg/l 0.29 A* A* 0.05 . A*
SO4 2- mg/l 10 440 20 9 2 10 6 S2- mg/l
Cyanogen mg/l 0.01 0.06 0.02 A* 0.02 Phenol mg/l 0.011 0.009 0.1 0.119 A*
Na mg/l 197 CaCO3 mgeq/l 82 16
Cu mg/l 0.09 0.09 0 0.16 0.03 Pb mg/l 0.027 0.017 0.034 0.011 0.032 Cd mg/l Trace trace Trace trace trace Hg mg/l Trace trace 0.45 2 A*
Cr(VI) mg/l A* A* 0.42 0.21 trace Zn mg/l
Salt % 0 0.02 0 0.15 0
Note : A* : not detected.
4.1.2 Wastewater Analysis in February 2000
(1) Samples taken before and after wastewater treatment.
Samples were taken before and after wastewater treatment (sedimentation
tank) on 29 February 2000 as was done in November 1999.
The analysis results are shown in Table 6. The mercury value, which was of
concern, decreased by three decimal points, and this may be explained by a change
in the type of caustic soda being used.

P-22
Table 6 Results of Wastewater Analysis
(29 February 2000)
Sample No Unit 8 9 Temp ℃ pH
Elec. Conductivity μS/cm Turbidity NTU
Oil content mg/l 0.25 0.1 BOD mg/l 510 756 COD mg/l 956 1069 DO mg/l 7.9 7.5 VSS mg/l 212 76 TSS mg/l 225 116
Total nitrogen mg/l 2.8 3.55 Residual Chlorine mg/l not detect. not detect.
SO4 2- mg/l 7 10 S2- mg/l
Cyanogen mg/l 0.07 0.4 Phenol mg/l 0.2 0.45
Na mg/l 8440 11 CaCO3 mgeq/l 1785 2.5
Cu mg/l 0.37 0.2 Pb mg/l 2.15 <0.001 Cd mg/l <0.001 <0.001 Hg mg/l 0.006 0.003
Cr(VI) mg/l 0.049 <0.01 Zn mg/l 7 0.1
(2) Wastewater from the washing process for bleached and unbleached pulp
A total of 11 samples from washing process for bleached and unbleached pulp
were taken at the following points.
Black Liquor from the Brown Stock Washer Wastewater from Bleaching Washer W1:Black Liquor from the No.1 Stage Washer B6:Wastewater from Cl2 Washer W2:Black Liquor from the No.2 Stage Washer B6:Wastewater from NaOH Washer W3:Black Liquor from the No.3 Stage Washer B6:Wastewater from No1 HYPO
Washer W4:Black Liquor from the No.4 Stage Washer B6:Wastewater from No2 HYPO
Washer W5:Black Liquor going to the Evaporator B6:Wastewater from H2O2 Washer W5’:Diluted Black Liquor
The results of analysis are shown in Table 7. Judging from the COD values,
about 1/4 of the dissolving solid component is carried over to the bleaching process.

P-23
Table 7 Results of Wastewater Analysis
(Bleached and Unbleached Pulp Washing Process)
(3 March 2000)
Sample No Unit W1 W2 W3 W4 W5 W5' BOD mg/l 27,232(*) COD mg/l 66,000(*) 67,885 42,240 15,085 120,685 47,14 DO mg/l 7.5 Na mg/l 2750(*)
SW (15℃) 1.0595 1.03 1.017 1.0038 0.9985 0.9977
Sample No Unit B6 B7 B8 B9 B10 BOD mg/l 172 410 238 232 413 COD mg/l 848 2,451 716 678 716 DO mg/l 7.3 7.6 7.5 7.5 7.5 Na mg/l 41.2 92.5 226 41.8 92.3
SW (15℃) 0.9967 0.999 1 0.9977 0.9952 Note: (*) - sample after paper filtration
W- Washing Plant B- Bleaching Plant
(3) Black Liquor in the Evaporator
The Evaporator in the Dong Nai factory is equipped with a special feature in
liquid supply. Samples were taken 29 February 2000 at the following points
according to the designed sequence of the equipment.
No.1: Black Liquor feeding to #3V/E No.6: Black Liquor feeding to #2V/E No.2: Black Liquor feeding to #4V/E No.7: Black Liquor feeding to F. Cyclone No.3: Black Liquor feeding to #1V/E No.8: Black Liquor feeding to R. Boiler No.4: Black Liquor feeding to #2PH N0.9: Wastewater from the Seal Pit No.5: Black Liquor feeding to #1V/E
The results of analysis are shown in Table 8.
Table 8 Results of Black Liquor Analysis in the Evaporator
(29 February 2000)
Sampling No Unit 1 2 3 4 5 6 7 8 9 BOD mg/l 30 35 COD mg/l 131.25 60 DO mg/l 8 8.3 VSS mg/l 717.16 29.906 TSS mg/l 1995 9180 6540 1240 15630 15240 22770 81570
Phenol mg/l 23.2 2.33 Na mg/l 7360
SW(31℃) kg/l 1.0771 1.178 1.174 1.184 1.1893 1.2047 1.2605 1.2789 0.998 K mg/l 110
ash VS mg/l 67210 309470

P-24
The concentration of heavy black liquor is estimated to be 40 % from specific
gravity, which is considered to be relatively low because samples were taken right
after the equipment operation started.
5. Industrial Pollution Prevention Measures
5.1 Present Problems
The following 5 items are the major problematic issues at present:
(1) Large size of chip;
(2) Unbleached pulp washing;
(3) High consumption of chemicals used for the bleaching process;
(4) Evaporation rate of the evaporator;
(5) Power generation using the Co-generation system.
5.1.1 Large Size of Chips
The use of large chip produces unfavorable effects such as an increase in the
consumption rate of chemicals and cooking time, or decrease in pulp yield.
5.1.2 Washing Process for Unbleached Pulp
There are four washers. However, they are not equipped with pumps or other
spare equipment, and are not maintained well. Because of this, it is impossible to
carry out a four drum- four stage circulating washing. At present, only a single
stage, independent washing is being carried out for each of the four drums. Gland
packing of pumps and agitators is also not maintained sufficiently, and a certain
amount of black liquor leakage was observed.
The factory is using washers that can be used for a two stage one drum process.
By installing a small pump for each, those washers can be remodeled and changed
to four drum-seven stage type and the discharged amount of NaOH and COD can
be reduced to 1/20 or less.
5.1.3 Consumption Amount of Chemicals in the Bleaching Process
1) As mentioned above, the consumption amount of chemicals is large because of
the large size of chips being used. Therefore, consumption amount of Cl2 can
be reduced from 6 % to 4 % by changing the size of chips to a more suitable size,
and improving the washing process.
2) Since the five stage bleaching system, CEHHP washers, utilizes only clean
water for washing, in the end a large amount of wastewater is discharged as a

P-25
result. It is necessary to utilize all or part of the wastewater from the
succeeding stage for the preceding stage washer. This will allow remaining
chemicals from the preceding stage to be neutralized, resulting in the reduction
of the wastewater amount, and can also decrease high quality fiber draining
loss. Waste heat can also be reduced or recycled. Thus the amount of
chemicals and steam consumed in succeeding stages can be reduced as well.
5.1.4 Evaporation Rate of the Four Drum Four Stage Multiple Effect Evaporator:
E/S is about 1.
The E/S rate is usually around 3.2 and the amount of steam used should be 1/3
or less of the steam generated by the recovery boiler. However, the evaporator
utilizes the entire amount of steam, at a rate of 7-8 t/h.
Figure 2 shows the concentration of supply liquid in each drum, and the
following statements could explain the reasons for these results.
(1) Only the #3 and #2 drums work efficiently. The #4 and #1 drum are
working inefficiently. The load for each drum should be proportionate.
(2) While the temperature of diluted black liquor is too low, that is 65 ℃, it is
fed to the #3 drum. The diluted black liquor with this low temperature
should be fed to the #4 drum.
(3) By utilizing three existing external heaters, the value of E/S decreases.
Therefore, it is recommended not to use these external heaters under the
present low load operations.
(4) It is possible that a large amount of gland sealing water from pumps for
the evaporator flows into the black liquor because much gland liquid
leakage has been observed.

P-26
Sampling S.W TSS
#3 Feed 1.0771 1995 #4 Feed 1.1777 9180 #1 Feed 1.1893 15630 #2 Feed 1.2047 15240 Feed to F/C 1.2605 22770 Feed to BLB 1.2789 81570
Figure 2 Supply Water and Black Liquor Ratio in Drums
The heat balances around multiple effect evaporator before and after
implementing countermeasures are shown in Figure 3 and 4 respectively.
5.1.5 Problems about the Co-generation Equipment
The factory used to sell excess electric power generated by two generators.
However, a boiler, designed for operations at 50 kg/cm2 pressure, can be operated
only at 18 kg/cm2 pressure. In addition, a turbine, with the capacity of 9,000kVA,
is not operational at present. Since the unit cost for co-generation is 2 yen/kWh,
or less compared to the unit buying price, 6 yen/kWh, they should start using
co-generator to generate power by fixing the problems with the boiler and the
turbine.
5.2 Countermeasures for Production Technology
Countermeasures and estimated costs for the main problems in the factory are
summarized as follows:
S.W of Feed BL
1.05
1.1
1.15
1.2
1.25
1.3
0 2 4 6 8
Order
SW S.W

P-27
S
team
AR
EA
[m
2]100
110
103.
5
90 100
97.4
75 90 76.5
63 75 65.1
1.99
1.75
1.95
CW
Fee
dP
rod.
△T
[℃
]
BPR
[℃
]
Conc
. [wt
%]
U [k
cal/m
2・h
r℃]
550
6.5
3.5
29.4
350
450
2.6
7.4
45.0
850
450
13.5
1.5
17.8
190
450
9.9
2.1
22.4
230
Fee
d 11
.25t
/h 1
5wt%
60℃
Pro
d. 3
.75t
/h 4
5wt%
Eva
p. 7
.5 t
/hS
team
2.3
8 t/
h
at H
eat
E/S
3.15
Los
s 0
TS
1.6
9 B
Dt/
h(T
his
bal
ance
is
calc
ula
ted
un
der
con
diti
on o
f ex
clu
din
g E
xter
nal
55
x 3
Hea
ters
.)
1.81
Fig
ure
3
Hea
t B
alan
ce o
f M
ult
iple
Eff
ect
Eva
pora
tor
now
in u
se

P-28
Fig
ure
4
Im
prov
ed H
eat
Bal
ance
of
Mu
ltip
le E
ffec
t E
vapo
rato
r
Ste
am
AR
EA
[m
2]99.0
115.
010
6.5
85.5
99.0
88.9
73.8
85.5
75.8
63 73.8
64.5
3.08
2.86
2.83
CW
Fee
dP
rod.
△T [℃
]
BPR [℃
]
Conc. [wt%]
U [kcal/m2・hr℃
]
550
8.5
7.5
45 400
450
10.1
3.4
29.2
400
450
9.7
2.0
21.9
400
450
9.3
1.5
17.8
400
Fee
d 18
.06t
/h 1
5wt%
60℃
Pro
d. 6
.02t
/h 4
5wt%
Eva
p. 1
2.04
t/h
Ste
am 3
.62
t/h
at
Hea
tE
/S
3.
32
L
oss
0T
S
2
.71
BD
t/h
(Th
is b
alan
ce is
bas
ed u
pon
: L
iqu
or f
low
; 4E
→3E→
2E→
1E ;
U v
alue
of
each
ves
sel
and
with
no
Ext
ern
al H
eate
rs.)
3.27

P-29
5.2.1 Change the Chip Size to a More Suitable Size
It is easy to change the chip size by adjusting the length of the blade of the
“chipper.” However, by doing this the processing capacity will decrease, so
operating hours should be extended. It is also necessary to install chip screens,
and large size chips should be cut into smaller pieces by a crusher.
Estimated cost: 20 million yen=2.6 billion VND
5.2.2 Washing Process for Unbleached Pulp
In order to use a four stage washing system, the following countermeasures for
maintaining the entire washing process for unbleached pulp should be
implemented:
(1) An adjustment and maintenance of four sets of valves on washing
machines;
(2) Pump installation (30) and agitator maintenance;
Pumps currently used should be replaced with mechanical sealing types in
order to avoid leakage of seal water into black liquor, and a sufficient
amount of spares should be provided.
(3) Pipes and valves should be replaced and well maintained;
(4) Washing water temperature should be maintained at 60℃ or higher.
Estimated cost: 50 million yen=6.5 billion VND
5.2.3 Counter-current Washing for the Bleaching Process
In order to enable counter-current washing in each stage of the bleaching
process, the following item should be improved.
(1) Install pipings in order to reuse a part of the diluted white water,
discharged from the outlet of the succeeding stage washer, as washing
water for the preceding stage washer.
Estimated cost: 30 million yen=3.9 billion VND
5.2.4 Remodeling of the Evaporator and Surrounding Equipment
The following items should be remodeled in order to improve the efficiency of
the evaporator:
(1) The #1 drum should be changed to a falling film type;
(2) Because the evaporator has a large capacity, external heaters should be
by-passed in order to increase the value of E/S;
(3) All pumps should be replaced with mechanical seal type. 10 sets of spare

P-30
pumps need to be arranged.
Estimated cost: 30 million yen=3.9 billion VND
5.2.5 Maintenance of the Boiler and Turbine
For now, the boiler and turbine repair and maintenance issue needs to be
studied in more detail. However, if it is implemented, profits will be returned to
the company within a year for sure.
3,000 kWh×(6-2=4) Yen/kWh×8,000 hr=96 million Yen/year
5.3 Benefit by Improvement
5.3.1 Required Costs
The total costs required to implement the proposed improvement stated in
5.2.1 to 5.2.4, were estimated and shown below:
Estimated total costs: 130 million yen=16.9 billion VND
5.3.2 Benefit Calculation
The following calculation can be made to estimate the merits of the reduction
of NaOH consumption by black liquor recovery.
0.5 t/PT x 10,045 PT/year x @4,154,000 VND/t = 20.9 billion VND/y
About 16 million yen can be saved in NaOH costs, and other additional effects
can be expected as follows:
a. The wastewater load will decrease in the unbleached and bleached pulp
process;
b. A decrease in usable fiber drainage loss: 200 t/year, 1.5 billion VND;
c. An increase in the amount recovered and the concentration of BL(Black
Liquor);
d. Conserve heavy oil used for steam generation by evaporating more steam
in the BLB(Black Liquor Boiler), and decrease the amount of used steam in
the Vacuum Evaporator;
Reduce 4,000 kl/y or more: 6.7 billion VND
e.Reduce the amount of Cl2 used in the bleaching process
6% → 4%=2% 200 t/year 1.2 billion VND
Total 20.9 + 1.5+ 6.7 + 1.2 + = 26.3 billion VND 203 million yen/y

P-31
5.4 Wastewater Treatment
5.4.1 Design Basis
The total amount of wastewater that requires treatment is set at 4,800 m3/day.
The results of the wastewater analysis of samples taken at the final wastewater
discharge point of the factory were used as the basis of the wastewater treatment
design.
5.4.2 Conceptual Design
The wastewater treatment process and equipment layout chart is shown in
Figure 5. This wastewater treatment equipment was designed only for the
treatment of wastewater under its current conditions. If the CP measures stated
above are implemented, the scale of equipment will be reduced to 1/3 of the
designed size.
1. Flow Sheet
2. Layout
70 m
7 m 17 m 17 m 25 m
Sedimentation tank
25 m 23 m
2 m
Area=1,750 Square Meter
Figure 5 Wastewater Treatment Flow Sheet and Arrangement
Raw water
Biological treatmentt
tank
Removal
of SS
untreated
water
tank
Biological
treatmentWastewater
SS
dehydration
SS
Sedimentation
tank
untreated
water tank
SS Remove SS dehydration

P-32
6. Recommendations
6.1 Short Term Recommendations
The following items are recommended for short-term countermeasures:
(1) Promote 7S activities;
(2) Change the size of raw material chips to a more suitable size;
(3) Remove piled up raw material as well as bubbles from the wire cylinder by
installing shower pipes;
(4) Use NaOH that contains a low concentration of mercury;
(5) Promote a realistic treatment for used paper and maintenance in the
de-inking plant.
The total costs for short term countermeasures: 30 billion VND
6.2 Mid-term Recommendations
The following items are recommended as mid-term countermeasures:
(1) Strengthen the pollutant collection system;
(2) Establish a collection and recycle system of white water from each paper
machine;
(3) Use heated water for the showering process;
(4) Heat rolled paper with steam;
(5) Promote the use of a realistic treatment for used paper and maintain and
efficiently use the de-inking plant.
The total estimated costs for mid-term countermeasures: 12 billion VND
6.3 Long term Recommendation
The following items are recommended as long term countermeasures:
(1) Make the best use of the collection and recycling system for cooking liquor;
(2) Collect steam used for cooking;
(3) Collect and reuse wastewater from each process;
(4) Use heated water for the showering process;
(5) Establish a collection system for chemicals;
(6) Promote a realistic treatment for used paper and maintain and efficiently
use the de-inking plant.
The total estimated costs for long term countermeasures:5.7 billion VND
The survey team proposes that profitable Cleaner Production countermeasures
be implemented as much as possible, and that End of Pipe should be implemented
to the minimum degree required.

P-33
6.4 Proposals for Implementation
At present, the company is in a situation where they cannot afford to repair or
maintain broken equipment and machines. Once they have the necessary funds
for investment, considering its necessity and validity, Cleaner Production measures
should be implemented.
The followings are important items to be considered when selecting
equipment:
1. Select equipment considering energy saving effects;
2. Select the best material considering the life cycle of the equipment;
3. Choose equipment that is easy to maintain;
4. Prepare the minimum amount of spare parts necessary;
5. Set budgets for new machines, including costs for following up after
operation begins.

P-34

P-35
Case Study P-03
An Binh Paper Company
Survey Date:8 December 1999
1, 2 & 3 March 2000
1 General
1.1 Company Profile
The An Binh Paper Company was established in 1990, and began pulp
manufacturing operations in 1992 in Bihn Duong Province. Since their first paper
machine was constructed in 1993, they have been adding on to their number of
paper machines gradually, as needed. At present, this private company has seven
paper machines.
In November 1999, the Company was manufacturing bamboo pulp. However,
as a pollution prevention measure, pulp manufacturing was stopped in January of
2000, and in its place, waste paper processing equipment was being constructed.
The Company Outline is shown in Table 1.
Table 1 Enterprise Profile
Name An Binh Ltd Company
Type Private
Address 27/5A Kha Van Can, Di an, Binh Duong Province
TEL Tel: 088 960 155/Fax: 088 960 700
Established 1992
Number ofEmployees 238 ( 3 shifts,300 working days) Main products
1.2 Organization
There are only two managers responsible for technology at the Company. The
Company has a domestic construction department, which has constructed paper
machines in-house except for one imported pressurized dryer vessel from Taiwan.
1.3 Business Status
Bamboo pulp manufacturing equipment, which had been in operation since the
Company was established, was shut down as an industrial pollution prevention
measure in January of 2000. At present, raw materials for cartons and cardboard
are being manufactured. The production capacity for each of these materials is
12,000 t/year and 5,000 t/year, respectively.

P-36
In addition, the company has 500 ha of eucalyptus afforested land, and in the
near future, they have plans for constructing a pulp factory, which will be provided
with complete industrial pollution prevention countermeasures, in another
location.
Production and Sales in 1998 are shown in Table 2.
Table 2 Production and Sales
Product Unit Production Sales (million VND) Bamboo pulp T 2,444 7,000 Carton T 4,735 13,200 Packaging T 1,648 8,240 Total 28,440
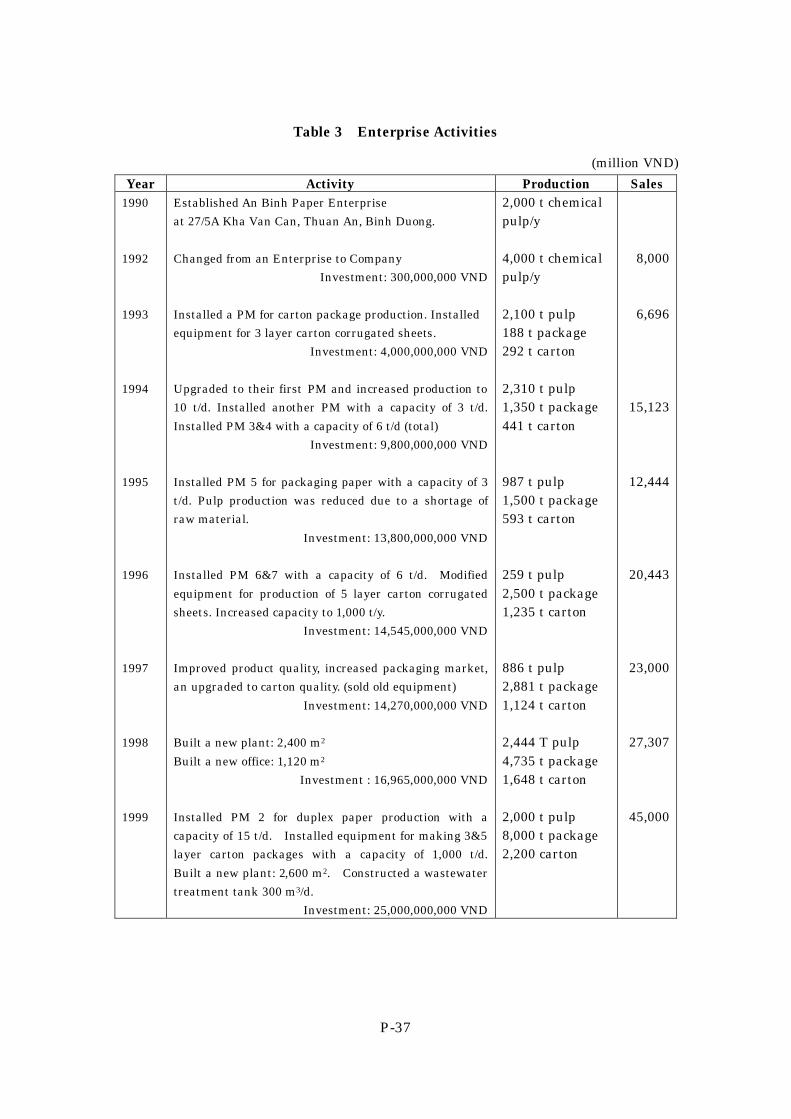
Also,as is shown in Table 3, production capacity is rapidly increasing.
P-37
Table 3 Enterprise Activities
(million VND) Year Activity Production Sales
1990
1992
1993
1994
1995
1996
1997
1998
1999
Established An Binh Paper Enterprise
at 27/5A Kha Van Can, Thuan An, Binh Duong.
Changed from an Enterprise to Company
Investment: 300,000,000 VND
Installed a PM for carton package production. Installed
equipment for 3 layer carton corrugated sheets.
Investment: 4,000,000,000 VND
Upgraded to their first PM and increased production to
10 t/d. Installed another PM with a capacity of 3 t/d.
Installed PM 3&4 with a capacity of 6 t/d (total)
Investment: 9,800,000,000 VND
Installed PM 5 for packaging paper with a capacity of 3
t/d. Pulp production was reduced due to a shortage of
raw material.
Investment: 13,800,000,000 VND
Installed PM 6&7 with a capacity of 6 t/d. Modified
equipment for production of 5 layer carton corrugated
sheets. Increased capacity to 1,000 t/y.
Investment: 14,545,000,000 VND
Improved product quality, increased packaging market,
an upgraded to carton quality. (sold old equipment)
Investment: 14,270,000,000 VND
Built a new plant: 2,400 m2
Built a new office: 1,120 m2
Investment : 16,965,000,000 VND
Installed PM 2 for duplex paper production with a
capacity of 15 t/d. Installed equipment for making 3&5
layer carton packages with a capacity of 1,000 t/d.
Built a new plant: 2,600 m2. Constructed a wastewater
treatment tank 300 m3/d.
Investment: 25,000,000,000 VND
2,000 t chemical pulp/y 4,000 t chemical pulp/y 2,100 t pulp 188 t package 292 t carton 2,310 t pulp 1,350 t package 441 t carton 987 t pulp 1,500 t package 593 t carton 259 t pulp 2,500 t package 1,235 t carton 886 t pulp 2,881 t package 1,124 t carton 2,444 T pulp 4,735 t package 1,648 t carton 2,000 t pulp 8,000 t package 2,200 carton
8,000
6,696
15,123
12,444
20,443
23,000
27,307
45,000

P-38
2 Production Technology
2.1 Production Process
There are three sets of waste paper processing systems, and seven paper
machines which are used as production equipment to produce a total capacity of
12,000 tons of raw material carton and 5,000 tons of cardboard in a year.
Outline of main equipment is shown in Table 4.
Table 4 The Main Equipment
No P.M SPECIFICATIONS PRODUCT PRODUCTION /d
NOTES
01 P.M 1
02 Dryer , 03 cylinder , 03 blanket 2500x1450
1m38 , 115 G/m2 - 300 G/m2 8000,00 Kg
02 SIDES
02 P.M 2
03 Dryer , 05 cylinder , 04 blanket Ø 2000x1950
1m82 , 115 G/m2 - 400 G/m2 10.000,00 Kg
02 SIDES
03 P.M 4
01 Dryer , 02 cylinder , 02 blanket Ø 1500x1350
1m25 , 120 G/m2 - 200 G/m2 3.500 ,00 Kg
01 SIDES
04 P.M 5
01 Dryer , 02 cylinder , 02 blanket Ø 1500x1530
1m44 , 120 G/m2 - 200 G/m2 4.250 ,00 Kg
01 SIDES
05 P.M 6
01 Dryer , 02 cylinder , 02 blanket Ø 1500x1530
1m44 , 120 G/m2 - 200 G/m2 4.250 ,00 Kg
01 SIDES
06 P.M 7
01 Dryer , 02 cylinder , 02 blanket Ø 1500x1530
1m44 , 120 G/m2 - 200 G/m2 4.250 ,00 Kg
01 SIDES
07 P.M 8
01 Dryer , 02 cylinder , 02 blanket Ø 1500x1530
1m44 , 120 G/m2 - 200 G/m2 4.250 ,00 Kg
01 SIDES
Designed capacity = 38.500,00 kg .
I- Refiner system: 1/ Hydro pulper 4pcs, 60 Hp - 100 Hp . 2/ Hollander 01pc, 60 Hp . 3/ Disc refiner 09pcs, 50 Hp .
II- Raw material treatment system: 1/ Vibrator 06pcs, 5 Hp x 06. 2/ Centric cleaner 02pcs, 7.50 Hp - 10 Hp, 02pcs/each . 3/ Sedimentation 03 sets .
III- Fine raw material treatment: 1/ Vibrator 04 sets, 5 Hp x 04. 2/ centric cleaner 05sets, 7.5 Hp x / 10 Hp x 03 . 3/ Sedimentation 09 sets . * Rewinder with 1.82 m, Ø 1.05 m/reel, VS/5 Hp x 01. * Sheet cutter width 1.45 m , VS/5 Hp x 01. * Boiler 1000 Kg steam/h x01. * Boiler 3600 Kg steam/h x01.
3 Management Technology
3.1 Self-management
Over the ten years since established, the Company has gradually increased its
production capacity, and now has what can be considered to be a medium scale

P-39
production capacity. The number of employees is comparatively smaller than at
other state-owned enterprises. The factory maintenance level and cleanliness of
the facilities are also comparatively good.
From this aspect, it appears that the intentions of the Company president
have been thoroughly communicated to employees.
3.2 Raw Material Consumption and Expenses
Materials unit consumption and costs are being analyzed by type of product as
shown in Table 5.
Moreover, for every item, employee salaries are recorded, and the average
yearly salary per employee obtained by dividing this figure by the total number of
employee, 238, is around 7.9 million VND.
Table 5 Consumption of Raw Materials and Expenses in 1998
Product Material used Quantity Expenses (VND) Bamboo pulp 2,444 t
Carton paper 4,785 t
Package paper 1,648 t
Bamboo Caustic soda Energy Employee’s total salary OCC Fuel oil Energy Employee’s total salary Raw material Auxiliary (ink, glue) Energy Employee’s total salary
5,500 t 360 t
665,000 kWh
6,000 t 970,000 litter
2 400,000 kWh
1,750 t
525,000 kWh
2,155,500,000 1,300,000,000
710,000,000 500,000,000
10,300,000,000 3,000,000,000 1,900,000,000
880,000,000
6,800,000,000 350,000,000 450,000,000
500,000,000
4 Industrial Wastewater Treatment and Discharge
4.1 Condition of Industrial Wastewater
At the An Binh Factory 1,320 t/day of water is used, and the water unit
consumption is 45 times that of the product, which is a comparatively small figure.
At present, the factory has a wastewater treatment facility for removing SS before
discharge. The factory wastewater flow chart is shown in Figure 1.
The majority of wastewater in the factory is discharged from the waste paper

P-40
treatment equipment and from each paper machines. The concentration of useful
fibers in this wastewater is high at over 1,000- 2,000 mg/l. Although the quality of
the pulp is not universal depending on paper machine or products being produced,
all the wastewater discharged from the paper machines is treated together.
However, because only large particles of SS, or fillers are removed, and these are
not reused, COD removal is not efficiently performed.
Since 1999, the construction of a 350 m3 activated sludge treatment facility
was planned and a treatment tank was constructed. However, an aeration tank or
an activated sludge system have not yet been constructed, due to financial
difficulty.
Figure 1 Wastewater Flow Diagram
Fresh Water 1,320 m3/d
Water Tank 15 m3
Boiler
Hydro pulper 30 t/d
P. M.
- Alim - Resin
White Water recovery
Fiber recovery Waste Water Treatment
Tank 1st step
Waste Water Treatment
Tank 2nd step
Discharge
Production 25 t/d
⑨
⑩
⑤
② ③
⑦

P-41
4.2 Wastewater Analysis in December 1999
Sampling was carried out in six different locations on 8 December 1999, and
the analysis results are shown in Table 6.
Table 6 Results of Wastewater Analysis
8 December 1999 Sampling No Unit 2 3 5 7 9 10
Temperature ℃ 32.1 32.8 20.8 27.4 32 29.8
pH 7.2 7.67 7.71 7.57 7.62 5.48
Elec. Conductivity μS/cm 445 461 421 406 494 89
Turbidity NTU 899 999 1019 221 675 10
Oil content mg/l 16.4 Not detected
BOD mg/l 460 0
COD mg/l 1120 1520 10400 360 1200 2
DO mg/l 5.25 4.3 1.24 3.21 2.95
VSS mg/l 492 322.4 2014 64.3 361 0
TSS mg/l 407 0
Total nitrogen mg/l 39.7 0.1
Residual Chlorine mg/l Not detected Not detected
SO4 2- mg/l 98 46 30 16 58 12
S2- mg/l
Cyanogen mg/l 0.05 Not detected
Phenol mg/l 0.002 Not detected
Na mg/l 311.8 390.1 271 298.2 284 230
CaCO3 mgeq/l 176 200 429 104 216 8
Cu mg/l 1.64 0.04
Pb mg/l 0.021 0.5
Cd mg/l 0.013 0.008
Hg mg/l Trace trace
Cr(VI) mg/l 0.081 not detec.
Zn mg/l
Salt % 0.01 0.01 0.01 0.2 0
4.3 Wastewater Analysis in March 2000
In March 2000, a study to confirm the nature of wastewater conditions was
executed with the paper machines as the main subject of the investigation.

P-42
(1) Sampling of Wastewater from the #2 Paper Machine
Sampling took place at the following ten points with the #2 paper Machine as
the main subject on1 March 2000.
N.1-Inflow of WC#2 N.6-From Wire Cylinder WC#4 N.2-Over from Inlet Tank of WC#2 N.7-Inlet of #2 Paper Machine C/C N.3-From Wire Cylinder WC#2 N.8-Recycling Over flow of C/C Reject N.4-Inflow of WC#4 N.9-Outlet After W.W Treatment N.4-Overflow from Inlet Tank of WC#4
N.9'-After White Water Recovery
The analysis results are shown in Table 7.
Table 7 Wastewater Analysis Results for Samples Taken
in the Area Around the #2 Paper Machine Sampling No Unit 1 2 3 4 5 6 7 8 9 9' Temperature ℃ 32.8 32.8 33.1
PH 7.46 6.94 6.86
Electric Conductivity
μS/cm 0.602
Turbidity NTU 99.9 6.34 99.9
Oil content mg/l 52.29 83.73
BOD mg/l 660 920
COD mg/l 3,771 1,131 2,388
DO mg/l 4.18 0.08 2.86
VSS mg/l 6,020 5410 1610 6260 4890 1200 10160 11144 422 1390
TSS mg/l 7740 6950 2635 7510 6010 1920 13040 15544 790 2260
Total nitrogen mg/l 45.2 61
Residual Chlorine
mg/l not detect.
not detect.
SO4 2- mg/l 29 124 66
Cyanogen mg/l 1.02 0.74
Phenol mg/l 0.04 0.06
Na mg/l 209 314
Ca2+ mgeq/l 122 84 80
Cu mg/l 2.07 2.53
Pb mg/l 0.02 0.032
Cd mg/l 0.01 0.019
Hg mg/l trace trace
Cr(VI) mg/l 0.02 0.06
Salt % 0.02 0.02 0.02

P-43
(2) Sampling Points of Wastewater from the #1 and #2 Paper Machines
Samples were taken at the following ten points with the paper machines as the
main subjects on 2 March 2000.
N.1- After Sedimentation Centric Cleaner, PM#2 N.7- After Thickener, PM#1
N.2- After Thickener, PM#2 N.10- After Disc Refiner, PM#1
N.4- After Beater, PM#2 W-1: Wastewater of #2 PM
N.5- After Disc Refiner, PM#2 W-2: Wastewater of #1 PM
N.6- After Sedimentation Centric Cleaner, PM#1 W-3: Wastewater of #6,7,8PM
The analysis results are shown in Table 8.
.
Table 8 Wastewater Analysis Results for Samples
Taken from the Area Around the #1 and #2 Paper Machines Sampling No Unit 1 2 4 5 6 7 10 W-1 W-2 W-3
VSS mg/l 10,710 14,230 55.4(*) 17,610 312 28.8(*) 33.7(*) 1,707 934 1,000
TSS mg/l 15,000 19,840 59.9(*) 19,410 384 32.7(*) 38(*) 2,133 1,400 1,520
(*) - filtrated sample
(3) Sampling of wastewater from all paper machines and sampling before and after
treatment
With all the paper machines as the subject, sampling was carried out at the
following 10 points on 3 March 2000.
N.1- Cover Recovery Tank, Sheeting Machine #1 N.6- After PM#6-#8 N.2- Bottom Recovery Tank, Sheeting Machine #2 N.7- Overflow to Wastewater Reservoir N.3- Cover Recovery Tank, Sheeting Machine #1 N.8- Overflow to Wastewater Reservoir N.4- Bottom Recovery Tank, Sheeting Machine #2 N.9- Inlet to Wastewater Treatment N.5- After PM#4-#6 N.10- Outlet After Wastewater Treatment
The analysis results are shown in Table 9.
Table 9 Wastewater Analysis Results of the Area Around All the Paper Machines
Sampling No Unit 1 2 3 4 5 6 7 8 9 10
VSS mg/l 350 286 721 830 930 900 1790 2030 1930 135
TSS mg/l 360 293 733 850 1170 1130 2420 3000 2830 140
Ash of TSS) 10 7 12 20 240 230 630 970 900 5

P-44
5 Industrial Pollution Prevention Countermeasures
5.1 Present Problematic Issues
For the time being, the following four items are the major problematic issues
the Company is facing:
(1) Dust remover is inadequate;
(2) Useful fibers are flowing out of the paper machine;
(3) Wastewater treatment facilities are incomplete;
(4) Low efficiency of pumps.
5.1.1 Inadequate Equipment for Pulper Dust Removal
While the quality of OCC, which is used as the raw material for carton
manufacturing, is good, the amount of dust discharged from OCC is quite high.
Because of this, useful fibers are being washed away. The present system consists
of the separation and subsidence of heavy foreign substances by the riffler, Yanson
Screens with large diameters and round holes, and large diameter centri-cleaners.
Therefore, it is impossible to remove even big particle of dust causing the quality
and the grade of the paper to fall.
5.1.2 Drainage Loss of Useful Fibers from the Paper Machine
Even though it is comparatively on the good side in Vietnam, the OCC yield is
low as around 80% and a lot of raw material is washed out. Because the recovery
of useful fibers in the water is not being carried out, the wastewater pollution load
is high.
Ex. 1: If the left over rate is brought up to 80%-90%, the raw material wash out is
10/20=1/2 i.e. the SS pollution load is reduced by half.
Ex. 2: If the left over rate is brought up to between 80-95%, then the washout of
raw materials is 5/20=1/4 i.e. the SS pollution load is 1/4
5.1.3 Unfinished Wastewater Treatment Facilities
As for the incomplete wastewater treatment facility, because wastewater
flowing into a 3 m deep treatment tank for activated sludge treatment is not
aerated, there is a possibility of methane gas generation caused by anaerobic
bacteria in the high temperature season.

P-45
5.1.4 Low Efficiency Pumps
The efficiency of the domestic pumps now in use was estimated at less than
40 % based on the result of electricity measurement.
Because electricity cost in Viet Nam is almost twice that of the average
international rate, low pump efficiency is one of the factors that make product costs
relatively high.
5.2 Production Technology Countermeasures
5.2.1 Strengthen the Dust Removal Capacity
The following 2 items are recommended in order to strengthen the dust
removal capacity:
(1) Change the Features of the Jonson Screens
Exchange Jonson Screens with round holes with slit type.
Ex.1 5-8H 0.5-0.8S
Ex.2 2.5-3.5H 0.35-0.45S
An estimated cost(10 machines) :6 million Yen=0.8 billion VND
(2) Centrifugal Cleaner
Since the cleaner in use only has a single stage, and the machine rejects a lot
of staff, wastewater is sent through a junk box where dust settles. Therefore, the
dust and dirt that are separated by a centrifugal cleaner are put back again into
the raw material.
The Centrifugal cleaner should have a cascade system with more than 3 stages,
and concentrated dust and dirt should be discarded.
Estimated cost(for 3 Paper Machines): 11million Yen=1.4 billion VND
5.2.2 Install a Settler for Recovering Useful Fibers
In order to recover raw materials that drain out with water, useful fibers from
the white water should be collected in each paper machine, or preferably for
individual kinds of waste paper. The following types of settlers made of concrete
should be installed for recovery.
Ex.1. PM #1 20 m3
Ex.2. PM #2 25 m3
Ex.3. PM #4-#8 50 m3
Estimated costs(for 3 Paper Machines): 5 million Yen=0.7 billion VND

P-46
5.2.3 Improvement of Equipment in Wastewater Treatment Facilities
Supplying a small amount of air can prevent anaerobic fermentation. In
order to prevent methane gas generation, it is recommended that aerators be
installed.
Estimated costs ( 5 Aerators): 18.5 million Yen=2.4 billion VND
5.2.4 Use High Efficiency Pump
If high efficiency pumps from abroad are used, 1/3 to 1/2 of electricity costs can
be saved. Once they have the needed resources, they should switch pumps to the
high efficiency type.
5.3 Benefit of Countermeasures
5.3.1 The Total Required Investment
The proposed items stated in 5.2.1to 5.2.3 require the following budget:
Estimated cost :40.5million Yen=5.3 billion VND
The proposed items dealing with process improvement (5.2.1-5.2.2)require
the following investment:
Estimated cost :22 million Yen=2.9 billion VND
5.3.2 Estimation of Economic Effects
(1) Merits for Collecting Useful Fibers
Assuming that about 1,000 mg/l of useful fibers can be collected, and the pulp
price is 4,000 VND/kg,
55 m3/hr×0.95×8,280 hr/y×1,000/(1000,000)×4,000,000 VND
=1.7 billion VND/y
This amount of raw material cost can be saved, and at the same time, the
wastewater load can be decreased.
Furthermore, if this system is introduced, it is expected that it will have a big
effect on paper quality, strength will improve, electricity consumption will decrease,
and paper will not cut easily.
5.4 Wastewater Treatment
5.4.1 Design Basis
The total amount of wastewater that requires treatment is 1,300 m3/day. A
conceptual design was carried out for wastewater treatment using the results of

P-47
the wastewater analysis of samples taken at the wastewater outlet points.
5.4.2 Conceptual Design
Figure 2 shows the wastewater treatment process and equipment layout.
This facility can use the activated sludge tank that was installed in 1999.
Equipment is designed only for treatment that incorporates the End of Pipe
methods under present conditions. If Cleaner Production stated above is
implemented, the pretreatment stage for SS removal will not be needed, and the
capacity of SS dehydration equipment can be reduced.

P-48
1. Flow Sheet
2. Layout
40m
5m 8m 15m 12m
Sedimentation Tank
15m 12m
3m
Area = 600 ㎡
Figure 2 Wastewater Treatment
6 Recommendations
6.1 Short Term Countermeasures
The following items are recommended for short term countermeasures:
(1) Promote7S activities;
(2) Remove piled up raw material, as well as bubbles from the wire cylinder, by
installing shower pipes;
(3) Strengthen dust removal measures;
(4) Install a white water collection machine for each paper machine;
(5) Install activated sludge treatment equipment;
(6) Promote a realistic treatment for used paper, and maintain and efficiently
use the de-inking plant.
The total estimated costs for the above recommendations: 7.5 billion VND
water Remov
al of SS
untreated
water
tank
Biological
treatmentWastewater
SS
dehydration
SS
Sedimentation
tank
Biological treatment
tank
untreated
water tank
SS Remove SS dehydration

P-49
6.2 Mid- term Countermeasures
The following items are recommended for mid-term countermeasures:
(1) Use heated water for the showering process;
(2) Heat up wet paper with steam;
(3) Promote a realistic treatment for used paper, and maintain and efficiently
use the de-inking plant.
The total estimated costs for mid-term countermeasures: 1.5 billion VND
6.3 Long-term Countermeasures
The items stated above and the following profitable countermeasures should
be implemented using Cleaner Production as much as possible. End of Pipe
should be implemented to the minimum degree required:
(1) Change to high efficiency pumps;
(2) Promote good maintenance and efficiency for realistic treatment facilities
for used paper.
The total estimated costs for long term countermeasures:1.5 billion VND

P-50

P-51
Case Study P-04
Bac Giang Exporting Paper Company
Survey Date:13 December 1999
9 & 10 March 2000
1 General
1.1 Company Profile
This factory used to belong to the Ha Bac Factory. When Ha Bac Province
was divided into Bac Ninh and Bac Giang Provinces, it was re-established as the
Bac Giang Exporting Paper Company in 1997. Besides a paper mill, this company
has a printing factory and a bamboo chopstick factory, and the total number of
employees is 171. These two factories account for 61 out of the 171 employees.
The company profile is shown in Table 1.
Table 1 Company Profile
Company Name Bac Giang Exporting Paper Company
Ownership Local Government(Bac Giang province) Address My Do- Bac Giang Province Telephone Establishment 1997 Number of Employees 110 ( 3 shifts,365 working days) Main Products
1.2 Environmental Management
As shown in Figure 1, the technology department controls all three factories,
including quality and environmental management.
Number of staff: 171 people/shift. Includes: Staff 9 (4 of 9 have Bachelor degrees) Mechanical workers: 6 Female workers: 63
Figure 1 Organization
Managers
Organization Technology Economic
Paper Factory Printing Factory
Round Bamboo Chopsticks Factory

P-52
1.3 Business Outline
Using bamboo chips as raw material, special high quality, yellowish pulp with
a high KN value is produced by using a cold soda method. Using this pulp, thick
and porous special paper is produced through a paper machine, and the paper is
processed to Buddhist ceremonial bill after being printed and cut. The final
products are exported to Taiwan. Table 2 shows the company’s production and
sales in 1998.
Table 2 Production and Sales (1998)
PRODUCTS (1998)
PRODUCTION (ton/year)
TURNOVER (million VND)
Ceremonial Offering Paper Designed capacity
Real production
1,350 1,000
4,200
2 Production Technology
2.1 Production Process
The production flow is shown in Figure 2. The factory is a small scale factory
that consist of five chemical dipping tanks, one beater which is used as a washer,
and one paper machine.
2.1.1 Pulping Process
(1) Soaking
For pulping, 35 tons of bamboo chips are put into a 100 m3 chemical dipping
tank, which is made of concrete, and then soaked in caustic soda liquid. The
pulping cycle is set at 7 days as follows:
・ Chip:1day
・ Soaking in caustic soda liquid:4days
・ Washing:2days
It was noticed that some tanks had been left for 3 or more days. Because
chips are soaked in highly alkaline liquid for long time at a normal temperature,
water-soluble chemicals such as pentosan and hemicellulose dissolve.
Consequently, this causes low pulp yield less than 50 %, although the KN is high.
Caustic soda is added at the ratio of 8.0 %. Washing using water at a normal
temperature is being carried out for two cycles, which take an entire day for each
complete cycle.

P-53
(2) Crushing Process
The factory uses a simple shredder and beater for the crushing process.
Figure 2 Production Flow
2.1.2 Paper Production Process
A hot blast from the cylinder mold and oil burner is blown into the dryer
furnace directly, and SO2 gas, created by burning sulfur powder, is blown into as
well at the secondary stage. There were big holes in the paper because the speed
adjustment of a drive role was not steady.
Solid waste, dust and noise
Black waste water
SO2, S, temp, Water evaporation
pumping
Thuong river
Bamboo
Soda solution
Cutting machine
Saturation with NaOH: 98% during 5-7days
Dilution washing with H2O: twice, during 48h.00
Rough Milling by club machine
Mixing tank
Pure Milling by a Plate machine
Paper machine
Paper machine
Rolling machine
Pure Milling by Holland
Thuong River water
P-54
2.1.3 Printing, Cutting, and Packing
The cutting and packing processes are manually operated.
2.2 Production Equipment
Table 3 shows the main production equipment.

P-55
Tab
le-3
T
he
Mai
n E
quip
men
t(1)
No
Eq
uip
men
t N
o R
ema
rk
Da
te o
f p
rod
uct
ion
m
ad
e
Da
te o
f p
rod
uct
ion
u
se
Ma
de
from
co
un
try
Ca
pa
city
or
spec
ial
tech
nol
ogic
al
rem
ark
M
ain
te
chn
olog
ical
T
ech
nol
ogic
al
spee
d (
v/p
) U
se
Y/N
1 W
ater
su
ppli
ed
pum
p 1
19
95
1996
Ja
pan
37
m3/
b fo
r 7.
2 H
P
Ave
rage
38
0-29
00
Y
2 W
ater
su
ppli
ed
pum
p 2
19
95
1996
Ja
pan
25
m3/
b fo
r 5.
5 H
P
Ave
rage
38
0-29
00
Y
3 W
aste
Wat
er
pum
p 1
SM
:952
3 19
87
1996
V
ietn
am
50 m
3/b
for
PH
hig
h 2
5 an
d 15
kW
A
vera
ge
380-
1450
Y
4 W
aste
Wat
er
pum
p 2
SM
:954
9 19
96
1996
V
ietn
am
45 m
3/b
for
PH
hig
h 3
1 an
d 7.
5 k
W
Ave
rage
38
0-29
70
Y
5 B
ambo
o cu
t m
ach
ine
19
94
1996
T
aiw
an
3.5
ton
/hr,
600
v/p
an
d 50
HP
A
vera
ge
380-
1460
Y
6 S
mal
l bu
tch
er
19
94
1996
V
ietn
am
200
to 2
50 k
g; N
= 2
.8 k
W
Ave
rage
38
0-14
50
Y
7 R
ough
mil
lin
g
1995
19
96
Tai
wan
1
to 3
t/h
r A
vera
ge
40 H
P-1
460
Y
8 H
olla
nd
mil
lin
g
1995
19
96
Tai
wan
D
xRxC
=
5080
mm
x104
0mm
x104
0 m
m
Ave
rage
40
HP
-146
0 Y
9 M
ixin
g m
ach
ine
19
94
1996
C
hin
a 5t
/hr
Ave
rage
3H
P-1
460
Y
10
Was
hin
g m
ach
ine
19
96
1996
C
hin
a P
si =
50
kg/
cm3
Ave
rage
1H
P
Y
11
Mat
eria
l pu
mp
1
1995
19
96
Tai
wan
5
HP
A
vera
ge
220
V/3
80-
1430
Y
12
Mat
eria
l pu
mp
2
1995
19
96
Tai
wan
5
HP
A
vera
ge
220
V/3
80-
1430
Y
13
Pre
sser
pu
mp
19
95
1996
T
aiw
an
HZ
= 5
0 to
60
mm
A
vera
ge
1200
-120
15
00-1
50
Y
14
Pap
er m
ach
ine
19
95
1996
T
aiw
an
R=
1000
mm
; ϕ=
1100
mm
A
vera
ge
N=
29 H
P-
220/
380
Y
15
Pla
te m
illi
ng
mac
hin
e
1995
19
96
Tai
wan
L
=27
5 m
m, R
=10
00 m
m a
nd
H=
1150
mm
A
vera
ge
Y
16
Hea
ter
19
95
1996
T
aiw
an
Hea
ter
wit
h 5
lev
els;
R=
1040
m
m, T
=15
.875
mm
A
vera
ge
N=
16 H
P
17
Cu
ttin
g m
ach
ine
19
95
1996
T
aiw
an
A
vera
ge
380-
1 H
P.1
390
N
18
Par
kin
g m
ach
ine
19
94
1996
T
aiw
an
Psi
=15
0 k
g/cm
3 A
vera
ge
380-
1 h
P15
00
N

P-56
T
able
-3
Th
e M
ain
Equ
ipm
ent(
2)
N
o E
qu
ipm
ent
No
Rem
ark
D
ate
of
pro
du
ctio
n
ma
de
Da
te o
f p
rod
uct
ion
u
se
Ma
de
from
co
un
try
Ca
pa
city
or
spec
ial
tech
nol
ogic
al
rem
ark
M
ain
te
chn
olog
ica
l
Tec
hn
olog
ica
l sp
eed
(v/
p)
Use
Y
/N
19
Rol
lin
g m
ach
ine
19
96
1996
V
ietn
am
ϕ=92
0 m
m, R
=87
0 m
m
Ave
rage
50
-60
Hz
500
to 1
50
Y
20
En
ergy
1995
19
96
Vie
tnam
40
0 k
VA
-3 F
a-50
Hz
Ave
rage
Y
21
Pri
nte
d fa
ctor
y
Ave
rage
22
19
97
1999
T
aiw
an
N=
2.2
HP
A
vera
ge
380-
1460
Y
23
P
rin
ter
mac
hin
e
1997
19
99
Tai
wan
N
=5
HP
A
vera
ge
380-
1450
Y
24
P
arki
ng
mac
hin
e
1995
19
99
Tai
wan
N
=1/
3 H
P
Ave
rage
22
0-14
20
Y
25
Par
kin
g m
ach
ine
19
95
1999
T
aiw
an
N=
1/3
HP
A
vera
ge
220-
1450
Y

P-57
3 Management Technology
3.1 Management of Business Targets
It is assumed that budgets and business goals are set and managed in the
company. However, no program was recognized to promote a thorough
understanding of employees on the management goals.
3.2 Unit Consumption and Expenses
Table 4 shows unit consumption and expenses in 1998.
Table 4 Unit Consumption and Expenses
USED MATERIAL (ton)
QUANTITY EXPENSES (VND)
1. Bamboo 2. NaOH concentration 3. Oil 4. Sulfur 5. Water 6. FO oil 7. Electric power (kWh)
2,620 t/year 210 t/year
1,000 /year 13,500 t/year
23,000 m3/year 264 t/year
400,000 kWh
838,400,000 735,000,000
9,000,000 32,400,000 23,000,000
475,200,000 320,000,000
Total
3.3 Financial Status
Investment: 300,000 US$
Bank Loans: 200,000 US$
National Loans: 100,000 US$
4 Industrial Wastewater Treatment and Discharge
Wastewater is discharged in the nighttime because the factory switched its
operation mode in 2000 to a night operation that utilizes electricity of a cheaper
nighttime rate.
Black wastewater from the pulping process is discharged to an excavated pond,
and then discharged without treatment to a river at night. The specific gravity of
wastewater sometimes reaches around 1.05. Since residents in the vicinity use
well water for drinking, it is worried that this drinking water may be contaminated
with the wastewater. Moreover, a settler made of concrete should be installed
because the wastewater contains mercury.
A large amount of excess water containing a lot of high quality fine fiber is
discharged from the paper machine.

P-58
Figure 3 shows the wastewater system of the factory.
Figure 3 Wastewater System
4.1 Wastewater Analysis in December 1999
Samples were taken on 13 December 1999 at sampling points shown in Figure
3, and the analysis results are shown in Table 5.
Fresh water23,000 m3/y
Raw materialdumping
(use NaOH)
Rough milling(stick milling)
Pure milling(halan milling)
Plate milling(without moving)
Bamboocutting
Waste water tank
Papermachine
Drying(use FO oil)
Roll upproduct
Thuong river
Stiring tank(pumping)
⑧
⑦
⑨
⑥
⑩

P-59
Table 5 Results of Wastewater Analysis
13 December 1999
Sampling No Unit 6 7 8 9 10
Temp ℃ 22.5 22.3 22 20.1 19.1
PH 10.6 11.42 11.43 7.73 8.55
Elec. Conductivity μS/cm 24500 462 487 239.8 4784
Turbidity NTU 444 216 132 9.6
Oil content mg/l 0 Trace
BOD mg/l 58.96
COD mg/l 21020 12135 10780 5120 120
DO mg/l 5.1 5.2 1.01 4.75
VSS mg/l 1084 553.5 167 119.6 8
TSS mg/l 148.5 11.4
Total nitrogen mg/l 21.72 3.54
Residual Chlorine mg/l 2.14 trace trace Trace 1.07
SO4 2- mg/l 6286 114.8 92.6 47.6 22
Cyanogen mg/l 0.02 Trace
Phenol mg/l 0.32 0.05
Na mg/l 292 241 246 297 229
CaCO3 mg/l 123 112 248 161 89
Cu mg/l 0.26 0.14
Pb mg/l 0.027 trace
Cd mg/l 0.007 0.002
Ni mg/l 0.623 trace
Cr(VI) mg/l 0.086 trace
Zn mg/l
Salt % 0.1 0.09 0.21 0
4.2 Wastewater Analysis in March 2000
4.2.1 Samples taken before and after wastewater discharge
Samples were taken on 9 March 2000 at the same points as in December 1999,
except for sampling point ⑦, and the analysis results are shown in Table 6.

P-60
Table 6 Results of Wastewater Analysis in March 2000
Sample No Unit 6 8 9 10
Temp ℃ 22.7 24.2 22.6 21.9
PH 12.35 8.93 8.2 7.66
Elec. Conductivity μS/cm 15.4 0.431 4.99 0.219
Turbidity NTU 78 613 100 22
Oil content mg/l 0.12 trace trace 0
BOD mg/l 1340 129
COD mg/l 18120 11010 5320 358
DO mg/l 0.18 5.12 0.05 3.05
VSS mg/l 168 407 164 4.9
TSS mg/l 223 648 218 8.2
Total nitrogen mg/l 32.7 21.4 37.4 2.89
Residual Chlorine mg/l 1.86 trace 0.25 trace
SO4 2- mg/l 100 80 140 34
Cyanogen mg/l 0.045 0.031 0.02 not detec.
Phenol mg/l 0.38 0.72 0.51 0.05
Na mg/l 262 218 3520 39
CaCO3 mgeq/l 128 263 5
Pb mg/l <0.001 0.041 0.04 <.0001
Cd mg/l <0.001 <0.001 0.003 0.001
Hg mg/l <0.001 <0.001 0.58 trace
Cr(VI) mg/l <0.01 <0.01 0.02 trace
Zn mg/l 0.3 0.2 0.47 0.21
Ni mg/l <0.01 <0.01 0.019 trace
0.58 mg/l of Mercury was detected in the wastewater in March 2000. It is
assumed that caustic soda contains mercury.
4.2.2 Sampling at the Alkaline Penetration Process and Paper Machine
Samples were taken at the following 9 points for wastewater discharged from
the chipping process and paper process. Caustic soda was analyzed in order to
find out if it contains mercury or not. The analysis results are shown in Table 7.
Sampling Points N1- 7 days Chiping N6- Before Pulp Chest N2- 4 days Chiping N7- After Mixing Chest N3- 7 days Chiping N8- To Mixing Chest N4- 10 days Chiping N9- From Wire Cylinder N5- Wastewater Pit NaOH- Caustic Soda

P-61
Table 7 Analysis Results of Wastewater
from the Chipping Process and Paper Machines
10 March 2000
Sample No Unit 1 2 3 4 5 6 Ash mg/l 40 120 280 250 46;14* 176 TSS mg/l 155 590 910 655 155;39* 900
Phenol mg/l 0.33 Pb mg/kg Cd mg/kg Hg mg/kg
Cr(total) mg/kg Zn mg/l SW 1.03 1.1 1.07 1.06 1.02 1.005
t ℃ 23.3 23.2 23.2 23.2 23.2 23.2 K mg/l
NaOH mg/l 3080 20590 14520 15500 0 Cl- Al mg/l
Sample No Unit 7 7* 8 9 9* 10 NaOH
Ash mg/l 250 87* 140 260 95* 28;16* TSS mg/l 450 181* 475 650 196* 150;28* 0
Phenol mg/l not det. Pb mg/kg 5.56 Cd mg/kg 0.988 Hg mg/kg 29
Cr(total) mg/kg 2.04 Zn mg/l 119g/T SW 1.01 1.01 1.01 1
t ℃ 23.2 23.2 23.2 23.2 K mg/l 372g/T
NaOH mg/l 0* 0* 0 76.80% Cl- 1.58% Al mg/l <0.01
5 Countermeasures for Industrial Pollution Prevention
5.1 Present Problems
The following 5 items are the main problems the company is facing at present:
(1) Size of chips;
(2) Piping for chemicals at the penetration tanks;
(3) Wastewater from the pulping process and paper process;
(4) Drive of paper machines;
(5) Wastewater containing Mercury;
(6) Use of SO2 gas.

P-62
5.1.1 Chip size
The utilization of large size chips brings about bad effects such as high
chemicals consumption, long cooking time, and low pulp yield.
5.1.2 Chemical Spraying Hoses for the Impregnation Tank
Although the tank capacity is large, about 100 m3, it is not equipped with
piping for chemical spraying. Chemicals do not penetrate through chips evenly
and effectively because at present they are sprayed with hoses.
5.1.3 Discharged Wastewater from the Pulping Process
It is usual practice for a paper factory to recover chemicals from wastewater
from the pulping process. However, the factory currently discharges wastewater
without treatment. The factory will have to stop operation in the near future due
to violation of environmental regulations in Viet Nam, unless they adopt
wastewater treatment methods, even very simple ones.
5.1.4 Wastewater from the Paper Machine
Wastewater from the paper machine contains a large amount of high quality
fine fiber, which is not recovered at present.
5.1.5 Operation Adjustment of the Paper Machine
Because the paper machine operation is not adjusted well, paper becomes loose
around the roller causing the machine bit to make holes in the paper.
5.1.6 Mercury in NaOH
The mercury concentration in wastewater was 0,.58 mg/l, 116 times higher
than the regulation standard. This is due to the fact that NaOH purchased
contains 29 mg/l of mercury. It is possible that mercury is flowing into drinking
water for the residents in the neighborhood through wastewater.
5.1.7 Use of SO2 Gas
SO2 gas is created by burning sulfur powder and blown into a dryer hood. It
is assumed that SO2 blowing is adopted for color fixing purpose. However, it may
cause health problems for human beings and the environment.

P-63
5.2 Countermeasures for Production Technology
5.2.1 Changing Chip Size and Piping for Chemical Spraying
If the chip size is controlled adequately and a piping system is installed for
sufficiently spraying chemicals, the smearing time will be made shorter, and the
wastewater load will decrease because the yield will be improved.
5.2.2 Collection of Pulp Wastewater Using Simple Equipment
Because the scale of the factory is not so large, the company should study such
measures that the company, after concentrating its wastewater, request an outside
large scaled factory to treat it to recover chemicals.
There are cases like this in Japan, and it can be managed as wastewater
contains NaOH and energy resources, sell the wastewater more than shipping cost,
or bring back NaOH with return car for the black liquor.
5.2.3 Install Corn Shaped Settlers Made of Concrete
In order to recover raw materials lost in wastewater, it is recommended that
the company install settlers made of concrete for the excess white water and black
liquor from the paper machine. Figure 4 shows a conceptual flow around a settler.
Two settlers for excess white water and black liquor: 30 m3 each
Figure 4 View of the Settler
5.2.4 Change to an SO2 Liquid Solution with a Dryer
Install an absorber and change SO2 gas to SO2 liquid. In this case, it is
important to prevent SO3 from being generated.
Screen
To Paper Machine

P-64
5.3 Wastewater Treatment System
5.3.1 Design Basis
The total amount of water used in the factory is 23,000 m3/year, so the factory
should treat the corresponding amount of wastewater. A conceptual design of a
wastewater treatment system was carried out using the results of the wastewater
analysis of samples taken at the wastewater discharge points.
5.3.2 Conceptual Design
Figure 5 shows the wastewater treatment process and equipment layout.
This equipment is designed only for treatment that incorporates End of Pipe
methods under present conditions. If the Cleaner Production stated above is
implemented, the scale will be reduced to one third of this design.
1. Flow sheet
2. Layout
23m
2m 2m 15m 4m
5m 4m
1m
Area=115m2
Figure 5 Wastewater Treatment
Biological Treatment
Water tank
Raw Water
Water
Tank
Biological
treatment Discharge
SS dehydrationSS
Sedimentation
tank
SS removal SS dehydration
Sedimentation
tank
Removal
of SS

P-65
6 Recommendations
6.1 Short Term Countermeasures
The following items are recommended for short term countermeasures:
(1) Promote 7S activities;
(2) Change the size of raw material chips to a more suitable size;
(3) Remove piled up raw material, as well as bubbles from the wire cylinder,
by installing a shower piping system;
(4) Use NaOH that contains a low concentration of mercury;
(5) Install an absorber in order to use SO2 liquid instead of SO2 gas.
The total estimated costs for the countermeasures: 0.8 billion VND
6.2 Mid-term Countermeasures
The following are recommended for mid term countermeasures:
(1) Strengthen the pollutant collection system;
(2) Establish a collection and recycle system of white water for each paper
machine;
(3) Use warm water for the showering process;
(4) Dry wet paper with superheated steam.
The total estimated costs for mid-term countermeasures: 1.5 billion VND
6.3 Long-term Countermeasures
The following items are recommended as long term countermeasures:
(1) Make the best use of the collection and recycling system for cooking liquor;
(2) Collect steam used for cooking;
(3) Collect and reuse wastewater from each process;
(4) Use heated water for the showering process;
(5) Establish a collection system for chemicals;
(6) Promote a realistic treatment for used paper, and maintain and efficiently
use the de-inking plant.
The total estimated costs for long term countermeasures: 3.3 billion VND
The Survey Team proposes that profitable Cleaner Production
countermeasures be implemented as much as possible, and that End of Pipe be
implemented to the minimum degree required.

P-66
6.4 Proposals for Implementation
At present, the company is in a situation where they cannot afford to repair or
maintain broken equipment and machines. Once they have the necessary funds
for investment, considering its necessity and validity, Cleaner Production should be
implemented.
The following are important items to consider when selecting equipment:
(1) Select equipment taking into consideration energy saving effects;
(2) Select the best material taking into consideration the life cycle of the
equipment;
(3) Choose equipment that is easy to maintain;
(4) Prepare the minimum amount of spare parts necessary;
(5) Set a budget for the new machines and include costs for follow up measures
after operations begin.
Furthermore, because this factory is a small-scale factory which produces
about 1,000 t /year, it is difficult to install a recovery boiler and caustification
equipment. In stead of installing this equipment, they should start implementing
measures only for collecting wastewater and concentrating the black liquor, and
make a deal with a nearby factory that has equipment for treatment.

P-67
Case Study P-05
Hai Phong Joint Stock Paper Company
Survey Date:14 December 1999
13 & 14 March 2000
1 General
1.1 Company Profile
This factory was established in 1960, and was privatized on 1 November 1999.
The company has 2 other factories in Yen bai and Lao cai, and one more factory will
be built in 2001.
The company profile is shown in Table 1.
Table 1 Company Profile
Name of the Company Hai Phong Joint Stock Paper Company
Ownership Private Address 44A Ton Duc Thang Road Hai Phong Telephone Tel: 0311835369/Fax: 0311835462
Establishment 1960 Number of employees 603 ( 3 shifts,7days operation/week) The main Products
1.2 Environmental Management
The environmental management department is composed of one manager and
nine staffs. Actually, the president of the company, a doctor of economics, also
manages the technology.
1.3 Business Status
The factory possesses 10 paper machines and produces 15,000 tons/year of
paper, which is exported to Taiwan for Buddhist religious ceremony use, and 1,000
tons/year of toilet paper.
Table 2 shows production and sales.
Table 2 Production and Sales
PRODUCTS PRODUCTION (ton/year)
TURNOVER (million VND )
Ceremonial Paper Toilet Paper
14,000 1,000
55,000 8,000
Total 15,000 63,000

P-68
2 Production Technology
2.1 Production Process
Figure 1 shows a block flow diagram of the entire factory.
Wat
er S
trea
m
Wat
er m
ille
dpa
per
Pap
er m
ach
ine
Pap
er p
rodu
cts
Was
te w
ater
Q=
200
m3/
day
Was
te w
ater
Q=
750
m3/
day
Fib
er b
oard
prod
uct
ion
Con
cen
trat
ion
Wat
er d
um
pin
g(a
fter
5 d
ays)
Ban
boo
Cu
ttin
g
Fre
sh w
ater
Du
mpi
ng
PM
PM
PM
PM
PM
PM
Pri
nti
ng
Pap
er p
rodu
cts
Was
te w
ater
Q=
1,00
0 m
3/da
y
⑩
⑥
⑧⑦
⑨
⑨
Fig
ure
1 B
lock
Flo
w D
iagr
am o
f th
e F
acto
ry

P-69
2.1.1 Bamboo Pulp Production Process
There are 12 NaOH saturation tanks which are 80 m3 and 100 m3 in size,
and each tank has the following 7 day impregnation cycle:
SATURATION CYCLE OR THE NUMBER OF DAYS REQUIRED FOR SATURATION AFTER THE CHIPS ARE FILLED IN TANKS
1. Chip feed 40 tons of raw material (or 32 t/tank) is filled into the 100 m3 tank (or 80m3.) This process takes 1 day.
2. NaOH feed: NaOH of an amount equal to 75% of raw materials is used. That means 3 t (or 2.4 t NaOH/tank) The volume of H2O added: 20 m3: This process takes about 7 days
3. Removal After 7 days, black liquid of soda solution is removed and transferred to a collection tank. 12 evaporation tanks are used to concentrate this solution from 7 be’ to 18 be’. The temperature is always maintained at 78℃ or lower.
4. Washing About 40 m3 of fresh water is filled into the saturation tank and is maintained for about 1 day because the washing process is carried out two times.
5. Washing water is pumped to the river
2.1.2 Paper Production Process
Bamboo pulp, used to make ceremonial paper for export to Taiwan, is produced
by seven paper machines, and the process is shown in Figure 2.
Tissue paper, which is made from high quality waste paper that is dissolved by
milling, is produced with three paper machines as is shown in Figure 3.
c
1. Rough milling 5. Diluted tanks 2. Holland style milling 6. Paper machine 3. Plate milling 7. Heater machine 4. Pulp tank 8. Parking machine
Figure 2 Paper Production Process Flow from Bamboo Pulp
4
3
8
1 2
6
7
5

P-70
1. Holland style milling (Made in Vietnam) 3. Paper machine (Made in China) 2. Pulp tank 4, 5. Paper machine (Made in Vietnam)
Figure 3 Process Flow for Tissue Paper Production
3 Management Technology
3.1 Management of Business Targets
The factory was privatized in November 1999. Maintenance and cleanliness
of the factory had improved by March 2000 compared to the conditions observed in
November 1999. It is assumed that employees understand the management
policy.
3.2 Unit Consumption and Expenses
Unit consumption and expenses for each product were analyzed as shown in
Table 3.
Expenses include salaries, and by dividing the total expense for salaries by 238,
the number of employees, gives the average annual salary, which is about 7.9
million VND.
1 3
5
4
2
1 1
2
1 1
1 1
1

P-71
Table 3 Unit Consumption and Expenses
USED MATERIAL QUANTITY (ton/year)
Cost (VN Dong)
EXPENSES (VN Dong)
I-Ceremonial paper production
Bamboo NaOH Sulfur FO oil
20,000 4,000 4,500
50
300,000 VND/t
3500,000 VND/t 1850,000 VND/t 2000,000 VND/t
6,000,000
14,000,000 83,250,000
100,000,000
II- Toilet paper 1. Waste paper (ton) 2. Coal
1,300
900
5000,000 VND/t 350,000 VND/t
6,500,000
315,000,000 III- General use
River water (m3) Electric power (kWh)
301,000m3
342,000 kWh
500 VND/m3
930 VND/t
150,500,000 318,060,000
Total
3.3 Financial Status
Investment: 3 million US$
Bank Loans: none
4 Industrial Wastewater Treatment and Discharge
4.1 Industrial Wastewater
The unit consumption amount of water is about 20 times higher than that of
the paper production, which is relatively small, and part of the black liquor is
concentrated and sold.
Most of the factory wastewater is wastewater from the pulping process and
surplus wastewater from each paper machine. The concentration of useful fiber in
wastewater is less than 500 mg/l, a relatively small figure. After the final
treatment, where SS is removed in a sedimentation pond, wastewater is discharged.
The value of COD in wastewater sometimes measures less than 3,000 mg/l, and
sometimes measures more than 6,000 mg/l, even after treatment. While Mercury
was not found in wastewater in December 1999, high mercury values, 0.65 and
0.68 mg/l, were recorded in March 2000. This means the factory should switch
caustic soda they are using now back to the previous type they used that contains a
low concentration of mercury.
4.1.1 Wastewater Investigation in December 1999
Sampling was carried out on 14 December 1999 at sampling points shown in
Figure 1, and the results of analysis are shown in Table 4.

P-72
Table 4 Wastewater Analysis Results in December 1999
14 December 1999 Sampling No Unit 6 7 8 9 10
Temp ℃ 20 19.6 20.1 19
pH 10.94 9.13 7.68 8.91 7.63
Elec. Conductivity ΜS/cm 30500 1519.7 1766.7 1459.8 1824.8 Turbidity NTU 191 237 232 16
Oil content mg/l 0 Trace BOD mg/l 355.1 43.35
COD mg/l 31208 6130 3050 2680 51.5 DO mg/l 2.1 4.53 4.73 4.3 1.21
Ash content mg/l 28760 60 100 120 10 TSS mg/l 257 19.5
Total nitrogen mg/l 19.8 12.7 Residual Chlorine mg/l 3.55 Trace Trace Trace Trace
SO4 2- mg/l 4823 306 354.8 416.2 48 S2- mg/l
Cyanogen mg/l 0.01 Trace Phenol mg/l 0.28 0.042
Na mg/l 282 130 238 284 217 CaCO3 mg/l 116 106 158 151 76
Cu mg/l 0.23 0.11 Pb mg/l trace trace
Cd mg/l trace trace Hg mg/l trace trace
Cr(VI) mg/l 0.021 trace Zn mg/l
Salt % 0.02 0.02 0.02 0.02
4.1.2 Wastewater Analysis in March 2000
(1) Wastewater Sampling before and after Treatment
Wastewater samples were taken on 13 March 2000 at the same points as in
December 1999. The results of analysis are shown in Table 5.

P-73
Table 5 Wastewater Analysis Results in March 2000
13 March 2000 Sampling No 8 9 10
Temp ℃ 22.7 22.1 20.6
PH 8.42 10.51 8.4
Elec. Conductivity μS/cm 723 131 669 Turbidity NTU 216 333 10
Oil content mg/l trace trace not detec. BOD mg/l 476 906 192
COD mg/l 926 2850 465 DO mg/l 4.91 5.09 0.06
Ash mg/l 113 201 13.5 TSS mg/l 246 392 29
Total nitrogen mg/l 31.4 38.5 16.7 Residual Chlorine mg/l 0.92 2 trace
SO4 2- mg/l 83.25 4.34 52 S2- mg/l
Cyanogen mg/l 0.01 0.015 0.01 Phenol mg/l 0.12 0.3 0.03
Na mg/l 282 318 146 CaCO3 mgeq/l 185 177 64
Cu mg/l 0.62 0.31 0.12 Pb mg/l 0.08 0.04 trace
Cd mg/l 0.009 0.004 trace Hg mg/l 0.31 0.65 0.002
Cr(VI) mg/l 0.03 0.02 trace Zn mg/l 1.28 0.33 0.1
Salt %
(2) Sampling of Black Liquor
The following samples were taken on 13 March 2000 at the following points.
The results of Black Liquor analysis are shown in Table 6. N.1- #5Pit 1 Day Saturation N.2- #1Pit 2 Days Saturation N.3- #7Pit 3 Days Saturation N.4- #2Pit 4 Days Saturation N.5- #4Pit 5 Days Saturation N.6- Wastewater Tank N.7- After evaporation (*) - Filtrated sample

P-74
Table 6 Results of Black Liquor Analysis
13 March 2000 Sampling No Day 1 2 3 4 5 6 7
Ash mg/l 160 190 140 140 90 130 250 Ash filtrated mg/l 120 * 130 * 80 * 70 * 20 * 60 * 140 *
TSS mg/l 800 845 760 592 300 560 1350 TSS filtrated mg/l 575 * 582 * 456* 381* 220* 384* 1020*
Phenol mg/l 1.12* 8* 8.2* Na mg/l 282* 291* 298* SW 1.1 1.1 1.1 1.1 1.01 1.08 1.09
t ℃ 23.6 23.8 23.7 23.6 23.4 23.4 23.4 K mg/l 1.1* 1.22* 1.25*
NaOH mg/l 0 23940 26310 Cl- mg/l 1,420 5,325 5,751 Mg mg/l 44 225 240
C2H2O4 mg/l 2.46+/-0.1 28.86+/-0.1 29.75+/-0.1
The values of each sample of TSS and Ash differed as is shown in Figure 4.
Figure 4 TSS and Ash Values
TSS Change of Impregnation
0
100
200
300
400
500
600
700
800
900
0 2 4 6
Day of Inpregnation
TSS m
g/l
Ash mg/l
TSS mg/l

P-75
(3) Sampling of Wastewater from the Washer and the Paper Machines
Sampling was carried out on 13 March 2000 at the following points. The
results of analysis are shown in Table 7.
Samples numbered 10,11,12,13, and 14, were analyzed in order to verify the
time dependency of wastewater quality from the washer. At the same time, NaOH
analysis was also conducted.
N10- Sampled at 10.00, Beater Washing N16- Stock of Inlet N11- Sampled at 11.00, Beater Washing N17- Over Flow from Wire Clinder N12- Sampled at 12.00, Beater Washing N18- White Water from Press N13- Sampled at 13.00, Beater Washing N19- Outlet After Wastewater Treatment N14- Sampled at 14.00, Beater Washing (*) – filtrated water sample N15- Stock to Wire Clinder
Table 7 Analysis Results for Wastewater from the Washer and Paper Mashines
14 March 2000
Unit 10 11 12 13 14 15 16 17 18 19 NaOH
BOD mg/l 3940 3160
COD mg/l 6,920 6,460
Ash mg/l 180 60 120 90 110 120 90 140 80 120
TSS mg/l 475 173 500 325 400 575 275 500 275 400
Phenol mg/l 2.7 2.16
Pb mg/l 0.035 13.11*
Cd mg/l trace 0.875*
Hg mg/l 0.68 45*
Cr(total) mg/l 0.01 2.04*
Zn mg/l 0.02 158g/T
SW 1.005 1.005 1.005 1.005 1.01 1.005 1.005 1.005 1.005 1.005
Temp. ℃ 23.3 23.4 23.3 23.3 23.3 23.3 23.4 23.4 23.4 23.4
K 0.82 117g/T
CHCl3 0.00623
+/-0.003
0.00656
+/-0.003
NaOH 0 0 0 0 0 0 0 0 0 0 87.66%
Cl- 350.5 1.21%
The results of analysis of samples numbered 10,11,12,13, and 14 are
summarized in Figure 5. Although a large amount of cold, clean water is used in
the four hour washing process, as shown in Figure 5, washing efficiency is low and
a large amount of useful fiber is lost, due to change in the specific gravity of
wastewater.

P-76
Figure 5 Change of SS in Wastewater during Washing
5 Industrial Pollution Prevention
5.1 Present Problems
For the time being, the following seven items are the major problematic issues
the company is facing:
(1) Wastewater contains mercury, of which the concentration value is more than a
hundred times that of the regulation standard;
(2) The size of bamboo chips is relatively large and saturation process is carried
out at a normal temperature. The chips are saturated in caustic soda solution
for five days, but 43.5% of chips do not get saturated;
(3) The majority of wastewater from the pulping process that shows high COD
concentration values, several thousand mg/l, is being discharged into the
general wastewater flow;
(4) Surplus white water from paper machines contains useful fibers, 1/2
concentration of raw material in Stock Inlet. However, it is discharged after
going through a sedimentation tank;
(5) Poor management of the paper machine driver causes damage to products;
(6) Although the quality of waste paper, which is the raw material for tissue paper,
is high, the products are covered with a lot of dust, and dirt, and have pinholes
in them;
(7) The factory generates SO2 gas by burning sulfur. From prospective of the
working environment and high cost of raw materials, the company should
consider stopping this method.
Ash & TSS Change
0
100
200
300
400
500
600
9 10 11 12 13 14 15
Time Hour
mg/
l
系列5
系列6

P-77
5.2 Countermeasures for Production Technology
5.2.1 Use NaOH of Low Mercury Content
It seems that NaOH quality has changed because mercury was not detected in
December 1999.
5.2.2 Use Appropriate Sized Chips, and Install a Piping System for Chemical
Spraying
If the chip size is changed and a piping system is installed around the pit, it is
expected that chips can be saturated evenly, the saturation time will be shortened,
more fiber will remain in the wastewater, and the wastewater load will decrease.
The wastewater should be reused in the next production cycle because the
amount of alkali remaining is at level of 2.5 %. If the wastewater is reused the
amount of NaOH can be decreased.
If the yield of pulp is improved from 43.5 % to 60 %, the COD in the discharged
wastewater will decrease by half as shown in the following calculation:
(56.5/43.5-40/60)/(56.5/43.5)=0.513
The total estimated costs for equipment(12 machines):
10 million Yen=1.3 billion VND
5.2.3 Install Settlers for Recovering White Liquor from Paper Machines
It is recommended to install settlers made of concrete in order to recover white
liquor from paper machines.
For the ceremonial paper production line: 150 m3
For the toilet paper production line: 20 m3
The total estimated costs of the equipment(4 sets)
:5 million Yen=0.6 billion VND
5.2.4 Equip Ceremonial Paper Machine Drivers with a Speed Control and
Adjustment Function
Drivers of Ceremonial Paper Machines should be equipped with a function for
controlling and adjusting their speed.
The total estimated costs for the equipment ( 7 machines)
:4 million Yen=0.5 billion VND

P-78
5.2.5 Strengthen the Dust Removal Capacity of the Waste Paper Equipment for
Tissue Paper
There is no dust removal feature in OCC equipment at present. It is
recommended that a Jonson Screen and a Centrifugal Cleaner be installed.
The total estimated costs for the equipment(2 lines)
:5 million Yen=0.7 billion VND
5.2.6 Change SO2 gas to SO2 Liquid
A total of 1,408 tons of sulfur was burned at the factory in 1999. If SO2 liquid
is used instead of gas, and assuming that the concentration of SO2 liquid is 2%, it is
found that only 141 tons of Sulfur is required and that a total of 1,267 t (SO2
Gas=2,534 t) of sulfur can be saved.
Profits made by saving sulfur=1,267*1,850,000 VND = 2.3 billion VND
The total estimated costs for the equipment (1 line: newly established)
:10 million Yen=1.3 billion VND
5.3 Benefit of Countermeasures
5.3.1 Necessary Costs
The total necessary costs for the implementation of items stated in 5.2.2 to
5.2.6 are as follows:
Estimated total costs: 34 million Yen=4.4 billion VND
5.4 Wastewater Treatment
5.4.1 Design Basis
The total amount of wastewater that requires treatment is 1,000 m3/day. The
analysis results of the wastewater samples taken at the final wastewater discharge
point of the factory were used as the design basis for a wastewater treatment
system.
5.4.2 Conceptual Design
Figure 6 shows wastewater treatment process and equipment layout chart.
This wastewater treatment equipment was designed only for the treatment of
wastewater under its current conditions. If the CP measures stated above are
implemented, the scale of equipment will shrink to about 1/3 of the designed.

P-79
1. Flow chart
2. Layout
65m
3m 9m 39m 10m 4m
Sedimentation tank
10m
Area=650 ㎡
Figure 6 Wastewater Treatment System
6 Recommendations
6.1 Short Term Recommendations
The following items are recommended as short-term countermeasures:
(1) Promote 7S activities;
(2) Change the size of raw material chips to a more suitable size;
(3) Remove piled up raw material, as well as bubbles from the wire cylinder, by
installing shower pipes;
(4) Use NaOH that contains a low concentration of mercury;
(5) Promote a realistic treatment for used paper and maintenance in the
de-inking plant.
The total costs for short term countermeasures: 4.4 billion VND
Untreated
Water
Biological treatment
tank
Removal
of SS
Untreat
ed
water
tank SS
Raw water
tank
Biological
treatment
Wastewater
SS
dehydratio
n
Sedimen
tation
SS Removal SS dehydration

P-80
6.2 Mid-term Recommendations
The following items are recommended for mid-term countermeasures:
(1) Strengthen the pollutant collection system;
(2) Establish a collection and recycling system of white water from each paper
machine;
(3) Use heated water for the showering process;
(4) Heat rolled paper with steam;
(5) Promote the use of a realistic treatment for used paper and efficiently use
the de-inking plant.
The total estimated costs for mid-term countermeasures: 8.3 billion VND
6.3 Long- term Recommendations
The following items are recommended as long-term countermeasures:
(1) Make the best use of the collection and recycling system for cooking liquor;
(2) Collect steam used for cooking;
(3) Collect and reuse wastewater from each process;
(4) Use heated water for the showering process;
(5) Establish a collection system for chemicals;
(6) Promote a realistic treatment and efficiently use of waste paper.
The total estimated costs for long-term countermeasures: 11.7 billion VND
The study team proposes that profitable Cleaner Production countermeasures
be implemented as much as possible, and that End of Pipe should be implemented
to the minimum degree required.
6.4 Proposals for Implementation
At present, the company is in a situation where they cannot afford to repair or
maintain broken equipment and machines. Once they have the necessary funds
for investment, considering its necessity and validity, CP should be implemented.
The following are important items to be considered for selecting equipment:
(1) Select equipment considering energy saving effects;
(2) Select the best material considering the life cycle of the equipment;
(3) Choose equipment that is easy to maintain;
(4) Prepare the minimum amount of spare parts necessary;
(5) Set budgets for new machines, including costs for following up after
operation begins.

P-81
Case Study P-06
Van Diem Paper Factory Survey date:22 November 1999
1. General
1.1 Company Profile
The Van Diem Paper Factory is a State-owned paper company. The Company
profile is shown in Table 1.
Table 1 Company Profile
Name Van Diem Paper Factory
Ownership State-owned
Address Phu Minh Phu Xuyen Ha Tay
TEL Tel:034854251-034854210/Fax: 034854251
Established
Number of employees 300 (3 shifts,300 working days)
Main Products
1.2 Business Status
Production and sales figures of the Company in 1998 are shown in Table 2.
The production capacity of the Company is now 3,400 ton/year, and the Company
has plans to raise production capacity by 40-50 tons/day in the year 2000.
Table 2 Production and Sales in 1998 Product Production
(ton/y) Turnover
(VND) Normal cartons 2,002 7,621,220,913 Bi-layered cartons 405 1,984,226,466 Colored cartons 415 2,103,847,700 Corrugated cartons 530 1,939,803,608 Packaging paper 48 97,278,000 Total 3,800 13,746,376,687
2. Production Technology
2.1 Process
The factory process flow chart is shown in Figure 1.
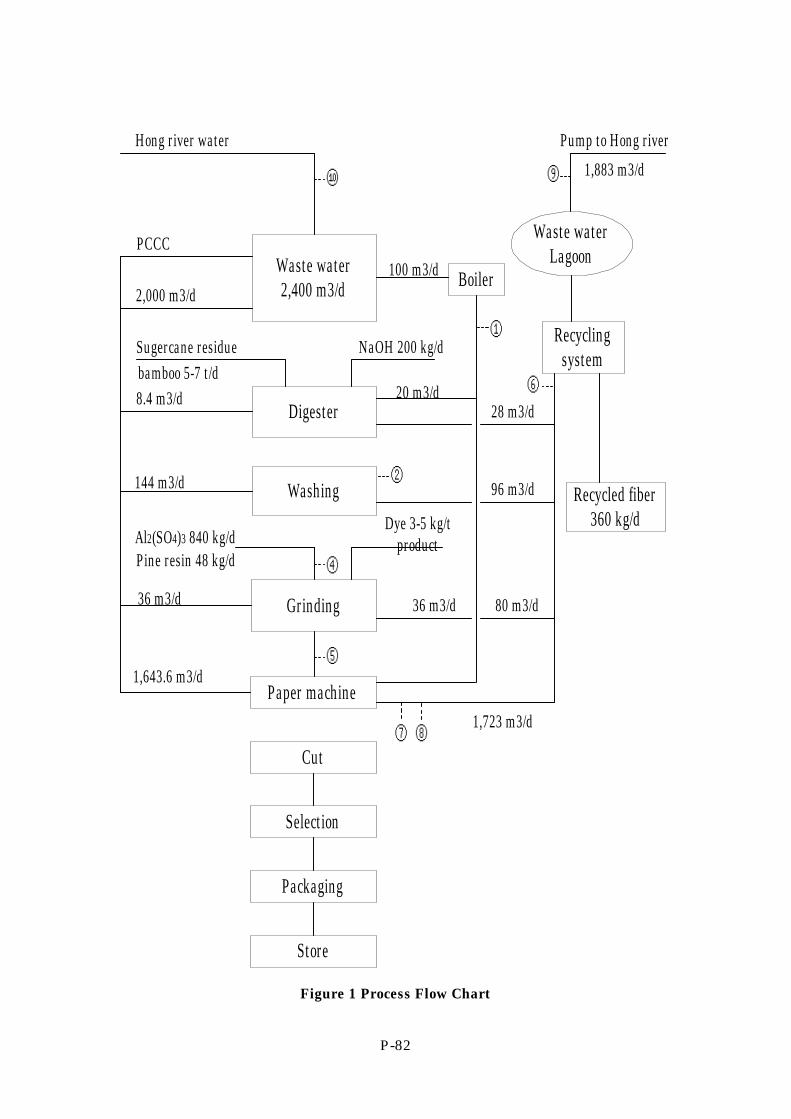
P-82
Waste water2,400 m3/d
Digester
⑦ ⑧
⑨
Hong river water
Washing
Grinding
Paper machine
Cut
Selection
Packaging
Store
PCCC
2,000 m3/d
Sugercane residuebamboo 5-7 t/d8.4 m3/d
144 m3/d
Al2(SO4)3 840 kg/dPine resin 48 kg/d
36 m3/d
1,643.6 m3/d
100 m3/d
NaOH 200 kg/d
20 m3/d
Dye 3-5 kg/tproduct
36 m3/d
Boiler
Recyclingsystem
Recycled fiber360 kg/d
Pump to Hong river
1,883 m3/d
Waste waterLagoon
28 m3/d
96 m3/d
80 m3/d
1,723 m3/d
⑩
①
⑥
②
④
⑤
Figure 1 Process Flow Chart

P-83
2.2 Unit Cost of Raw Materials
Unit cost of raw materials and utilities are shown in Table 3.
Table 3 Unit Cost of Raw Materials and Utilities
Raw material Unit Quantity Unit price
(VND) Expenses
million VND Black waste paper ton 2,800 1,300,000 3,640 White waste paper 44 5,200,000 228.8 White pulp 33 7,000,000 231 Bamboo chips 349 390,000 136 Bamboo powder 176 2,200,000 387.2 Bamboo flakes 222 330,000 73.26 Sugar cane 2,900 170,000 493 Al3(SO4)3 240 1,671,000 401 Pine resin 15 7,000,000 105 Carbonate (Na2 CO3) 2.2 Dye 1.547 75,000,000 116.025 Water m3 668,000 450 300.6 Coal ton 2,600 290,000 754 Electricity KWH/h 2,720,000 830 2,257.6 Total 9,123.485
3. Industrial Wastewater
Wastewater is generated at a rate of 668,000 t/day. The results of
wastewater analysis are shown in Table 4 (Sampling date: 22 November 1999).
4. Financial Status
Bank loan: 1,255,013,099 VND (as of 31 October 1999)
5. Recommendations
(1) The size of chips should be less than the size of a pack of cigarette, and they
should all be arranged in the same size.
(2) It would be better to install de-inking apparatus and use floatator, screens, and
cleaner on this apparatus to eliminate ink and sticky compounds. Through the
use of this method it will be possible to prevent the product quality deterioration
and paper break.
(3) It is necessary to prevent sticky compounds from attaching on the surface of the
dryer.
(4) It is necessary to adjust the angle of the “Doctor” and maintain it at about 30°.

P-84
(5) It is better to wash off sticky compounds from wire, rolls etc. using
high-pressure water. In order to conserve hot water, it is recommended that a
vibration apparatus for showering be used. Also to reduce the consumption of
water, fiber should be recover from each paper machine and the sticky
compounds should be removed. In order to collect fiber a concrete settler
should be installed, and also clean water should be re-covered.
(6) The diameter of the roll of the press should be enlarged in order to reduce the
content of water in the paper.
Table 4 The Results of Wastewater Analysis Sampling No Unit 1 2 3 4 5 6 7 8 9 10
Temp ℃ 25.7 25.2 25.8 25 24.4 25.2 23.9
pH 8.29 8.28 6.5 7.32 7.17 8.4
Electric Conductivity
μS/cm 1408 556 1120 906 256 513 496 394 167
Turbidity NTU 3696 1521 3893 2215 826 195 345 185 4.2
Oil content mg/l 0 0 0.07 0.03 0 0 0.01 trace 0
BOD mg/l 663.5 579.9 427.6 457.6 3846 219.6 264.8 165.9 205
COD mg/l 68320 15180 15420 15020 8160 638 716 430 980
DO mg/l 6.88 5.5 5.84 5.18 3.01 6.65
VSS mg/l 540 500 1320 650 315 89 121 115 2.5
TSS mg/l 36780 1560 3950 2250 850 215 369 229 5.3
Total Nitrogen mg/l
Residual Chlorine
mg/l 1024 9.217 trace trace 18.43 46.89 24.1 43.95 40.41
SO4 2- mg/l 326.2 182.4 387.1 401.2 86.4 128.3 173.6 134.7 71
S2- mg/l 0.13 0.68 0.09 0.15 0.9 0 0 0 0
Cyanogen mg/l trace trace
Phenol mg/l 0.495 0.365 0.33 0.31 0.263 0.083 0.068 0.052 0.035
Na mg/l 146 70 292 358
CaCO3 mgeq/l 134 125 117 200 117 250 355 164 83
Cu mg/l
Pb mg/l 0.025 0.037
Cd mg/l trace trace
Hg mg/l
Cr(VI) mg/l 0.12 trace
Zn mg/l 0.36 0.32
Salt % 0.02 0.01 0.02 0.02 0.01 0
P-85
Case Study P-07
Hoa Binh Paper Factory Survey Date:23 November 1999
1. General
1.1 Company Profile
Hoa Binh Paper Factory is a State owned paper company. The company
profile is shown in Table 1.
Table 1 Enterprise Profile
Name Hoa Binh paper factory
Type State-owned
Address Dan Hoa village ,Ky Son district,Hoa Binh province
TEL Tel:018842195
Established
Number of employees 180 (3 shifts, 300 working days)
Main Products
1.2 Business Status
Production and sales figures of the company in 1998 are shown in Table 2.
The production capacity of the Company is now 1,667 tons a year (2 line.)
The company has plans to raise production capacity by 2,000 tons more in the year
2000.
Table 2 Production and Sales in 1998
Product Production (tons)
Turn over (VND)
Paper 1,667 7,878,573,000
2. Production Technology
2.1 Process
A block flow diagram of the factory process is show in Figure 1.

P-86
Wat
erpu
mp
from
rive
r4,
000
m3/
d
Ch
ippi
ng
(12
t/d)
Indu
stri
alw
aterBam
boo
(12
t/d)
Dig
este
r, w
ash
4.2
t
Boi
ler
Coo
k p
ine
resi
n
Pin
e re
sin
& C
aCO
3
Ble
ach
ing
Ble
ach
ing
reag
ent
Pu
lp &
was
te p
aper
Al2
(SO
4)3
Pin
ere
sin
Gri
nd
(rou
gh)
Gri
nd
(fin
e)
Pap
er m
ach
ine
I &
II
7 t/
d
Rec
ordi
ng
tan
k
800
m3
300
m3
300
m3
2,40
0
①
⑩
②⑤ ⑦
⑧
⑨
Was
te w
ater
to
Da
100
m3
Fig
ure
1
Blo
ck F
low
Dia
gram
of
the
Fac
tory

P-87
2.2 Unit cost of Raw Materials
Unit consumption of raw materials and utilities are shown in Table 3.
Table 3 Unit Cost of Raw Materials and Utilities
Number Material Total consumption Total cost (VND)
1 Bamboo 2,101 t 559,007,000 2 NaOH 100,510 kg 356,264,000 3 Waste paper 1,324 T 1,764,450,000 4 Al2(SO4)3 52,790 kg 87,778,795 5 Pine Resin 14,173.5 kg 94,967,113 6 CaCO3 2,150 kg 4,265,100 7 Coal 1,418 m3 617,053,000 8 Electricity 1,193,610,000 9 Water 1,200,000 m3
3. Wastewater Treatment
The total amount of discharged wastewater from the factory is 1,200,000 t/year.
The factory use water from the river that they discharge wastewater. Table 4
shows the results of wastewater sample analysis.
4. Financial Status
Bank loan: 1,404,757,973 VND
5. Recommendations
① It would be better to install de-inking apparatus and use floatator, screens, and
cleaner on this apparatus to eliminate ink and sticky compounds. Through the
use of this method it will be possible to prevent product quality deterioration
and paper break.
② It is necessary to prevent sticky compound from attaching on the surface of the
dryer. Otherwise, it will cause the paper to break.
③ It is necessary to adjust the angle of the “Doctor” and maintain it at about 30
degrees.
④ It is better to wash off sticky compounds from wire, rolls etc. using high
pressure water. In order to conserve hot water, it is recommended that a
sliding apparatus for the showering head be installed. Also to cut back on the
consumption of water, fiber should be recovered from each paper machine and

P-88
the sticky compounds should be removed. In order to recover fiber, a concrete
settler should be installed, and also clean water should be recovered.
⑤ For globe-type digesters it is still possible to recollect steam and black liquor, so
it is better to collect steam and wastewater and to save chemicals and energy.
Table 4 The Results of Wastewater Analysis
Hoa Binh Paper Company (23/11/1999) Samp. No. Unit 1 2 5 7 8 9 10
Temp ℃ 20.7 25.2 25.4 25.4 26.5 24.4
pH 8.42 8.29 7.74 7.96 6.94 8.15
Elec. Cond. μS/cm 3602 556 359 293 243 139
Turbidity NTU 3,020 2,860 1,866 455 348 26 56
Oil. mg/l 0.02 0.03 0.02 0.03 0.02 0.02 0.03
BOD mg/l 1,420.30 525.4 459.4 271.9 182.2 272.8 257.8
COD mg/l 71,220 16,350 16,290 7,220 6,110 420 620
DO mg/l 0.2 6.88 5.54 5.7 2.43 6.03
VSS mg/l 795 620 675 280 128 23 41
TSS mg/l 3,140 2,940 1,945 735 366 66 75
Total Nitrogen mg/l
Resid. Chlorine mg/l Trace Trace Trace Trace Trace 3.19 2.84
SO42- mg/l 91.2 28.1
S2- mg/l 0.27 1 0.29 0 0 0 0
Cyanogen mg/l 0.091 0.088
Phenol mg/l 0.415 0.395 0.35 0.068 0.052 0.047 0.022
Na mg/l 297 310
CaCO3 mg/l 125 117 134 200 250 164 72
Cu mg/l 0.96 0.08
Pb mg/l 0.045 0.024
Cd mg/l trace trace
Hg mg/l
Cr(VI) mg/l trace trace
Zn mg/l 0.39 0.36
Salt % 0.02 0.01 0.01 0 0

P-89
Case Study P-08
Bai Bang Company Survey Date:24 November 1999
1. General
1.1 Company Profile
Bai Bang Company is a State owned paper company. The company profile is
shown in Table 1.
Table 1 Company Profile
Name Bai Bang Company
Type State owned
Address Phong Chau Town Phu ninh District Phu Tho
TEL Tel: 0210829755/Fax: (84)210829177
Established
Number of Employees 3200 ( 3 shifts, 300 working days)
Main Products
1.2 Business Status
Production and sales figures of the company in 1998/1999 are shown in Table
2.
The production capacity of the Company is now 55,000 tons a year. The
company has plans to raise production capacity to 100,000 tons by the year 2001,
and to 200,000 tons by the year 2005.
Table 2 Production and Sales
(1998; 1st and 2nd quarter of 1999)
Product Design capacity
(t/year)
1998
(t)
1st quarter 1999
(t)
2nd quarter 1999
(t)
Printing paper 55,000 60,000 14,000 14.000
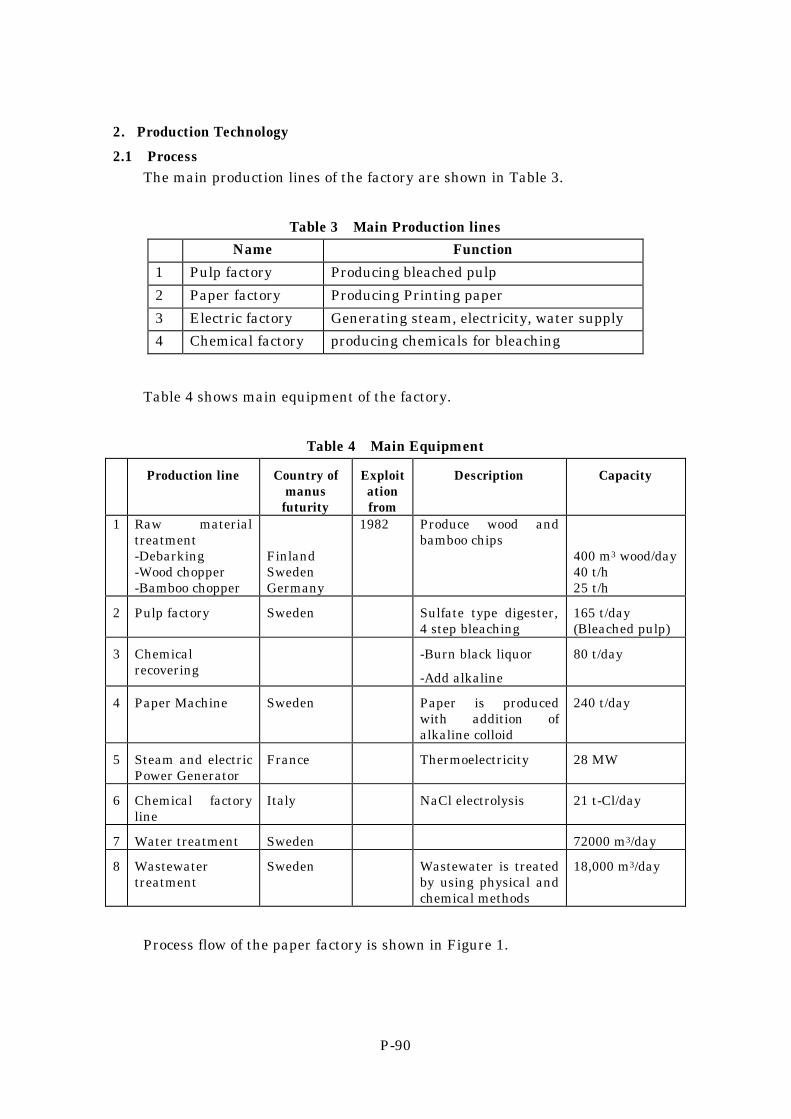
P-90
2. Production Technology
2.1 Process The main production lines of the factory are shown in Table 3.
Table 3 Main Production lines
Name Function
1 Pulp factory Producing bleached pulp
2 Paper factory Producing Printing paper
3 Electric factory Generating steam, electricity, water supply
4 Chemical factory producing chemicals for bleaching
Table 4 shows main equipment of the factory.
Table 4 Main Equipment
Production line Country of manus
futurity
Exploitation from
Description Capacity
1 Raw material treatment -Debarking -Wood chopper -Bamboo chopper
Finland Sweden Germany
1982 Produce wood and bamboo chips
400 m3 wood/day 40 t/h 25 t/h
2 Pulp factory Sweden Sulfate type digester, 4 step bleaching
165 t/day (Bleached pulp)
3 Chemical recovering
-Burn black liquor
-Add alkaline
80 t/day
4 Paper Machine Sweden Paper is produced with addition of alkaline colloid
240 t/day
5 Steam and electric Power Generator
France Thermoelectricity 28 MW
6 Chemical factory line
Italy NaCl electrolysis 21 t-Cl/day
7 Water treatment Sweden 72000 m3/day
8 Wastewater treatment
Sweden Wastewater is treated by using physical and chemical methods
18,000 m3/day
Process flow of the paper factory is shown in Figure 1.

P-91
Figure 1 Process Flow Chart
Electricgenerator
Coal
NaCl
Bamboo, wood (600 t/d)
Chippreparation
Digester
Washing
ScreenChemicalfactory
Waste water12,800 m3/d
Lake
Bleaching
Grinding
Papermachine
Electricitystream
Fresh water
Reagentrecorering
Liquid for digester
Black liquid
Na2CO3
9 t/d
Ca(OH) 2
37 t/d
Treatmentplant for
industrialwater
12,000 m3/d
Municipal water
Municipalwater
tratment
Pumpstation
42,000 m3/d
200 m3/d
Hong
NaClO
①
③④⑤
⑥
⑦
⑧
⑨
⑩

P-92
2.2 Unit Consumption
Unit consumption of raw materials and utilities are shown in Table 5.
Table 5 Unit Consumption
Material Amount consumed for 1 ton product
Cost Total consumption(1998)
1)Bamboo, wood 3.3 tons/product 470,000 d/ton 200,000 tons
2)Imported pulp 250 kg/t 7,000,000 D/t 15,000 tons
3) NaCl 140 kg/t 630,000D/t 9,700 tons
4)Na2SO4 2800 tons
5)CaO 11,000 tons
6)CaCO3 5,500 tons
7)Coal 180,000tons
8)AL2(SO4)3 Wastewater 1,900,000 t 800 t (400 t for waste treatment)
9)Electricity Supply water 800,000 t 127,900 MWh
10) Fo oil 1,800,000 t 1,060 tons
11) Water 280.0 m3/t 800d/m3 17,000,000 m3
In 1998 28% pulp was imported
For each ton of pulp 5.03 tons of material were consumed.
3. Industrial Wastewater
The total volume of discharged wastewater from the factory is 2,300 tons per
day. Table 6 shows the results of wastewater analysis.
Moreover, solid and liquid waste conditions are shown in Table 7 and 8
respectively.

P-93
Table 6 Result of the Wastewater Analysis
(24 November 1999) Samp. Unit 1 3 4 5 6 7 8 9 10
Temperature ℃ 20.8 20.6 21 20.8 20.6 32 27.6 29 24.8
pH 8.63 9.02 8.86 9.12 9.1 9.16 7.75 9.63 8.41
Elec.Cond. μS/cm 890 362 1248 213 761 457 515 2020 183.2
Turbidity NTU 2,912 326 102 131 36 198 4.5 758 35
Oil content mg/l 0.01 0.03 0.01 0.01 0.02 0.03 0.02 0.01 Trace
BOD mg/l 1222.3 210.3 902.9 231.4 306.2 1224.9 167.2 860.6 166.3
COD mg/l 43,250 246 12,120 301 512 3,240 282.5 9,340 195
DO mg/l 2.6 3.19 3.33 6.02
VSS mg/l 1,250 55.1 18.9 30 15.1 100 3 240 18.5
TSS mg/l 2,986 347 112 148 45 207 5 773 54
Total Nitrogen mg/l
Resd. Chlorine A* Trace 51.4 3.55 1.42 35.45 2.13 1.77 4.25
SO42- mg/l 372 64.8
S2- mg/l 0.27 0 0.01 0 0 0.13 0 0.09 0
Cyanogen mg/l 0.069 0.067
Phenol mg/l 0.068 0.02 0.055 0.031 0.13 0.263 0.018 0.34 0.014
Na mg/l 618 317 328
CaCO3 mgeq/l 268 110 47 96 72 117 96 134 66
Cu mg/l 0.52 0.03
Pb mg/l 0.045 0.085
Cd mg/l 0.001 trace
Hg mg/l
Cr(VI) mg/l 0.08 A*
Zn mg/l 0.35 0.32
Salt % 0.01 0.02 0.09 0
Note : A* : not detected
Table 7 Solid Waste
Equipment of production line
Pollutant Pollution rate
Migration of pollutant
Treatment
1 When alkaline is added
lime 18,000 t/ year
Diluted and pumped to resevior
Accumulated in the resevior
2 Raw material treatment
Bark sawdust
21,000 t/ year
Accumulated Sold cut
3 Electric generator
Stag 51,000 t/ year
Sold out

P-94
Table 8 Liquid Waste Source Current
(rate)m3/day PH SS
mg/l COD mg/l
BOD Mg/l
S2
mg/l color mg/l
From material processing section
12,800 7.2 121.5 70
From stag sedimentation tank to canal
1,800 7.2 16.7 50
From pump station to river
35,000 7.8 73 280 90 2,7 345
4. Financial Status
Bank loan 22,000,000,000 VND
Employee bond 22,000,000,000 VND
5. Recommendations
① The size of chips should be less than that of a cigarette pack, and they should
all be arranged in the same size.
② It is necessary to adjust the angle of the “Doctor” and maintain it at about 30
degrees.
③ It recommended that fiber be recovered and a settler be installed because COD
level is very high as 9,340 mg/l, and VSS is 240 mg/l.

P-95
Case Study P-09
Viet Tri Paper Factory Survey date:25 November 1999
1. General
1.1 Company Profile
Viet Tri Paper Factory, established in 1961, is a state-owned paper company.
The Company profile is shown in Table 1.
Table 1 Enterprise Profile
Name: Viet Tri Paper Factory
Ownership: State-owned
Address: Thanh Mieu – Viet Tri - Phu Tho
TEL/FAX: Tel: 0210 – 846702/Fax: 0210 - 846702
Established: 1961
Number of Employees: 700 ( 3 shifts,300 working days)
Main products:
1.2 Business Status
Production and sales figures of the Company in 1998 are shown in Table 2.
The total production capacity of the Company is 7,285 tons/year.
Table 2 Production and Sales in 1998
Product Production (ton) Turnover (million VND) Print paper 5,945 57,000 Cover paper 260 2,000 Tissue paper 250 2,050
Packaging paper 690 2,890 Others paper 140 410
Total 7,285 64,350
2. Production Technology
2.1 Process
The Company process flow chart is shown in Figure 1.
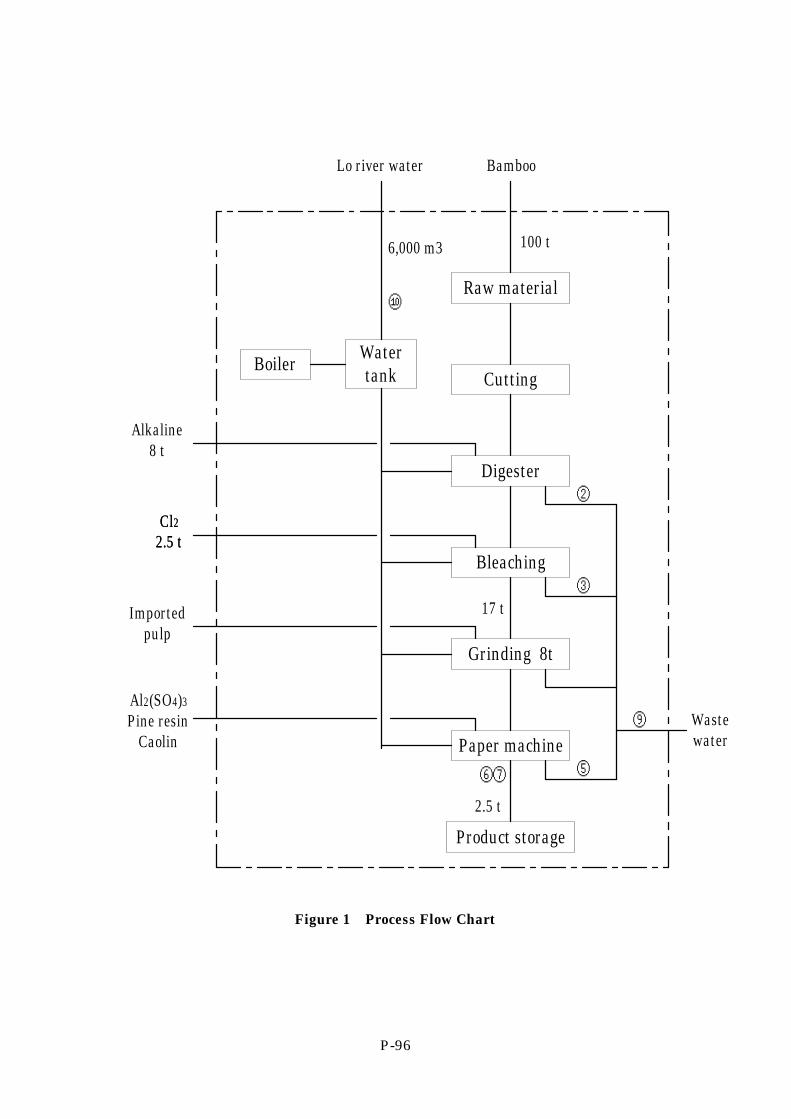
P-96
Raw material
Cutting
Digester
Bleaching
Grinding 8t
Paper machine
Product storage
WatertankBoiler
Lo river water Bamboo
Alkaline8 t
Al2(SO4)3
Pine resinCaolin
Cl2
2.5 t
Importedpulp
Wastewater
100 t
Cl2
2.5 t
6,000 m3
2.5 t
17 t
⑥⑦
⑨
③
②
⑤
⑩
Figure 1 Process Flow Chart

P-97
2.2 Unit Cost of Raw Materials
The Unit Cost of raw materials and utilities are shown in Table 3 and 4.
Table 3 Unit Cost of Raw Materials and Utilities
Raw material Average for 1 ton of product Expenses Net for 1 ton
(kg/t) Expenses
(VND/ ton) (1000 VND)
I- Paper print 1. Imported powder 356 2,349,600 13,968,372 2. Waste paper 46 234,600 1,394,697 3. Bamboo 3,950 1,354,850 8,054,583 4. NaOH 302 996,600 5,924,787 5. ClO 100 340,000 2,021,300 6. Al2(SO4)3 36 62,280 370,255 7. Pine resin 8.5 52,700 313,302 8. Caolin 85 62,900 373,941 9. Water 10. Coal 1,593 549,585 3,267,283 11. Electricity 1,006 734,380 4,365,889 II- Colored paper - cover paper 1. Imported powder 234 1,544,400 401,544 2. Waste paper 39 198,900 51,714 3. Bamboo 4,653 1,595,979 414,955 4. NaOH 371 1,224,300 318,318 5. Cl2 119 404,600 105,196 6. Al2(SO4)3 38 65,740 17,092 7. Pine resin 8.7 53,940 14,024 8. Caolin 80 59,200 15,392 9. Water 10. Coal 1,724 594,780 154,643 11. Electricity 1,057 771,610 200,619 III- Tissue paper 1. Waste paper 770 2,541,000 635,250 2. Bamboo 2,374 814,282 203,571 3. NaOH 173 570,900 142,725 4. Cl2 55 187,000 46,750 5. Al2(SO4)3 6.1 10,553 2,638 6. Water 7. Coal 1,348 465,060 116,265 8. Electricity 949 692,770 173,193 IV- Packaging paper 1- Pulp from packaging paper 500 1,425,000 983,250 2. Waste paper 643 707,300 488,037 3. Al2(SO4)3 37 64,010 44,167 4. Pine resin 8.7 53,940 37,219 5. Water 6. Coal 1,005 346,725 239,240 7. Electricity 822 600,060 414,041

P-98
Table 4 Unit Consumption of Raw Materials and Utilities
Norm for 1 ton product Expenses Raw material
Net for 1 ton (kg/t)
Expenses
(VND/ ton)
(1000 VND)
III- Tissue paper
1.Waste paper 770 2,541,000 635,250
2. Bamboo 2,374 814,282 203,571
3. NaOH 173 570,900 142,725
4. Clo 55 187,000 46,750
5. Al2(SO4)3 6.1 10,553 2,638
6. Water
7. Coal 1,348 465,060 116,265
8. Electricity 949 692,770 173,193
IV- Packaging paper
1- Pulp from packaging paper 500 1,425,000 983,250
2.Waste paper 643 707,300 488,037
3. Al2(SO4)3 37 64,010 44,167
4. Pine resin 8.7 53,940 37,219
5. Water
6. Coal 1,005 346,725 239,240
7. Electricity 822 600,060 414,041
3. Industrial Wastewater
Wastewater is generated in the factory at 6,000 ton/day. The results of
wastewater analysis are shown in Table 5.
Table 5 Results of Wastewater Analysis
(25 November 1999) Samp. No. Unit 2 3 5 6 7 9 10
Temp ℃ 20.8 20.7 28.4 26.1 26.5 26.8 24.1 PH 9.14 9.7 5.81 7.2 7.23 9.12 7.95 Elec.Cond. μS/cm 1530 900.5 1030 291 356 1050 186 Turbidity NTU 598 417 535 234 1329 288 68 Oil. mg/l 0 0 0 0 0 0 0 BOD mg/l 1698.6 963.6 330 371.4 185.7 280.7 10.56 COD mg/l 21320 15840 5325 894 5460 525 48.5 DO mg/l 0.2 0.3 5.12 6.01 6.72 7.14 6.01 VSS mg/l 210 152 564 301 500 90 48.5 TSS mg/l 620 440 1595 1005 1605 158 98 Total Nitrogen mg/l Resid. Chlorine mg/l 3.61 173.71 2.84 1.06 0.71 trace 1.42 SO42- mg/l 472.2 284.1 316.3 92.7 43.4 100.8 30.4 S2- mg/l 0.15 trace 0 0 0 0 0

P-99
Samp. No. Unit 2 3 5 6 7 9 10 Cyanogen mg/l 0.071 0.069 Phenol mg/l 0.13 0.11 0.026 0.024 0.028 0.161 0.016 Na mg/l 346 330 CaCO3 mgeq/l 250 134 110 117 0.6 125.00 66 Cu mg/l 0.88 0.09 Pb mg/l 0.04 trace Cd mg/l trace 0.008 Hg mg/l trace not detec. Cr(VI) mg/l 0.85 not detec. Zn mg/l 0.37 0.34 Salt % 0.04 0.01 0.01 0.03 0
4. Financial Status
State bank loan: 3.7 billion VND
5. Proposed Countermeasures
① The size of chips should be less than that of a cigarette pack, and be arranged in
the same size.
② It is better to install de-inking apparatus and, using floatator, screens, and
cleaner of this apparatus, to eliminate ink and sticky compounds. By this
method it will be possible to prevent product quality deterioration and paper
break.
③ It is necessary to prevent sticky compounds from attaching on the surface of
dryer. If not, it makes break of paper.
④ It is necessary to adjust angle of doctor and keep about 30 degrees.
⑤ It is better to wash sticky compounds from wire, rolls and etc. by high pressure
water. It is better to wash by hot water and in order to save hot water, and the
use of vibration apparatus on the showering head is recommendable. Also to
reduce water consumption it is better to collect fiber from each paper machine
and remove sticky compounds. To recover fiber it is better to install settler
made of concrete, and also recollect clean water.
⑥ Increase diameter of the roll because diameter of roll in press process is short
and paper contains high humidity.
⑦ Collect chemicals and heart energy from a glove digester in order to prevent
wastewater pollution and increase productivity since steam and waste liquid
can be reused in it.
⑧ Change caustic soda quality if the quality doesn’t meet requirement because

P-100
chromium is contained in discharged water.

P-101
Case Study P-10
Thuan Thanh Paper Factory (TTPF) Survey date:26 November 1999
1. General
1.1 Company Profile
The Thuan Thanh Paper Factory (TTPF), established in 1961, is a state-owned
paper company. Although the company produced refined sugar in the past, they
only produce paper at present.
The Company profile of TTPF is shown in Table 1.
Table 1 Enterprise Profile
Name Thuan Thanh Paper Factory (TTPF)
Ownership Local Government-owned.
Address Ho Town, Thuan Thanh - Bac Ninh Province
TEL Tel: 0241.865269 - 0241.865285
Established 1961
Number of Employees 100 ( 3 shifts,340 working days)
Main Products
1.2 Business Status
Production and sales figures of the Company in 1998 are shown in Table 2.
The Company’s six production lines have a total production capacity of 483
ton/year.
Table 2 Production and Sales in 1998
Product Unit Production Turn over (VND) Packaging paper ton 300 840,000,000 Color " 83 298,800,000 Tissue paper " 100 650,000,000 Total " 483 1,788,800,000
2. Production Technology
2.1 Process
The process flow chart is shown in Figure 1.

P-102
Pro
du
ctP
ap
er
ma
chin
e 1
Mix
ing
tan
kG
rin
din
gR
aw
ma
teri
al
dip
pin
g w
ate
rin
g
Tis
sue
pa
pe
r p
lan
t
Pro
du
ctP
ap
er
ma
chin
e 2
Wa
ter
pu
mp
Bo
iler
(1)
(2)
(3)
(4)
(5)
La
ke
(6)
①
⑨
⑨'
④
Pa
cka
gin
g p
ap
er
pla
nt
Dip
pin
g w
ate
r
Gri
nd
ing
Mix
ing
ta
nk
Pa
pe
r m
ach
ine
Pro
du
ct
Wa
ter
pu
mp
Bo
iler
Gro
un
d w
ate
r
⑧
⑩
⑦
Figure 1- Process Flow Chart
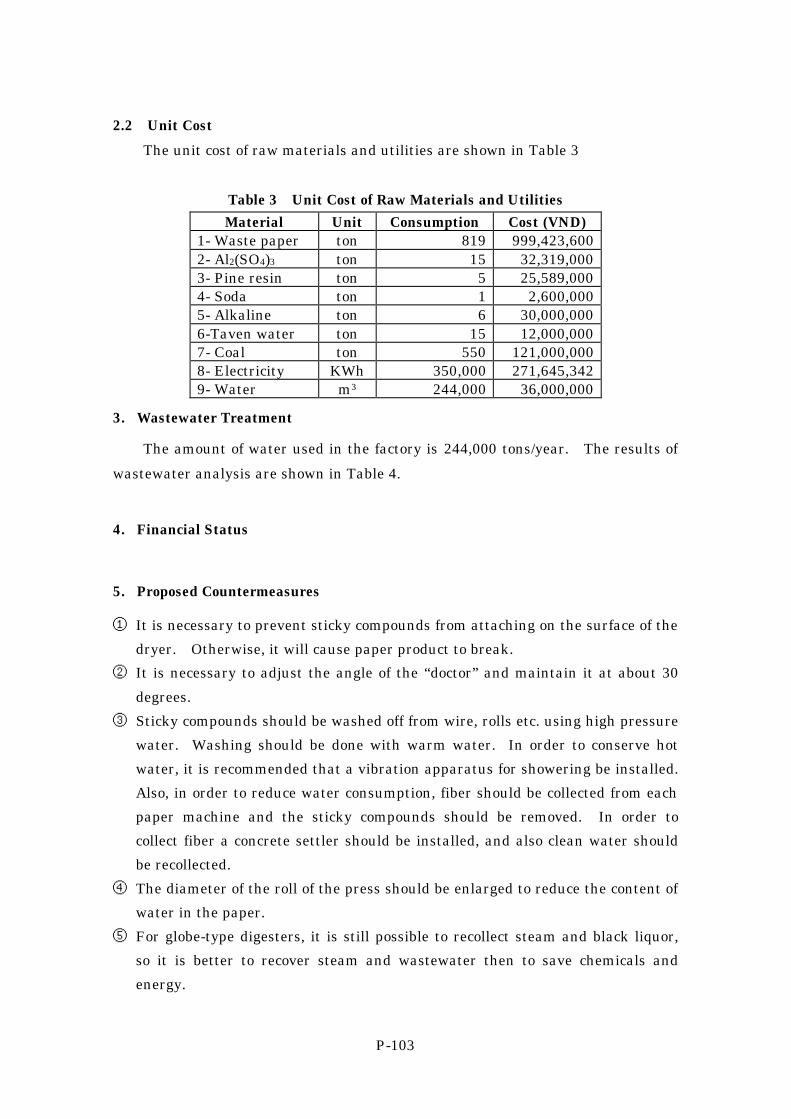
P-103
2.2 Unit Cost
The unit cost of raw materials and utilities are shown in Table 3
Table 3 Unit Cost of Raw Materials and Utilities
Material Unit Consumption Cost (VND) 1- Waste paper ton 819 999,423,600 2- Al2(SO4)3 ton 15 32,319,000 3- Pine resin ton 5 25,589,000 4- Soda ton 1 2,600,000 5- Alkaline ton 6 30,000,000 6-Taven water ton 15 12,000,000 7- Coal ton 550 121,000,000 8- Electricity KWh 350,000 271,645,342 9- Water m3 244,000 36,000,000
3. Wastewater Treatment
The amount of water used in the factory is 244,000 tons/year. The results of
wastewater analysis are shown in Table 4.
4. Financial Status
5. Proposed Countermeasures
① It is necessary to prevent sticky compounds from attaching on the surface of the
dryer. Otherwise, it will cause paper product to break.
② It is necessary to adjust the angle of the “doctor” and maintain it at about 30
degrees.
③ Sticky compounds should be washed off from wire, rolls etc. using high pressure
water. Washing should be done with warm water. In order to conserve hot
water, it is recommended that a vibration apparatus for showering be installed.
Also, in order to reduce water consumption, fiber should be collected from each
paper machine and the sticky compounds should be removed. In order to
collect fiber a concrete settler should be installed, and also clean water should
be recollected.
④ The diameter of the roll of the press should be enlarged to reduce the content of
water in the paper.
⑤ For globe-type digesters, it is still possible to recollect steam and black liquor,
so it is better to recover steam and wastewater then to save chemicals and
energy.

P-104
Table 4 Results of Wastewater Analysis
(26 November 1999) No Unit 1 4 7 8 9 9' 10
Temperature ℃ 24.9 25.6 25.9 25.8 25.4 27 28
pH 7.47 7.65 7.82 5.62 7.48 7.53 7.46
Elec. Conductivity μS/cm 847 769 800 1362 769 1180 1086
Turbidity NTU 73 692 2309 6.5 250 256 140
Oil content mg/l 0.02 0.03 0.03 0.01 0.04 0.02 0.04
BOD mg/l 1079.8 884.4 1048.7 316.8 1005.8 826 1420.3
COD mg/l 5120 4898 12080 413.8 4210 2893 1820
DO mg/l 1.76 3.95 4.43 1.31 0.97 1.53 1.17
VSS mg/l 40 210.5 660 3.5 101 69 105
TSS mg/l 82 708 2420 7.8 277 83 157
Total Nitrogen mg/l
Residual Chlorine mg/l trace trace trace 2.13 trace trace trace
SO4 2- mg/l 162 334 281 137 254.4 289.3 153.6
S2- mg/l 0.81 0.72 0.29 0 0.68 0.51 0.13
Cyanogen mg/l 0.11 0.06 0.1
Phenol mg/l 0.021 0.026 trace 0 0.024 trace 0.009
Na mg/l 315 190 292
CaCO3 mg/l 250 72 96 117 110 81 66
Cu mg/l 0.52 0.31 0.07
Pb mg/l 0.013 0.007 0.006
Cd mg/l 0.006 0.006 trace
Hg mg/l
Cr(VI) mg/l 0.13 0.09 not detect.
Zn mg/l 0.36 0.33
Salt % 0.05 0.05 0.05 0.03 0.05 0.05 0.05

P-105
Case Study P-11
Binh An Paper Company (COGIMEKO) Survey date:1 December 1999
1. General
1.1 Company Profile
The Binh An Paper Company (COGIMEKO), established in 1965, is a
state-owned paper company. The company profile of COGIMEKO is shown in
Table 1.
Table 1 Enterprise Profile
Name Binh an Paper Company (COGIMEKO)
Type State-owned
Address Binh an, Thuan an, Binh Duong Province
TEL Tel: 065 851635/Fax: 065 850389
Established 1965
Number of employees 253 ( 3 shifts,300 working days)
Main Products
1.2 Business status
Production and sales figures of the Company in 1998 are shown in Table 2.
The Company is planning to expand its production capacity to 7,000 tons/year
by the year of 2000.
Table 2 Production and Sales in 1998
Product Production (t)
Sales (billion VND)
1. Carton paper 2. Wrapping paper 3. Typing and white wrapping paper 4. Toilet paper
3,494.67 539.34 345.63 280.32
17.355 3.887 3.853 3.064
Total 4,659.96 28.159
1. Production technology
2.1 Process
The process flow chart is shown in Figure 1

P-106
Hydro pulper
Bleachingwashingthicking
Refiner
Mixer
P.M.
Winder
Fresh waterV=250 m3
consumption5,000-6,000 m3/d
Boiler
Living water
- resin- Alum- Color- Fluorescent
Reject(metal, band, glue)
Waste watercontain fibers
Waste watercontain fibers,color, chemical
to river
① (Drinking water)
Importedpulp
Used exercisebook
Used exercisebook
OCCRiver
②
⑩
⑩'
⑤
③④
⑧
⑦
⑨
100-150m3/d
15 m3/d
80 %
Figure 1 Process Flow Chart
1.1. Unit Cost and Consumption of Raw Materials
The unit cost and consumption of raw materials and utilities are shown in
Table 3 and 4.
Table 3(1) Unit Cost and Consumption of Raw Materials and Utilities Material used (1) Quantity (2) Expenses (3)
VND/t 1. Carton paper:
Semi mechanical pulp OCC Used cement paper H2SO4
Color Resin Alum Energy 821VND/kWh Fuel oil
3494.67 t 1104.125 t 3242.632 t
141.234 t 1.058 t 2.659 t
35.775 t 177958 t
3108016 kWh 1033.689 t
2,500,000 1,300,000 2,250,000 1,790,000
48,000,000 7,130,000 1,750,000
821 VND/kWh 1,576,00.

P-107
Table 3(2) Unit Cost and Consumption of Raw Materials and Utilities Material used (1) Quantity (2) Expenses (3)
VND/t 2. Wrapping paper:
Semi mechanical pulp OCC Used cement paper H2SO4
Color Resin Alum Energy 821VND/kWh Fuel oil
3.Typing+white wrapping paper: Long fiber Short fiber White edge trimmings Fluorescent Resin Alum Energy 821VND/kWh Fuel oil
4. Toilet paper: Long fiber Short fiber White edge trimmings Fluorescent Dispersing agent Energy 821VND/kWh Fuel oil
539.34 t 158.392 t 307.148 t 240.689 t
0.157 t 0.385 t 7.172 t
36.787 t 727646 kWh
200.180 t 345.63 t 61.935 t
285.424 t 55.836 t
0.481 t 3.973 t
13.480 t 574450 kWh
154.269 t 280.32 t 11.918 t
241.665 t 98.358 t
0.378 t 0.461 t
450431 kWh 129.187 t
2,500,000 1,300,000 2,250,000 1,790,000
48,000,000 7,130,000 1,750,000
821 VND/kWh 1,576,000
7,600,000 6,200,000 5,200,000
120,000,000 7,130,000 1,750,000
821 VND/kWh 1,576,000
7,600,000 6,200,000 5,200,000
120,000,000 87,530,000
1,576,000 VND/T
Table 4 Unit Cost of Raw Materials and Utilities
Total material used 1998: Order Material used Quantity
(t) 1 2 3 4 5 6 7 8 9
10 11 12 13 14 15
Semi-mechanical pulp OCC Waste cement paper White edge trimmings Long fiber Short fiber Resin Alum H2SO4 Fluorescent Dispersing agent Color Fuel oil Energy 821 VND/kWh Water
1,262.517 3,549.780
381.923 154.194
73.853 527.089
46.920 228.226
1.215 0.859 0.461 3.045
1,517.326 4,860,543 kWh
m3
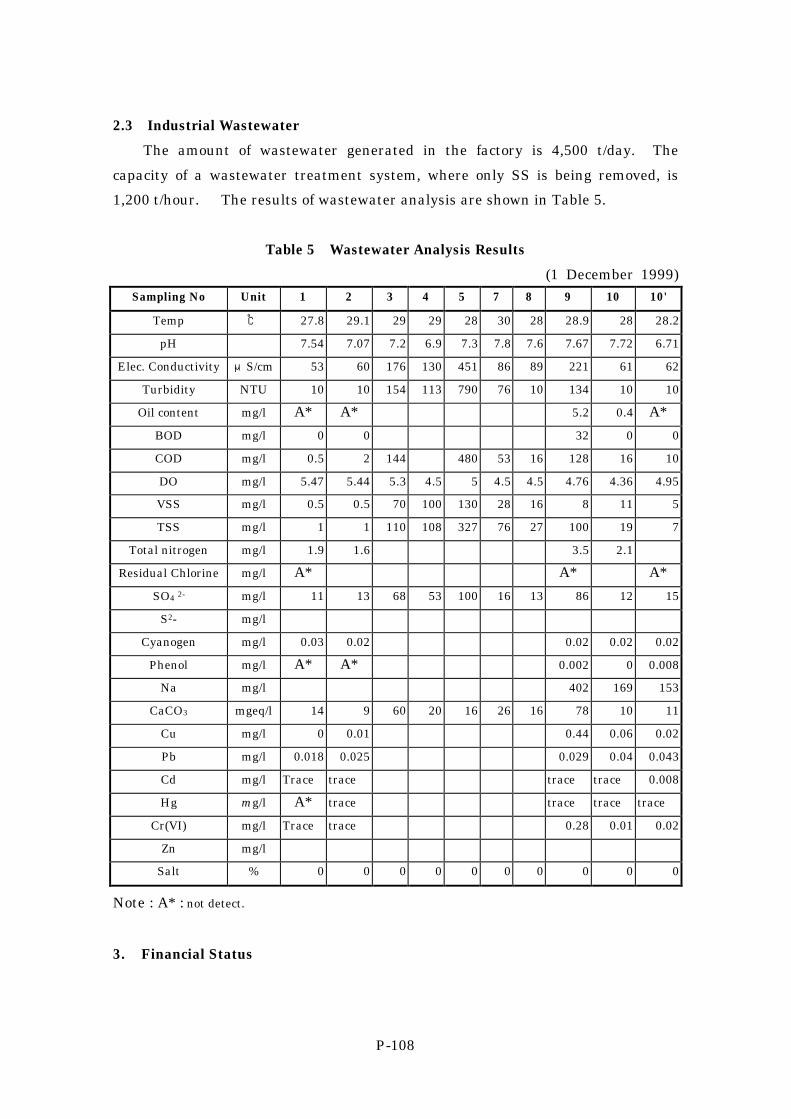
P-108
2.3 Industrial Wastewater
The amount of wastewater generated in the factory is 4,500 t/day. The
capacity of a wastewater treatment system, where only SS is being removed, is
1,200 t/hour. The results of wastewater analysis are shown in Table 5.
Table 5 Wastewater Analysis Results
(1 December 1999) Sampling No Unit 1 2 3 4 5 7 8 9 10 10'
Temp ℃ 27.8 29.1 29 29 28 30 28 28.9 28 28.2
pH 7.54 7.07 7.2 6.9 7.3 7.8 7.6 7.67 7.72 6.71
Elec. Conductivity μS/cm 53 60 176 130 451 86 89 221 61 62
Turbidity NTU 10 10 154 113 790 76 10 134 10 10
Oil content mg/l A* A* 5.2 0.4 A*
BOD mg/l 0 0 32 0 0
COD mg/l 0.5 2 144 480 53 16 128 16 10
DO mg/l 5.47 5.44 5.3 4.5 5 4.5 4.5 4.76 4.36 4.95
VSS mg/l 0.5 0.5 70 100 130 28 16 8 11 5
TSS mg/l 1 1 110 108 327 76 27 100 19 7
Total nitrogen mg/l 1.9 1.6 3.5 2.1
Residual Chlorine mg/l A* A* A*
SO4 2- mg/l 11 13 68 53 100 16 13 86 12 15
S2- mg/l
Cyanogen mg/l 0.03 0.02 0.02 0.02 0.02
Phenol mg/l A* A* 0.002 0 0.008
Na mg/l 402 169 153
CaCO3 mgeq/l 14 9 60 20 16 26 16 78 10 11
Cu mg/l 0 0.01 0.44 0.06 0.02
Pb mg/l 0.018 0.025 0.029 0.04 0.043
Cd mg/l Trace trace trace trace 0.008
Hg mg/l A* trace trace trace trace
Cr(VI) mg/l Trace trace 0.28 0.01 0.02
Zn mg/l
Salt % 0 0 0 0 0 0 0 0 0 0
Note : A* : not detect.
3. Financial Status

P-109
4. Proposed Countermeasures
① It would be better to install de-inking apparatus and to use floatater, screen,
and cleaner on this apparatus to eliminate ink and sticky compounds.
Through the use of this method it will be possible to prevent product quality
deterioration and paper break.
② It is necessary to prevent sticky compounds from attaching on the surface of the
dryer. Otherwise, it causes the paper break.
③ It is necessary to adjust the angle of the “doctor” and maintain it at about 30
degrees.
④ Sticky compounds should be washed off from wire, rolls etc. using high pressure
water. Washing should be done with warm water. In order to conserve warm
water, it is recommended that a vibration apparatus for showering be used.
Also to cut-back on the consumption of water, fiber should be recovered from
each paper machine and the sticky compounds should be removed. In order to
recover fiber, a concrete settler should be installed, and also clean water should
be re-collected.
⑤ The diameter of the roll of the press should be enlarged to reduce the content of
water in the paper.
⑥ The quality of caustic soda should be checked because Chromium is contained
in the wastewater. If the quality of caustic soda is insufficient, it would be
better to change to another source.

P-110

P-111
Case Study P-12
Tan Mai Paper Company Survey date:29 November 1999
1. General
1.1 Company Profile
The Tan Mai Paper Company, established in 1958, is a State-owned paper
company. The Company profile is shown in Table 1.
Table 1 Company Profile
Name Tanmai Paper Company
Ownership State-owned
Address Thongnhat,Town: Bienhoa Industrial Zone, Province: Dongnai
TEL Tel:(061) 822257/Fax:(061) 824915
Established 1958
Number of employees 950 ( 3 shifts,300 working days)
Main Products
1.2 Business Status
The Company’s production and sales figures in 1998 are shown in Table 2.
The production capacity of three production lines is roughly 60,619 t/year.
Table 2 Production and Sales in 1998
Products: Production (t)
Sales (VND)
Newsprint paper 26,102.732 221,361,634,556
Printing paper 13,306.376 127,159,622,776
White printing paper 16,817.338 209,026,296,602
Wrapping and others 4,392.292 28,813,648,510
Total 60,618.738 586,361,202,443
2. Production Technology
2.1 Process
The process flow chart is shown in Figure 1.

P-112
Mixing chest22G160
Centriccleaner
Screen press22S420
Head box22S010
Wire section23S020
Press section
Dryer section
Watertank
Water tankG640
Vargo22S420
Watertank
Curved screen22S500
Thickner22S540
Watertank
Water tankG715
Waste watertreatment
Fresh water
Water
50 m3/h
140 m3/h
to Water treatment tannk (4)
⑦
③
①
⑤
⑧⑩
⑨
⑥
to Watertreatmenttannk (2)
30 m3/h
to Watertreatment
tannk
10 m3/hto Water treatment tannk (1)
G780
H7, H420 m3/h
Fresh water200 m3/h
to River
90 m3/h
Figure 1 Process Flow Chart

P-113
2.2 Consumption of Raw Materials and Utilities
Consumption and cost of raw materials and utilities are shown in Tables 3 and
4.
Table 3 Raw Material and Utility Consumption and Costs(1) Material Weight (ton) Costs(VND) 1. Newsprint Pulp
1. Imported Pulp 28,182.459 143,485,270,000 2. Local Pulp
Chemical Alum 416.634 749,941,200 Resin 26.227 281,643,718 NaOH 2.423 9,304,922 Retention chemical 4.634 522,117,414 Chemical to increase wet strength 117.021 2,048,335,584 Talc 788.733 1,160,277,787 Fluorescent 0.120 15,214,920 H2SO4 0.719 1,403,488 TiO2 1.781 42,715,504 Colors 0.557 44,879,105
Energy and water Water, m3 1,752,092 1,310,564,816 Fuel Oil, liter 6,359,970 9,845,233,560 Energy, kWh 20,339,369 14,725,703,156
Total 174,242,605,174 2. Printing paper Pulp
1. Imported Pulp 15,626.962 79,415,610,192 2. Local Pulp 2,880.975 496,679,274
Chemical Alum 328.460 591,228,000 Resin 123.916 1,330,107,059 NaOH 5.686 22,187,551 Retention chemical 1.535 144,180,764 Chemical to increase wet strength 7.892 136,996,871 Talc 475.555 676,567,855 Fluorescent 1.511 85,962,193 H2SO4 0.434 849,459 TiO2 5.440 125,327,360 Colors 0.159 14,942,853
Energy and water Water, m3 1,041,442 778,998,616 Fuel Oil, litter 3,416,373 5,281,654,737 Energy, kWh 10,892,113 7,829,796,813
Total 96,931,089,597

P-114
Table 4 Raw Material and Utility Consumption and Costs (2) 3. White printing paper Weight (ton) Costs (VND) Pulp
1. Imported Pulp 18,144.155 131,419,875,053 2. Local Pulp 13.300 130,379,067
Chemical Alum 391.482 704,652,275 Resin 200.107 2,186,106,704 NaOH 28.132 110,497,489 Retention chemical 2.491 253,838,913 Chemical to increase wet strength 3.487 57,985,567 Talc 652.171 952,461,125 Fluorescent 25.694 3,522,108,967 H2SO4 0.492 958,822 TiO2 79.779 1,976,546,767 Colors 0.286 22,666,535
Energy and water Water, m3 1,319,556 987,027,888 Fuel Oil, litter 4,444,535 6,865,452,867 Energy, kWh 14,262,907 10,364,070,829
Total 159,554,628,868
4. Wrapping paper Weight(ton) Costs (VND) Pulp
1. Imported Pulp 554.983 2,915,383,374.734 2. Local Pulp 3,942.852 11,375,649,420
Chemical Alum 101.173 182,111,400 Resin 47.484 512,590,440 NaOH 1.167 4,583,976 Retention chemical Chemical for increase wet strength
Talc Fluorescent H2SO4 0.157 306,464 TiO2 Colors 0.586 87,900,000
Energy and water Water, m3 336,333 251,577,084 Fuel Oil, liter 1,075,423 1,664,754,804 Energy, kWh 3,616,154 2,685,767,415
Total 19,680,624,378

P-115
3. Industrial Wastewater Treatment and Discharge
The Company has a wastewater treatment facility and 4,449 t/year of
wastewater is discharged from the factory. The results of wastewater analysis are
shown in Table 5.
Table 5 Results of Wastewater Sample Analysis
29 November 1999
Sampling No Unit 1 3 5 6 7 8 9 10
Temp ℃ 32.5 35.1 34.9 29.5 35.1 35.6 30.8 29.3
PH 4.65 4.45 5.06 7.78 6.94 5.98 6.53 7.36
Elec. Conductivity μS/cm 201 375 382 195 394 328 179 60
Turbidity NTU 53 249 799 10 11 999 44 7
Oil content mg/l Not detect.
12.8 24.4 10.7 5.19
BOD mg/l 6 189 920 141 4
COD mg/l 400 360 1,920 12 400 2,080 360 11
DO mg/l 4.93 4.72 4.44 3.6 1.52 4.32 3.88 3.5
VSS mg/l 318 272 1,210 7 7 1,575 67 44
TSS mg/l 344 455 1,322 7 7 2,320 105 60
Total nitrogen mg/l
Residual Chlorine mg/l Not detect.
not detect.
not detect.
not detect.
not detect.
SO4 2- mg/l 101 233 185 17 139 142 46 5
S2- mg/l 0.021 0.016
Cyanogen mg/l Not detect.
0.02 0.04 0.02 0.01
Phenol mg/l 0.004 0.016 0.004 <0.001 0.016
Na mg/l
CaCO3 mgeq/l 32 19 48 24 39 50 40 20
Cu mg/l
Pb mg/l 0.008 0.043
Cd mg/l 0.001 0.001
Hg mg/l not detect.
0.65
Cr(VI) mg/l 0.02 not detect.
Zn mg/l 0.23 0.19
Salt % 0 0.01 0.01 0 0.01 0.01 0 0

P-116
4. Financial Status
5. Proposed Countermeasures
① It is necessary to prevent sticky compounds from attaching on the surface of the
dryer. If this is not done, it causes the paper to break.
② It is necessary to adjust the angle of the “doctor” and maintain it at about 30
degrees.
③ Sticky compounds should be washed off from wire, rolls etc. using high pressure
water. Washing should be done with warm water. In order to conserve warm
water, it is recommended that a vibration apparatus for showering be used.
Also to cut-back on the consumption of water, fiber should be recovered from
each paper machines and the sticky compounds should be removed. In order to
collect fiber a concrete settler should be installed, and also clean water should
be re-collected.
④ The diameter of the roll of the press should be enlarged to reduce the content of
water in the paper.
⑤ Since raw material is changed to imported pulp from domestic one, it is
recommended to study in the future the location of factory to close to a sea-port
instead of inland.

P-117
Case Study P-13
Vien Dong Paper Company Survey Date:2 December 1999
1. General
1.1 Company Profile
Vien Dong Paper Company, established in 1960, is a state owned company.
The company profile is summarized in Table 1.
Table 1 Company Profile
Company Name Vien dong Paper Company
Ownership State Owned
Address 129 Au Co Street, ward 13, Tan Binh district, HCMC
Phone Tel: (848) 8496056/Fax: (848) 8425880
Established 1960
Number of Employees 145 ( 3 shifts,300 working days)
Main Products
1.2 Business Status
Table 2 shows production and sales of the company in 1998. The total
production capacity is 1,237 tons per year and equipment used in the factory is
made in Taiwan and China.
Table 2 Production and Sales in 1998 Products
Production (t) Sales 1998 (VND) Unbleached banknote pulp Bleached banknote pulp Bleached practice test book pulp Total White toilet paper Woman band, white facial paper Colored toilet paper Woman band, colored facial paper Total
94.619 270.411 116.366 481.396 343.869 57.809
352.550 2.016
756.244
12,042,797,414
2. Production Technology
2.1 Process
The process flow of this factory is shown in Figure 1.

P-118
Cooking
Washing
Bleaching
Refiner
P.M.
Dryer
Edge trimmings3,600 t
Fresh water1,400 m3/d
Living water150 m3/d
Raw material 2,705 tCaustic soda 0.096 t
River
Boiler
Waterdischargechannel
8.8 m3
10 m3
40 m3
200 m3
1.2 m3
916 m3
141 m3
75 m3
11.5 m3
Condensate11.5 m3
Edge trimmings 72kg
White waterrecovery416 m3
Waste water 700 m3
Waste water 131 m3
Cooking liquor 8.1 m3
Pulp 13.5 m3
Pulp 121.74 m3
Pulp 87.642 m3
Pulp 165.2 m3
Evaporation5.66 m3
Bleaching agent0.356 t
Edge trimmings 1,731 tImported pulp 0.649 t
②
④ ⑦
⑤
⑩
① (Drinking water)
⑨ー3
⑨ー1
Figure 1 Process Flow of the Factory

P-119
2.2 Unit Consumption
Unit consumption of raw materials and utilities is shown in Table 3.
Table 3(1) Unit Consumption of Raw Materials and Utilities (1) Production Material used Consumption Unit price Expenses
t Unit Product VND VND I Unbleached banknote pulp
96.616 Banknote paper Soda Fuel oil Energy
kg kg
liter kWh
125,291 4,587
29,358 46,082
1,160 2,000 1,620
845 Total
145,337,560 9,174,000
47,559,960 38,939,290
241,010,810 II. Bleached banknote pulp
270.411 Banknote paper Soda Silicate H2O2 (50%) Fuel oil Energy
kg kg kg kg
litre kWh
375,958 14,353 18,388 8,383
97,348 143,318
1,160 2,000 1,100 5,040 1,620
845 Total
436,111,280 28,706,000 20,226,800 42,250,320
157,703,760 121,103,710 806,101,870
III Bleached exercise book pulp 116.366 Book
Silicate H2O2 (50%) Fuel oil Energy
kg kg kg
litre kWh
124,171 4,993 2,211 4,655
19,666
3,800 1,100 5,040 1,620
845 Total
47,849,800 5,492,300
11,143,440 7,541,100
16,617,770 512,664,410
IV White toilet paper 401.678 1 White toilet paper
343.869 Bleached banknote pulp Imported pulp Edge trimmings Bleached practicebook pulp Tinopal Color Carton paper Silicate P.E cover Fuel oil Energy
kg kg kg kg kg kg kg kg kg
litre kWh
230,347 43,294 23,709
100,612 422.96 7.460
39.870 4,028 9,491
197,381 563,073
2,981 5,600 4,000 4,405
145,653 61,300 5,624 1,125
23,000 1,620
845 Total
686,664,407 242,446,400 94,836,000
443,195,860 61,605,393
457,298 224,228,880
4,531,500 218,293,000 319,757,220 475,796,685
2,771,812,643

P-120
Table 3 (2) Unit Consumption of Raw Materials and Utilities(2) Production Material used Consumption Unit price Expenses
T Unit Product VND VND 2 Woman band paper+white facial paper
57.809 Bleached banknote pulp Imported pulp Bleached practicebook pulp Edges Tinopal Pattern paper Color P.E. cover Fuel oil Energy
kg kg kg kg kg kg kg kg
litre kWh
40,427 7,525
19,467 4,566 72.26 3,137 1.270 5,261
37,693 98,212
2,981 5,600 4,405 4,500
145,453 3,600
61,300 12,000 1,620
845 Total
120,512,887 42,140,000 85,752,135 20,547,000 10,510,434 11,293,200
77,851 63,132,000 61,062,660 82,989,140
498,017,307 VI Colored toilet paper 354.566 1 Colored toilet paper
352.550 Unbleached banknote pulp Edge trimmings Color Carton paper P.E. cover Fuel oil Energy
kg kg kg kg kg
litre kWh
84,259
327,872 60.86
45,875 9,730
201,659 576,725
2,494 2,935
90,328 6,583
23,000 1,620
845 Total
210,141,946 962,304,320
5,497,362 301,995,125 223,790,000 326,687,580 487,332,625
2,517,748,958 2 Color band paper
2,016 Unbleached banknote pulp Edges Color Pattern paper P.E. cover Fuel oil Energy
kg kg kg kg kg
litre kwh
595
1781 11.39 103.0
183 1,237 3,400
2,494 2,943
90,328 9,612
12,000 1,620
845 Total
1,483,930 5,241,483 1,028,836
990,036 2,196,000 2,003,940 2,873,000
15,817,225
3. Industrial Wastewater
The factory discharges 1,400 tons of wastewater per day. The analysis results
of wastewater samples taken on 2 December 1999 are shown in Table 4.

P-121
Table 4 Results of Wastewater Analysis Sampling No 1 2 4 5 7 9-1 9-3 10
Temperature ℃ 29.4 40.2 31.4 30.7 30.1 31 30.4 29.9
PH 7.49 6.46 6.75 6.32 6.55 6.76 6.4 5.45
Electric Conductivity
μS/cm 286 119 403 412 395 524 408 326
Turbidity NTU 10 10 375 694 392 425 401 10
Oil content mg/l not detect
not detect 8 28.6 7.2 8.6 6.8 not detect
BOD mg/l 0 0 60 72 0
COD mg/l 0 2 272 503 298 334 392 3
DO mg/l 5.48 3.42 4.66 3.04 4.64 3.71 4.35 3.16
VSS mg/l 3 5 208 131 150 348 432 18
TSS mg/l 7 7 407 208 188 456 500 19
Total nitrogen mg/l 4.7 68.1 52.5 46.6 12
Residual Chlorine
mg/l 0.3 not detect not detect not detect not detect
SO4 2- mg/l 10 10 25 24 19 23 20 21
S2- mg/l not detect
not detect 0.007 0.005 not detect
Cyanogen mg/l 0.02 0.01 0.71 0.05 0.02
Phenol mg/l 0.012 0.005 0.003 0.013 not detect
Na mg/l
CaCO3 Mgeq/l 46 2 38 31 6 32 48 3
Cu mg/l 0.4 0.38 0.02
Pb mg/l 0.016 0.015
Cd mg/l 0.001 0.007
Hg mg/l trace trace
Cr(VI) mg/l 0.13 0.09 0.02
Zn mg/l
Salt % 0.01 0 0.01 0.01 0.01 0.02 0.01 0.01
4. Finance
5. Recommendations
① It is necessary to prevent sticky compounds from attaching on the surface of the
dryer. Otherwise, paper break will occur.

P-122
② It is necessary to adjust the angle of the "doctor" and maintain it at about 30
degrees.
③ The level of volatile SS in waste water is too high(432 mg/l)and fiber is
missing.
④ Sticky compounds should be washed off from wire, rolls etc. using high pressure
water. Washing should be done using warm water. In order to conserve hot
water, it is recommended that a vibration apparatus for showering be used.
Also to cut-back on the consumption of water, fiber should be recovered from
each paper machine and the sticky compounds should be removed. In order to
recover fiber, a settler made of concrete should be installed, and also, clean
water should be recovered.
⑤ The diameter of the roll of the press should be enlarged to reduce the water
content of the paper.
⑥ In order to improve product quality, it is necessary to install 4 more thickeners
so that each paper machine can use one independently.
⑦ It is necessary to install small wire cylinders for fiber recovery for each paper
machine.

P-123
Case Study P-14
Linh Xuan Paper Company Survey Date:3 December 1999
1. General
1.1 Company Profile
Linh Xuan Paper Company, established in 1972, is a state-owned paper
company. The company profile is shown in Table 1.
Table 1 Enterprise Profile
Company Name Linh Xuan Paper Company
Owned State-owned
Address 61/6 High Way N0 1, Linh xuan, Thu duc District, HCMC
Tel Tel:(84) 8966784 / Fax: (84) 8961540
Established 1972
Number of Employees 214 ( 3 shifts,330 working days)
Main Products
1.2 Business Status
Table 2 shows production and sales of the company in 1998.
The total production capacity is 4,275 tons per year with 4 production lines.
60% of the raw material is waste paper from China. The width of the paper is
1.2-1.5 m, and the their machine speed is 50 m/min.
Table 2 Production and Sales (1998)
Product Production (t) Sales (VND) Toilet paper Other grades Pulp of different kinds Votive paper
1,551 234
4,755 2,490
Total 4,275 29,000,000,000
2. Production Technology
2.1 Process
The process flow of the factory is shown in Figure 1.

P-124
Hydro pulper
Beater
Mixer
Chest
Vibrator
Sand sedimentation
Dilution
Wire section
Press section
Dryer section
Slitter winder
Final product
BoilerAir emission
Imported pulpWaste paperFresh waterWhite water
Bleaching agentChemical
Brock & edgetrimming Fresh
water
White water
White water
White water
White water
White water
Reject
SS
SS
Sand
Waste water ⑨-1
Waste water ⑨-2
③④⑤⑥
Waste paper
Condensed water
Steam
Fresh water
Fuel oil
⑩
Figure 1 Process Flow of the Factory
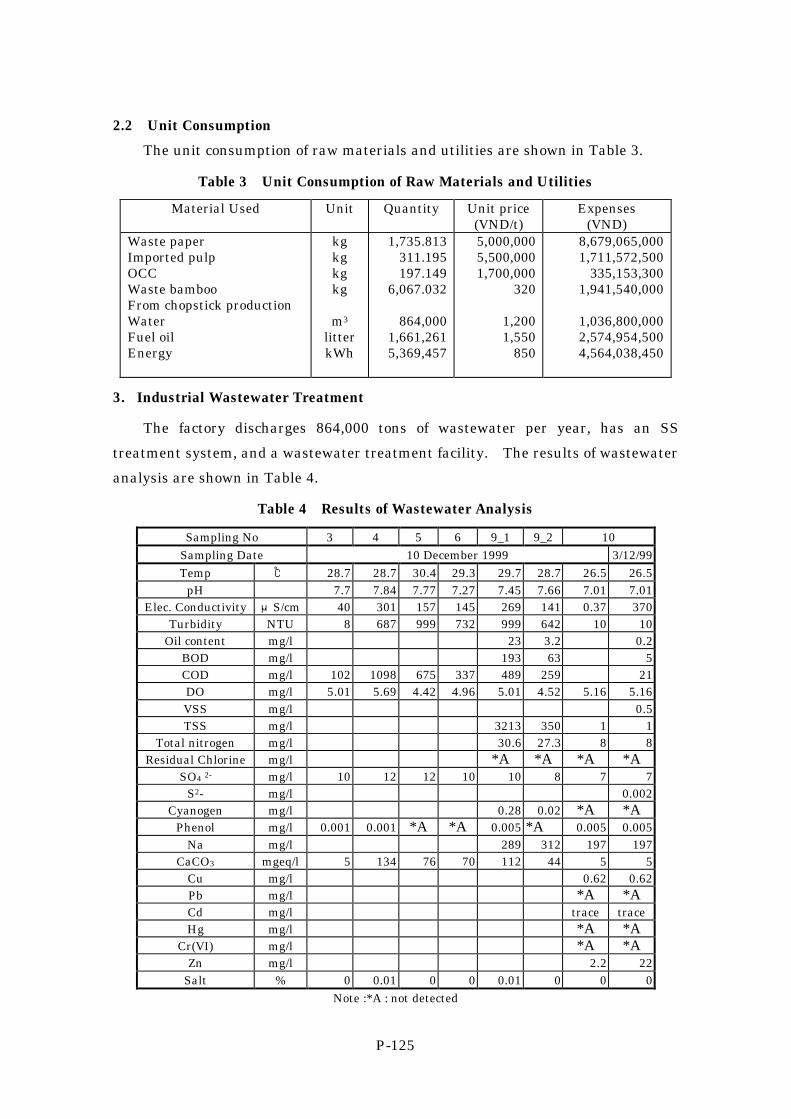
P-125
2.2 Unit Consumption
The unit consumption of raw materials and utilities are shown in Table 3.
Table 3 Unit Consumption of Raw Materials and Utilities
Material Used Unit Quantity Unit price (VND/t)
Expenses (VND)
Waste paper Imported pulp OCC Waste bamboo From chopstick production Water Fuel oil Energy
kg kg kg kg
m3
litter kWh
1,735.813 311.195 197.149
6,067.032
864,000 1,661,261 5,369,457
5,000,000 5,500,000 1,700,000
320
1,200 1,550
850
8,679,065,000 1,711,572,500
335,153,300 1,941,540,000
1,036,800,000 2,574,954,500 4,564,038,450
3. Industrial Wastewater Treatment
The factory discharges 864,000 tons of wastewater per year, has an SS
treatment system, and a wastewater treatment facility. The results of wastewater
analysis are shown in Table 4.
Table 4 Results of Wastewater Analysis
Sampling No 3 4 5 6 9_1 9_2 10 Sampling Date 10 December 1999 3/12/99 Temp ℃ 28.7 28.7 30.4 29.3 29.7 28.7 26.5 26.5
pH 7.7 7.84 7.77 7.27 7.45 7.66 7.01 7.01 Elec. Conductivity μS/cm 40 301 157 145 269 141 0.37 370
Turbidity NTU 8 687 999 732 999 642 10 10 Oil content mg/l 23 3.2 0.2
BOD mg/l 193 63 5 COD mg/l 102 1098 675 337 489 259 21 DO mg/l 5.01 5.69 4.42 4.96 5.01 4.52 5.16 5.16 VSS mg/l 0.5 TSS mg/l 3213 350 1 1
Total nitrogen mg/l 30.6 27.3 8 8 Residual Chlorine mg/l *A *A *A *A
SO4 2- mg/l 10 12 12 10 10 8 7 7 S2- mg/l 0.002
Cyanogen mg/l 0.28 0.02 *A *A Phenol mg/l 0.001 0.001 *A *A 0.005 *A 0.005 0.005
Na mg/l 289 312 197 197 CaCO3 mgeq/l 5 134 76 70 112 44 5 5
Cu mg/l 0.62 0.62 Pb mg/l *A *A Cd mg/l trace trace Hg mg/l *A *A
Cr(VI) mg/l *A *A Zn mg/l 2.2 22
Salt % 0 0.01 0 0 0.01 0 0 0 Note :*A : not detected

P-126
4. Finance
5. Recommendations
① It is necessary to prevent sticky compounds from attaching on the surface of the
dryer. Otherwise, paper break will occur.
② It is necessary to adjust the angle of the "doctor" and maintain it at about 300.
③ Sticky compounds should be washed off from wire, rolls etc. using high pressure
water. Washing should be done using warm water. In order to conserve
warm water, it is recommended that a vibration apparatus for showering be
installed. Also to cut-back on the consumption of water, fiber should be
recovered from each paper machine and the sticky compounds should be
removed. In order to recover fiber, a settler made of concrete should be
installed, and also, clean water should be recovered.
④ The diameter of the roll of the press should be enlarged to reduce the content of
water in the paper. ⑤ Linh xuan is utilizing Johnson hole vibrators at present, but it is recommended
that they replace those with slit type ones for reducing fiber consumption and
improving product quality.

P-127
Case Study P-15
Hanh Linh Paper LTD. Company Survey Date:6 December 1999
1. General
1.1 Company Profile
Hanh Linh Paper LTD. Company, established in 1994, is a private paper
producing company. The Company Profile is shown in Table 1.
Table 1 Company Profile
Company name Hanh linh Paper LTD. Company
Owner Private
Address Zone N0 9 - Dong hoa, Di an, Binh Duong Province
Phen# Tel: 065851826 / Fax: 065850713
Established 1994
Number of Employees 176 ( 3 shifts,300 working days)
Main Products
1.2 Business Status
Table 2 shows production and sales of the company in 1998.
Production capacity is 2,000 ton per year with 6 production lines.
Table 2 Production and Sales in1998
Product Production Sales
Votive paper 2,000 t/y 90,000 US$
2. Production Technology
2.1 Process
The process flow of the factory is shown in Figure 1.
2.2 Unit Consumption
Unit consumption of raw materials and utilities are shown in Table 3.
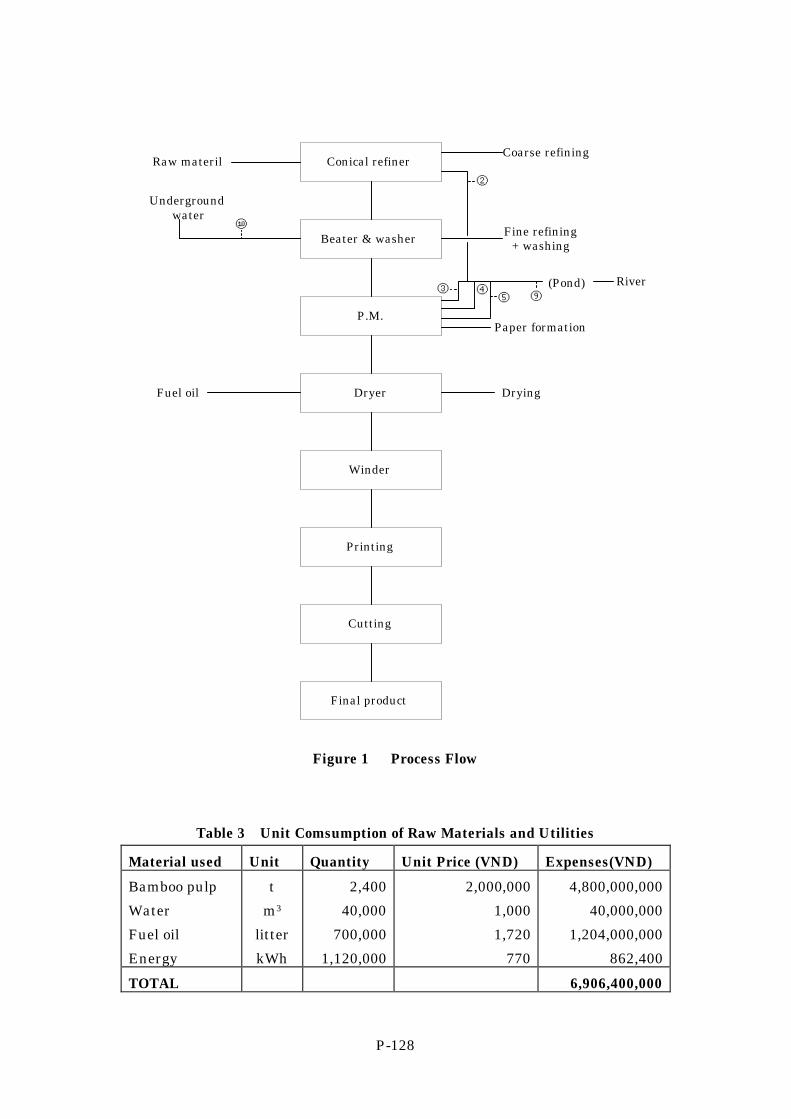
P-128
Figure 1 Process Flow
Table 3 Unit Comsumption of Raw Materials and Utilities
Material used Unit Quantity Unit Price (VND) Expenses(VND)
Bamboo pulp
Water
Fuel oil
Energy
t
m3
litter
kWh
2,400
40,000
700,000
1,120,000
2,000,000
1,000
1,720
770
4,800,000,000
40,000,000
1,204,000,000
862,400
TOTAL 6,906,400,000
Conical refiner
Beater & washer
P.M.
Dryer
Winder
Printing
Cutting
Final product
Raw materil
Undergroundwater
Fuel oil
Coarse refining
Fine refining+ washing
Paper formation
Drying
③⑨⑤
④
②
(Pond) River
⑩

P-129
3. Industrial Wastewater Treatment
This factory discharges 500 tons of wastewater per day, has SS treatment
equipment and a wastewater treatment facility. Wastewater is discharged to a
river after going through this treatment system. The results of wastewater
analysis are shown in Table 4.
Table 4 Results of Wastewater Analysis Sampling No 1 2 3 4 5 9 10
Temp ℃ 29.7 31.2 30.9 30.2 29.8 30.2 29.7
PH 4.7 9.3 10.29 7.6 10.21 10.17 4.88
Elec. Conductivity μS/cm 670 1700 2750 693 950 1740 70
Turbidity NTU 10 555 788 253 245 193 10
Oil content mg/l *A 3.8 *A
BOD mg/l 2 910 1
COD mg/l 11 4645 1301 1425 2555 2230 5
DO mg/l 3.9 5.49 4.85 6.12 4.4 4.11 3.65
VSS mg/l 3 46 178 225 197 84 0
TSS mg/l 7 250 1
Total Nitrogen mg/l 1.2 34 0.1
Residual Chlorine mg/l *A 1.2 *A
SO4 2- mg/l 5 37 42 20 25 24 5
S2- mg/l 0.001 0.375 *A
Cyanogen mg/l 0.02 0.03 *A
Phenol mg/l *A 0.025 0.001
Na mg/l 117.8 202 386.1 406.1 317.2 287 207.6
CaCO3 mgeq/l 2 30 5 40 20 18 1
Cu mg/l 0.09 0.97 0.05
Pb mg/l trace trace trace
Cd mg/l 0.005 0.007 0.003
Hg mg/l trace trace trace
Cr(VI) mg/l trace 0.02 *A
Zn mg/l
Salt % 0 0.07 0.13 0.02 0.04 0.08 0
Note :*A : not detected Sampling date : 6/12/99

P-130
4. Finance
5. Recommendations
① It is necessary to prevent sticky compounds from attaching on the surface of the
dryer. Otherwise, the paper break will occur.
② It is necessary to adjust the angle of the "doctor" and maintain it at about 300.
③ Sticky compounds should be washed off from wire, rolls etc. using high pressure
water. Washing should be done using warm water. In order to conserve
warm water, it is recommended that a vibration apparatus for showering be
installed. Also to cut-back on the consumption of water, fiber should be
recovered from each paper machine and the sticky compounds should be
removed. In order to recover fiber, a settler made of concrete should be
installed, and also, clean water should be recovered.
④ The diameter of the roll of the press should be enlarged to reduce the content of
water in the paper.
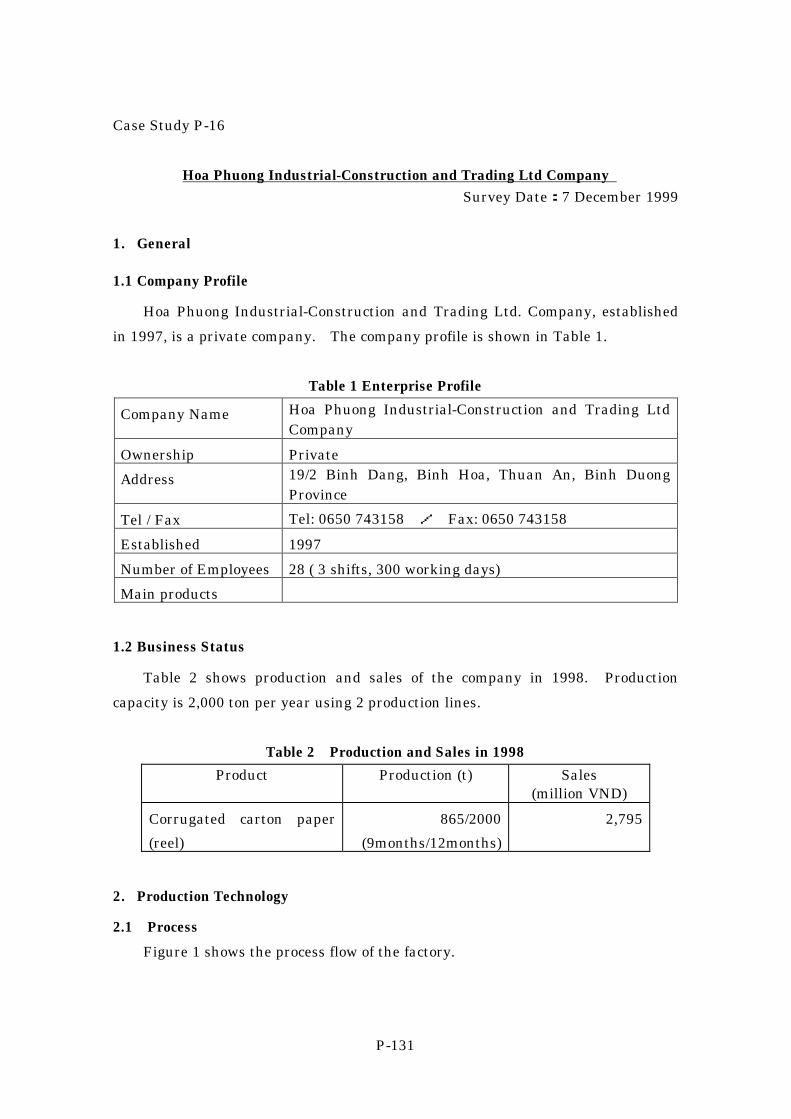
P-131
Case Study P-16
Hoa Phuong Industrial-Construction and Trading Ltd Company Survey Date:7 December 1999
1. General
1.1 Company Profile
Hoa Phuong Industrial-Construction and Trading Ltd. Company, established
in 1997, is a private company. The company profile is shown in Table 1.
Table 1 Enterprise Profile
Company Name Hoa Phuong Industrial-Construction and Trading Ltd Company
Ownership Private
Address 19/2 Binh Dang, Binh Hoa, Thuan An, Binh Duong Province
Tel / Fax Tel: 0650 743158 / Fax: 0650 743158
Established 1997
Number of Employees 28 ( 3 shifts, 300 working days)
Main products
1.2 Business Status
Table 2 shows production and sales of the company in 1998. Production
capacity is 2,000 ton per year using 2 production lines.
Table 2 Production and Sales in 1998
Product Production (t) Sales (million VND)
Corrugated carton paper
(reel)
865/2000
(9months/12months)
2,795
2. Production Technology
2.1 Process
Figure 1 shows the process flow of the factory.

P-132
Primarysedimentation
Sedimentation
Activatedsludge
Decolouring
Waste water
Fiber Driedfiber
Recycle
Nitrogenphosphor
Aeration
Sludgedeterioration
Sludge
Sludge
Sludge collection
Freshwater
Recycle
Discharge
Freshwater
Papermachine
PondWaste water
treatment River
⑩ ⑦ ⑧ ⑨
Mi/ing chest
Chlorine
Figure 1 Process Flow of the Factory

P-133
2.2 Unit Consumption
The unit consumption of raw materials and utilities is shown in Table 3.
Table 3 Unit Consumption of Raw Materials and Utilities Material used Unit Quantity Expenses
(million VND)
OCC t 1,202 1,894
Auxiliary 15
Fuel oil Liter 166,746 265
Energy KWh 359 313
Total 2,487
3. Wastewater Treatment
The factory utilizes 85 tons of water per day, and discharges 34 tons of
wastewater per day. Although the factory has a biological wastewater treatment
system, the system removes only SS, and the concentration of COD discharged is
1,200-2,882 mg/l, which is considered very high. The results of wastewater
analysis are shown in Table 4.
4. Financial Condition
5. Recommendations
① It is better to install a de-inking apparatus and use floataters, screens, and
cleaners on this apparatus to eliminate ink and sticky compounds. Through
the use of this method it will be possible to prevent the product quality
deterioration and paper break.
② It is necessary to prevent sticky compounds from attaching on the surface of the
dryer. Otherwise, it causes the paper to break.
③ It is necessary to adjust the angle of the "doctor" and maintain it at about 300.
④ Sticky compounds should be washed off from wire, rolls etc. using high pressure
water. Washing should be done using warm water. In order to conserve
warm water, it is recommended that a vibration apparatus for showering be
installed. Also to cut-back on the consumption of water, fiber should be
recovered from each paper machine and the sticky compounds should be
removed. In order to recover fiber a settler made of concrete should be
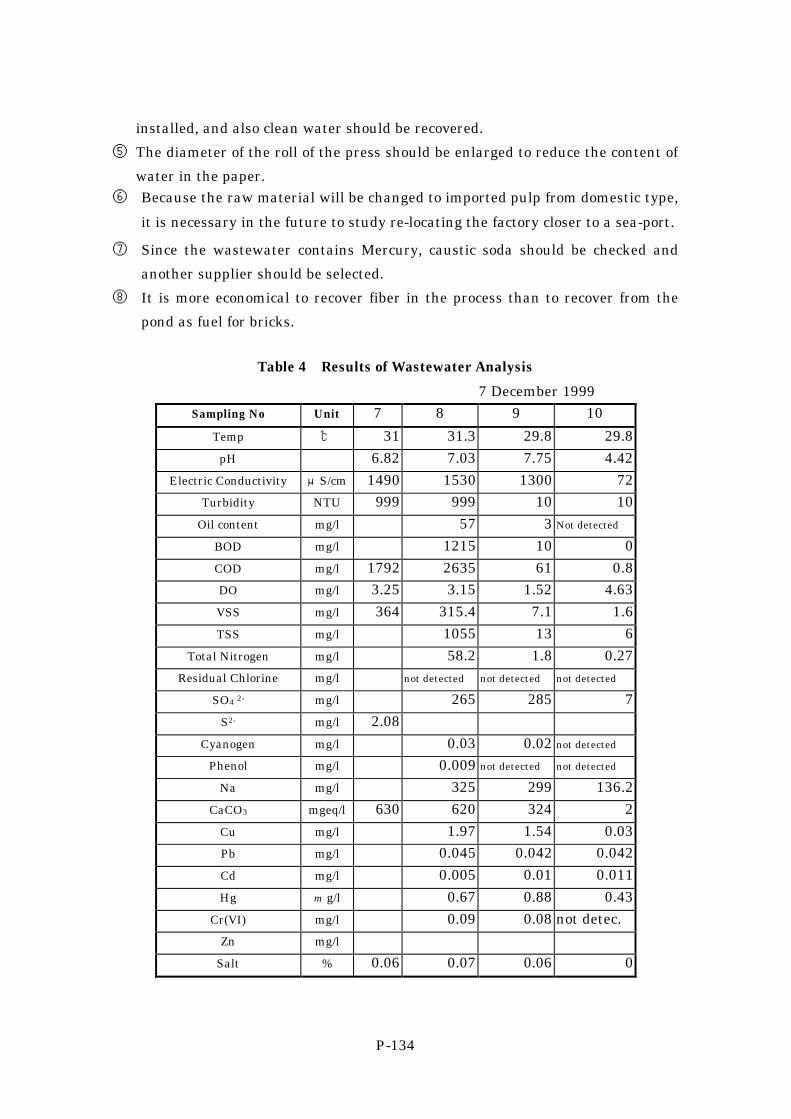
P-134
installed, and also clean water should be recovered.
⑤ The diameter of the roll of the press should be enlarged to reduce the content of
water in the paper. ⑥ Because the raw material will be changed to imported pulp from domestic type,
it is necessary in the future to study re-locating the factory closer to a sea-port.
⑦ Since the wastewater contains Mercury, caustic soda should be checked and
another supplier should be selected.
⑧ It is more economical to recover fiber in the process than to recover from the
pond as fuel for bricks.
Table 4 Results of Wastewater Analysis
7 December 1999 Sampling No Unit 7 8 9 10
Temp ℃ 31 31.3 29.8 29.8
pH 6.82 7.03 7.75 4.42
Electric Conductivity μS/cm 1490 1530 1300 72 Turbidity NTU 999 999 10 10
Oil content mg/l 57 3 Not detected
BOD mg/l 1215 10 0
COD mg/l 1792 2635 61 0.8 DO mg/l 3.25 3.15 1.52 4.63
VSS mg/l 364 315.4 7.1 1.6
TSS mg/l 1055 13 6
Total Nitrogen mg/l 58.2 1.8 0.27 Residual Chlorine mg/l not detected not detected not detected
SO4 2- mg/l 265 285 7
S2- mg/l 2.08
Cyanogen mg/l 0.03 0.02 not detected
Phenol mg/l 0.009 not detected not detected
Na mg/l 325 299 136.2
CaCO3 mgeq/l 630 620 324 2
Cu mg/l 1.97 1.54 0.03 Pb mg/l 0.045 0.042 0.042
Cd mg/l 0.005 0.01 0.011
Hg m g/l 0.67 0.88 0.43
Cr(VI) mg/l 0.09 0.08 not detec. Zn mg/l
Salt % 0.06 0.07 0.06 0

P-135
CASE STUDY P-17
Mai lan Paper Enterprise
Survey date: 9 December 1999
1. General
1.1 Company Profile
Mai Lan Paper Enterprise, established in 1969, is a state owned company. The
company profile is shown in Table 1.
Table 1 Enterprise Profile Name of the Company Mai lan Paper Enterprise Address 129 Au co Street, Tan binh District, HCMC
Tel 8495453
Fax 8425594
Establishment 1969
Number of employees 190 ( 3shifts,312days operation/Y)
Owneship State-owned
1.2 Business Status
Table 2 shows production and sales of this company. Production capacity of
the factory is 3.8 tons per day, and their main products are toilet paper and
napkins.
Table 2 Production and Sales in 1998
Product Production (T) Sales (mill. DVN) Various kinds of toilet paper 1,194 16,479
2. Production Technology
2.1 Process
The process flow chart of this factory is shown in Figure 1.
2.2 Unit Consumption of Raw Materials and Utilities
Table 3 shows unit consumption of raw materials and utilities of this factory.

P-136
Cooking
Washing, bleaching
Tank 1/2
Adjusting tank 1
Sedimentation
Adjusting tank 2
Head box
Wire part
Press section
Vacuum pump
Dryer
Winder
Rewinder
Roll cutter
Final product
Freshwater
Makeslurry
Papermachine Exhaust
⑤
⑩⑧
⑦
⑨
Figure 1 Process Flow Chart
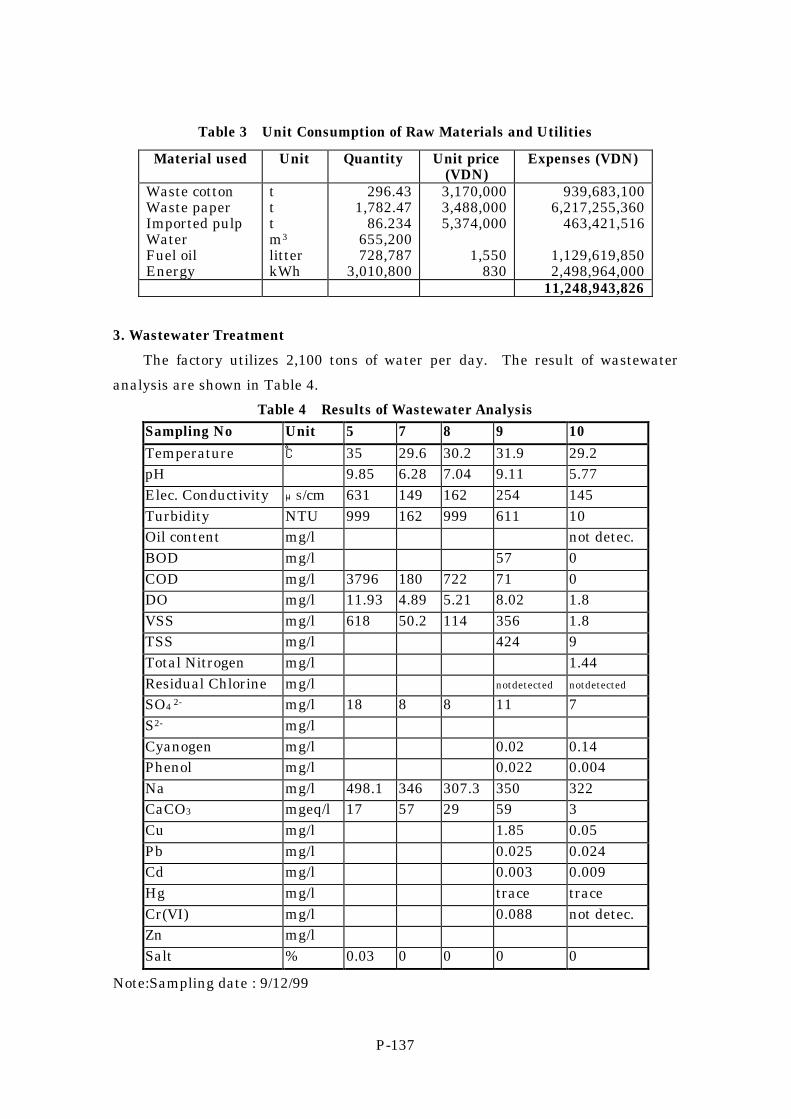
P-137
Table 3 Unit Consumption of Raw Materials and Utilities Material used Unit Quantity Unit price
(VDN) Expenses (VDN)
Waste cotton Waste paper Imported pulp Water Fuel oil Energy
t t t m3 litter kWh
296.43 1,782.47
86.234 655,200 728,787
3,010,800
3,170,000 3,488,000 5,374,000
1,550
830
939,683,100 6,217,255,360
463,421,516
1,129,619,850 2,498,964,000
11,248,943,826
3. Wastewater Treatment
The factory utilizes 2,100 tons of water per day. The result of wastewater
analysis are shown in Table 4.
Table 4 Results of Wastewater Analysis Sampling No Unit 5 7 8 9 10 Temperature ℃ 35 29.6 30.2 31.9 29.2 pH 9.85 6.28 7.04 9.11 5.77 Elec. Conductivity μS/cm 631 149 162 254 145 Turbidity NTU 999 162 999 611 10 Oil content mg/l not detec. BOD mg/l 57 0 COD mg/l 3796 180 722 71 0 DO mg/l 11.93 4.89 5.21 8.02 1.8 VSS mg/l 618 50.2 114 356 1.8 TSS mg/l 424 9 Total Nitrogen mg/l 1.44 Residual Chlorine mg/l notdetected notdetected
SO4 2- mg/l 18 8 8 11 7 S2- mg/l Cyanogen mg/l 0.02 0.14 Phenol mg/l 0.022 0.004 Na mg/l 498.1 346 307.3 350 322 CaCO3 mgeq/l 17 57 29 59 3 Cu mg/l 1.85 0.05 Pb mg/l 0.025 0.024 Cd mg/l 0.003 0.009 Hg mg/l trace trace Cr(VI) mg/l 0.088 not detec. Zn mg/l Salt % 0.03 0 0 0 0
Note:Sampling date : 9/12/99

P-138
4. Finance
5.Recommendations
① It is better to install a de-inking apparatus and use a “flotater”, screen, and
cleaner on this apparatus to eliminate ink and sticky compounds. Through the
use of this method it will be possible to prevent quality loss and paper break.
② It is necessary to prevent sticky compounds from attaching on the surface of the
dryer. If this is not done, it causes the paper break will occur.
③ It is necessary to adjust the angle of the "doctor" and maintain it at about 300.
④ The level of burning SS in the waste water is too high of 356 mg/l and fiber is
missing.
⑤ Sticky compounds should be washed off from wire and rolls etc. using high-
pressure water. Washing should be done with hot water. In order to conserve
hot water, it is recommended that a vibration apparatus for showering be used.
Also, to cutback on the consumption of water, fiber should be recovered from
each paper machine and the sticky compounds should be removed. In order to
collect fiber, a concrete settler should be installed, and also clean water should
be re-collected.
⑥ It is more economical to recover fiber in the process than to collect it from the
pond and use it as fuel for bricks.
⑦ The diameter of the roll of the press should be enlarged to reduce the content of
water in the paper.
⑧ Raw material will be changed to imported pulp from domestic pulp, so in the
future it is better to re-locate the factory closer to a seaport.
⑨ It is better to install one more stage of centric cleaning. The pressure of the
wire cleaning water should be increased.
⑩ In order to solve the streaking problems on the paper sheet, the wire joint must
be welded and the sewing operation that is being used now should be
eliminated.

P-139
CASE STUDY P-18
Xuan duc Company
Survey date : 10 December 1999
1. General
1.1 Company Profile
The Xuan Duc Company, established in 1975, is a state owned paper company.
The company profile is shown in Table 1.
Table 1 Enterprise Profile
Name of the Company Xuan duc
Ownership State-owned
Establishment 1975
Number of employees 191(3shifts 350days/Y)
Main Product
1.2 Business Status
Production capacity of this company is 14.5 t/day, using 4 production lines.
2. Production Technology
2.1 Process
The block flow diagram of the factory, including wastewater flow, is shown in
Figure 1.
3. Industrial Wastewater
The factory uses 2,400 tons per day of water and discharges 50 ton per hour of
wastewater. The results of wastewater analysis are shown in Table 2.

P-140
underground water
100-120 m3/h(2,400 t/day)
⑩
boiler
#1 PM
⑤
#2 PM ③
⑥ #3 PM
Grinding fresh
⑦ #4 PM Holland water
⑧
waste water treatment
water treatment
⑨
Rach Cluec River
50 m3/h
Figure 1 Process Flow

P-141
Table 2 Results of Wastewater Analysis
Sampling No 3 5 6 7 8 9 10
Temp ℃ 30.5 29.9 30.1 28.6 29.4 29.7 28.5
PH 7.65 7.25 7.14 7.33 7.27 7.22 5.91
Elec. Conductivity μS/cm 334 435 488 266 265 276 37
Turbidity NTU 999 454 533 450 460 222 10
Oil content mg/l 9.4 not detected
BOD mg/l 121 0
COD mg/l 1380 329 278 570 298 345 2
DO mg/l 4.73 4.63 4.84 4.97 4.43 2.85 4.38
VSS mg/l 217 312 356 324 341 26 0
TSS mg/l 127 0
Total Nitrogen mg/l 12.4 0.21
Residual Chlorine mg/l not detected
not detected
SO4 2- mg/l 50 132 18 60 40 44 10
S2- mg/l
Cyanogen mg/l 0.05 0.03
Phenol mg/l 0.003 not detected
Na mg/l 289 236
CaCO3 mgeq/l 100 112 88 30 80 6 130
Cu mg/l 0.84 0.07
Pb mg/l trace trace
Cd mg/l trace trace
Hg mg/l trace trace
Cr(VI) mg/l 0.03 not detected
Zn mg/l
Salt % 0.01 0.01 0 0.01 0.01 0.01 0
Note:Sampling date : 10/12/99
4. Recommendations
There are problems with the treatment of SS, so it may be better for the
company to adopt a high pressure floating method.

P-142

P-143
CASE STUDY P-19
Viet Dai Private Enterprise
Survey date : 11 December 1999
1. General
1.1 Company Profile
The Viet Dai Private Enterprise was established in 1996, and is one of the
private enterprises surveyed for this study.
The Company profile is shown in Table 1.
Table 1 Enterprise Profile
Name of the Company Viet dai Private Enterprise
Ownership private-owned
Address Loc tien, Bao loc, Lam dong
Tel 063.862390
Fax 063.860267
Establishment 1996
Number of employees 120( 3shifts, 300 days operation/y)
1.2 Business Status
Table 2 shows production and sales of this company in 1998.
Production capacity is 1,750 tonn a year.
Table 2 Production Capacity (1998)
Product Production(T) Sales (mill. VND)
Votive paper 1,750 7,527
2. Production Technology
2.1 Process
A block flow diagram of the factory is shown in Figure 1.

P-144
Bamboo11.7 t/d
NaOH702 t/dFrom well
Fresh water
Chiptreatment
tank
Beater
Black liquarP.M
Dryer
Winder Adjusting tank
Waste watertreatment
Color7 kg/d
Flocculationagent18 kg
Waste water Sludge
230 m3/d 2 m3/month
⑨
④
⑤
③
②
① ⑩
260 m3/d
250 m3/d
220 m3/d
30 m3/d
30 m3/d
30 m3/d
⑧
Water well
240 m3/d
5.5 t/d
Figure 1 Block Flow Diagram

P-145
2.2 Unit Consumption
Unit consumption of raw materials and utilities are shown in Table 3.
Table 3 Unit Consumption of Raw Materials and Utilities Material used Consumption Expenses Total quantity
I. Semi finished products
1.bamboo
2.Caustic soda
3.Water
4.Fuel oil
5.Energy
II. Finished products
1.Reel paper
2.Methanol
3.Acetate
4.Polivinyl
5.Printing color
6.Soft silver
2.1
0.126
90.9
445
757
1.0
22.2
7.4
8.8
1.4
2.2
t
t
m3
l
kWh
t
kg
kg
kg
kg
kg
300,000 VND/t
3,900,000 VND/t
2,000 VND/m3
1,800 VND/l
810 VND/kWh
3,200,000 VND/t
5,600 VND/kg
13,000 VND/kg
15,600 VND/kg
60,000 VND/kg
70,000 VND/kg
3,675 t
220.5 t
159,075 m3
718,750 l
1,324,750 kWh
1,750 t
38,850 kg
12,950 kg
15,400 kg
2,450 kg
3,850 kg
3. Industrial Wastewater Treatment
The factory uses 240 tons of water per day, and has a biological wastewater
treatment system of a 240 t/day capacity. The results of wastewater analysis are
shown in Table 4.
4. Finance

P-146
Table 4 Result of Wastewater Analysis
Sampling date : 11 December 1999
Sampling No 2 3 4 5 6 7 8 9 10
Temperature ℃ 19.6 22.7 22.5 23 23.8 22.8 23.2 22.1 21.5
pH 9.14 7.75 7.66 9.23 9 8.74 7.2 7.78 6.5
Elec. Conductivity ΜS/cm
Turbidity NTU 12250 1180 1170 2180 1830 1920 1970 1990
Oil content mg/l 23 *A
BOD mg/l 429 498 49 89 0
COD mg/l 14464 461 477 2098 1621 1971 938 922 0
DO mg/l 0.65 3.45 3.53 6.21 4.9 0.29 1.32 0.49 6.03
VSS mg/l 96.4 19.2 27 327.5 198.4 252.1 157.3 14.4 3.17
TSS mg/l 210 24 94 426 180 300 173 98 8
Total Nitrogen mg/l 21.4 0.04
Residual Chlorine mg/l 0.02 *A.
SO4 2- mg/l 28.6 108.4 120.6 358 342.4 251.8 427 418.2 12.2
S2- mg/l
Cyanogen mg/l 0.18 0.07
Phenol mg/l 0.047 *A
Na mg/l 623.5 532.7 361 243 293 248 443 386 184.3
CaCO3 mgeq/l 80 40 15 63 20 24 25 24 58
Cu mg/l 1.58 0.09
Pb mg/l trace trace
Cd mg/l trace trace
Hg mg/l trace trace
Cr(VI) mg/l 0.107 0.02
Zn mg/l
Salt %
Note :*A : not detected
5. Recommendations
① It is necessary to spray caustic soda all the way to the portion of chips
accumulated at the edge of the pit. This is because if caustic soda is sprayed
only to the center of the pit, chips in the center will over-dissolve and chips on
the edge will remain undissolved. It is better to use a PVC piping system for
spraying equally.
② The size of the chips should be less than that of a pack of cigarettes, and be
arranged in the same size.

P-147
③ It is necessary to prevent sticky compounds from attaching on the surface of
the dryer. If this is not done, paper break will occur.
④ It is necessary to adjust the angle of the "doctor" and maintain it at about 30
degrees.
⑤ Sticky compounds should be washed off from wire, rolls etc. using high pressure
water. Washing should be done with warm water. In order to conserve warm
water, it is recommended that a vibration apparatus for showering be used.
Also to cut-back on the consumption of water, fiber should be recovered from
each paper machine and the sticky compounds should be removed. In order to
recover fiber, a settler made of concrete should be installed, and also clean
water should be recovered.
⑥ The diameter of the roll of the press should be enlarged to reduce the content of
water in the paper.
⑦ The wire of the cylinder is scarred and must be repaired by welding.
⑧ It is necessary to equip a digester (may be purchased from a HCMC mill) and a
black liquor recovery system for the reduction of caustic soda consumption.
⑨ It is suggested that the doctor blade be installed on the opposite side of its
present location to prevent fiber from dropping on to paper sheets.

P-148

P-149
CASE STUDY P-20
Thanh long Paper Factory
Survey date : 15 December 1999
1. General
1.1 Company Profile
Thanh Long Paper Factory, established in 1996, is private paper company.
Table 1 shows the company profile.
Table 1 Company Profile
Name of the Company Thanh long Paper Factory
Ownership Local state government
Address Thanh long, Hien Nam, Hung yen Province
Establishment 1971
Number of employees 120 (3 shifts,300 days operation/y)
1.2 Business Status
Table 2 shows production and sales of this company in 1971.
Production capacity of this company for Kraft pulp is 1800 ton/year.
Table 2 Production and Sales in 1998
PRODUCTS
PRODUCTION
(ton/year)
SALES
(VND)
Kraft Paper 1,800 3,200,000VND/T
2. Production Technology
2.1 Process
Figure 1 shows the process flow of this factory.
2.2 Unit consumption
The unit consumption of raw material and utilities are shown in Table 3.

P-150
Boiler
Paper materialWashing paper
Canal
Freshwater
P.M. 1 P.M. 2
Dryer Dryer
Product ProductWastewater
Canal
⑨
⑧
⑦
⑥⑩
Raw materil(Recycle paper)(Waste paper)
Figure 1 Block Flow Diagram of the Factory

P-151
Table 3 Unit Consumption of Raw Materials and Utility
MATERIAL USED
QUANTITY
(ton/year)
EXPENSES
(VND)
Paper Products:
1. Recycle paper
2. River Water
3. Electric power (kWh)
4. Coal
5. NaOH
1,800 t/year
2,250 t/year
110,000 m3/year
1,680,000 kWh
1,500 t/year
3 t/year
5,000,000 VND/t
1,400,000 VND/t
850 VND/m3
770 VND/kWh
300,000 VND/t
4,000,000 VND/t
Total
3. Industrial Wastewater Treatment
Table 4 shows the results of wastewater sample analysis.
4. Finance
Investment: government
The company currently has no bank loans.
5. Recommendation
① A de-inking apparatus should be installed and a flotater, screen, and cleaner
should be used on this apparatus to eliminate ink and sticky compounds.
Through the use of this method it will be possible to prevent product quality
deterioration and paper break.
② It is necessary to prevent sticky compounds from attaching on the surface of the
dryer. If this is not done, paper break will occur.
③ It is necessary to adjust the angle of the "doctor" and maintain it at about 30
degrees.
④ Sticky compounds should be washed off from wire, rolls etc. using high pressure
water. Washing should be done with hot water. In order to conserve hot
water, it is recommended that a vibration apparatus for showering be used.
Also, to cut-back on the consumption of water, fiber should be recovered from
each paper machine and the sticky compounds should be removed. In order to
collect fiber, a concrete settler should be installed, and also, clean water should
be recovered.
⑤ The diameter of the roll of the press should be enlarged to reduce the content of

P-152
water in the paper.
⑥ It is necessary to prevent heavy material and colors from sticking on the paper
sheet surfaces. This facility needs a system which can help it pump finer
water and reduce deposits. Not only will the process be faster and quicker, but
the paper sheet surface will also be smoother. According to the capacity of this
factory, it is necessary that each machine have 3 cyclones.
Table 4 Results of Wastewater Analysis
(15 December 1999) Sampling No Unit 6 7 8 9 10
Temp ℃ 21.4 20.3 20.1 20 19.8
pH 8.44 8.03 7.94 7.94 7.91
Elec. Conductivity μS/cm 1798.5 2717.3 2645.5 2717 3937
Turbidity NTU 590 225 174 187 67
Oil content mg/l 0.02 0.01
BOD mg/l 26.9
COD mg/l 13250 8110 7360 8320 81.5
DO mg/l 5.7 5.14 5.07 4.68 4.92
VSS mg/l
TSS mg/l 204 72
Total Nitrogen mg/l 10.3 3.9
Residual Chlorine mg/l Trace 1.06
SO4 2- mg/l 261.4 23.4
S2- mg/l
Cyanogen mg/l 0.02 Trace
Phenol mg/l 0.268 0.036
Na mg/l 261 238 232 283 210
CaCO3 mg/l 216 110 135 139 84
Cu mg/l 0.24 0.21 0.17 0.18 0.1
Pb mg/l trace trace
Cd mg/l 0.002 trace
Hg mg/l trace trace
Cr(VI) mg/l 0.102 0.07
Zn mg/l
Salt % 0.02 0.01 0.01 0.01 0

P-153
CASE STUDY P-21
Muc Son Paper Factory
Survey date: 16 December 1999
1. General
1.1 Enterprise Profile
The Muc Son Paper Factory was, established in 1969, as a state owned paper
company. The company profile is shown in Table.1
Table 1 Company Profile
Name of the Company Muc Son Paper Factory
Ownership State-owned
Address Lam son, Tho Xuan, Thanh Hoa Province
Tel / Fax 037 834 074 / 037 834 099
Establishment 1969
Number of employees (3 shifts,7days operation/week)
Main Products
1.2 Business Status
Table 2 shows production and sales of the company in 1998. Production
capacity for Kraft Pulp is 6,000 tons/year using 3 sets of equipment made in China.
Table 2 Production and Sales in 1998
PRODUCTS (1998)
PRODUCTION (ton/year)
TURNOVER (1000 VND)
Kraft Paper 4,000 20,000,000
2 Production Technology
2.1 Process
Figure 1 shows the process flow of this company.
2.2 Unit consumption
The unit consumption of raw materials and utilities are shown in Table 3.

P-154
Bamboo
Cutting
Digestion
Hollandmilling
Platemilling
Papermachine
Roll upmachine
Paperproduct
Waste watertreatment
Fresh watertreatment
(mechanical)
From river
RecyclePaper
Wetmilling
Washing
NaOH
Ingredients
Ingredients
Pond
To river
⑨
④
③②
①
⑩
Figure 1 Block Flow Diagram

P-155
Table 3. Consumption of Material and Expenses
MATERIAL USED QUANTITY EXPENSES (VND) For paper production 1. Bamboo (70%)
2. Recycle paper
3. NaOH
4. Coal
5. Water
6. Electricity
4,000 (t/year)
7,000 t/year
1,700 t/year
280 t/year
3,500 t/year
320,000 m3/year
4,000,000 kWh
300,000 VND/t
1,400,000 VND/t
4,000,000 VND/t
300,000 VND/t
850 VND/m3
770 VND/kWh
Total
3. Industrial Wastewater
Table 4 shows the results of wastewater sample analysis.
Table 4 Results of Wastewater Analysis
(16 December 1999)
Sampling No Unit 1 2 3 4 10 10' Temp ℃ 20.8 21.6 20.2 20.6
pH 10.7 7.56 9.32 7.11 7.35 Elec. Conductivity μS/cm 65200 370 2210 210 90 150
Turbidity NTU 27800 64 98 1120 24 38 Oil content mg/l 0.3 0.02 Trace Trace
BOD mg/l 768 16.2 29.7 COD mg/l 63820 6930 - 8990 86 89.6 DO mg/l 0.11 0.76 0.45 0.36 1.81 0.84 VSS mg/l 22 34 TSS mg/l 31220 84 176 1190 28 41
Total Nitrogen mg/l 18.8 14.2 Residual Chlorine mg/l Trace Trace
SO4 2- mg/l 12.2 14.8 S2- mg/l
Cyanogen mg/l Phenol mg/l 0.024 0.014
Na mg/l 312 294 CaCO3 mg/l 21.4 78 208 12 14
Cu mg/l 0.03 0.02 Pb mg/l 0.01 trace Cd mg/l trace trace Hg mg/l 0.217 trace
Cr(VI) mg/l 0.009 0.017 Zn mg/l 0.35 0.37

P-156
4. Finance
Investment: 5,000,000,000VND (from bank)
Profit: 3.5% (700,000,000VND/20,000,000,000VND expenses)
5. Recommendations
① It is necessary to spray caustic soda all the way to the portion of chips
accumulated at the edge of the pit. This is because if caustic soda is sprayed
only to the center of the pit, chips in the center will over-dissolve and chips on
the edge will remain undissolved. It is better to use vinyl pipes for spraying
equally.
② The size of chips should be less than the size of a cigarette pack, and they
should all be arranged in the same size.
③ It is necessary to prevent sticky compounds from attaching on the surface of
dryer. If not, it causes a break in the paper.
④ It is necessary to adjust the angle of the "doctor" and maintain it at about 30°.
⑤ Sticky compounds should be washed off from wire, rolls etc. using high pressure
water. Washing should be done with hot water. In order to conserve hot water,
it is recommended that a vibration apparatus for showering be used. Also, to
cut-back on the consumption of water, fiber should be recovered from each
paper machine and the sticky compounds should be removed. In order to collect
fiber, a concrete settler should be installed, and also, clean water should be re-
collected.
⑥ The diameter of the roll of the press should be enlarged to reduce the content of
water in the paper.
⑦ For globe-type digesters, it is still possible to recollect steam and black liquor.
Therefore, it is better to collect steam and wastewater then to save chemicals
and energy.