chapter 3 differences: historical and contemporary variations in american family life
TRANSCRIPT
Chapter 3
Differences: Historical and Contemporary Variations in
American Family Life

Chapter Outline
• American Families Across Time• How Contemporary Families Differ From One
Other

True or False?
• Industrialization transformed the role families played in society, as well as the roles women and men played in families.

True
• With industrialization, men began working outside the home for wages they then used to purchase the family’s necessities.
• Men became identified as the family’s sole provider or breadwinner and their work was given higher status than women’s work because it was paid in wages.
• Men’s work began to be increasingly identified as “real” work, distinct from the unpaid domestic work done by women.

True or False?
• Compared with what came both before and after, families of the 1950s were unusually stable.

True
• In the 1950s, marriage and birthrates were unusually high, divorce rates were uncharacteristically low, and the economy enabled many to buy houses with only one wage-earning spouse.
• Most families were comprised of male breadwinners and female homemakers.

True or False?
• Within upper-class families, husbands and wives are relatively equal in their household roles and authority.
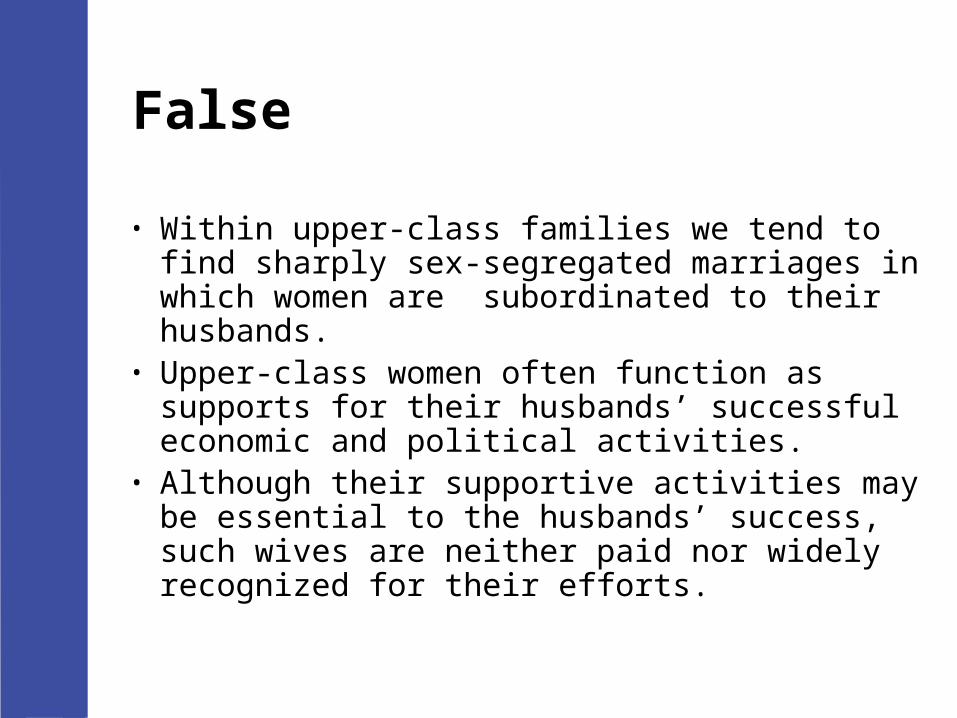
False
• Within upper-class families we tend to find sharply sex-segregated marriages in which women are subordinated to their husbands.
• Upper-class women often function as supports for their husbands’ successful economic and political activities.
• Although their supportive activities may be essential to the husbands’ success, such wives are neither paid nor widely recognized for their efforts.
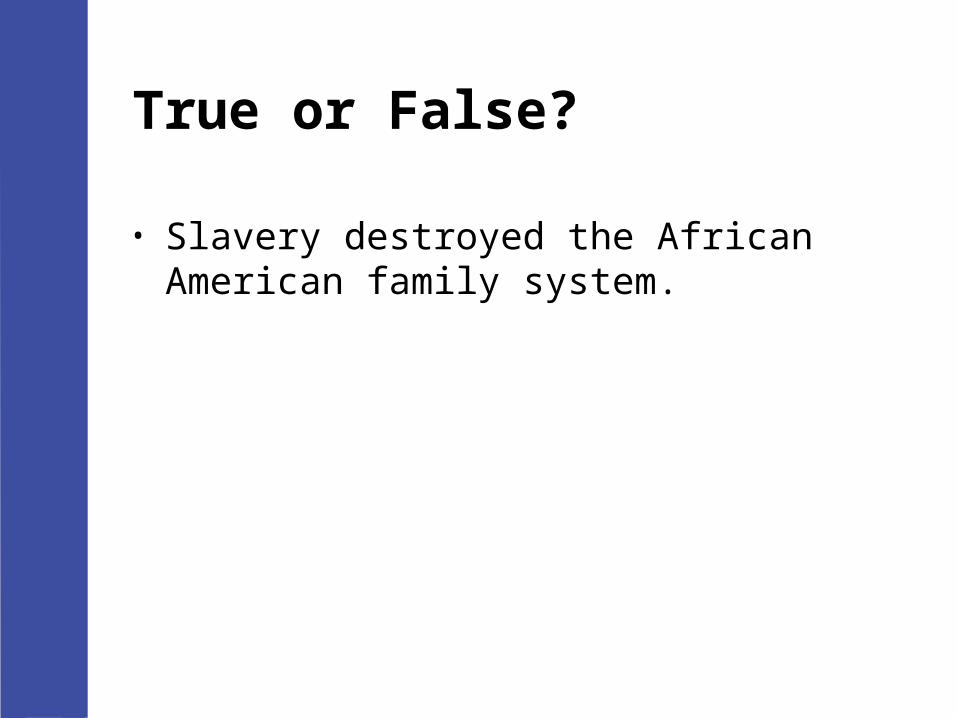
True or False?
• Slavery destroyed the African American family system.

False
• Despite the oppression and hardship to which they were subjected, many slaves survived by relying on their families and by adapting their family system to the conditions of their lives.
• This included relying on extended kinship networks and, where necessary, on unrelated adults to serve as surrogates for parents absent because of the forced breakup of families.
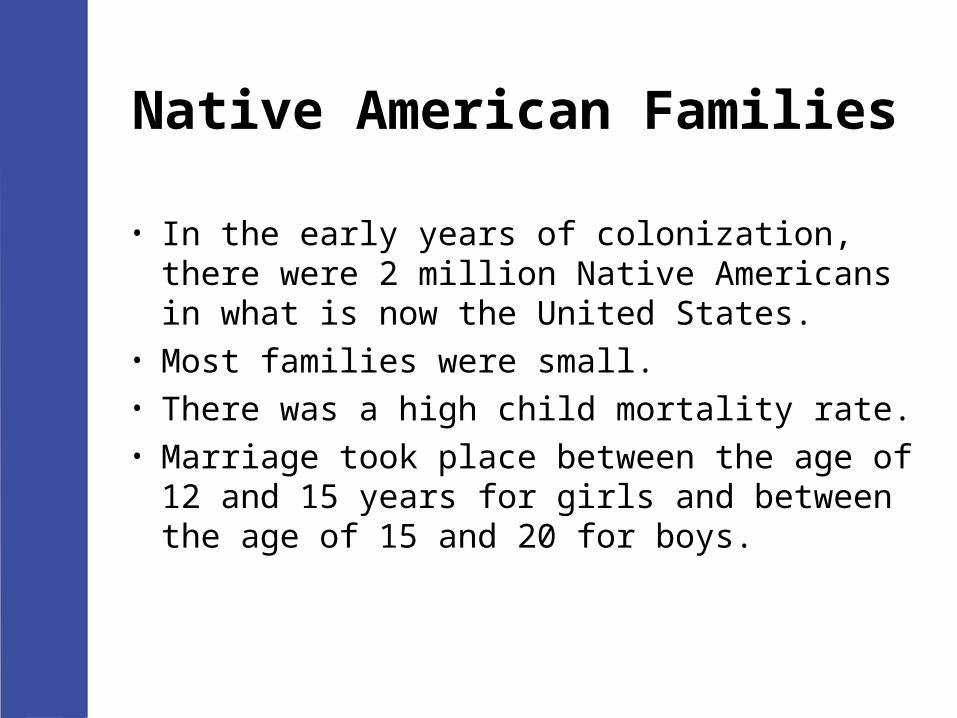
Native American Families
• In the early years of colonization, there were 2 million Native Americans in what is now the United States.
• Most families were small. • There was a high child mortality rate.• Marriage took place between the age of 12
and 15 years for girls and between the age of 15 and 20 for boys.

Colonial Families
• The family was the primary unit for producing goods and caring for the needs of its members.
• Marriages were arranged.• The wife was not an equal, but a helpmate. • Like her children, the colonial wife was
economically dependent on her husband.

Colonial Concept of Childhood
• Children were believed to be evil by nature.• Childhood did not represent a period of life
radically different from adulthood. • When children reached the age of 10, they
were often “bound out” as apprentices or domestic servants.

African-American families
• Began in the United States in the early seventeenth century.
• They continued the African tradition that emphasized kin relations.
• Most slaves lived in two-parent families that valued marital stability.

African-American Families After Freedom
• Thousands of former slaves formally renewed their vows, as they were now legally able to marry.
• The first year or so after freedom was “the traveling time.”– African Americans traveled up and down
the South looking for lost family members who had been sold.
African American Families
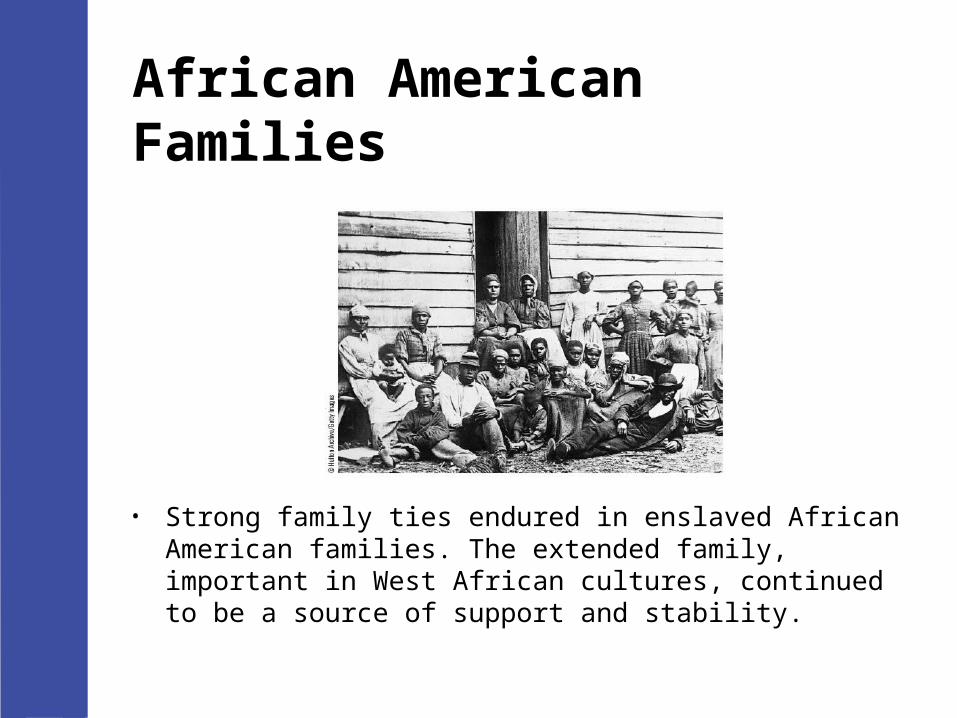
• Strong family ties endured in enslaved African American families. The extended family, important in West African cultures, continued to be a source of support and stability.
Immigration: The Great Transformation
• Between 1820 and 1920, 38 million immigrants came to the United States.
• Kinship groups were important for survival.• The family economy focused on family
survival rather than individual success.

Immigration
• Between 1820 and 1920, more than 38 million immigrants came to the United States.
The Rise of Companionate Marriages: 1900 - 1960
• In the 20th century, companionate marriage became an ideal.– Men and women shared household
decision making and tasks.– Marriages were expected to be romantic.– Wives were expected to be sexually active.– Children were treated more democratically.
The Depression and World Wars
• Family roles and relationships were profoundly affected by the Depression and two world wars.
• Survival depended upon a combination of women’s earnings, children’s earnings, assistance from kin, or public assistance.
• Between 1941 and 1945 the numbers of employed women increased by more than 6 million, to a high of 19 million.

Families in the 1950s
• Marriage and birthrates were unusually high.• Divorce rates were uncharacteristically low.• The economy enabled many to afford to buy
houses with only one wage-earning spouse.

Median Age at First Marriage,1960–2003
Year Males Females
1960 22.8 20.3
1970 23.2 20.8
1980 24.7 22.0
1990 26.1 23.9
2000 26.8 25.1
2003 27.1 25.3
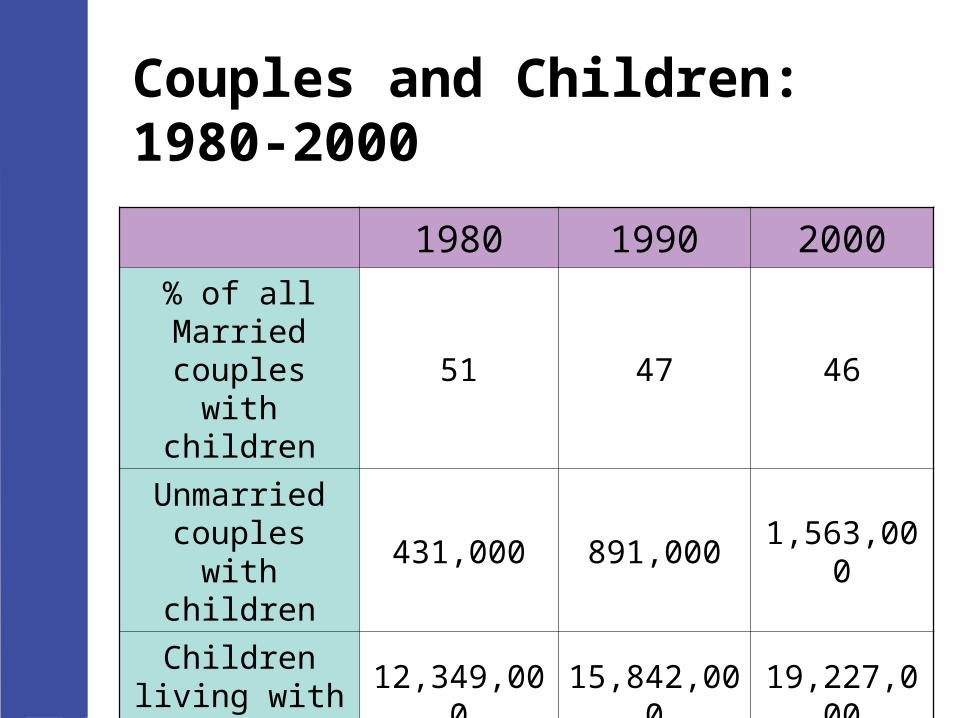
Couples and Children:1980-2000
1980 1990 2000
% of all Married
couples with children
51 47 46
Unmarried couples with
children431,000 891,000 1,563,000
Children living with one parent
12,349,000 15,842,000 19,227,000

Couples and Children:1980-2000
1980 1990 2000
Births to unmarried women
666,000 1,165,000 1,308,000
As % of all births 18% 28% 33%

Trends in Marriages, Divorces and Births: 1980-2005
1980 1990 2000 2005
Married rate 10.6% 9.8% 8.5% 7.4%
Divorce rate 3.5% 5.2% 4.7% 3.7%
Birth rate 15.9 16.7 14.5 14

% of Married Women Employed Outside the Home With Children 6 Years Old or Younger
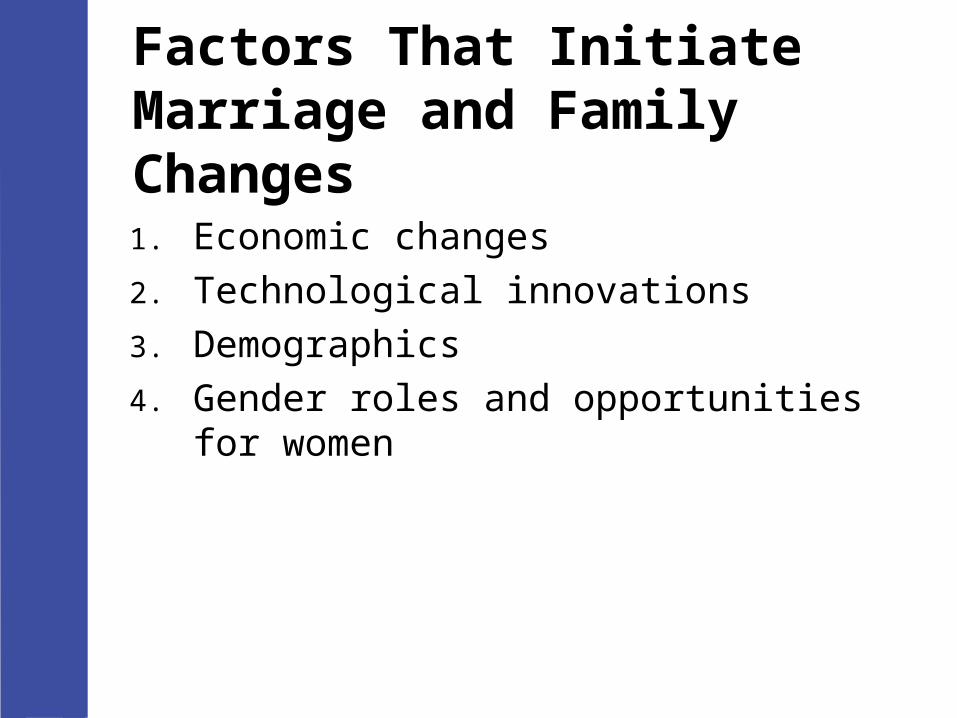
Factors That InitiateMarriage and Family Changes
1. Economic changes
2. Technological innovations
3. Demographics
4. Gender roles and opportunities for women
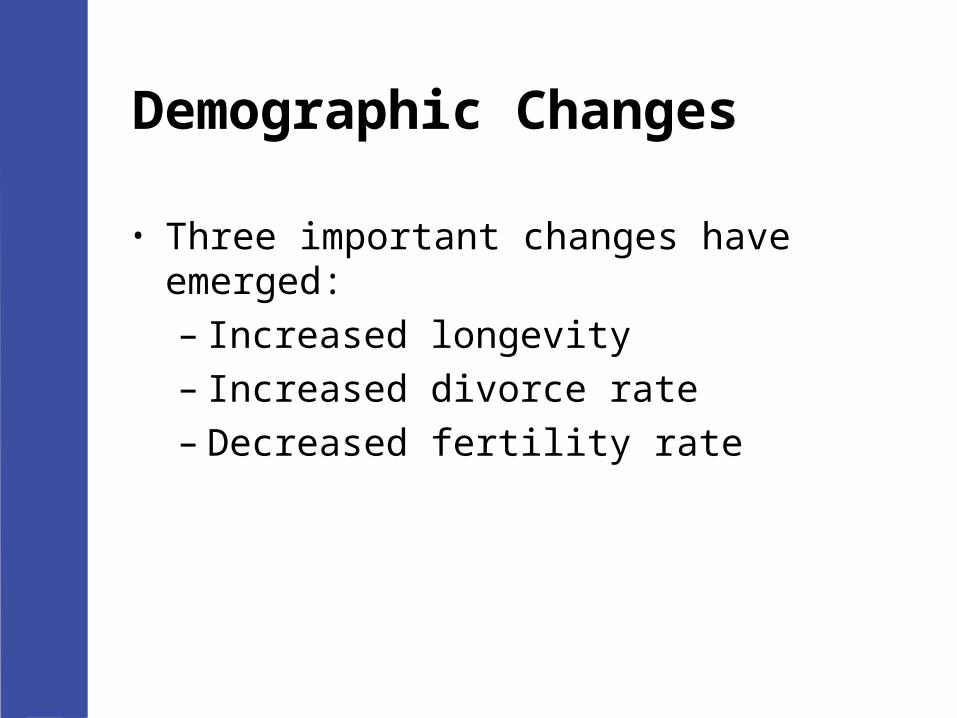
Demographic Changes
• Three important changes have emerged:– Increased longevity– Increased divorce rate– Decreased fertility rate

Social Class
• A social class is a category of people who share a common economic position in the stratified society in which they live.
• Structurally, social class reflects the occupations we hold, the income and power they give us, and the opportunities they present or deny us.
• The cultural dimension of social class refers to any class specific values, attitudes, beliefs, and motivations that distinguish classes from one another.

Social Class and Family Life: Upper Class
• Roughly 7 to 10% of the population occupies this position.
• The uppermost level of this class represents 3% of the population.

Social Class and Family Life: Middle Class
• Represents between 45 to 50% of the population.
• Upper-middle class consists of highly paid professionals (lawyers, doctors, engineers).
• Lower-middle class comprises includes white-collar service workers with incomes between $25,000 and $50,000.

Social Class and Family Life: Working Class
• About a third of the U.S. population is working class.
• Tend to work as skilled laborers, earn between $15,000 and $25,000, and have high school or vocational educations.

Social Class and Family Life: Lower Class
• Close to 20% percent of Americans are poor.• The poverty line was determined by
calculating the annual costs of a “minimal food budget” multiplied by three.
• Families whose incomes are even one dollar above this are not officially classified as poor.

2005 Federal Poverty Guidelines
People in Family Unit
48 Contiguous States and D.C.
Alaska Hawaii
1 $ 9,570 $11,950 $11,010
2 12,830 16,030 14,760
3 16,090 20,110 18,510
4 19,350 24,190 22,260
5 22,610 28,270 26,010

2005 Federal Poverty Guidelines
People in Family Unit
48 Contiguous States and D.C.
Alaska Hawaii
6 25,870 32,350 29,760
7 29,130 36,430 33,510
8 32,390 40,510 37,260
For each additional
person, add3,260 4,080 3,750
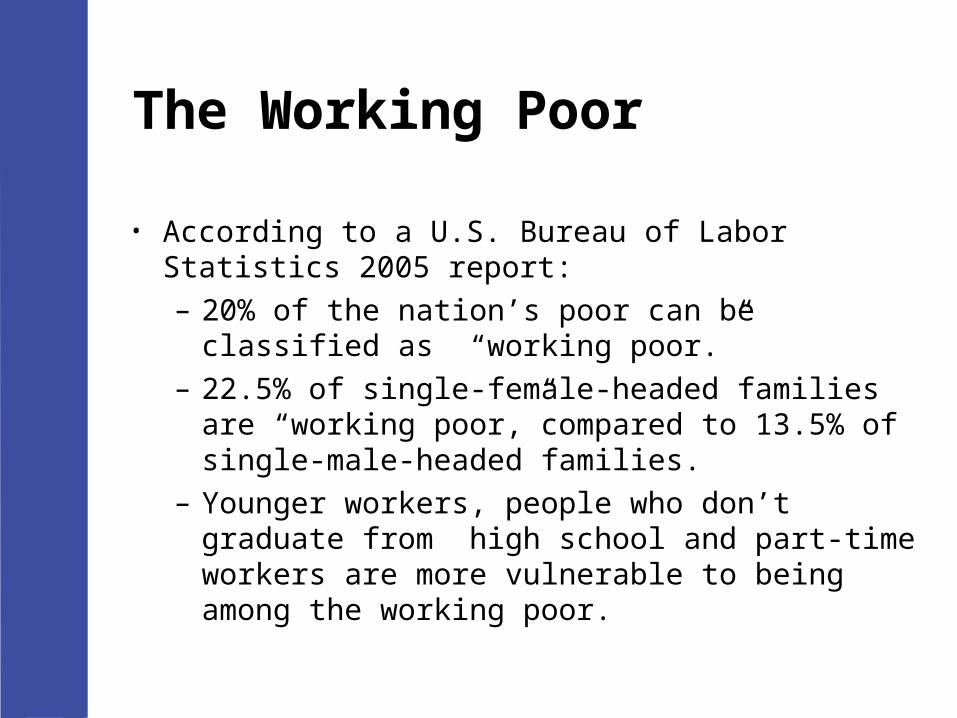
The Working Poor
• According to a U.S. Bureau of Labor Statistics 2005 report:– 20% of the nation’s poor can be classified as
“working poor.” – 22.5% of single-female-headed families are
“working poor,”compared to 13.5% of single-male-headed families.
– Younger workers, people who don’t graduate from high school and part-time workers are more vulnerable to being among the working poor.

Class and Family Life
• Within upper-class families we tend to find sharply sex-segregated marriages in which women are subordinated to their husbands.
• Middle-class marriages tend to be ideologically more egalitarian and are often two-career marriages.
• Working-class couples who work “opposite” shifts, have higher levels of sharing responsibilities.
• Marriages among the lower class are the least stable.
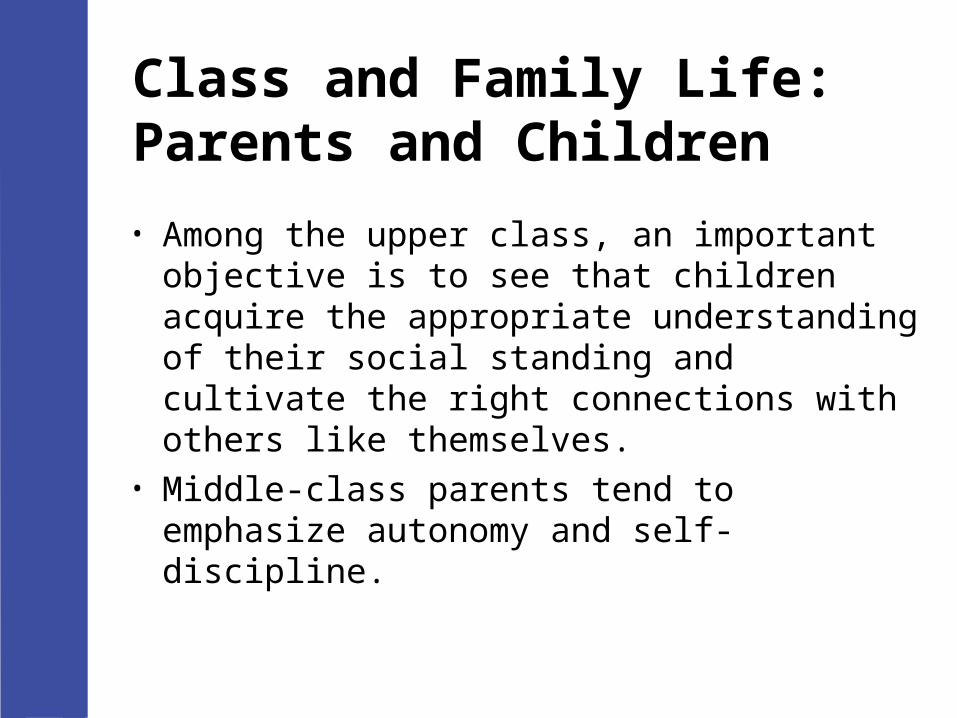
Class and Family Life: Parents and Children
• Among the upper class, an important objective is to see that children acquire the appropriate understanding of their social standing and cultivate the right connections with others like themselves.
• Middle-class parents tend to emphasize autonomy and self-discipline.

Racial and Ethnic Diversity
• According to 2000 census data:– 30% of the U.S. population are people of
color:• 13% are African American• 13% are Hispanic• 4% are Asian/Pacific Islander• 1% are Native American
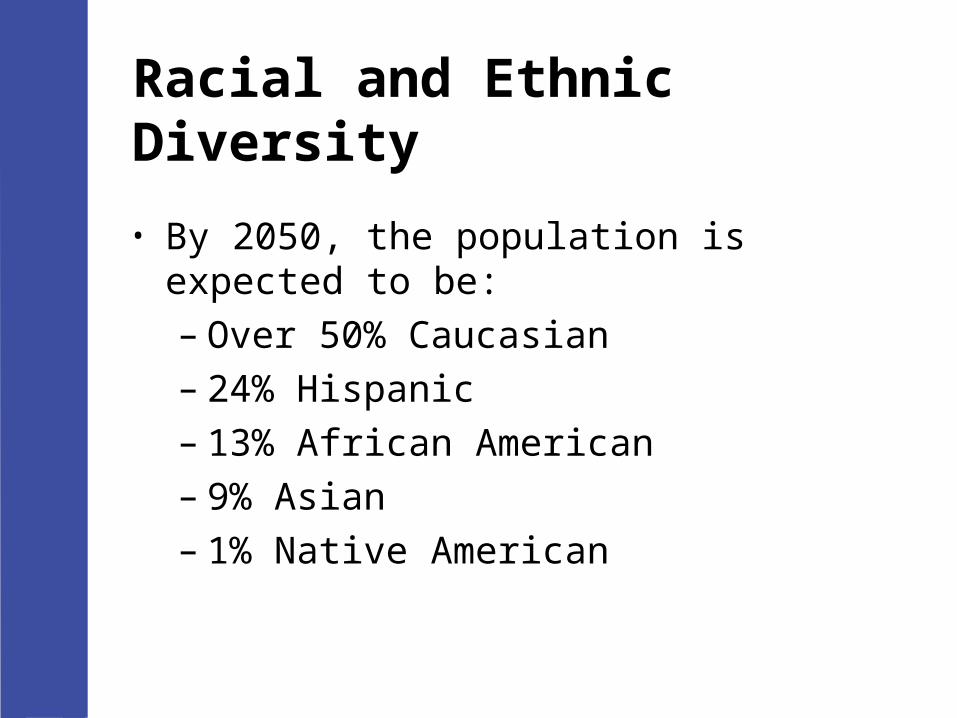
Racial and Ethnic Diversity
• By 2050, the population is expected to be:– Over 50% Caucasian– 24% Hispanic– 13% African American– 9% Asian– 1% Native American
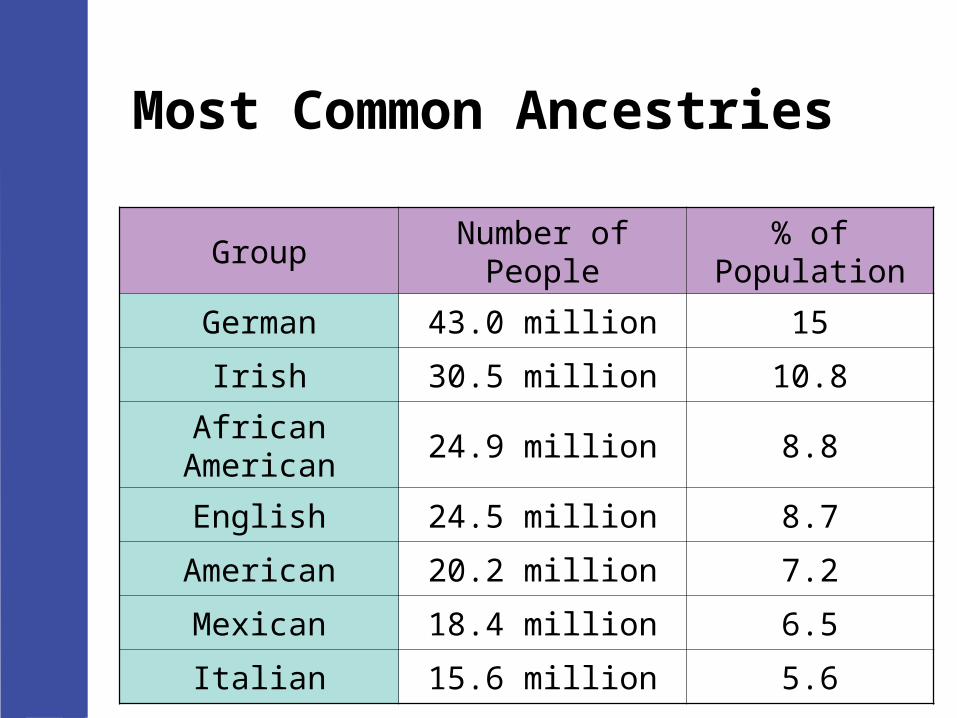
Most Common Ancestries
Group Number of People % of Population
German 43.0 million 15
Irish 30.5 million 10.8
African American 24.9 million 8.8
English 24.5 million 8.7
American 20.2 million 7.2
Mexican 18.4 million 6.5
Italian 15.6 million 5.6


African American families
• According to the 2000 census, the more than 34 million African Americans in the United States represented 12.2% of the population.
• Compared with the total U.S. population, African Americans are younger and less likely to be married.
• Blacks are more likely to bear children outside of marriage and more likely to live in single-parent families.

Features of African-American families
• African Americans are less likely to have completed college (17% versus 29%).
• Median earnings for African Americans who are employed full-time year-round were $27,264 in 2000, (85% of the median for all workers $32,098).
• The percentage of poor blacks is nearly three times the percentage of poor whites (8%) and almost twice the percentage of the general population who are poor (12%).

Race, Ethnicity, and Socioeconomic Status: 2003-2004
WhitesAfrican
AmericanLatinos Asians
Median family
income$55,768 $34,369 $34,272 $63,251
% unemployed
4.8 10.4 7.0 4.4
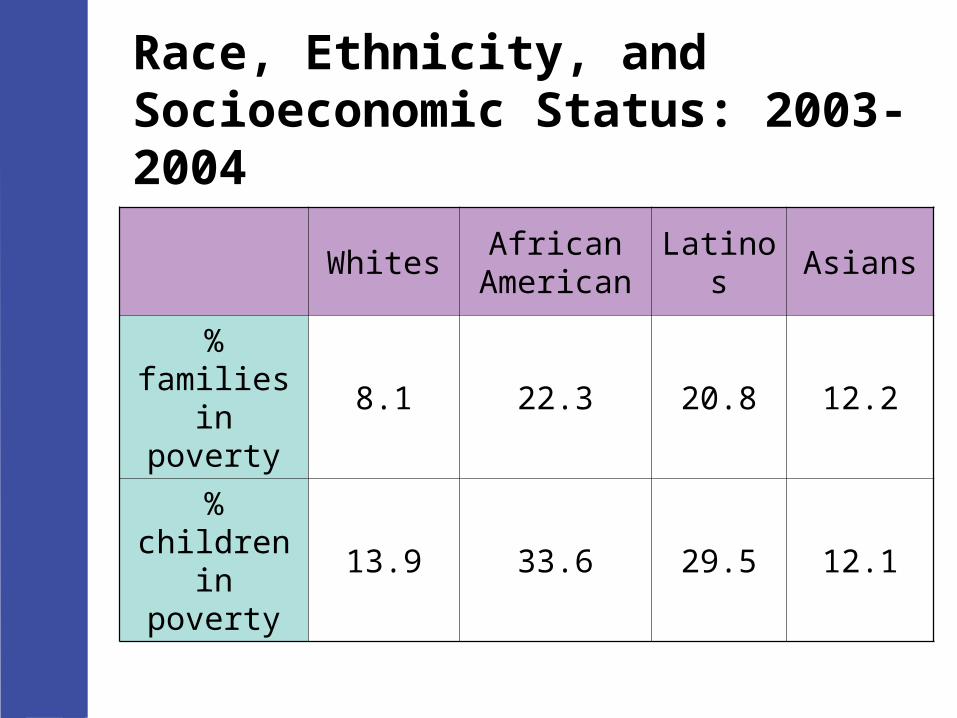
Race, Ethnicity, and Socioeconomic Status: 2003-2004
WhitesAfrican
AmericanLatinos Asians
% families in poverty
8.1 22.3 20.8 12.2
% children in poverty
13.9 33.6 29.5 12.1
Latino Families
• The 2000 census reported 35 million Hispanics, representing 12.5% of the U.S. population.
• It is projected that by 2050, at least 25% of the population will be of Hispanic origin.
• Currently, 65.8% of Latinos are of Mexican descent, 9.4% are Puerto Rican, and another 4% are Cuban.
• The remaining 21% includes 7.8% from Central American countries and 5.2% from South American countries.
Latino Families
• Emphasize extended kin relationships, cooperation, and mutual assistance.
• La familia includes not only the nuclear family but also the extended family.
• Bilingualism helps maintain ethnic identity.

U.S. Hispanic Population for Selected Groups: 2004

Marital Status: Comparisons of Hispanics and Non-Hispanics, 2004
Marital Status U.S. White Non-Hispanic Hispanic
Married 53.3 57 49.9
Widowed 6.1 6.7 3.3
Divorced 9.6 10.1 7.1
Separated 2.0 1.4 3.5
Never Married 29 24.9 36.2
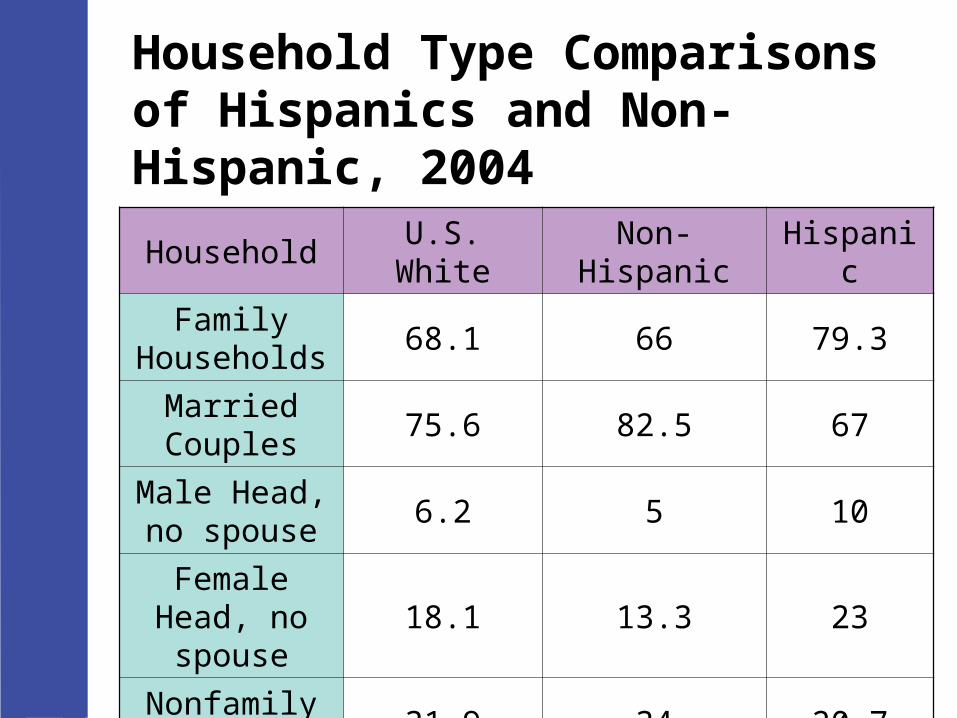
Household Type Comparisons of Hispanics and Non-Hispanic, 2004
Household U.S. White Non-Hispanic Hispanic
Family Households
68.1 66 79.3
Married Couples
75.6 82.5 67
Male Head, no spouse
6.2 5 10
Female Head, no spouse
18.1 13.3 23
Nonfamily households
31.9 34 20.7

Selected Characteristics of the Hispanic Population: 2004
AllMexicanHispanic
Puerto Rican
Cuban
% families in poverty
20.8 22.9 21.1 11.3
% unemployed 7.6 8.3 8.2 4.0
% earning < $25K 34.8 36.7 36 26
% earning>$75K 15.8 13 19.2 24.5

Selected Characteristics of the Hispanic Population: 2004
AllMexican Hispanic
Puerto Rican
Cuban
% living in own home
51.2 52 45.7 71.2
% 25 and older
% with <high school 41.6 48.1 28.2 27.9
% with college or > 12.1 7.9 14.1 24
Asian Americans
• As of 2002, Asian Americans and Pacific Islanders made up more than 4% of the U.S. population.
• The largest Asian American groups are Chinese Americans, Filipino Americans, Asian Indians, Koreans,Vietnamese, and Japanese Americans.
• Groups such as Cambodians, Laotians, and Hmong first came to this country in the 1970s as refugees from the upheavals resulting from the Vietnam War.
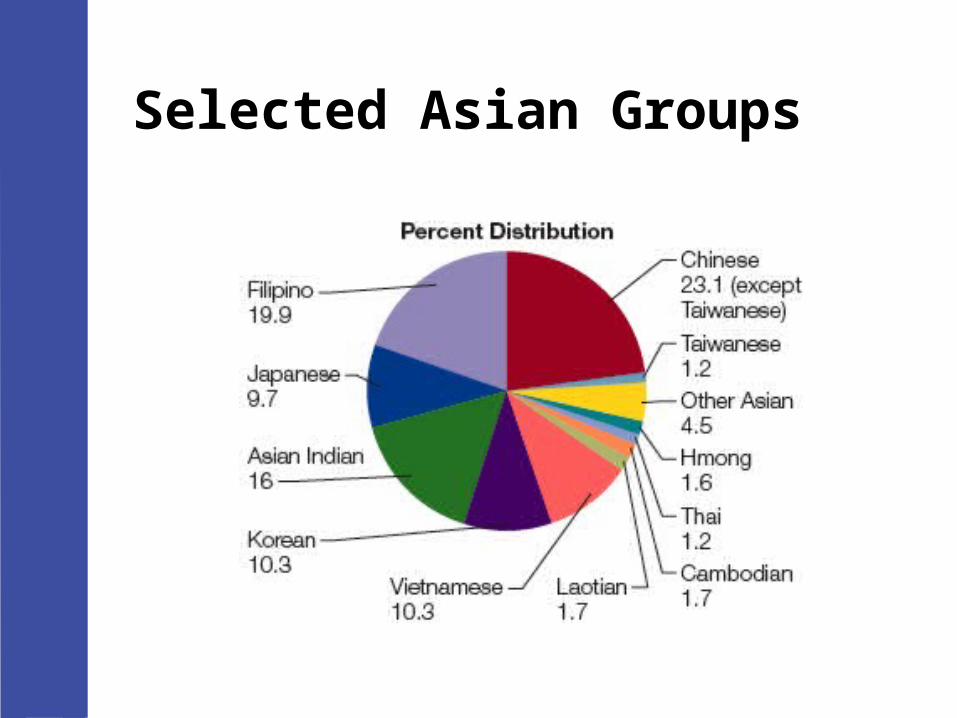
Selected Asian Groups
Native Americans
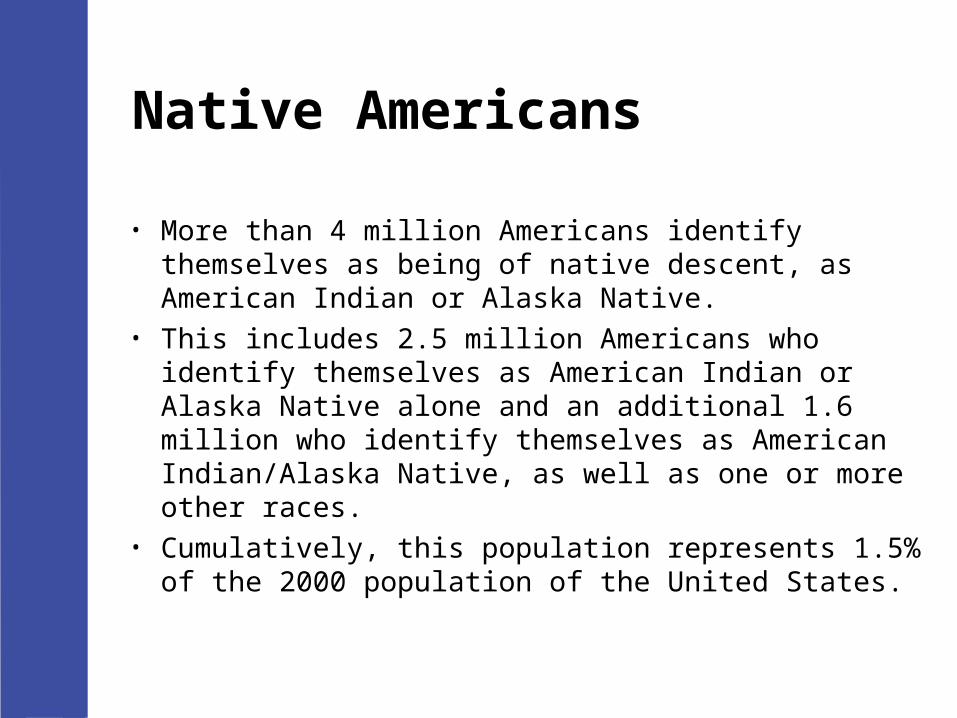
• More than 4 million Americans identify themselves as being of native descent, as American Indian or Alaska Native.
• This includes 2.5 million Americans who identify themselves as American Indian or Alaska Native alone and an additional 1.6 million who identify themselves as American Indian/Alaska Native, as well as one or more other races.
• Cumulatively, this population represents 1.5% of the 2000 population of the United States.

Largest American Indian Tribal Groupings, Census 2000
Tribal Group# Identifying
Native American Alone
# Identifying Native American in Combination
Total 2,475,9561,643,345
Cherokee 281,069 448,464
Navajo 269,202 28,995
Latin American Indian
104,354 76,586
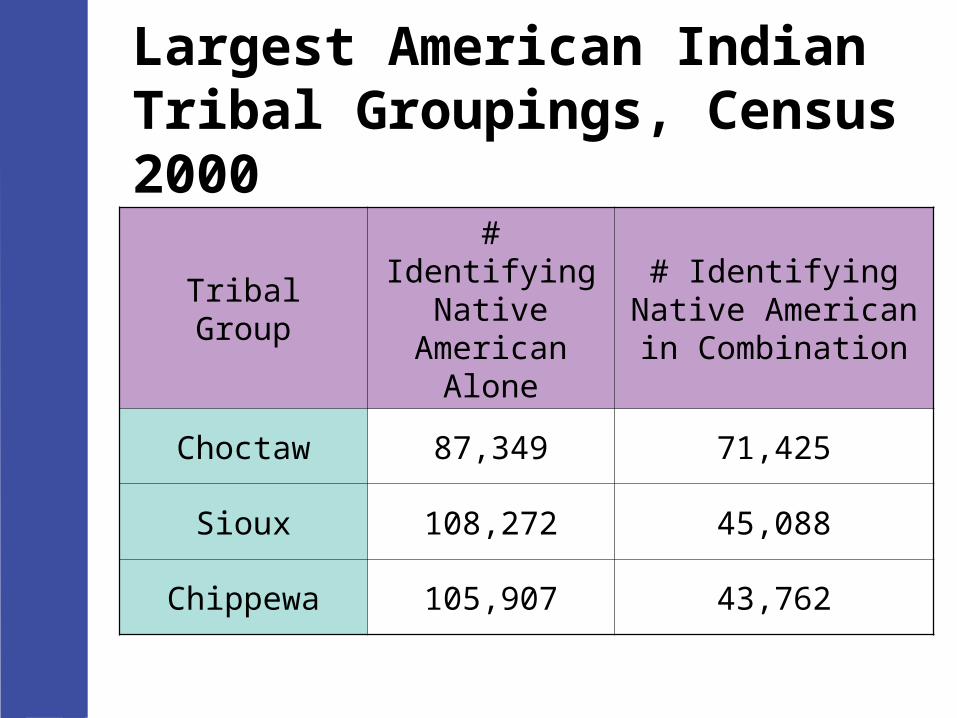
Largest American Indian Tribal Groupings, Census 2000
Tribal Group# Identifying
Native American Alone
# Identifying Native American in Combination
Choctaw 87,349 71,425
Sioux 108,272 45,088
Chippewa 105,907 43,762

American Indian and Alaska Native populations: Features
• 73% of American Indian and Alaska Native households were family households, of which 59% had children under age 18 living with them.– 61% of family households were married
couple families, of which 57% had children under 18.
– 28% of family households were female-headed families with no husband, of which 64% had children under 18.

American Indian and Alaska Native populations: Features
• Where 80% of the general population, age 25 and older, had completed high school, 71% of the American Indian and Alaska Native populations had.
• Of the American Indian and Alaska Native populations, 11.5% had completed college, compared to 24.4% of the general population.
• Native populations were twice as likely to be unemployed, twice as likely to be below poverty, and had substantially lower median household and family incomes.
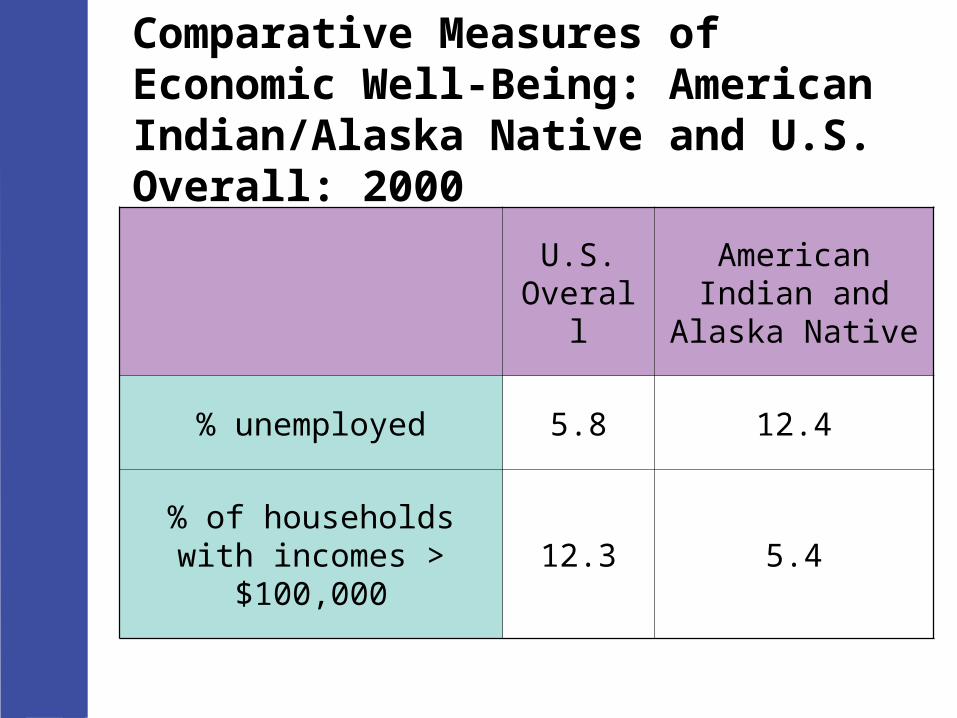
Comparative Measures of Economic Well-Being: American Indian/Alaska Native and U.S. Overall: 2000
U.S. Overall
American Indian and Alaska Native
% unemployed 5.8 12.4
% of households with incomes > $100,000
12.3 5.4
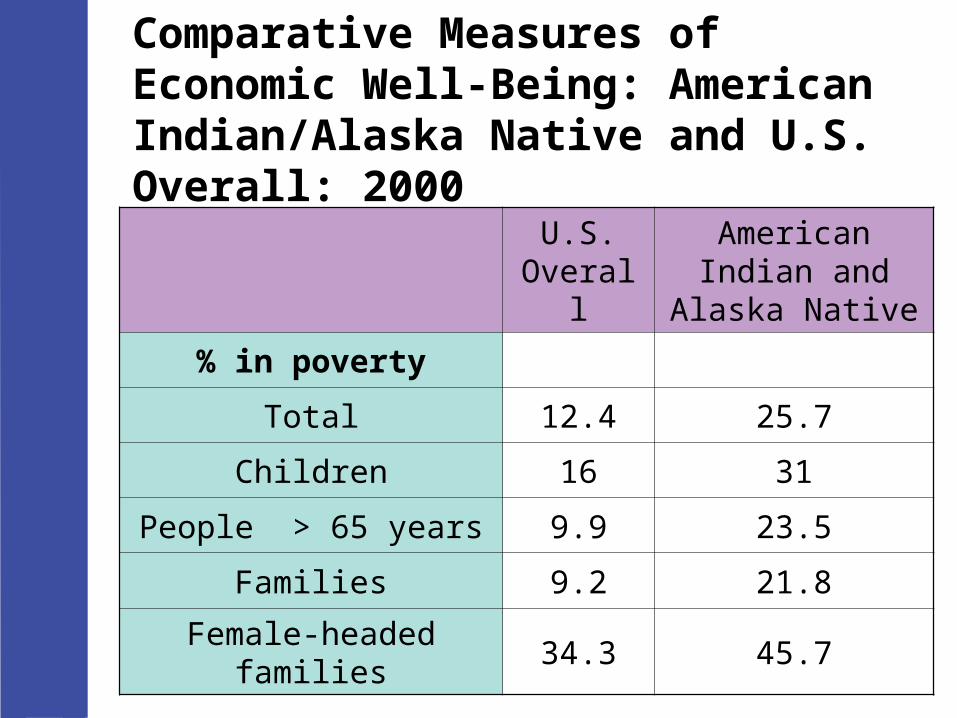
Comparative Measures of Economic Well-Being: American Indian/Alaska Native and U.S. Overall: 2000
U.S. Overall
American Indian and Alaska Native
% in poverty
Total 12.4 25.7
Children 16 31
People > 65 years 9.9 23.5
Families 9.2 21.8
Female-headed families 34.3 45.7

Families of Middle Eastern Backgrounds
• The U.S. census estimates that 1.2 million people claim some Arab ancestry, either alone or in combination.
• The Center for Immigration Studies states that Middle Eastern immigrants numbered closer to 1.5 million in 2000, with 40% of Arab background.
• The center further estimates that within a decade (that is, by 2010) the number is likely to be 2.5 million or more.

U.S. Census: Arab Population in the U.S.
• Three ancestry groups, Lebanese, Syrian, and Egyptian, account for 60% of the Arab population.
• The Arab population, spread fairly evenly across the four regions of the United States, is proportionately found in just five states, California, Florida, Michigan, New Jersey, and New York.
• The city with the largest Arab population is New York City,with 69,985 people of Arab ancestry.

U.S. Census: Arab Population in the U.S.
• The Arab American population is more likely than the total population to be married and less likely to be widowed, separated, or divorced.
• Arab Americans tend to be highly educated, employed, and have higher incomes than the total population.
• Arab women are much less likely to be in the labor force than are women overall.

Socioeconomic Differences: Arab Americans and U.S. Overall
Arab U.S.
With high school 84 80
With undergraduate degree
40 24
Median Family Income $52,318 $50,046
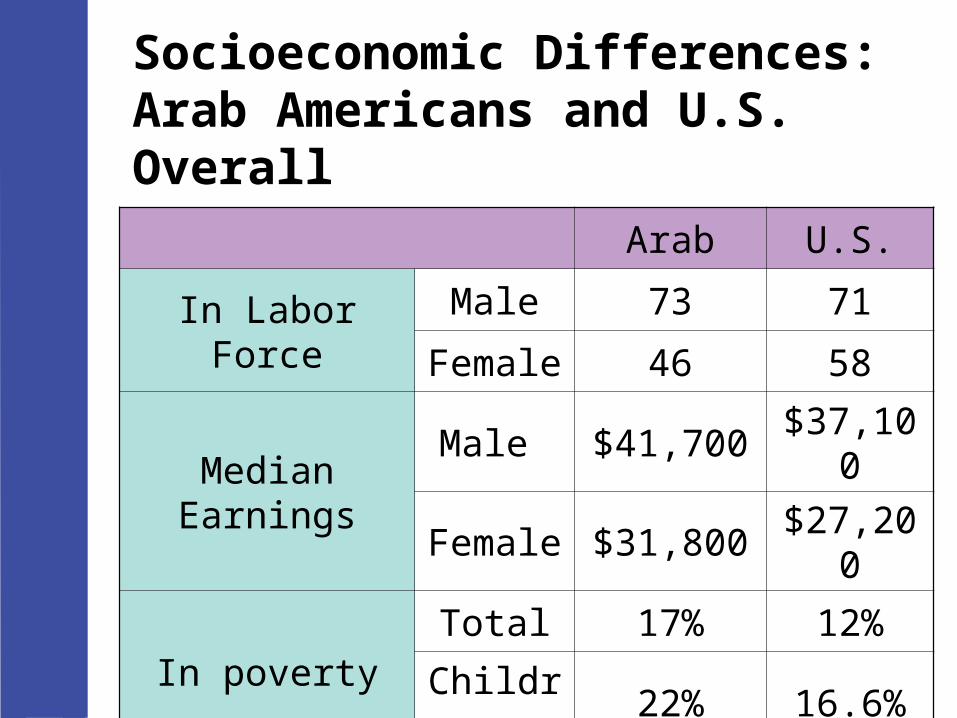
Socioeconomic Differences: Arab Americans and U.S. Overall
Arab U.S.
In Labor ForceMale 73 71
Female 46 58
Median Earnings
Male $41,700 $37,100
Female $31,800 $27,200
In povertyTotal 17% 12%
Children 22% 16.6%