chapter 3 - oecd · chapter 3. trade, employment and structural change: the australian experience...
TRANSCRIPT

CHAPTER 3. TRADE, EMPLOYMENT AND STRUCTURAL CHANGE: THE AUSTRALIAN EXPERIENCE– 113
POLICY PRIORITIES FOR INTERNATIONAL TRADE AND JOBS © OECD 2012
Chapter 3
Trade, Employment and Structural Change:
The Australian Experience
Greg Thompson, Tim Murray and Patrick Jomini
Australian Productivity Commission
International trade produces income gains across the world by facilitating an efficient allocation of production among trading countries. However, increased trade exposure also creates some challenges, and there are adjustment costs associated with changing trade patterns. Effective complementary policies, by promoting flexibility and adaptation within economies, can reduce adjustment costs associated with increased trade, and therefore ensure the benefits are maximised. This paper highlights these issues with reference to recent experience in Australia. Computable General Equilibrium modelling shows how the recent improvement in Australia’s terms of trade is likely to have increased incomes and that the magnitude of these gains is directly linked to the degree of flexibility of the economy.

114 – CHAPTER 3. TRADE, EMPLOYMENT AND STRUCTURAL CHANGE: THE AUSTRALIAN EXPERIENCE
POLICY PRIORITIES FOR INTERNATIONAL TRADE AND JOBS © OECD 2012
3.1. Introduction
International trade produces income gains that accrue across nations by facilitating an
efficient allocation of production across the world.1 However, communities and policy makers
are often concerned about the effect that international trade might have on particular domestic
industries, and the amount of employment. Traditionally, the debate has focused on the potential
loss of domestic jobs in import-competing industries following trade liberalisation. But similar
considerations arise when a country is already open to international trade, and the forces for
structural adjustment stem from changes in world prices.
Trade and trade policy have not, of themselves, been found to have significant effects on
employment in aggregate. Essentially trade policy allows a country to move along its production
frontier to maximise returns from international exchange. As Krugman (1993) notes:
… the level of employment is a macroeconomic issue, depending in the short run on
aggregate demand and depending in the long run on the natural rate of unemployment, with
microeconomic policies like tariffs having little net effect. (p. 25)
That said, if trade openness were to promote increased national aggregate productivity, it
could expand a country‘s production frontier. Interactions between trade shocks and labour
market settings also have possible implications for aggregate employment. There is the potential
for complementary policies (such as policies relating to the labour market) to affect the outcome
of trade policies across several dimensions, but especially with regard to associated adjustment
costs.
Openness to international trade in Australia has been increased by reducing barriers to
imports while simultaneously implementing a range of competition-enhancing reforms
domestically. Australia‘s trade intensity has nearly doubled over the past 50 years through
increased integration with trading partners. Reforms have contributed to growth in real incomes,
and international trade has been an important contributor to Australian income growth, most
recently through an improvement in terms of trade.
At the same time, increased trade exposure and external shocks have created some
challenges. Large changes in the relative prices of exports and imports are responsible for some
recent adjustment pressures.
The purpose of this paper is to illustrate the mechanisms that link trade, income and
employment in Australia. A framework section is followed by an overview of the Australian
experience. Various modelling approaches have been used to estimate the likely contribution of
liberalisation, and of the recent rise in Australia‘s terms of trade, to incomes and sectoral
employment changes, and the role of flexibility in facilitating the structural changes required to
reap the benefits of trade. Computable General Equilibrium (CGE) modelling – including a
study developed for this paper – shows how the recent improvement in Australia‘s terms of trade
is likely to have increased incomes and that the magnitude of these gains is directly linked to the
flexibility of the economy.
1. The views expressed in this paper are those of the staff involved and do not necessarily reflect the views of
the Productivity Commission, the OECD, OECD Member Countries or partner organisations of the
International Collaborative Initiative on Trade and Employment (ICITE).
Thanks to Philip Harslett for modelling assistance and Lisa Gropp for valuable input into previous drafts.

CHAPTER 3. TRADE, EMPLOYMENT AND STRUCTURAL CHANGE: THE AUSTRALIAN EXPERIENCE– 115
POLICY PRIORITIES FOR INTERNATIONAL TRADE AND JOBS © OECD 2012
3.2 Links between trade and employment – framework
Trade allows countries to specialise in the areas in which they have a comparative advantage
– that is, where the opportunity costs of resources are lowest. Specialisation leads to an increase
in activity and employment in the export sector. At the same time, consumers can purchase
imported commodities at lower prices than if trade were restricted.
Trade liberalisation triggers a restructuring process, which causes some jobs to be lost, and
new ones to be created (ILO and WTO, 2007). Specialising in the areas of comparative
advantage shifts resources to their most productive use, increasing the value of aggregate
production and incomes. Openness to trade (and competition from foreign firms) also
encourages producers to search for more efficient production processes, and can improve their
future prospects.
A reduction in import price and an increase in export prices both contribute to increasing real
incomes, although they can require significant adjustments. Notwithstanding the benefits of
liberalisation and of terms of trade improvements, the induced contraction of some sectors and
the expansion of others in response to price signals involve adjustments (Box 3.1). Factors of
production such as buildings and machinery either need to be put to other uses or written off.
Workers who become unemployed need to be able to move to other jobs. That said, trade is not
the only cause of structural change – improvements in technology, changes in demography and
consumer tastes, etc also contribute to continuous structural change.
Box 3.1. Income and adjustment effects of a mining boom
The recent expansion in Australian mining activity has revived interest in the sectoral and employment effects of growth in export industries. In an early contribution, Gregory (1976) examined the effect of new mineral discoveries on a „traditional‟ (rural) export sector and an import competing sector. Work in this area was extended by Snape (1977), Corden and Neary (1982) and Cook and Sieper (1984), among others, and is relevant to the analysis of the effects of new mineral discoveries, as well as of changes in the terms of trade.
The forces behind the structural adjustment to a resource boom can be reduced to expenditure and resource reallocation effects, which are effected via changes in real exchange rate and relative price signals:
The expenditure effect arises from the increase in real income due to the new discovery or terms of trade improvement. Some increased income is directed to expenditure on non-traded goods. As a consequence, the real exchange rate appreciates and puts pressure on the other parts of the economy, especially the non-booming traded sector.
The resource movement effect arises from resources (labour and capital) moving into the mining sector in response to increased returns in that sector and into the non-traded sector as a result of its expansion.
The contraction in non-mineral exports and import-competing industries is often referred to as the “Gregory thesis”, “de-industrialisation”, or “Dutch Disease” (named after the perceived effects on manufacturing in the Netherlands following the discovery of North Sea gas in the 1970s).
In practice, structural adjustment takes time and is not costless. Many factors can hinder
labour mobility, particularly in the short run. These can include various barriers to geographic
mobility (for example, relocation costs) or limited transferability of skills across and within
sectors (resulting in re-training costs). Inflexible or distorted prices can also affect the speed and
degree of adjustment, by preventing prices from transmitting vital signals to buyers and sellers.
In turn, this hinders the ability of resources to move to areas in which they can be used most
productively, reducing efficiency and the potential gains from trade.

116 – CHAPTER 3. TRADE, EMPLOYMENT AND STRUCTURAL CHANGE: THE AUSTRALIAN EXPERIENCE
POLICY PRIORITIES FOR INTERNATIONAL TRADE AND JOBS © OECD 2012
3.3 The Australian experience
Increased ‗interconnectedness‘, decreasing transport costs and trade and travel market
liberalisation have all contributed to opening of the Australian economy, and led to significant
changes in the structure of its trade, output and employment.
Trade: volumes, assistance and prices
Australia‘s linkages with overseas economies have steadily increased (Figure 3.1). Over the
past 50 years, Australia‘s trade intensity (the ratio of exports and imports to GDP) has nearly
doubled, increasing from around 25% of GDP in 1975 to over 45% by 2010.
Figure 3.1. Australia’s trade in goods and services, 1976–2010
Chain volume indexes, seasonally adjusted
20
25
30
35
40
45
50
55
0
50
100
150
200
250
300
350
19
76
19
78
19
80
19
82
19
84
19
86
19
88
19
90
19
92
19
94
19
96
19
98
20
00
20
02
20
04
20
06
20
08
20
10
Per c
ent
AU
D b
illio
n
Exports (Left axis) Imports (Left axis) Trade intensity (right axis)
Source: ABS (Balance of Payments and International Investment Position, Australia, Cat. no. 5302.0);
ABS (Australian System of National Accounts, Cat. no. 5204.0); World Bank (2011).
Unilateral liberalisation
Australia‘s trading system in the immediate post-Second World War era was one of high
regulation, involving the use of policy tools such as tariffs, quotas, price controls, and production
subsidies to protect import-competing firms from international competition (Snape, Gropp and
Luttrell 1998).
In July 1973, a 25% tariff reduction across the board marked the beginning of a move to a
more liberal trading regime. While followed by some reinstatement of support to certain
industries, the trend towards liberalisation and deregulation resumed in the 1980s, with sustained
reductions in effective rates of assistance for manufacturing and agriculture (Figure 3.2).

CHAPTER 3. TRADE, EMPLOYMENT AND STRUCTURAL CHANGE: THE AUSTRALIAN EXPERIENCE– 117
POLICY PRIORITIES FOR INTERNATIONAL TRADE AND JOBS © OECD 2012
Figure 3.2. Effective rates of assistancea,b
, 1970-71 to 2009-10
Percentages
0
5
10
15
20
25
30
35
40
19
70-7
1
19
72-7
3
19
74-7
5
19
76-7
7
19
78-7
9
19
80-8
1
19
82-8
3
19
84-8
5
19
86-8
7
19
88-8
9
19
90-9
1
19
92-9
3
19
94-9
5
19
96-9
7
19
98-9
9
20
00-0
1
20
02-0
3
20
04-0
5
20
06-0
7
20
08-0
9
Manufacturing Agriculture
a) The effective rate of assistance is defined as the net assistance received per dollar of value added. b) Overlapping observations arise from revisions to industry input and output measures used to estimate effective
rates.
Source: PC (2011).
Terms of trade: recent improvements
A great deal of attention in Australia has focused on the recent expansion in mining activity
brought about largely by China‘s growth. This has been associated with a large rise in
Australia‘s terms of trade, to historically high levels, driven by increases in demand for exports
(combined with a slow supply response), and decreasing import prices. The terms of trade
improvements are larger than many other external shocks experienced post WWII, such as
previous commodity price booms, the Asian Crisis in 1997, and the 2008 Global Financial Crisis
(Figure 3.3).
Since 2004, there has been a sustained increase in the prices of Australian minerals. The
prices of many Australian consumer imports have also declined over the past ten years
(Figure 3.4). The ―China effect‖ – the combined increase in demand for Australian exports and
decrease in the cost of Australian imports – has been a major source of change in the structure of
prices for Australian producers and consumers: the price of exports increased nearly 20%, and
the price of imports fell nearly 10% (adding up to a 30% improvement in the terms of trade).

118 – CHAPTER 3. TRADE, EMPLOYMENT AND STRUCTURAL CHANGE: THE AUSTRALIAN EXPERIENCE
POLICY PRIORITIES FOR INTERNATIONAL TRADE AND JOBS © OECD 2012
Figure 3.3. Australia’s terms of trade, export and import prices, 1959 to 2011
Goods and services, seasonally adjusted, 2008-09 = 100
Panel A. Terms of trade
40
50
60
70
80
90
100
110
120
130
Index
Commodity price boom
Commodity price recovery
1990s recession
Asianfinancial crisis
Global financial crisis
Panel B. Import and export prices
0
20
40
60
80
100
120
sept.
-1959
sept.
-1962
sept.
-1965
sept.
-1968
sept.
-1971
sept.
-1974
sept.
-1977
sept.
-1980
sept.
-1983
sept.
-1986
sept.
-1989
sept.
-1992
sept.
-1995
sept.
-1998
sept.
-2001
sept.
-2004
sept.
-2007
sept.
-2010
Ind
ex
Exports Imports
Source: ABS (Australian National Accounts: National Income, Expenditure and Product, Cat. no. 5206.0)
and Treasury (2002).

CHAPTER 3. TRADE, EMPLOYMENT AND STRUCTURAL CHANGE: THE AUSTRALIAN EXPERIENCE– 119
POLICY PRIORITIES FOR INTERNATIONAL TRADE AND JOBS © OECD 2012
Figure 3.4. Selected export and import prices, Sep 1974 to Mar 2011
2008-09 = 100
Panel A. Export prices
0
20
40
60
80
100
120
140
160
se
pt.
-74
se
pt.
-76
se
pt.
-78
se
pt.
-80
se
pt.
-82
se
pt.
-84
se
pt.
-86
se
pt.
-88
se
pt.
-90
se
pt.
-92
se
pt.
-94
se
pt.
-96
se
pt.
-98
se
pt.
-00
se
pt.
-02
se
pt.
-04
se
pt.
-06
se
pt.
-08
se
pt.
-10
Index
Metal Ores and Minerals Coal, Coke, and Briquettes Other Mineral Fuels Metals
Panel B. Import prices
40
60
80
100
120
140
160
180
200
sept.
-85
sept.
-87
sept.
-89
sept.
-91
sept.
-93
sept.
-95
sept.
-97
sept.
-99
sept.
-01
sept.
-03
sept.
-05
sept.
-07
sept.
-09
Index
Food and Beverages Household Electrical Items
Textiles, Clothing and Footwear Passenger Motor Vehicles
Source: ABS (Balance of Payments and International Investment Position, Australia, Cat. no. 5302.0).

120 – CHAPTER 3. TRADE, EMPLOYMENT AND STRUCTURAL CHANGE: THE AUSTRALIAN EXPERIENCE
POLICY PRIORITIES FOR INTERNATIONAL TRADE AND JOBS © OECD 2012
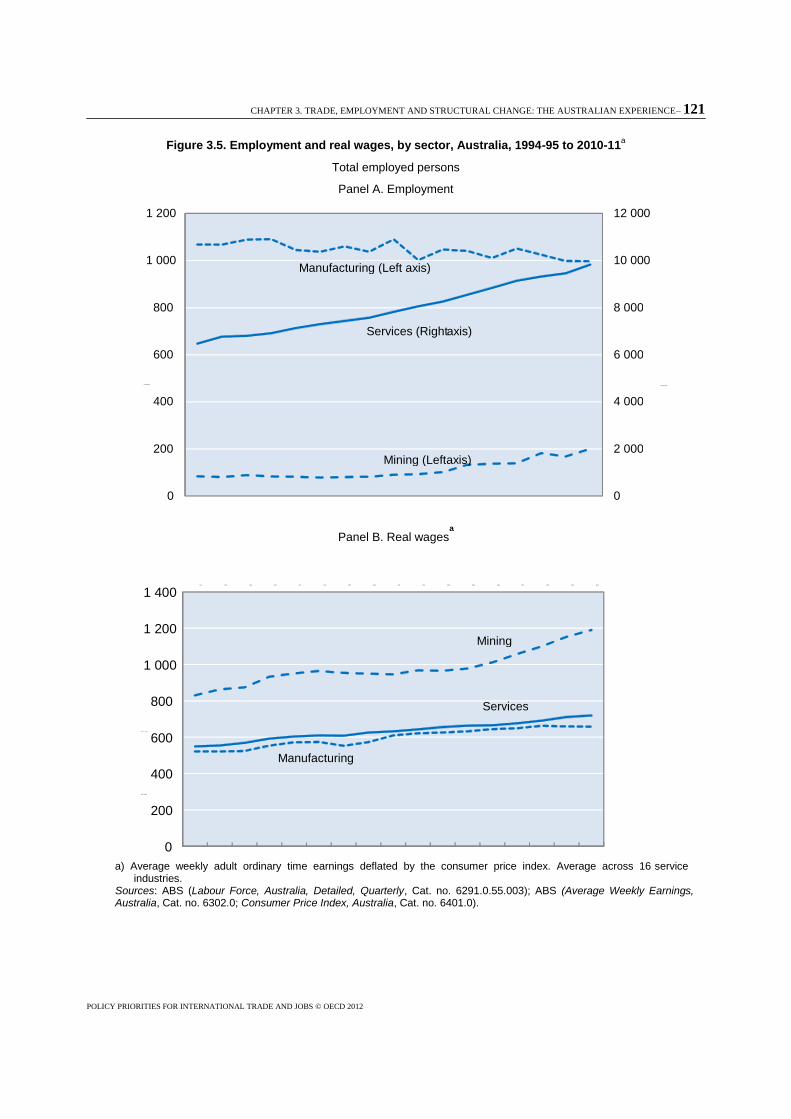
Employment and wages
Over the liberalisation period, aggregate employment has grown, and the structure of
employment has changed (Figure 3.5, Panel A). Since 1984, employment has declined by around
10% in manufacturing, has more than doubled in mining, and has increased by 40% in services,
which now accounts for over 80% of Australia‘s total employment.2
Since 2005-06, real wages have grown about 3% annually in mining, and more slowly in
manufacturing and services (about 0.5% annually; Figure 3.5, Panel B).
3.4. Structural change and flexibility
The composition of the Australian economy has changed markedly over the past century. In
the early decades of the twentieth century, more than 20% of Australian workers worked in the
agricultural sector of the economy (Figure 3.6), another 20% were employed in the production of
manufactures, and about half were employed in services.
As Australia‘s economy has developed and incomes have grown, services have become a
greater part of the consumption bundle and a greater source of employment. At the same time,
the share of agricultural employment has declined. Post WWII to the late 1960s, the share of
manufacturing employment was roughly stable. Since the early 1970s, the share of
manufacturing employment has been on a downward trend. Today, services account for the
overwhelming majority of jobs. Similar trends are observed in relation to the contribution of the
various sectors of the economy to total output (Figure 3.6). The rising importance of services in
the economy and the relative decline of other sectors is a natural consequence of generally rising
incomes, an experience shared by many other economies in the OECD (Görg, 2011).
Indicators of structural adjustments and mechanisms by which these occur include:
Each year around 300 000 new businesses are created, and a similar number cease to exist
(ABS, 2010a).
As at February 2010, nearly two million workers (or almost 20% of a workforce of around
11 million) had been with their current employer or worked in their current business for less
than 12 months; of those, almost 550 000 had changed the industry in which they worked
relative to their previous job (ABS, 2010b).
Noting these data, the Secretary of the Australian Treasury observed:
Just as Australia is an economy in transition, the business and people who succeed are those
that embrace and adapt to changing circumstances (Parkinson, 2011, p. 24).
2. Part of the reduction in employment in manufacturing is attributable to a statistical artefact linked to
increased outsourcing since the 1990s. For example, prior to the 1990s, many manufacturing firms
employed accountants who were counted as part of manufacturing employment. Since then, many
manufacturing firms have outsourced their accounting to external accounting firms whose employees are
counted as part of the services sector. A similar trend has occurred for many other functions including
logistics, warehousing and engineering.
CHAPTER 3. TRADE, EMPLOYMENT AND STRUCTURAL CHANGE: THE AUSTRALIAN EXPERIENCE– 121
POLICY PRIORITIES FOR INTERNATIONAL TRADE AND JOBS © OECD 2012
Figure 3.5. Employment and real wages, by sector, Australia, 1994-95 to 2010-11a
Total employed persons
Panel A. Employment
Panel B. Real wagesa
a) Average weekly adult ordinary time earnings deflated by the consumer price index. Average across 16 service
industries. Sources: ABS (Labour Force, Australia, Detailed, Quarterly, Cat. no. 6291.0.55.003); ABS (Average Weekly Earnings, Australia, Cat. no. 6302.0; Consumer Price Index, Australia, Cat. no. 6401.0).
0
2 000
4 000
6 000
8 000
10 000
12 000
0
200
400
600
800
1 000
1 200
Thousands Thousands
Manufacturing (Left axis)
Services (Right axis)
Mining (Left axis)
0
200
400
600
800
1 000
1 200
1 400 1994 1995 1996 1997 1998 1999 2000 2001 2002 2003 2004 2005 2006 2007 2008 2009 2010
AUD 1989
- 90 per week
Mining
Services
Manufacturing

122 – CHAPTER 3. TRADE, EMPLOYMENT AND STRUCTURAL CHANGE: THE AUSTRALIAN EXPERIENCE
POLICY PRIORITIES FOR INTERNATIONAL TRADE AND JOBS © OECD 2012
Figure 3.6. Composition of Australian employment and output, 1962-63 to 2010-11
Sectoral shares of total employment and output b, c
Panel A. Employmenta
0
10
20
30
40
50
60
70
80
90
100
Pe
r ce
nt
Panel B. Output
b,c
0
10
20
30
40
50
60
70
80
90
100
19
62-6
3
19
65-6
6
19
68-6
9
19
71-7
2
19
74-7
5
19
77-7
8
19
80-8
1
19
83-8
4
19
86-8
7
19
89-9
0
19
92-9
3
19
95-9
6
19
98-9
9
20
01-0
2
20
04-0
5
20
07-0
8
Per
cent
Agriculture Mining Manufacturing Services
a) Data from 1962-63 to 1980-81 based on Withers, et al. (1985); for 1981-82 to 1984-85, data based on Foster (1996); from 1985-86, annual averages from ABS.
b) Share of sectoral value added in GDP less ownership of dwellings and taxes and subsidies, current prices.
c) Data from 1962-63 to 1988-89 based on Foster (1996); from 1989-90 onwards, based on ABS.
Sources: ABS (Australian System of National Accounts, cat. no. 5204.0); ABS (Labour Force, Australia, Detailed, Quarterly, Cat. no. 6291.0.55.003); Foster (1996); Withers, et al. (1985).

CHAPTER 3. TRADE, EMPLOYMENT AND STRUCTURAL CHANGE: THE AUSTRALIAN EXPERIENCE– 123
POLICY PRIORITIES FOR INTERNATIONAL TRADE AND JOBS © OECD 2012
Facilitating structural change and minimising adjustment costs
When resources are reallocated according to market price signals, they are directed to their
most highly valued activities, yielding income gains to an economy. However, structural
adjustment can be costly, requiring substantial retraining, relocation, and administrative costs
(Francois et al., 2011). Flexibility in prices and resource movements can minimise the costs of
adjustment.
The wide-ranging program of economic reform in Australia in the 1980s and 1990s included
the floating of the dollar in 1983, deregulation of the banking sector, phased reductions in tariffs
and other industry assistance, reforms of government business enterprises and deregulation of
the labour market (IC, 1998). These reforms enhanced the flexibility and dynamism of the
Australian economy and improved its ability to adapt to change (Downes and Stoeckel, 2006).
Labour can be limited in its ability to move between sectors and regions, incurring
adjustment costs as it moves across the economy. Costs are associated with acquiring new skills
and qualifications, relocation, and finding new employment. Sometimes, displaced workers take
on lower paid jobs as they move across sectors, particularly if the cost of moving to another
jurisdiction is high.
Some costs are inherent to structural adjustment and largely unavoidable. For example, there
are always costs associated with relocating. Well-designed labour market policies can facilitate
adjustment by reducing the costs of labour mobility, both across occupations and regions
(Francois et al., 2011). Efforts have been made to reduce inherent costs associated with
adjustment, for example training and adjustment assistance, and policies designed to help the
unemployed find work (Box 3.2).
Further efforts have been made to reduce policy-related labour market rigidities. In Australia,
reforms encouraging wage flexibility, and addressing impediments associated with in regulatory
arrangements, have reduced such adjustment costs.
Box 3.2. Unemployment services in Australia
In Australia, subsidised employment services are provided to the unemployed to help them find work. These services are particularly targeted at disadvantaged groups. Up until 1998, this service was provided by the Commonwealth Employment Service, a government agency. This service is now funded through Job Services Australia and for-profit, not-for-profit, and potentially, government owned agencies can compete for contracts. Centrelink, which also manages welfare benefits, was established as the government agency responsible for administering the system.
The Productivity Commission found that the „purchaser-provider‟ model reduced the cost of service without affecting client outcomes. The network provides incentives for providers to match clients with suitable employment and training.
Source: Department of Education Employment and Workplace Relations 2011, PC 2002.
Policy settings in the current mining boom
The current mining boom in Australia has seen Australia‘s nominal exchange rate appreciate
considerably as higher demand for exports puts pressure on the real exchange rate to appreciate.
Flexibility of the exchange rate and in wages during this boom have contributed to lessening
some of the adjustment costs relative to those experienced in previous booms.
As Battelino (2010) and Banks (2011) have observed, in earlier mining booms (in the 1960s
and 1970s), the required appreciation of the real exchange rate occurred via an increase in
domestic prices. Increasing prices reduced the competitiveness of Australian goods, reducing net

124 – CHAPTER 3. TRADE, EMPLOYMENT AND STRUCTURAL CHANGE: THE AUSTRALIAN EXPERIENCE
POLICY PRIORITIES FOR INTERNATIONAL TRADE AND JOBS © OECD 2012
exports until a new equilibrium was attained. Labour and other resources were reallocated to
expanding sectors, even though the wage setting system was much less flexible than it is today,
and wages could not vary as easily across industries, occupations and time. With fixed nominal
exchange rates and relatively constrained nominal wage adjustments, short-term adjustments
were magnified. There were large expansions of the sectors participating in the booms, and
correspondingly large contractions of others, which ultimately were partly reversed by increases
in Australian domestic prices. Flexible exchange rates, by directly changing the relative prices of
traded and non-traded goods and services, better facilitate the efficient movement of resources
across sectors, avoiding magnified short-run responses and consequent readjustments.
A more flexible wage system has facilitated the movement of labour to expanding sectors.
Connolly and Orsmond (2011) argue:
The consequences of the mining booms in the 1970s and early 1980s for inflation were
magnified by the wage fixing system, which tended to transmit demand pressures in one
sector to wages across the economy through the principle of comparative wage justice … In
contrast, the replacement of the centralised wage system with more deregulated wage
structures has enabled a rise in mining industry wages in the 2000s to be contained from the
wage structure across the economy. … the economic reforms undertaken by Australian
Governments since the 1970s to deregulate product markets have improved the ability of the
economy to flexibly respond to mining booms and relative prices more broadly … lower trade
barriers have given households and businesses greater access to global markets to satisfy the
extra demand generated by the mining boom. (pp. 37–38).
Labour market flexibility has been associated with increased employment, hours worked and
labour productivity. Changes in external conditions have increased the interest of employers in
market and regulatory structures that enabled them to make differentiated labour market
responses (Wooden, 2001). These changes have not been associated with declines in job
security. Wooden (1998) found that in 1998 on average, workers had been in their current job
longer and the proportion of persons in short-term jobs had declined relative to 1975.
Greater flexibility in foreign exchange, labour, and product markets have therefore enabled
Australia to better capture benefits from the boom while avoiding some of the adjustments that
have arisen in the past.
The benefits afforded by flexibility are not limited to events such as mining booms and terms
of trade increases. It can improve the ability of the economy to respond to shocks – positive and
negative – from other sources. The Reserve Bank of Australia‘s Assistant Governor, has
attributed part of Australia‘s success during the Global Financial Crisis to the flexibility built in
the Australian economy:
When demand weakened, many firms and their employees agreed to reduce working hours
as a way of preserving jobs. And in other cases, wage rises were reduced or delayed as a way
of avoiding layoffs. These responses helped limit the rise in the unemployment rate. (Lowe
2010, p. 2).
Structural adjustment and “Dutch disease”
Some argue that, although the mining boom offers Australia an opportunity to enjoy higher
real incomes, it has detrimental long-term effects on industries, such as manufacturing, that are
adversely affected by the real appreciation. That is, Australia might be afflicted by ―Dutch
disease‖. Dutch disease refers to the possibility of a diminished role for manufacturing in a
country following the discovery of, or increased demand for, a country‘s natural resources.
However, as Banks (2011) has observed:

CHAPTER 3. TRADE, EMPLOYMENT AND STRUCTURAL CHANGE: THE AUSTRALIAN EXPERIENCE– 125
POLICY PRIORITIES FOR INTERNATIONAL TRADE AND JOBS © OECD 2012
… if and when the mining boom comes to an end, there will be forces within our economy
that will automatically favour other traded industries again. (p. 11)
For example, were demands for Australia‘s mining commodities to fall in the future, the
exchange rate would depreciate, and other export industries and import-competing industries
would experience an increase in their competitiveness. The varied nature of the Australian
manufacturing sector means that even in the event of certain industries disappearing entirely,
other industries in the manufacturing sector could expand in response to those terms of trade
movements. Flexibility would be important in responding to such a development – ensuring that
resources could easily be directed to alternative uses, allowing for a smooth transition to new
production and employment activities.
It has also been argued that due to the ephemeral nature of sudden increases in demand, the
manufacturing sector needs to be protected to prevent major capital shedding (both in terms of
physical and human capital), enabling the industry to return to previous levels of output when
the boom recedes. However, it could also be argued that a better approach would be to remove
barriers that limit productivity and the movement of factors, and implement policies that
minimise the adjustments associated with the structural changes that are required to adapt to the
changes in economic environment.
Attempting to limit Dutch Disease
Attempting to prevent the movement of resources towards mining and related activities –
where they are currently highly valued – has the potential to be costly. It would require Australia
to forgo part of the increases in aggregate income.
The increase in income as a result of the resource boom provides scope for redistribution
through the tax system. Increased labour and capital income throughout the economy increases
government revenues, through income taxes and taxes that relate to economic activity (such as
goods and services taxes). In Australia, given significant foreign ownership in the mining sector,
taxes on mining incomes are an important means of increasing national income. Additional tax
revenue allows increased government expenditure; some of which (for example education and
health expenditure) has strong redistributive characteristics.
Holding resources in industries under threat from import competition comes at the cost of
foregoing the benefits that arise from the reallocation of resources toward expanding sectors.3
This is in addition to costs such as higher consumer prices for imported goods, and possible
longer-term effects such as reduced incentives for innovation due to weaker exposure to
competition.
3.5. Links between trade and employment - evidence
This section draws on various studies – including one developed for this paper – that use
modelling techniques to explain the likely influence of trade on employment outcomes, income
and the structure of the economy. The studies are divided into two types: econometric studies
that identify statistical associations that confirm theoretical hypotheses and CGE studies that
make strong assumptions about economic structure and behaviour to explain the likely links
between trade, income and employment. The CGE studies are also used to illustrate the
3.
This analysis is complicated if there are varying degrees of foreign ownership across industries. Given the
relatively small deviations between industries in the share of factor incomes that flow to foreigners, this
impact is likely to be small.

126 – CHAPTER 3. TRADE, EMPLOYMENT AND STRUCTURAL CHANGE: THE AUSTRALIAN EXPERIENCE
POLICY PRIORITIES FOR INTERNATIONAL TRADE AND JOBS © OECD 2012
importance of flexibility, particularly in labour markets, in maximising the benefits flowing from
changes in external conditions.
Import competition, trade and employment
Gaston (1998) used a regression framework to estimate how reductions in assistance to
manufacturing have affected employment in the sector. Using data for twelve manufacturing
industries for the period 1973-74 to 1991-92, Gaston estimated that a 10% reduction in the
effective rate of protection was associated with a 1% reduction in manufacturing employment.
The Productivity Commission (2003) used Gaston‘s parameters to estimate the effects of
trade on manufacturing employment over a longer timeframe. The overall effect of trade on
employment was computed as the sum of effects from export and import growth and from
reductions in the effective rate of assistance.4 These changes were estimated to reduce
manufacturing employment by around 20% from 1969-70 to 2001-02. The bulk of this was
attributable to a growth in imports mainly due to decreases in import prices, rather than through
reduced assistance.
Felbermayr et al. (2009) seek to answer whether trade openness affects the long run rate of
unemployment. They conclude that openness to trade is associated with a lower rate of structural
unemployment. In the preferred regression, a 10% increase in trade openness is associated with a
one percentage point reduction in the unemployment rate.
This result is consistent with the possibility that trade openness lowers unemployment via
productivity improvement. If greater exposure to trade induces low-productivity
import-competing firms to shut down and high-productivity firms to expand, economy-wide
productivity will increase, raising the incentive for firms to increase hiring. Recent theoretical
work supports the link between trade and productivity. For example, in the Melitz (2003) model
of firm heterogeneity, trade exposure eliminates low-productivity firms and induces
high-productive firms in an industry to export. These reallocations lead to industry-wide
productivity growth.
Gaston and Rajaguru (2011) relate changes in unemployment to changes in the terms of
trade, controlling for other factors, using annual Australian data from 1960 to 2008. They find a
10% improvement in the terms of trade is associated with a fall in the unemployment rate of
approximately one percentage point. Though it might be tempting to interpret this as a direct link
between trade and aggregate employment, labour market settings are likely to have contributed
to this result.
Trade and structural adjustment
Dixon and McDonald (1993) investigated the causes of structural change in the Australian
economy between 1986-87 and 1990-91, some way into the program of liberalisation. Their
analysis supports the hypothesis that trade contributed a significant proportion of structural
change in Australia over the period. The authors used the ORANI model of the Australian
economy to attribute changes in the economy to a dozen sets of potential influences, such as
changes in productivity and in consumer preferences,5 changes in tariffs and other forms of
assistance and changes in external conditions (foreign demands and supplies). The contributions
4. The inclusion of trade flows and protection measures in the regression is justified on the basis that changes
in protection may have effects on employment other than those occurring directly through trade flows.
5. These changes represent changes in demand and supplies that cannot be accounted for by observed
changes in prices, incomes, etc and the algebraic and data structure of the model.

CHAPTER 3. TRADE, EMPLOYMENT AND STRUCTURAL CHANGE: THE AUSTRALIAN EXPERIENCE– 127
POLICY PRIORITIES FOR INTERNATIONAL TRADE AND JOBS © OECD 2012
of the latter to changes in sectoral outputs experienced during the period are summarised in the
first column of Table 3.1. The other influences are aggregated in the second column.
Between 1986-87 and 1990-91, changes in foreign demands and supplies – that is, shifts in
export demands and import supplies – are estimated to have contributed to reducing output in the
agricultural, transport equipment, textiles, clothing and footwear industries. Changes in foreign
demands and supplies are estimated to have contributed to the growth of construction and other
services.
Table 3.1. The contribution of trade to structural change
Sectoral output, percentage changes, 1986–87 to 1990–91
Sector
Shifts in foreign
demands and
supplies
Other
influencesa
Total
change
Agriculture, forestry, fishing -24.2 28.9 4.7
Mining 7.0 23.5 30.5
Food processing 1.4 3.9 5.2
Textiles, clothing, footwear -12.7 8.2 -4.5
Wood products 7.0 3.7 10.7
Chemicals, oil -2.3 12.5 10.2
Non-metal manufactures 5.5 -11.4 -5.9
Metal manufactures 5.4 5.6 11.0
Transport equipment -19.4 12.3 -7.1
Other machinery -0.9 8.2 7.4
Other manufacturing -0.6 7.0 6.4
Utilities 4.9 13.4 18.3
Construction 6.3 -3.7 2.6
Trade, transport,
communication 7.2 7.7 14.9
Services 6.4 6.5 13.0
Total 3.4 8.8 12.2
a) “Other influences” includes changes in: consumer preferences and productivity, industry assistance and compositional changes in exports and agriculture.
Source: Dixon and McDonald 1993.
Modelling the recent terms of trade improvements
Several recent studies have used the Monash Multi-Regional Forecasting (MMRF) model
(Box 3.3) to estimate the likely impacts on the Australian economy of the recent terms of trade
improvement. The modelling isolates the effects of the changes in the terms of trade from any
other effects, such as economic and population growth, or changes in technology or productivity
that are not related to the modelled changes, for example. The modelled changes can be
interpreted as the contribution of the changes in the terms of trade to the observed economic
outcomes, as in Dixon and McDonald (1993).
In most applications presented in this section, the MMRF model is used in ‗dynamic‘ mode.
However, the results are interpreted as the effects of the modelled changes under different
assumptions about adjustments, especially in labour markets. In particular, results labelled ‗short
run‘ are interpreted as the effects of the modelled shocks in an environment in which wages
cannot adjust quickly and adjustments to capital stocks are not completed. Conversely, results

128 – CHAPTER 3. TRADE, EMPLOYMENT AND STRUCTURAL CHANGE: THE AUSTRALIAN EXPERIENCE
POLICY PRIORITIES FOR INTERNATIONAL TRADE AND JOBS © OECD 2012
labelled ‗long run‘ are interpreted as the effects of the modelled changes when there are few
impediments to adjustments in capital stocks and to changes in real wages.
Box 3.3. The MMRF model
The MMRF model was developed by the Centre of Policy Studies at Monash University. It is used by many organisations and academics in Australia.
The MMRF model is a computable general equilibrium model of the Australian economy. The model treats each of the six states and two territories as a separate economy, linked by inter-regional trade matrixes. It is a „bottom-up‟ model, which includes a range of industries, commodities and labour types, aggregated to produce macroeconomic results. The model includes a representative household and government in each region, as well as the Australian government. Foreign demands are represented by downward sloping export demand curves, and import prices are given. MMRF also accounts for state and territory taxes, including income and payroll taxes, the GST, excise and other commodity specific taxes and tariffs.
The version of MMRF used in this project includes 58 industries, 63 commodities and nine labour types. The model was run in dynamic mode and the reported effects are in terms of percentage deviations relative to a baseline. The main dynamic adjustment mechanisms are that:
Real wages are sticky in the short run and adjust through a partial adjustment mechanism to bring long-run employment back to base over a 10 year period.
Capital stocks grow in line with expected rates of return, and investment demand is driven by the change in capital stock (allowing for depreciation). An adjustment process allows for short-run disequilibrium in the rate of return on capital.
The original database (2004-05) was updated to 2009-10 using a range of data sources (for example, employment data, gross state products, and industry shares).
The equations used in Adams (2010) were modified.
To model changes in the price of exports individually, individual export demand curves were allowed to move in response to observed changes in export prices.
Movements in foreign and inter-regional migration were also included. Foreign migration was connected to movements in the real wage, and interstate migration driven by the difference between region-specific real wages (which move with the level of state and territory employment) and the national, average real wage. These population movements were linked to movements of the regional labour supply.
Scenarios with limited labour market flexibility were also examined by constraining movements in foreign and inter-regional migration additions.
Source: Appendix 3.A1.
The simulations reported below model various versions of the recent terms or trade
improvement. The main difference between them is in the degree of flexibility allowed for
resources to adjust to the modelled shocks. The simulations do not produce forecasts, but are
rather experiments designed to isolate the effects of the modelled shocks under various
assumptions about the environment in which they are assumed to occur.
Fixed resources at the industry and regional level (Assumption 1)
The Victorian Department of Treasury and Finance (2006) modelled the short-run effects of
an expansion in the demand for Australian resource exports with the MMRF model. The
modelling assumed that industry-specific capital, regional labour supplies, and regional real
wages were fixed. Labour outcomes were determined by movements in unemployment.
This simulation isolates the effects of a terms of trade movement assuming extreme rigidity
in the economy: neither labour nor capital can be reallocated to the industries or regions where

CHAPTER 3. TRADE, EMPLOYMENT AND STRUCTURAL CHANGE: THE AUSTRALIAN EXPERIENCE– 129
POLICY PRIORITIES FOR INTERNATIONAL TRADE AND JOBS © OECD 2012
they are valued most highly. This set of assumptions produces decreases in projected real GDP,
exports, and employment relative to the base case. The immobility of factors prevents the
reallocation of resources toward export intensive industries, and non-commodity export
industries are unable to reduce their production and employment in response to the exchange rate
appreciation. The inability of exports to expand reduces the potential for income increases.
More flexibility (Assumption 2)
McKissack et al. (2008) used MMRF to illustrate the short-run impacts of a rise in the terms
of trade on the domestic economy, fixing aggregate labour supply by region, and keeping capital
stocks fixed within each region.
Under these more flexible labour market assumptions, the simulated 20% improvement in the
terms of trade raises GDP by approximately 0.3%.
Because the simulation involved modelling an increase in coal and iron ore prices, these two
industries expand, as does domestic income. The construction industry also expands, because
(i) it is an input into iron and coal production, (ii) it is an important input to investment in these
expanding sectors, and (iii) increased domestic incomes drive increases in consumption. The
retail sector expands in several states – generally those where mining is concentrated – and
contracts in others, where income effects are projected to be smaller, and from which workers
migrate to the mining states. In this simulation, the manufacturing sector was projected to
decline as fixed national resources were reallocated to other sectors.
Impact of labour mobility
In its Review of Mutual Recognition Schemes (PC 2009) the Productivity Commission used
CGE modelling to illustrate the potential benefits of labour flexibility in the context of a
hypothetical improvement in the terms of trade. The exercise involved two simulations. In the
first, a 10% increase in export prices of mining commodities was applied to an economy in
which all labour was perfectly mobile. In the second simulation, labour in several skilled
occupations was prevented from moving across jurisdictions.6 The modelled increase in
commodity prices produced larger increases in GDP and average real wages when labour was
fully mobile. Labour mobility also played an important role in distributing the benefits of the
resource boom across Australia, moderating the growth in wages in booming jurisdictions, and
increasing it elsewhere (PC 2009).
Unpacking flexibility assumptions (Assumption 3 and Assumption 4)
In the context of this project, the MMRF model was used to illustrate the short- and long-run
effects of the observed behaviour of export and import prices from 2006 to 2010 on the
Australian economy. Specifically, the impact of the equivalent of a 30% increase in the terms of
trade on short- and long-run incomes and employment was modelled. Table 3.2 summarises the
inputs used. Appendix 3.A1 contains a description of the version of the MMRF model and of the
shocks used, and a detailed description of model results.
6. This barrier to cross-border mobility was assumed to simulate the absence of mutual recognition of some
registered occupations by Australian jurisdictions.

130 – CHAPTER 3. TRADE, EMPLOYMENT AND STRUCTURAL CHANGE: THE AUSTRALIAN EXPERIENCE
POLICY PRIORITIES FOR INTERNATIONAL TRADE AND JOBS © OECD 2012
Table 3.2. Summary of shares and modelled changes in export and import pricesa
% and percentage changes
Exports Imports
Sector Share Price change Share Price change
Agriculture 25.2 -2.4 6.3 23.1
Mining 56.4 42.3 7.7 15.7
Manufacturing 18.4 -16.3 86.0 -12.6
a) Aggregated to broad sectors. Shocks were applied at the commodity level. See Appendix 3.A1.
Source: Commission estimates.
The improvement in the terms of trade is projected to increase domestic incomes. In the short
run, the expansion in the output of exporting industries increases employment without a
significant effect on wages due to assumed short run wage stickiness. Labour moves to regions
and industries where it is most highly valued, principally exporting industries. This is driven in
particular by expansions in construction, as resources projects enter the construction phase to
accommodate the required expansion of the mining sector. Employment increases by 225 000
full-time equivalent workers, and domestic incomes rise by approximately 6% (Figure 3.7). In
the long run, wages increase and employment returns to its long-run level. Real wages increase
by over 10%, and the shares of both mining and services in the Australian economy increase.
The increases in labour income drive increases in tax revenue collections, resulting in an
increase in the government net operating balance. The employment share of services in the
economy increases, driven principally by health, education and personal services. Traded
services, such as tourism, contract as a share of total employment as a result of the terms of trade
movement.
Figure 3.7. Labour market outcomes
Percentage changes relative to base
0
2
4
6
8
10
12
Employment Real wages Employment Real wages
Short run Long run
Source: Commission estimates.

CHAPTER 3. TRADE, EMPLOYMENT AND STRUCTURAL CHANGE: THE AUSTRALIAN EXPERIENCE– 131
POLICY PRIORITIES FOR INTERNATIONAL TRADE AND JOBS © OECD 2012
The structural adjustment resulting from the modelled terms of trade improvement was split
according to the effects of export and import prices (Figure 3.8).
Agricultural employment increases as a result of the modelled increase in agricultural import
prices, but declines as a result of the modelled decrease in agricultural export prices.
Mining benefits from both strong growth in export demand and a decrease in the prices of
some inputs to production.
Manufacturing employment contracts in both simulations, crowded out by cheaper imports
and increased demands for labour in mining and services.
Employment in services increases: increased domestic income increases the consumption of
services; and increased mining activity drives increases in investment, which increases
demand for services such as construction.
The terms of trade shocks have made a significant contribution to the structural changes
observed over 2006-2010 (Table 3.3). This table is analogous to Table 3.1, with the last column
representing changes in employment as reported by the ABS and the first column reporting the
effects of the simulation; however, in this case, the second column is derived as the difference
between the two column, and not all influences have been modelled as in Dixon and McDonald
(1993).
Over the period, mining employment is measured to have expanded about 7.5%, while the
modelled changes account for a 13% increase in employment in mining. This suggests that
other factors account for a reduction in employment of around 5.5%.
In services, the shocks account for practically all the measured increase in employment in the
sector. Thus the net effect of all other influences is small.
Figure 3.8. Changes in sectoral employment resulting from a 20% increase in export prices and a 10% decrease in import prices
Percentage changes relative to the base
-15
-10
-5
0
5
10
15
20
25
Agriculture
Min
ing
Ma
nufa
ctu
rin
g
Serv
ices
Agriculture
Min
ing
Ma
nufa
ctu
rin
g
Serv
ices
Short run Long run
Import price shocks Export price shocks
Source: Commission estimates.

132 – CHAPTER 3. TRADE, EMPLOYMENT AND STRUCTURAL CHANGE: THE AUSTRALIAN EXPERIENCE
POLICY PRIORITIES FOR INTERNATIONAL TRADE AND JOBS © OECD 2012
Table 3.3. Contribution of terms of trade to observed structural change in employment
Persons employed, percentage changes, 2006-10
Changes attributable to: Total
changec
Terms of trade
shocka
Other
contributorsb
Agriculture 0.75 -1.27 -0.52
Mining 12.94 -5.52 7.42
Manufacturing -11.15 8.95 -2.20
Services 3.71 0.30 4.00
a) 30% improvement in terms of trade.
b) Cumulative effects of all other influences, see note in Table 3.1. Calculated as the difference between observed changes in sectoral employment and modelled changes in sectoral employment.
c) Observed changes in employment as reported by ABS.
Source: ABS (Labour Force, Australia, Detailed, Quarterly, Cat. no. 6291.0.55.003); Commission estimates.
The terms of trade improvement causes a large expansion in the services sector. This
expansion comes from two sources: the mining boom requires a range of services as inputs,
especially construction services in the investment phase; and households increase their demand
for services, including construction, as incomes increase. The composition of the structural
change has a significant impact on the sources of expenditure within the domestic economy
(Figure 3.9).
In the short run, the expansion of the resources sector causes a significant increase in
investment. This increase in investment drives an increase in demand for a range of domestic
goods and services. Construction expands particularly strongly, as it is a necessary input to the
investment required by the resource sector, and an input to dwellings and accommodation. In the
long run, increases in disposable income cause demand for services in consumption to increase,
particular entertainment and health-related services,7 public services (including education and
health), and financial services (Figure 3.10).
The gains linked to increased export demand for minerals are concentrated in export
intensive regions, the Northern Territory and Western Australia in particular.
That said, incomes increase across all regions: some regions supply inputs into the mining
regions, increased tax incomes affect incomes across regions and decreased prices of imports
increase real incomes across the country. The larger states – NSW and Victoria in particular –
benefit most from increases in domestic consumption, due to the concentration of services in
those states. Figure 3.11 shows the short- and long-run impact of an improvement in the terms
of trade on labour incomes across regions.
7. Entertainment and health-related services are included in the ―other services‖ industry of Commission‘s
version of the MMRF model.

CHAPTER 3. TRADE, EMPLOYMENT AND STRUCTURAL CHANGE: THE AUSTRALIAN EXPERIENCE– 133
POLICY PRIORITIES FOR INTERNATIONAL TRADE AND JOBS © OECD 2012
Figure 3.9. Changes in real expenditure resulting from a 20% increase in export prices and a 10% decrease in import prices
Percentage changes relative to the base
0
2
4
6
8
10
12
14
16
Consumption Investment Government Consumption Investment Government
Short run Long run
Import price shocks Export price shocks
Source: Commission estimates.
Figure 3.10. Share of output used in consumption, investment and intermediate inputsa
Percentage changes relative to the base, five industries
0
2
4
6
8
10
12
14
Co
nstr
uctio
n
Oth
er
se
rvic
es
Fin
ancia
lse
rvic
es
Bu
sin
ess
se
rvic
es
Pu
blic
se
rvic
e
Intermediate inputs Investment Consumption
a) Abstracts from output used in exports, government current consumption, margin services and inventories.
Source: Commission estimates.

134 – CHAPTER 3. TRADE, EMPLOYMENT AND STRUCTURAL CHANGE: THE AUSTRALIAN EXPERIENCE
POLICY PRIORITIES FOR INTERNATIONAL TRADE AND JOBS © OECD 2012
Figure 3.11. Changes in labour incomes from a 20% increase in export prices and a 10% decrease in import prices
Percentage changes relative to the base
0
5
10
15
20
25
30
35
NSW Vic Qld SA WA Tas NT ACT NSW Vic Qld SA WA Tas NT ACT
Short run Long run
Import price shocks Export price shocks
Source: Commission estimates.
An additional simulation, in which the movements of labour across regions and
internationally are constrained, illustrates how this type of impediment can constrain the gains
from reallocating labour across the economy.8 Limiting inter-regional and international
migration reduces the short run income gains to labour supply to 4% in the short run
(Assumption 3b), and to 9% in the long run (Assumption 4b). At the aggregate level, this causes
GDP to grow by nearly 1% less than when labour is fully mobile.
Effects of limiting flexibility
Table 3.4 provides a comparison of the simulations discussed above. With extreme
constraints on resource movements as in Assumption 1, the modelled shocks produce a decrease
in output and a corresponding reduction in employment. Under Assumption 2, the assumed
impediments to the movement of capital across regions limit the ability to take advantage of the
modelled improvements in export prices. Under Assumptions 3 and 4, short-term (labour
movement) and long-term flexibility (wage movement) allow the benefits of the modelled
increases in export and decreases in import prices to be captured. Under Assumption 3, wage
stickiness means that initially real wages fall in expanding sectors, allowing employment to
increase. Under Assumption 4, wages adjust, and employment returns to the long-run level.
Assumptions 3b and 4b indicating how limitations on labour mobility constrain the scenarios.
8.
Labour is surprisingly mobile across industries and occupations and international migration can be
responsive to demand shocks in certain sectors. Anecdotal evidence points to agricultural workers moving
into mining, especially as equipment operators and truck drivers; shortages of teachers and clerks are
reported as they too take on jobs in the mining sector. Although immigration procedures can be lengthy,
they have been shortened for some skilled jobs.

CHAPTER 3. TRADE, EMPLOYMENT AND STRUCTURAL CHANGE: THE AUSTRALIAN EXPERIENCE– 135
POLICY PRIORITIES FOR INTERNATIONAL TRADE AND JOBS © OECD 2012
Table 3.4. Projected effects of terms of trade improvements on employment and GDP
Percentage changes relative to base
Shock Assumptions Employment GDP
Assumption 1 Increase in export prices
(8%-40%, increase in export
demands for in resource
commodities)
Labour and capital fixed in
industry and regions
-0.33 -0.22
Assumption 2 20% terms of trade
improvement
(coal and iron ore demand)
Labour mobile across industries
and regions; capital fixed within
each region
0.00 0.30
Assumption 3
(short run)
30% terms of trade improvement
(export demand, import prices)
Employment flexible; wages
sticky; capital reallocates slowly
2.05 1.46
Assumption 3b
(short run)
Same as Assumption 3 Same as Assumption 3
Constrained migration
1.51 1.26
Assumption 4
(long run)
Same as Assumption 3 Labour supply flexible
wages flexible; capital
reallocated
0.11 3.41
Assumption 4b
(long run)
Same as Assumption 3 Same as Assumption 4
Constrained migration
0.08 2.48
Sources: Department of Treasury and Finance (Victoria) (2006); McKissack et al. (2008); Commission estimates.
3.6. Conclusions
Since the 1980s, trade liberalisation and other microeconomic reforms have contributed to
significant structural change throughout the Australian economy. The contribution of services
and mining activity has increased further, while manufacturing has contracted. This has been
accompanied by a significant increase in Australia‘s trade intensity. The recent effects of a 30%
improvement in the terms of trade are leading to significant further structural adjustments, not
unlike those experienced as a result of trade liberalisation undertaken earlier.
Australian residents benefit from improvements in the terms of trade. Economic modelling
indicates that increases in Australian incomes flow across the economy. When export demand
increases and responses are constrained, incomes increase through the increase in export prices.
The same applies to increased competition from reductions in import prices.
The greatest increases in income involve some structural adjustment, as labour and capital
move to the industries and regions where their use is most highly valued. Maximising the
benefits and minimising the adjustments costs associated with changes requires a flexible
economy that enables resources to move relatively freely across sectors and regions.

136 – CHAPTER 3. TRADE, EMPLOYMENT AND STRUCTURAL CHANGE: THE AUSTRALIAN EXPERIENCE
POLICY PRIORITIES FOR INTERNATIONAL TRADE AND JOBS © OECD 2012
References
ABS (Australian Bureau of Statistics) (2010a), Counts of Australian Businesses, Including Entries and
Exits, Jun 2007 to Jun 2009, Cat. No. 8165.0, Canberra.
—— (2010b), Labour Mobility, Australia, Feb 2010, Cat. No. 6209.0, Canberra.
—— (2011), Balance of Payments and International Investment Position, Cat. No. 5302.0, Canberra.
Adams, P. D. (2010), ―The Australian Mining Boom: A CGE Perspective‖, Presentation held at Monash
University Caulfield Campus on Friday 19 November, 2010.
Adams, P. D., J. Dixon, J. Gieseke and M. J. Horridge (2011), ―MMRF: Monash Multi-Regional
Forecasting Model: A Dynamic Multi-Regional Applied General Equilibrium Model of the Australian
Economy‖, Working Paper, Centre of Policy Studies, Monash University.
Australian Financial Review (2011), ―Workers Resist Western Front‖, Australian Financial Review,
5 September 2011, pp. 1, 8.
Australian Government (2011), Budget Paper No. 1, Statement 4: Opportunities and Challenges of an
Economy in Transition, Canberra, May.
Baldwin, R.E. (1994), ―The Effects of Trade and Foreign Direct Investment on Employment and Relative
Wages‖, OECD Economic Studies, No. 23, Paris.
Banks, G. (2011), ―Australia‘s Mining Boom: What‘s the Problem?‖, address to the Melbourne Institute
and The Australian Economic and Social Outlook Conference, Melbourne, 30 June.
Battelino, R. (2010), ―Mining Booms and the Australian Economy‖, address to the Sydney Institute,
23 February.
Brecher, R.A. (1974), ―Minimum Wage Rates and the Pure Theory of International Trade‖, Quarterly
Journal of Economics, Vol. 88, No. 1, pp. 98116.
Connolly, E. and D. Orsmond (2011), ―The Mining Industry: From Bust to Boom‖, paper prepared for the
Reserve Bank of Australia Conference ―Australia in the 2000s‖, H.C. Coombs Centre for Financial
Studies, Kirribilli, 15-16 August.
Cook, L.H. and E. Sieper (1984), ―Minerals Sector Growth and Structural Change‖, in Cook, L.H. and
Porter, M.G. (eds.), The Minerals Sector and the Australian Economy, George Allen and Unwin,
Sydney, pp. 85-127.
Copeland, B.R. (1989), ―Efficiency Wages in a Ricardian Model of International Trade‖, Journal of
International Economics, Vol. 27, pp. 221-244.
Corden, W.M. and J. P. Neary (1982), ―Booming Sector and De-Industrialisation in a Small Open
Economy‖, The Economic Journal, Vol. 92, No. 368, pp. 825-848.
Davidson, C., L. Martin and S. Matusz (1999), ―Trade and Search Generated Unemployment‖, Journal of
International Economics, Vol. 48, pp. 271-299.
Department of Education, Employment and Workplace Relations (Cwlth) (2011), About Job Services
Australia. Accessed online: www.deewr.gov.au/ Employment/JSA/Pages/about.aspx
Department of Treasury and Finance (Victoria) (2006), A Tale of Two Economies: The Regional Impact
of Australia’s Resources Boom, Melbourne, May.
Diamond, P.A. (1982), ―Wage Determination and Efficiency in Search Equilibrium‖, The Review of
Economic Studies, Vol. 49, No. 2, pp. 217-227.

CHAPTER 3. TRADE, EMPLOYMENT AND STRUCTURAL CHANGE: THE AUSTRALIAN EXPERIENCE– 137
POLICY PRIORITIES FOR INTERNATIONAL TRADE AND JOBS © OECD 2012
Dixon, P.B. and D. McDonald (1993), ―An Explanation of Structural Changes in the Australian
Economy: 1986-87 to 1990-91‖, EPAC Background Paper, No. 29, AGPS, Canberra.
—— and M. Rimmer (2002), Dynamic General Equilibrium Modelling for Forecasting and Policy: A
Practical Guide and Documentation of MONASH, North-Holland, Amsterdam.
Downes, P. and A. Stoeckel (2006), Drivers of Structural Change in the Australian Economy, Centre for
International Economics, Canberra.
Felbermayr, G., J. Prat and H.J. Schmerer (2009), ―Trade and Unemployment: What Do the Data Say?‖,
IZA Discussion Paper, No. 4184, Institute for the Study of Labor, Bonn, Germany.
Foster, R.A. (1996), ―Australian Economic Statistics 1949-50 to 1994-95‖, Reserve Bank of Australia
Occasional Paper, No. 8, revised, Sydney.
Francois, J., M. Jansen and R. Peters (2011), ―Trade Adjustment Costs and Assistance: The Labour
Market Dynamics‖ in M. Jansen, R. Peters and J.M. Salazar-Xirinachs, Trade and Employment: From
Myths to Facts, International Labour Organization, pp. 213-252.
Gaston, N. (1998), ―The Impact of International Trade and Protection on Australian Manufacturing
Employment‖, Australian Economic Papers, Vol. 37, No. 2, pp. 119-36.
—— and Rajaguru, G. (2011), ―How An Export Boom Affects Unemployment‖, Discussion Paper,
No. 801, Institute of Social and Economic Research, Osaka University, Japan.
Giesecke, J. (2004), ―The Extent and Consequences of Recent Structural Changes in the Australian
Economy, 1997-2002: Results from Historical Decomposition Simulations with MONASH‖, Centre
of Policy Studies, General Working paper, No. G-151, December.
Görg, H. (2011), ―Globalization, Offshoring and Jobs‖, in M. Bachetta and M. Jansen (eds.), Making
Globalization Socially Sustainable, World Trade Organisation, pp. 21-41.
Gregory, R.G. (1976), ―Some Implications of the Growth of the Mineral Sector‖, The Australian Journal
of Agricultural Economics, Vol. 20, No. 2, pp.71-91.
Helpman E. and O. Itskhoki (2010), ―Labour Market Rigidities, Trade and Unemployment‖, Review of
Economic Studies, Vol. 77, No. 3, pp. 1100-1137.
IC (Industry Commission) (1998), ―Microeconomic Reforms in Australia: A Compendium from the
1970s to 1997‖, Research Paper, AGPS, Canberra, January.
ILO (International Labour Organization) and WTO (World Trade Organization) 2007, Trade and
Employment: Challenges for Policy Research:
www.ilo.org/public/english/bureau/inst/download/eddy.pdf (accessed 1 June 2011).
Johnston, A., D. Porter, T. Cobbald and R. Dolamore (2000), ―Productivity in Australia‘s Wholesale and
Retail Trade‖, Productivity Commission Staff Research Paper, AusInfo, Canberra.
Krugman, P.R. (1993), ―What Do Undergrads Need to Know About Trade?‖, The American Economic
Review: Papers and Proceedings, Vol. 83, No. 2, pp. 23-26.
—— (1995), ―Growing World Trade: Causes and Consequences‖, Brookings Papers on Economic
Activity, Vol. 1995, No. 1, pp. 327–77.
Laplagne, P., P. Marshall and S. Stone (2001), ―The Role of Technology in Determining Skilled
Employment: An Economywide Approach‖, Productivity Commission Staff Research Paper, AusInfo,
Canberra, August.
Lowe, P. (2010), ―Some Challenges for the Future‖, speech delivered to the Urban Development Institute
of Australia National Congress, Sydney, 10 March.
Matusz, S.J. (1996), ―International Trade, the Division of Labor and Unemployment‖, International
Economic Review, Vol. 37, No. 1, pp. 71-84.

138 – CHAPTER 3. TRADE, EMPLOYMENT AND STRUCTURAL CHANGE: THE AUSTRALIAN EXPERIENCE
POLICY PRIORITIES FOR INTERNATIONAL TRADE AND JOBS © OECD 2012
McKissack, A., J. Chang, R. Ewing and J. Rahman (2008), ―Structural Effects of a Sustained Rise in the
Terms of Trade‖, Treasury Working Paper, 2008–01, July.
Melitz, M.J. (2003), ―The Impact of Trade on Intra-Industry Reallocations and Aggregate Industry
Productivity‖, Econometrica, Vol. 71, No. 6, pp. 1695–1725.
OECD (Organisation for Economic Cooperation and Development), ILO (International Labour
Organization), The World Bank Group and WTO (World Trade Organization) (2010), ―Seizing the
Benefits of Trade for Employment and Growth‖, Final Report, prepared for submission to the G-20
Summit Meeting, Seoul.
—— (2011), Economic Outlook, No. 89, June 2011, Paris.
Oslington, P. (2005), ―Unemployment and Trade Liberalisation‖, The World Economy, Vol. 28, No. 8,
pp. 1139–55.
Parkinson, M. (2011), ―Opportunities, Challenges and Implications for Policy‖, Annual Post-Budget
Address to the Australian Business Economists, Sydney, 17 May.
Pissaridies, C.A. (1985), ―Short-Run Equilibrium Dynamics of Unemployment, Vacancies and Real
Wages‖, The American Economic Review, vol. 75, no. 4, pp. 676–690.
Productivity Commission (1998), ―Aspects of Structural Change in Australia‖, Research Report, AusInfo,
Canberra.
—— (2002), ―Independent Review of the Job Network‖, Commission Research Paper, Report No. 21,
AusInfo, Canberra.
—— (2003), ―Trends in Australian Manufacturing‖, Commission Research Paper, AusInfo, Canberra.
—— (2008), ―Modelling Economy-wide Effects of Future Automotive Assistance‖, Melbourne.
—— (2009), ―Review of Mutual Recognition Schemes‖, Research Report, Canberra.
—— (2011), ―Trade and Assistance Review 2009-10‖, Annual Report Series, Productivity Commission,
Canberra.
Rybczynski, T.M. (1955), ―Factor Endowment and Relative Commodity Prices‖, Economica, Vol. 22,
No. 88, pp. 336–341.
Snape, R.H. (1977), ―Effects of Mineral Development on the Economy‖, The Australian Journal of
Agricultural Economics, Vol. 21, No. 3, pp. 147–156.
—— Gropp, L. and T. Luttrell (1998), ―Australian Trade Policy 1965-1997: A Documentary History‖,
Allen and Unwin.
Stopler, W. and P.A. Samuelson (1941), ―Protection and Real Wages‖, Review of Economic Studies,
Vol. 9, No. 1, pp. 58–73.
World Bank (2011), Data: Indicators, http://data.worldbank.org/indicator (accessed 10 August).
Wooden, M. (2001), ―Industrial Relations Reform in Australia: Causes, Consequences and Prospects‖,
The Australian Economic Review, Vol. 34, No. 3, pp. 243-262
Wooden, M. (1998), ―Is Job Stability Really Declining?‖, Australian Bulletin of Labour, Vol. 41,
pp. 186-193
Yellen, J. L. (1984), ―Efficiency Wage Models of Unemployment‖, The American Economic Review
Papers and Proceedings, Vol. 74, No. 2, pp. 200-205.

CHAPTER 3. TRADE, EMPLOYMENT AND STRUCTURAL CHANGE: THE AUSTRALIAN EXPERIENCE– 139
POLICY PRIORITIES FOR INTERNATIONAL TRADE AND JOBS © OECD 2012
Appendix 3.A1.
The Monash Multi-Regional Forecasting model
The Monash Multi-Regional Forecasting (MMRF) model is a detailed model of the
Australian economy developed by the Centre of Policy Studies (CoPS) at Monash University
(Adams et al., 2011). The version of MMRF used by in this paper includes 58 industries,
63 goods and services, nine occupational types of labour, and provides results for all eight states
and territories of Australia. The model includes a representative consumer and government
demand in each region, as well as a Federal Government demand. It is a dynamic model of the
Australian economy, employing recursive mechanisms to explain adjustments over time.
MMRF determines regional supplies and demands of commodities through optimising
behaviour of agents in competitive markets. Optimising behaviour also determines industry
demands for labour and capital. Labour supply at the national level is determined by
demographic factors, while national capital supply responds to rates of return. Labour and
capital can cross regional borders so that each region‘s stock of productive resources reflects
regional employment opportunities and relative rates of return.
All markets clear, other than the labour market (where excess supply conditions can hold,
allowing for unemployment). A range of taxes are incorporated in the model including income
and payroll taxes, company taxes, the GST, and a range of commodity and factor-specific taxes
and tariffs.
Australian exports face a downward-sloping demand curve. A shock that improves the price
competitiveness of an export sector will result in increased export volume, but at a lower world
price.
Calculating the shocks for the modelling
In order to implement detailed price shocks to the traded commodities in the model,
disaggregated data on export and import prices were required. The data used for this purpose
were the SITC export and import price indices measured by the ABS. Each goods trading sector
of MMRF was matched with two-digit SITC price data. Where more than one index was
applicable to an MMRF sector, a composite price index was derived by calculating a weighted
sum of prices based on all 2-digit SITC sectors relevant to the MMRF sector in question. (A
brief description of the 2-digit SITC sectors is provided in Appendix Table 3.A1.2).
The shocks imposed on the model (Appendix Table 3.A1.1) were based on the two-year
geometric growth rate of the relevant price index between June 2006 and December 2010, for a
total terms of trade change of 30%. The changes in export and import prices were split across
two years of the model, to clearly demonstrate the effects of the shocks on employment and
other variables, rather than spreading the shocks across a greater number of years and diluting
their impact.
The overall change in import prices implied by the SITC indices was smaller than that
recorded by the implicit price deflator for imports between June 2006 and December 2010.
Hence, the import price changes derived from SITC indices were scaled by a factor of 1.8 in
order to result in a general movement in import prices approximately of the same order as that

140 – CHAPTER 3. TRADE, EMPLOYMENT AND STRUCTURAL CHANGE: THE AUSTRALIAN EXPERIENCE
POLICY PRIORITIES FOR INTERNATIONAL TRADE AND JOBS © OECD 2012
indicated by the implicit price deflator for imports. No such adjustment was required for export
prices.
For some two-digit SITC sectors, export and import price indices were not available
(typically because of small recorded trade volumes). Where a single two-digit SITC sector was
matched with a single sector of MMRF, the absence of a price index meant that no shock was
applied to the sector.
The changes in import prices were imposed on the model by directly altering the price of the
imported commodities in question in MMRF. A different process, however, was used to enter
the export price shocks into the model. In the MMRF model, each exported commodity has an
exogenously specified, downward-sloping demand curve with an elasticity of -5. As a result of
this structure, directly shocking individual export prices would have implied large quantity
changes that were inconsistent with observed data. In turn, this would have resulted in
unrealistic movements in the output and employment levels of industries producing exported
commodities.
As a result, the export simulations were implemented in the model using two mechanisms.
An aggregate export price change of 10% was imposed in 2010 and 2011, in accordance with
the increase in the aggregate export price deflator of 20% between June 2006 and December
2010. In order to ensure that the aggregate export price change was appropriately divided across
exported commodities, export demand curves were allowed to shift up (down) to reflect
increases (decreases) in the observed prices of exports. Each individual export demand shift
variable was given a weighting in accordance with the observed changes in commodity prices.
International and interregional domestic migration were included in the modelling.
International migration to all states and territories in Australia was linked to the national real
wage. This was based on the assumption that a foreign migrant is more likely to choose
Australia as a migration destination based on national wage (and other, non-financial)
considerations without specifically targeting a state or territory. Regional choice is largely
driven by local policies and social factors, and would be included in the interregional domestic
migration impacts. The responsiveness of foreign migration to changes in the real wage was
based on observed data.
Interregional domestic migration was driven by the real wage differential between states.
States and territories with real wages above (below) the national average real wage experience
increases (decreases) in the number of interregional migrants. This was specified such that the
aggregation of all interregional migration within Australia summed to zero. The degree of
migration caused by changes in the relative real wage was based on observed data.
Both of these additions were coupled with region-specific real wages. The real wage in each
region was allowed to adjust with local labour market conditions, allowing the region-specific
real wage to influence population movements.

CHAPTER 3. TRADE, EMPLOYMENT AND STRUCTURAL CHANGE: THE AUSTRALIAN EXPERIENCE– 141
POLICY PRIORITIES FOR INTERNATIONAL TRADE AND JOBS © OECD 2012
Table 3.A1.1. MMRF and SITC concordance, and annual price shocks
MMRF sector SITC 2-digit sector Export price shock Import price shock
Sheep and Cattle 00 19.05 n/a
Dairy 02 14.90 24.74
Other Animals 03 -0.09 -2.63
Grains 04,08 5.93 n/a
Other Agriculture 05, 06, 21, 22 -11.59 -9.94
Forestry 24 6.04 7.47
Coal 32 11.34 n/a
Oil 33 -6.43 -7.48
Gas 34 37.67 n/a
Iron Ore 28 21.81 n/a
Non-iron Ore 28 21.81 n/a
Other Mining 27 23.99 83.30
Meat Products 01 12.11 n/a
Other Food 07, 09, 11, 12, 41, 42 -19.50 25.54
Textiles, Clothing, and
Footwear
26, 61, 65, 84, 85 -19.62 -1.01
Wood Products 63 n/a 11.71
Paper Products 25, 64 4.12 -16.39
Printing 64 4.12 -9.56
Chemicals 51, 52, 53, 54, 55, 56, 59 -11.09 3.00
Rubber and Plastics 23, 57, 58, 62 -14.44 1.00
Non-metal commodities 65 n/a 1.98
Cement 66 -12.97 -10.67
Steel 67 4.60 13.58
Alumina 28 21.81 n/a
Aluminium 68 -11.39 -4.24
Other Metals 69 n/a -1.82
Metal Products 69 n/a -1.82
Motor Vehicles and Parts 78 -5.85 -0.80
Other Manufacturing 71, 72, 74, 75, 76, 77, 79,
81, 82, 83, 87, 88, 89
-18.38 -19.00

142 – CHAPTER 3. TRADE, EMPLOYMENT AND STRUCTURAL CHANGE: THE AUSTRALIAN EXPERIENCE
POLICY PRIORITIES FOR INTERNATIONAL TRADE AND JOBS © OECD 2012
Table 3.A1.2. SITC 2-digit sectors
2-digit sector Description
00 Live animals other than animals of division 03
01 Meat and meat preparations
02 Dairy products and birds' eggs
03 Fish, crustaceans, molluscs and aquatic invertebrates and preparations thereof
04 Cereals and cereal preparations
05 Vegetables and fruit
06 Sugars, sugar preparations and honey
07 Coffee, tea, cocoa, spices and manufactures thereof
08 Feeding stuff for animals (not including unmilled cereals)
09 Miscellaneous edible products and preparations
11 Beverages
12 Tobacco
21 Hides, skins and furskins, raw
22 Oil seeds and oleaginous fruits
23 Crude rubber
24 Cork and wood
25 Pulp and Waste Paper
26 Textile fibres and their wastes
27 Crude fertilisers, other than those of division 56, and crude minerals (excluding coal, petroleum)
28 Metalliferous ores and metal scrap
32 Coal, coke and briquettes
33 Petroleum, petroleum products and related materials
34 Gas, natural and manufactured
41 Animal oils and fats
42 Fixed vegetable fats and oils
51 Organic chemicals
52 Inorganic chemicals
53 Dyeing and colouring materials
54 Medicinal products
55 Essential oils etc
56 Fertilisers (excluding crude)
57 Plastics in primary forms
58 Plastics in non-primary forms
59 Chemical materials and products, n.e.s.
61 Leather and leather manufactures
62 Rubber manufactures n.e.s.
63 Cork and wood manufactures
64 Paper, paperboard and articles of paper pulp, of paper or of paperboard

CHAPTER 3. TRADE, EMPLOYMENT AND STRUCTURAL CHANGE: THE AUSTRALIAN EXPERIENCE– 143
POLICY PRIORITIES FOR INTERNATIONAL TRADE AND JOBS © OECD 2012
Table 3.A1.2. SITC 2-digit sectors (continued)
2-digit sector Description
65 Textile yarn, fabrics, made-up articles, n.e.s., and related products
66 Non-metallic mineral manufactures
67 Iron and steel
68 Non-ferrous metals
69 Manufactures of metals, n.e.s.
71 Power generating machinery and equipment
72 Machinery specialised for particular industries
74 General industrial machinery and equipment, n.e.s., and machine parts, n.e.s.
75 Office machines and ADP machines
76 Telecommunications and sound recording equipment and reproducing apparatus and equipment
77 Electrical machinery, etc. and parts thereof
78 Road vehicles (incl. air–cushion vehicles)
79 Other transport equipment
81 Prefabricated buildings and fixtures n.e.s.
82 Furniture and parts thereof
83 Travel goods and handbags
84 Articles of apparel and clothing
85 Footwear
87 Professional, scientific and controlling instruments and apparatus, n.e.s.
88 Photographic and optical goods
89 Miscellaneous manufactured articles, n.e.s.
97 Gold, non-monetary