chapter 2a performance measures manage by facts. performance measures one of core values in mbnqa is...
Post on 20-Dec-2015
214 views
TRANSCRIPT

Chapter 2a Performance measures
Manage by facts

Performance measures One of core values in MBNQA is manage by facts –
not gut feelings Effective management requires info from
measurement activities Performance measures used as baseline to -
identify potential project- justify project resource allocation- assess improvement results
Production – defects per million (or ppm), inventory turns, on-time delivery
Service activities – billing errors, sales per square feet, engineering changes, activity times, etc.

Cost of poor quality In the final analysis - value of QC / QA / TQM
initiative and programs are based on ability to contribute to profits.
An effective performance measure is cost of poor quality- decisions depends on expense and income of the business activity.
Efficiency of any business measured in RM, $ (monetary value)
Costs of poor quality can be found – same as for cost of maintenance, production, design, inspection, etc.
We can measure, program, analyze and budget the cost of poor quality (COPQ) or (PONC) to achieve better quality and customer satisfaction.
Cost of poor quality COSTS , PROFIT Quality costs involves all department;
purchasing, design, etc. What is quality costs? Cost of poor quality are “those costs associated with non-achievement
of product/service quality defined by the requirements”

Cost of poor quality Quality cost - used in pursuit of quality improvement,
customer satisfaction, and basic data for TQM High quality cost – inefficient, ineffective management Quality Cost Program quantifies magnitude quality
problem in management language (RM);- 20% of sales dollars in manufacturing- 35% of sales dollars in service
Need to develop Quality Cost Program Identify opportunities for improvement Justification for corrective action Every sen saved will profits - Take care of the penny
and penny will take care of itself!!

Cost of poor quality Principle advantage – identify hidden costs
which is not able to detect in operation Program – comprehensive and not ‘fire-
fighting’ problem Real improvement occurs – ROOT CAUSE
OF PROBLEM identified and eliminated
Quality Costs CategoriesPrevention Prevention achieved by examining experience gained
from identification of specific causes of failures, and developing specific activities incorporated into basic management system that make it difficult or impossible for error/failure to occur again
Cost incurred for planning, implementing & maintenance a quality system to ensure conformance to requirements
Design review, Quality Management system, Measuring Equipment Calibration

Quality Costs Categories
Appraisal Cost incurred to determine degree on
conformance to quality requirements Examples – incoming inspection, source
inspection, operations inspections, measuring equipment

Quality Costs CategoriesFailures - Internal failure- External failure Cost incurred when products/services,
components, materials, fail to meet requirements 1) before, 2) after transfer of ownership to customer
Internal - purchasing errors, rework, repair, scrap, reappraisal, etc.
External - complaint investigation, returned goods, retrofit. Warranty costs, liability costs, etc

Collection and Reporting Quality DataCurrent month
Yr to date Current month Yr to date
Prevention costs RM (000) Current Prior Yr Appraisal Costs RM (000)
Current Prior Yr
Marketing/Customer Product/Service development
Product/Service development
Purchasing
Purchasing Operations
Operations External Appraisal
Quality Administration Total Total
Internal failure Costs
RM (000) Current month
Yr to date External Failure Costs
RM (000)
Current month Yr to date
Product/Service Design Current Prior Yr Customer complaints Current Prior Yr
Purchasing Returned Goods
Operations (Subtotal) Retrofit Costs
Material Warranty Claims
Rework Liability Costs
Repair Penalties
Scrap Customer Goodwill
Total
Baseline Data RM (000) Current month
Ratios RM (000)
Current month Yr to date
Net Sales Current Prior Yr External Failure Cost/Net Sales
Current Prior Yr
Direct Labor Operations Failure Costs/Prod Costs
Production Operations Appraisal Costs/Production Costs
Unit Purchasing Costs of Poor Quality/Material Costs
Design Costs of Poor Quality/Design Costs

Quality CostsQUALITY COST REPORT for control purposes establish budget variances measuredANALYSIS1) Trend analysis by cost categories (P-A-F) product indices (baseline) plants in the corporation2) Pareto Analysis categories department product lines, e.g. failure costs, warranty costs, appraisal Cost incurred to determine degree on conformance to quality
requirements Examples – incoming inspection, source inspection, operations
inspections, measuring equipment

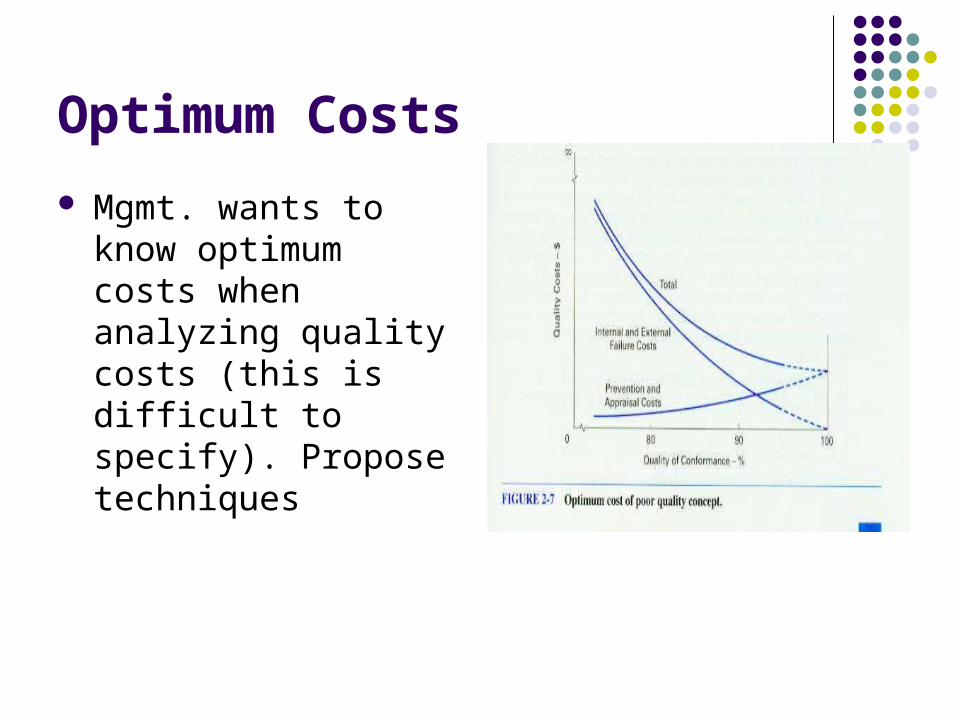
Optimum Costs
Mgmt. wants to know optimum costs when analyzing quality costs (this is difficult to specify). Propose techniques

Technique #1 Make comparisons with other companies - difficult
Technique #2 Optimize individual categories
e.g. Failure costs optimized when no identifiable & profitable projects to reduce them
Technique #3 Analyze relationship between different cost categories
As Quality Improves () - 100% conformance, Failure costs will decrease ( ~ 0 ), therefore need to Prevention and Appraisal costs
Combine TQ cost curves ;
Q , QUALITY COSTS
( but 100% ~ costs may become infinity)
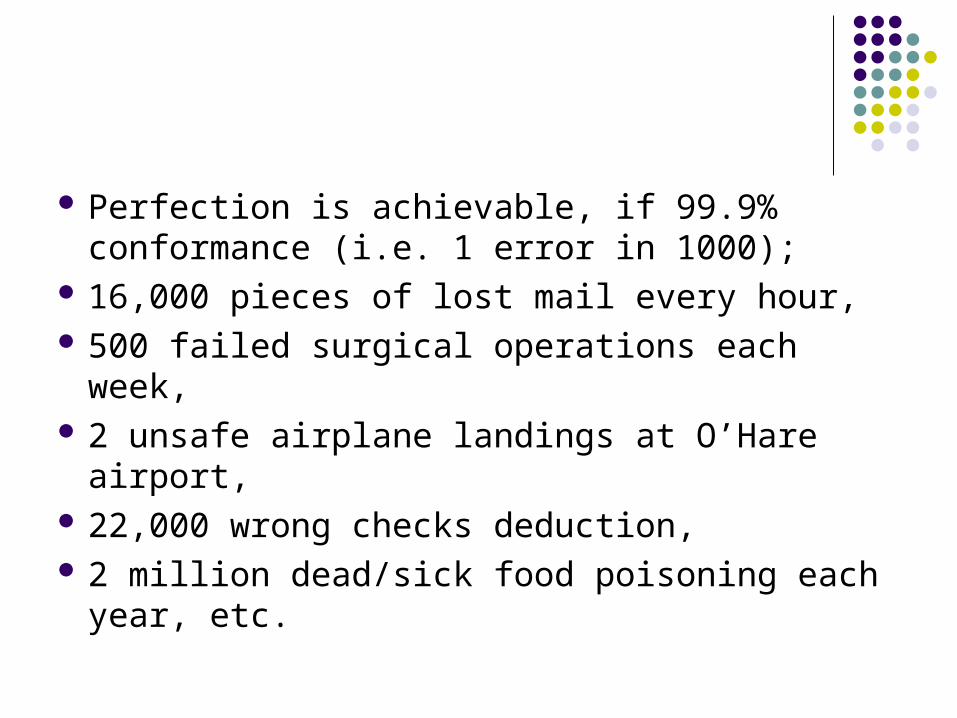
Perfection is achievable, if 99.9% conformance (i.e. 1 error in 1000);
16,000 pieces of lost mail every hour, 500 failed surgical operations each week, 2 unsafe airplane landings at O’Hare airport, 22,000 wrong checks deduction, 2 million dead/sick food poisoning each year,
etc.
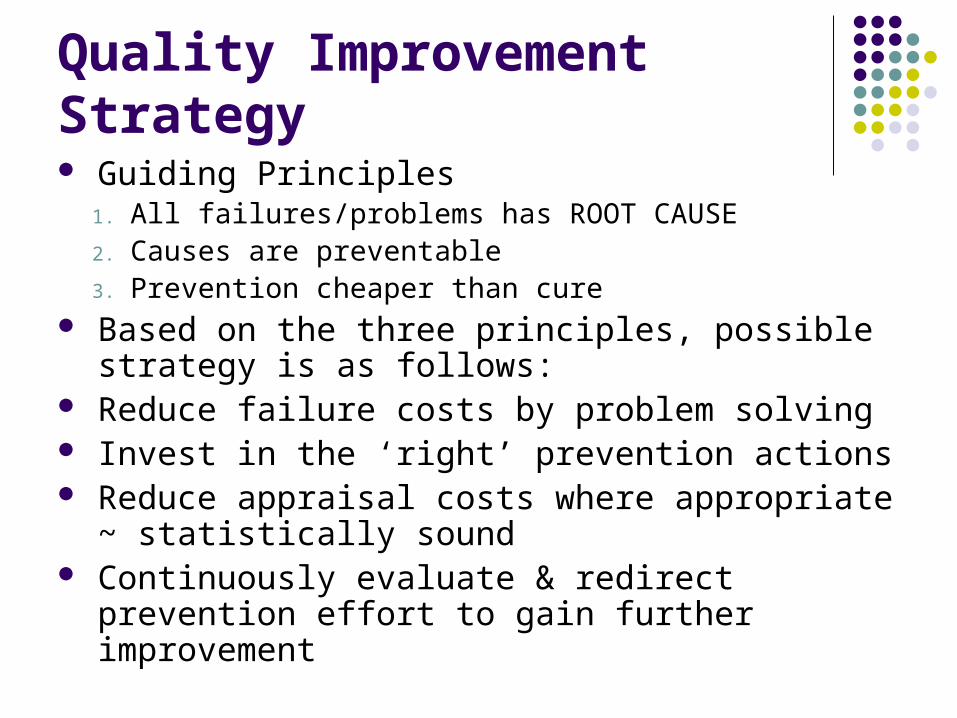
Quality Improvement Strategy Guiding Principles
1. All failures/problems has ROOT CAUSE2. Causes are preventable3. Prevention cheaper than cure
Based on the three principles, possible strategy is as follows:
Reduce failure costs by problem solving Invest in the ‘right’ prevention actions Reduce appraisal costs where appropriate ~
statistically sound Continuously evaluate & redirect prevention effort to
gain further improvement
Malcolm Baldrige National Quality Award (MBNQA) Annual award to recognize US organizations
for performance excellence Established Public Law 100-107 on August
1987 Award promotes :
understanding of the requirements for performance excellence and competitiveness improvement
sharing of information on successful performance strategies, and benefits derived form those strategies

Malcolm Baldrige National Quality Award
5 categories – manufacturing, service, small business, health care, education
Organizations use criteria as a technique to measure their TQM effort on an annual basis (conduct self assessment)
Core values and concepts embodied in seven categories
Categories further subdivided into examination items – 19 items (always improving)
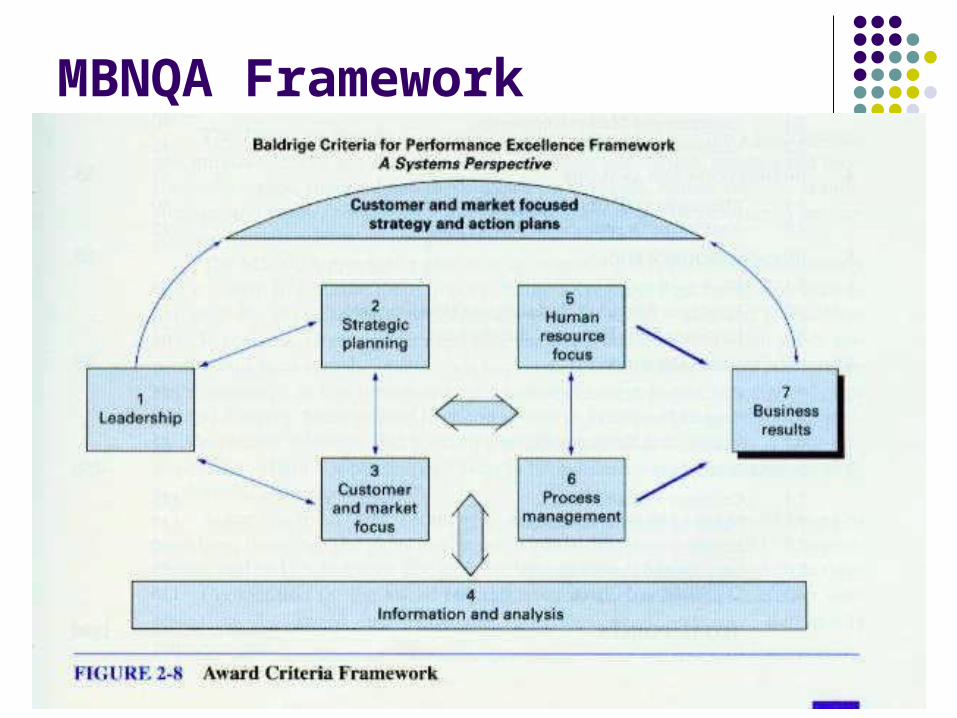
MBNQA Framework
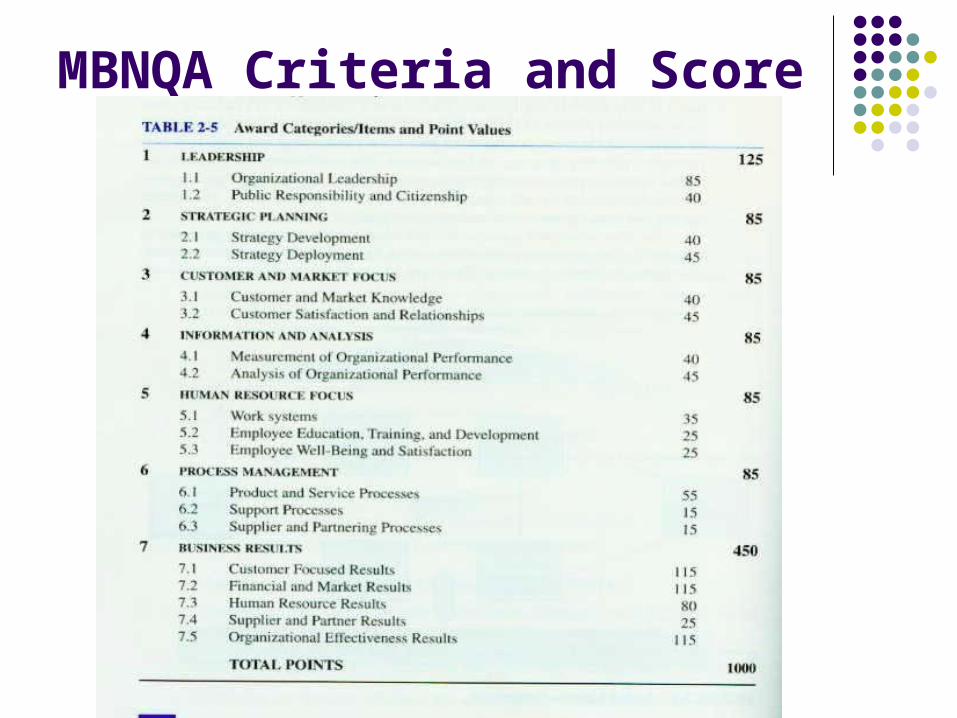
MBNQA Criteria and Score
Other performance measures
Balanced scorecard – Customer Measures, Financial measures, Learning and growth, internal processes (integrated as strategic management and communication tools)
Six sigma program – what sigma level