chapter 257 np charts - ncss · the np chart versus the p chart the np chart is very similar to the...
TRANSCRIPT

NCSS Statistical Software NCSS.com
257-1 © NCSS, LLC. All Rights Reserved.
Chapter 257
NP Charts Introduction This procedure generates the NP control chart for the number nonconforming of a sample. The format of the control charts is fully customizable. This procedure permits the defining of stages. For the NP chart, the value for P can be entered directly or NP can be estimated from the data, or a sub-set of the data. A list of out-of-control points can be produced in the output, if desired, and proportion nonconforming values may be stored to the spreadsheet.
NP Control Charts NP charts are used to monitor the number of nonconforming units of a process based on samples taken from the process at given times (hours, shifts, days, weeks, months, etc.). Typically, an initial series of samples is used to estimate the average number of nonconforming units per sample. The estimated average is then used to produce control limits for the number of nonconforming units. During this initial phase, the process should be in control. If points are out-of-control during the initial (estimation) phase, the assignable cause should be determined and the sample should be removed from estimation.
Once the control limits have been established for the NP chart, these limits may be used to monitor the number nonconforming going forward. When a point is outside these established control limits it indicates that the number of nonconforming units of the process is out-of-control. An assignable cause is suspected whenever the control chart indicates an out-of-control process.
NCSS Statistical Software NCSS.com NP Charts
257-2 © NCSS, LLC. All Rights Reserved.
The NP Chart versus the P Chart The NP chart is very similar to the P chart. Rather than focusing on the proportion of nonconforming units, as does the P chart, the NP chart focuses on the average number of non-conforming units. As such, choice of the P or NP chart is simply a matter of preference, as each is a scaled version of the other. One case in which the P chart may be recommended over the NP chart is the case where the sample size varies across samples, since the P chart is easier to interpret for this scenario.
NP Chart Formulas Suppose we have k samples, each of size n. Let Di represent the number of nonconforming units in the ith sample.
Formulas for the Points on the Chart Each point on the chart is given by Di, the number of nonconforming units in the ith sample.
Estimating the NP Chart Center Line In the NP Charts procedure, the center line proportion may be input directly, or it may be estimated from a series of samples. If it is estimated from the samples the formula for the center line is pn , where
k
p
kn
Dp
k
ii
k
ii ∑∑
== == 11
NP Chart Limits The lower and upper control limits for the P chart are calculated using the formulas
( )ppnmpnLCL −−= 1
( )ppnmpnUCL −+= 1 where m is a multiplier (usually set to 3) chosen to control the likelihood of false alarms (out-of-control signals when the process is in control).
Runs Tests The strength of control charts comes from their ability to detect sudden changes in a process that result from the presence of assignable causes. Unfortunately, the NP chart is poor at detecting drifts (gradual trends) or small shifts in the process. For example, there might be a positive trend in the last ten samples, but until a number of nonconforming units goes above the upper control limit, the chart gives no indication that a change has taken place in the process.
Runs tests can be used to check control charts for unnatural patterns that are most likely caused by assignable causes. Runs tests are sometimes called “pattern tests”, “out-of-control” tests, or “zones rules”.
While runs tests may be helpful in identifying patterns or smaller shifts in the proportion, they also increase the likelihood of false positive indications. The rate of false positives is typically measured using the average run length (the average length of a run before a false positive is indicated). When several runs tests are used the average run length of the control chart becomes very short.

NCSS Statistical Software NCSS.com NP Charts
257-3 © NCSS, LLC. All Rights Reserved.
In order to perform the runs tests, the control chart is divided into six equal zones (three on each side of the center line). Since the control limit is three sigma limits (three standard deviations of the proportion) in width, each zone is one sigma wide and is labeled A, B, or C, with the C zone being the closest to the center line. There is a lower zone A and an upper zone A. The same is true for B and C. The runs tests look at the pattern in which points fall in these zones.
The runs tests used in this procedure are described below.
Test 1: Any Single Point Beyond Zone A This runs test simply indicates a single point is beyond one of the two three-sigma limits.
Test 2: Two of Three Successive Points in Zone A or Beyond This usually indicates a shift in the process average. Note that the two points have to be in the same Zone A, upper or lower. They cannot be on both sides of the center line. The third point can be anywhere.
Test 3: Four of Five Successive Points in Zone B or Beyond This usually indicates a shift in the process average. Note that the odd point can be anywhere.
Test 4: Eight Successive Points in Zone C or Beyond All eight points must be on one side of the center line. This is another indication of a shift in the process average.
Test 5: Fifteen Successive Points Fall in Zone C on Either Side of the Center Line Although this pattern might make you think that the variation in your process has suddenly decreased, this is usually not the case. It is usually an indication of stratification in the sample. This happens when the samples come from two distinct distributions having different means. Perhaps there are two machines that are set differently. Try to isolate the two processes and check each one separately.
Test 6: Eight of Eight Successive Points Outside of Zone C This usually indicates a mixture of processes. This can happen when two supposedly identical production lines feed a single production or assembly process. You must separate the processes to find and correct the assignable cause.
There are, of course, many other sets of runs tests that have been developed. You should watch your data for trends, zig-zags, and other nonrandom patterns. Any of these conditions could be an indication of an assignable cause and would warrant further investigation.
Issues in Using Control Charts There are several additional considerations surrounding the use of control charts that will not be addressed here. Some important questions are presented below without discussion. For a full treatment of these issues you should consider a statistical quality control text such as Ryan (2011) or Montgomery (2013).
Sample Size How many items should be sampled for each sample? How does the sample size affect my use of control charts? What about unequal sample sizes?

NCSS Statistical Software NCSS.com NP Charts
257-4 © NCSS, LLC. All Rights Reserved.
Dealing with Out-of-Control Points How do you deal with out-of-control points once they have been detected? Should they be included or excluded in the process proportion estimate?
Control Limit Multiplier Three-sigma limits are very common. When should one consider a value other than three?
Startup Time How many samples should be used to establish control for my process?
Data Structure In this procedure, the data are entered in two columns. One column contains the sample size for each sample, the other column contains the number of nonconforming units.
Example dataset
N Nonconf 50 2 50 8 50 6 50 3 50 4 50 2 50 7 50 1 50 9 50 7 50 3 50 5 . . . . . .

NCSS Statistical Software NCSS.com NP Charts
257-5 © NCSS, LLC. All Rights Reserved.
Procedure Options This section describes the options available in this procedure. To find out more about using a procedure, go to the Procedures chapter.
Variables Tab This panel specifies the variables that will be used in the analysis.
Variables
Sample Size Variable Specify the column containing the sample sizes for each sample.
Number Nonconforming Variable Specify the column containing the number of nonconforming units for each sample.
Stages
Number of Stages Specify whether the analyses and charts are to be produced based on a single set of samples, or a series of sets of samples. Typically a single stage is used unless you wish to have separate estimation for various segments of the samples. When using multiple stages, the software requires that there be at least one sample in every stage specified.
Stage Specification Specify whether the various stages will be defined using a variable (column) with a unique value for each stage, or by entering a range of rows for each stage.
• Stage Variable N NC Stage 50 6 1 50 7 1 50 5 1 50 5 1 50 7 1 50 8 2 50 6 2 50 6 2 50 5 2 . . . . . . . . .
• Enter a range for each stage 1-50, 51-100, 101-150
This would produce three stages. The first stage would be made up of rows 1 to 50, the second stage would be rows 51 to 100, and the third stage would be rows 101 to 150.
NCSS Statistical Software NCSS.com NP Charts
257-6 © NCSS, LLC. All Rights Reserved.
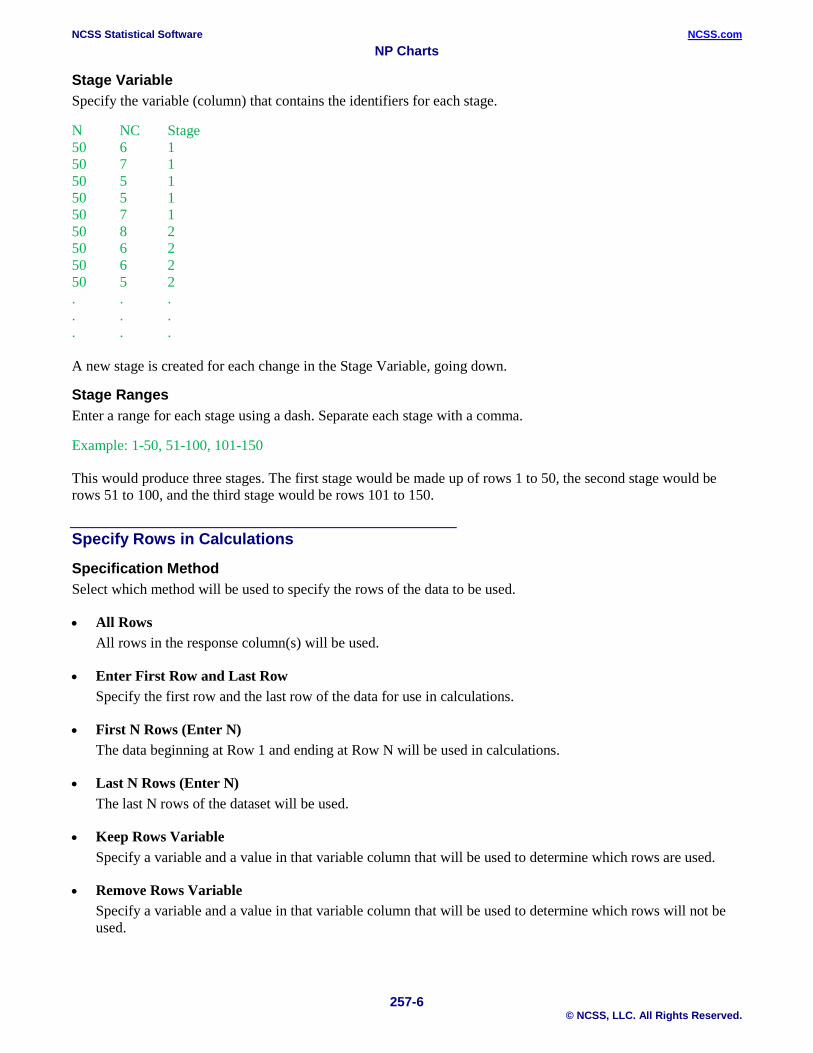
Stage Variable Specify the variable (column) that contains the identifiers for each stage. N NC Stage 50 6 1 50 7 1 50 5 1 50 5 1 50 7 1 50 8 2 50 6 2 50 6 2 50 5 2 . . . . . . . . .
A new stage is created for each change in the Stage Variable, going down.
Stage Ranges Enter a range for each stage using a dash. Separate each stage with a comma. Example: 1-50, 51-100, 101-150 This would produce three stages. The first stage would be made up of rows 1 to 50, the second stage would be rows 51 to 100, and the third stage would be rows 101 to 150.
Specify Rows in Calculations
Specification Method Select which method will be used to specify the rows of the data to be used.
• All Rows All rows in the response column(s) will be used.
• Enter First Row and Last Row Specify the first row and the last row of the data for use in calculations.
• First N Rows (Enter N) The data beginning at Row 1 and ending at Row N will be used in calculations.
• Last N Rows (Enter N) The last N rows of the dataset will be used.
• Keep Rows Variable Specify a variable and a value in that variable column that will be used to determine which rows are used.
• Remove Rows Variable Specify a variable and a value in that variable column that will be used to determine which rows will not be used.

NCSS Statistical Software NCSS.com NP Charts
257-7 © NCSS, LLC. All Rights Reserved.
First Row Specify the beginning row to be used.
Last Row Specify the last row to be used.
N Enter the number of rows to be used.
Keep Rows Variable This variable (column) is used to specify which rows of the data will be used for the calculations.
Keep Rows Value This value determines which rows of the Keep Rows Variable will be used in the calculation portion of the analysis.
Remove Rows Variable This variable (column) is used to specify which rows of the data will not be used for the calculations.
Remove Rows Value This value determines which rows of the Remove Rows Variable will not be used in the calculation portion of the analysis.
Specify Rows in Charts
Specification Method Select which method will be used to specify the rows of the data to be used for the charts.
• All Rows All rows in the response column(s) will be used.
• Enter First Row and Last Row Specify the first row and the last row of the data for use in the plots.
• First N Rows (Enter N) The data beginning at Row 1 and ending at Row N will be used in the plots.
• Last N Rows (Enter N) The last N rows of the dataset will be used.
• Keep Rows Variable Specify a variable and a value in that variable column that will be used to determine which rows are used.
• Remove Rows Variable Specify a variable and a value in that variable column that will be used to determine which rows will not be used.
First Row Specify the beginning row to be used for the first sample.
Last Row Specify the last row to be used for the last sample.

NCSS Statistical Software NCSS.com NP Charts
257-8 © NCSS, LLC. All Rights Reserved.
N Enter the number of rows to be used.
Keep Rows Variable This variable (column) is used to specify which rows of the data will be used for the plots.
Keep Rows Value This value determines which rows of the Keep Rows Variable will be used in the plots.
Remove Rows Variable This variable (column) is used to specify which rows of the data will not be used for the plots.
Remove Rows Value This value determines which rows of the Remove Rows Variable will not be used in the plots.
Labels (Optional)
Sample Label Variable Specify a variable (column) that contains the desired x axis (sample) labels for plots. If left blank, the plot will use the row number. The format of the labels is controlled on the x axis tab of the plot format window.
Point Label Variable Specify a variable (column) that contains the desired individual point labels for plots. If left blank, no point labels are shown. The format of the labels is controlled on the main chart tab of the plot format window.
Estimation & Limits Tab The options on the Estimation & Limits tab are used to specify the estimation of P, the specification limits, and the limit multipliers.
NP Chart Options
Estimation of P Specify whether the center line will be estimated from the data, or whether it will be specified directly.
• From Data Estimate the value of P from the samples specified for calculations.
• Enter Value(s) of P Specify directly the value for P. If multiple stages are used, separate the values for each stage by spaces.
• Use a Variable with Value(s) of P Specify a column containing the value of P in row 1. If multiple stages are used, a value should be entered in a separate cell for each stage, beginning with row 1 for the first stage.
Value(s) of P Enter the value to be used for the P. If multiple stages are used, separate the center line values for each stage by spaces.

NCSS Statistical Software NCSS.com NP Charts
257-9 © NCSS, LLC. All Rights Reserved.
Variable with P Specify a column containing the value of P in row 1. If multiple stages are used, a value for P should be entered in a separate cell for each stage, beginning with row 1 for the first stage.
Specification Limits
Lower Limit Enter an optional lower specification limit for display on the NP chart. These limits are not the control limits.
Upper Limit Enter an optional upper specification limit for display on the NP chart. These limits are not the control limits.
Limit Multipliers
Primary Limit Multiplier This option specifies the multiplier of the standard deviation for the primary control limits. For the well-known 3-sigma limits, the multiplier is set to 3.
Secondary Limit Multiplier This option specifies the multiplier of the standard deviation for the optional, secondary control limits. The secondary limits may be shown on the plot by checking the 'Secondary Limit' option on the plot format window.
Reports Tab The following options control the format of the reports.
Specify Reports
Chart Summary (Control Limits and Estimation) Section This report gives the numeric values of the center lines and limits.
Out-of-Control List Section This report shows the out-of-control points and the corresponding reason (runs test or outside control limit).
Report Options
Precision Specify the precision of numbers in the report. A single-precision number will show seven-place accuracy, while a double-precision number will show thirteen-place accuracy. Note that the reports are formatted for single precision. If you select double precision, some numbers may run into others. Also note that all calculations are performed in double precision regardless of which option you select here. This is for reporting purposes only.
Variable Names This option lets you select whether to display variable names, variable labels, or both.
Page Title This option specifies a title to appear at the top of each page.
Plot Subtitle This option specifies a subtitle to appear at the top of each plot.

NCSS Statistical Software NCSS.com NP Charts
257-10 © NCSS, LLC. All Rights Reserved.
NP Chart Tab This panel sets the options used to define the appearance of the NP chart.
Select Plots
NP Chart Each chart is controlled by three form objects:
1. A checkbox to indicate whether the chart is displayed.
2. A format button used to call up the plot format window (see Attribute Chart Format Options below for more formatting details).
3. A second checkbox used to indicate whether the chart can be edited during the run.
Storage Tab The options on this panel control the automatic storage of the values of P on the current dataset.
Storage Columns
Store Values of P in Column You can automatically store the proportions of each sample into the column specified here.
Warning: Any data already in this column is replaced. Be careful not to specify columns that contain important data.

NCSS Statistical Software NCSS.com NP Charts
257-11 © NCSS, LLC. All Rights Reserved.
Attribute Chart Format Window Options This section describes the specific options available on the Attribute Chart Format window, which is displayed when the Attribute Chart Format button is clicked. Common options, such as axes, labels, legends, and titles are documented in the Graphics Components chapter.
Attribute Chart Tab
Symbols Section You can modify the attributes of the symbols using the options in this section.
Lines Section You can specify the format of the various lines using the options in this section. Note that when shading is desired, the fill will be to the bottom for single lines (such as the mean line), and between the lines for pairs of lines (such as primary limits).
Titles, Legend, Numeric Axis, Group Axis, Grid Lines, and Background Tabs Details on setting the options in these tabs are given in the Graphics Components chapter. The legend does not show by default, but can easily be included by going to the Legend tab and clicking the Show Legend checkbox.

NCSS Statistical Software NCSS.com NP Charts
257-12 © NCSS, LLC. All Rights Reserved.
Example 1 – NP Chart Analysis (Phase I) This section presents an example of how to run an initial NP Chart analysis to establish control limits. In this example, a specific location of an automotive connection will be examined for a leak. Seventy connections are to be examine each day for 40 days to establish control of the process. The data used are in the Leak dataset.
You may follow along here by making the appropriate entries or load the completed template Example 1 by clicking on Open Example Template from the File menu of the P Charts window.
1 Open the Leak dataset. • From the File menu of the NCSS Data window, select Open Example Data. • Click on the file Leak.NCSS. • Click Open.
2 Open the NP Charts window. • Using the Analysis or Graphics menu or the Procedure Navigator, find and select the NP Charts
procedure. • On the menus, select File, then New Template. This will fill the procedure with the default template.
3 Specify the variables. • On the NP Charts window, select the Variables tab. • Double-click in the Sample Size Variable text box. This will bring up the variable selection window. • Select Size from the list of variables and then click Ok. “Size” will appear in the Sample Size Variable
box. • Double-click in the Number Nonconforming Variable text box. This will bring up the variable selection
window. • Select Leak from the list of variables and then click Ok. “Leak” will appear in the Number
Nonconforming Variable box.
4 Run the procedure. • From the Run menu, select Run Procedure. Alternatively, just click the green Run button.
Estimation and Limit Section
Estimation and Limit Section for Samples 1 to 40 Number of Samples 40 Sample Size Variable Size Number Nonconforming Variable Leak Average Average # Total Total # Proportion - Number Nonconf. Limits - Sample Size Nonconf. Sample Size Nonconf. Nonconf. Lower Limit Upper Limit 70.00 7.425000 2800 297 0.1060714 0.000000 15.153957
This section displays the calculation values and limits that are to be used in the NP chart. The formulas for each calculation are described in the NP chart formula section toward the beginning of this chapter.
Average Sample Size This is the average of all the sample sizes.
Average Number Nonconforming This is the average number of nonconforming units.
Total Sample Size This is the sum of all the sample sizes.

NCSS Statistical Software NCSS.com NP Charts
257-13 © NCSS, LLC. All Rights Reserved.
Total Number Nonconforming This is the sum of all the numbers of nonconforming units.
Proportion Nonconforming This is the proportion of nonconforming units.
Number Nonconforming Limits These are the lower and upper control limits for the NP chart.
NP Chart
The NP chart shows the sequence of numbers of leaking connections. The chart shows that samples 32 and 33 merit further investigation for an assignable cause. After reviewing the records, the investigators found that the 32nd and 33rd samples came during and immediately after the training of a new connection installer.
Out-of-Control List
Out-of-Control List for Samples 1 to 40 Number Row Nonconforming Row Label Reason 32 24.0 32 beyond control limits 33 19.0 33 beyond control limits 34 5.0 34 2 of 3 in zone A 37 2.0 37 2 of 3 in zone A
This report provides a list of the samples that failed one of the runs tests (including points outside the control limits). The report shows that samples 32 and 33 are beyond the control limits. Because the 32nd and 33rd samples
NCSS Statistical Software NCSS.com NP Charts
257-14 © NCSS, LLC. All Rights Reserved.
came during and immediately after the training of a new connection installer, the investigators determine that the chart limits should be revised to exclude samples 32 and 33. Samples 34 and 37 show runs in the data, but they do seem to signal an important change in the process.
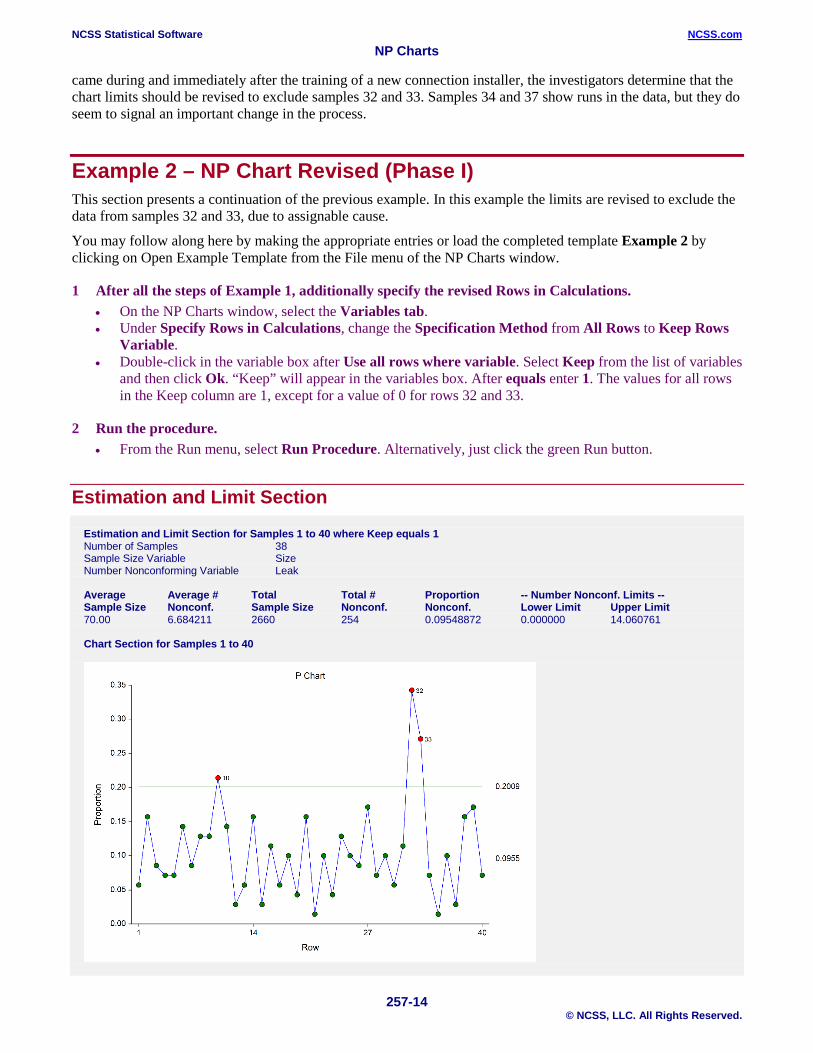
Example 2 – NP Chart Revised (Phase I) This section presents a continuation of the previous example. In this example the limits are revised to exclude the data from samples 32 and 33, due to assignable cause.
You may follow along here by making the appropriate entries or load the completed template Example 2 by clicking on Open Example Template from the File menu of the NP Charts window.
1 After all the steps of Example 1, additionally specify the revised Rows in Calculations. • On the NP Charts window, select the Variables tab. • Under Specify Rows in Calculations, change the Specification Method from All Rows to Keep Rows
Variable. • Double-click in the variable box after Use all rows where variable. Select Keep from the list of variables
and then click Ok. “Keep” will appear in the variables box. After equals enter 1. The values for all rows in the Keep column are 1, except for a value of 0 for rows 32 and 33.
2 Run the procedure. • From the Run menu, select Run Procedure. Alternatively, just click the green Run button.
Estimation and Limit Section
Estimation and Limit Section for Samples 1 to 40 where Keep equals 1 Number of Samples 38 Sample Size Variable Size Number Nonconforming Variable Leak Average Average # Total Total # Proportion -- Number Nonconf. Limits -- Sample Size Nonconf. Sample Size Nonconf. Nonconf. Lower Limit Upper Limit 70.00 6.684211 2660 254 0.09548872 0.000000 14.060761 Chart Section for Samples 1 to 40

NCSS Statistical Software NCSS.com NP Charts
257-15 © NCSS, LLC. All Rights Reserved.
Out-of-Control List for Samples 1 to 40 Number Row Nonconforming Row Label Reason 10 15.0 10 beyond control limits 32 24.0 32 beyond control limits 33 19.0 33 beyond control limits 34 5.0 34 2 of 3 in zone A
The limits in this report and chart are now based on all samples except samples 32 and 33. The values for samples 32 and 33 are included in the chart, but they are not included in the calculations. Because two of the more extreme values were removed, the control limits are narrower than those of Example 1. Although sample 10 now gives an out-of-control signal, the investigators did not find an assignable cause and therefore chose to leave sample 10 in the calculations of the center line and limits. Sample 34 gives an out-of-control signal due to samples 32 and 33 being beyond zone A.
The NP chart can be additionally enhanced by labeling the points that were not included in the calculations. To do this, set the Point Label Variable to Label. Chart Section for Samples 1 to 40

NCSS Statistical Software NCSS.com NP Charts
257-16 © NCSS, LLC. All Rights Reserved.
Example 3 – NP Chart Analysis (Phase II) Continuing with Examples 1 and 2, the investigators obtain samples for an additional 20 days. They wish to use the limits based on the first 40 samples, excluding samples 32 and 33.
You may follow along here by making the appropriate entries or load the completed template Example 3 by clicking on Open Example Template from the File menu of the NP Charts window.
1 Open the Leak dataset. • From the File menu of the NCSS Data window, select Open Example Data. • Click on the file Leak.NCSS. • Click Open.
2 Open the NP Charts window. • Using the Analysis or Graphics menu or the Procedure Navigator, find and select the NP Charts
procedure. • On the menus, select File, then New Template. This will fill the procedure with the default template.
3 Specify the variables. • On the NP Charts window, select the Variables tab. • Double-click in the Sample Size Variable text box. This will bring up the variable selection window. • Select SizeCont from the list of variables and then click Ok. “SizeCont” will appear in the Sample Size
Variable box. • Double-click in the Number Nonconforming Variable text box. This will bring up the variable selection
window. • Select LeakCont from the list of variables and then click Ok. “LeakCont” will appear in the Number
Nonconforming Variable box.
4 Specify the Rows in Calculations. • On the NP Charts window, select the Variables tab. • Under Specify Rows in Calculations, change the Specification Method from All Rows to Keep Rows
Variable. • Double-click in the variable box after Use all rows where variable. Select KeepCont from the list of
variables and then click Ok. “KeepCont” will appear in the variables box. After equals enter 1.
5 Specify the labels. • On the NP Charts window, select the Variables tab. • Double-click in the Point Label Variable text box. This will bring up the variable selection window. • Select Label from the list of variables and then click Ok. “Label” will appear in the Point Label Variable
box.
6 Run the procedure. • From the Run menu, select Run Procedure. Alternatively, just click the green Run button.
NCSS Statistical Software NCSS.com NP Charts
257-17 © NCSS, LLC. All Rights Reserved.
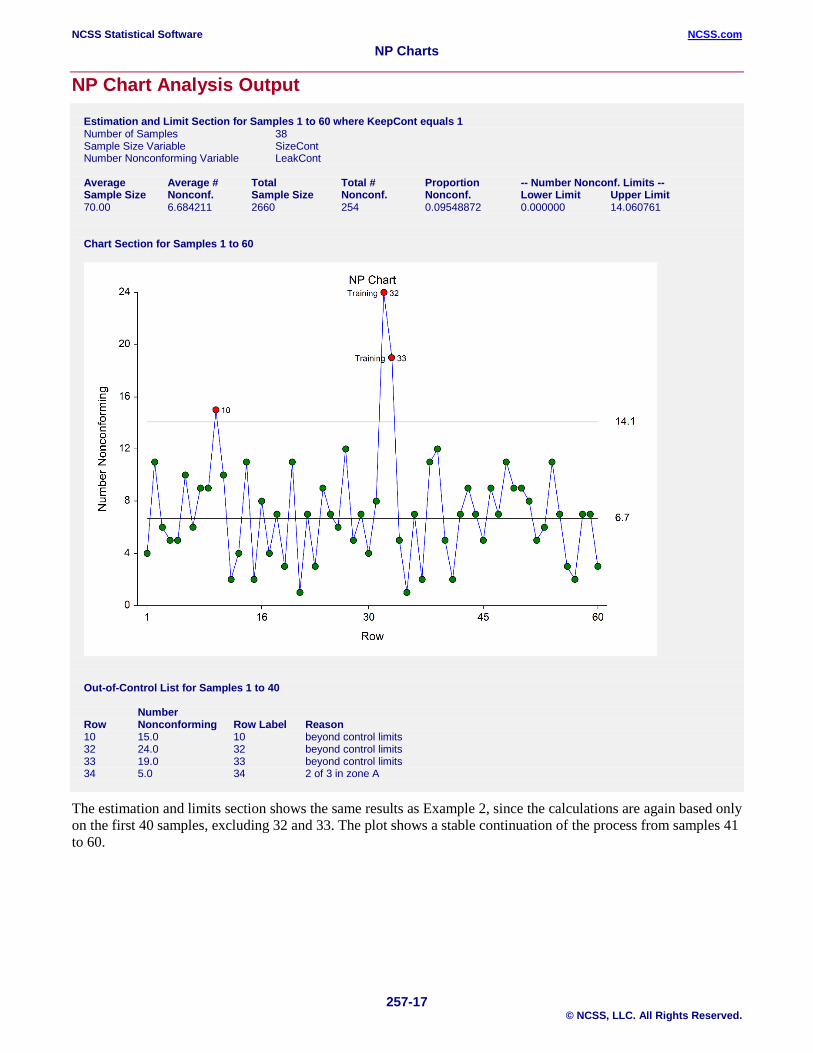
NP Chart Analysis Output
Estimation and Limit Section for Samples 1 to 60 where KeepCont equals 1 Number of Samples 38 Sample Size Variable SizeCont Number Nonconforming Variable LeakCont Average Average # Total Total # Proportion -- Number Nonconf. Limits -- Sample Size Nonconf. Sample Size Nonconf. Nonconf. Lower Limit Upper Limit 70.00 6.684211 2660 254 0.09548872 0.000000 14.060761 Chart Section for Samples 1 to 60
Out-of-Control List for Samples 1 to 40 Number Row Nonconforming Row Label Reason 10 15.0 10 beyond control limits 32 24.0 32 beyond control limits 33 19.0 33 beyond control limits 34 5.0 34 2 of 3 in zone A
The estimation and limits section shows the same results as Example 2, since the calculations are again based only on the first 40 samples, excluding 32 and 33. The plot shows a stable continuation of the process from samples 41 to 60.

NCSS Statistical Software NCSS.com NP Charts
257-18 © NCSS, LLC. All Rights Reserved.
Example 4 – NP Chart with Additional Formatting This example uses the same setup as Example 3, except that a variety of improvements are made in the plot format. These improvements are made by clicking the NP Chart format button on the NP Chart tab.
You can load the completed template Example 4 by clicking on Open Example Template from the File menu of the NP Charts window.
NP Chart
As shown here, a variety of enhancements can be made to the formatting of the control chart to make the chart as easy to read as possible.

NCSS Statistical Software NCSS.com NP Charts
257-19 © NCSS, LLC. All Rights Reserved.
Example 5 – NP Chart with Stages This section presents a continuation of Examples 1, 2, and 3. After the first 60 days, a new connection process is implemented to reduce the number of leaks. The investigators obtained samples of the process for 60 additional days, using the first 30 samples of the additional 60 days (61 to 90) to determine the in-control limits of the updated process. The investigators wish to view the entire progress of the process, beginning with day 1. This example shows the use of stages to monitor a process with a change in center line and limit calculations.
You may follow along here by making the appropriate entries or load the completed template Example 5 by clicking on Open Example Template from the File menu of the NP Charts window.
1 Open the Leak dataset. • From the File menu of the NCSS Data window, select Open Example Data. • Click on the file Leak.NCSS. • Click Open.
2 Open the NP Charts window. • Using the Analysis or Graphics menu or the Procedure Navigator, find and select the NP Charts
procedure. • On the menus, select File, then New Template. This will fill the procedure with the default template.
3 Specify the variables. • On the NP Charts window, select the Variables tab. • Double-click in the Sample Size Variable text box. This will bring up the variable selection window. • Select SizeStage from the list of variables and then click Ok. “SizeStage” will appear in the Sample Size
Variable box. • Double-click in the Number Nonconforming Variable text box. This will bring up the variable selection
window. • Select LeakStage from the list of variables and then click Ok. “LeakStage” will appear in the Number
Nonconforming Variable box.
4 Specify the stages. • On the NP Charts window, select the Variables tab. • For Number of Stages select Multiple Stages. • For Stage Variable select Stage.
5 Specify the Rows in Calculations. • On the NP Charts window, select the Variables tab. • Under Specify Rows in Calculations, change the Specification Method from All Rows to Keep Rows
Variable. • Double-click in the variable box after Use all rows where variable. Select KeepStage from the list of
variables and then click Ok. “KeepStage” will appear in the variables box. After equals enter 1.
6 Specify the labels. • On the NP Charts window, select the Variables tab. • Double-click in the Point Label Variable text box. This will bring up the variable selection window. • Select Label from the list of variables and then click Ok. “Label” will appear in the Point Label Variable
box.
7 Run the procedure. • From the Run menu, select Run Procedure. Alternatively, just click the green Run button.

NCSS Statistical Software NCSS.com NP Charts
257-20 © NCSS, LLC. All Rights Reserved.
Estimation and Limit Section
Estimation and Limit Section for Samples 1 to 60 where KeepStage equals 1 Number of Samples 38 Sample Size Variable SizeStage Number Nonconforming Variable LeakStage Average Average # Total Total # Proportion -- Number Nonconf. Limits -- Sample Size Nonconf. Sample Size Nonconf. Nonconf. Lower Limit Upper Limit 70.00 6.684211 2660 254 0.09548872 0.000000 14.060761 Estimation and Limit Section for Samples 61 to 120 where KeepStage equals 1 Number of Samples 30 Sample Size Variable SizeStage Number Nonconforming Variable LeakStage Average Average # Total Total # Proportion -- Number Nonconf. Limits -- Sample Size Nonconf. Sample Size Nonconf. Nonconf. Lower Limit Upper Limit 70.00 4.100000 2100 123 0.05857143 0.000000 9.993956
This section displays the estimation for each stage separately. The average number nonconforming is decreased by about 40%.
NP Chart
The NP chart shows the substantial decrease in the number of leaking connections in the second stage. The center line and limits of the second stage are estimated from samples 61 to 90.

NCSS Statistical Software NCSS.com NP Charts
257-21 © NCSS, LLC. All Rights Reserved.
Out-of-Control List
Out-of-Control List for Samples 1 to 40 Number Row Nonconforming Row Label Reason 10 15.0 10 beyond control limits 32 24.0 32 beyond control limits 33 19.0 33 beyond control limits 34 5.0 34 2 of 3 in zone A
With no new out-of-control points, the out-of-control list is the same as that of the previous examples. There is not an Out-of-Control List for samples 61 to 120 since there are no out-of-control points in this group.