chapter 20 ensuring ecological integrity, clean and...
TRANSCRIPT

Note: This RDP 2017-2022 Midterm Update Chapter is still preliminary and subject to further review and RDC approval. This draft is NOT official and no part of this document may be cited or quoted. This is being circulated for public consultation purposes.
1
Chapter 20 1
Ensuring Ecological Integrity, 2
Clean and Healthy Environment 3
4 5 Fundamental to achieving sustainable development is the capacity of the 6 environment to support the productive sector, livelihood, cultural activities, and 7 human settlements and sustain its functions to provide the necessary ecosystem 8
services (e.g., flood protection and sediment regulation). Hence, it is critical that 9 conservation and protection measures are in place to ensure that human activities 10 do not go beyond ecological limits. However, with the increasing population and 11 intensified risks under a changing climate, the longstanding challenges on resource 12 depletion and degradation are becoming more difficult to address especially in highly 13
resource-dependent communities in the Region. 14
15 Maintaining ecological integrity and improving the current state of the environment 16
are among the critical drivers to achieve higher economic growth in the region. 17 Hence, prioritizing investments to related activities will enable a paradigm shift 18 towards a balanced and inclusive growth for future generations. 19
20 The management and overall performance of the environment and natural resources 21 sector from 2017 to the first half of 2019 has improved. However, environmental 22
quality has declined and disaster vulnerability and damage remain to be a challenge 23 for the region. 24
25
26
Assessment and Challenges 27
28
Sustained biodiversity and functioning of ecosystem services 29 30
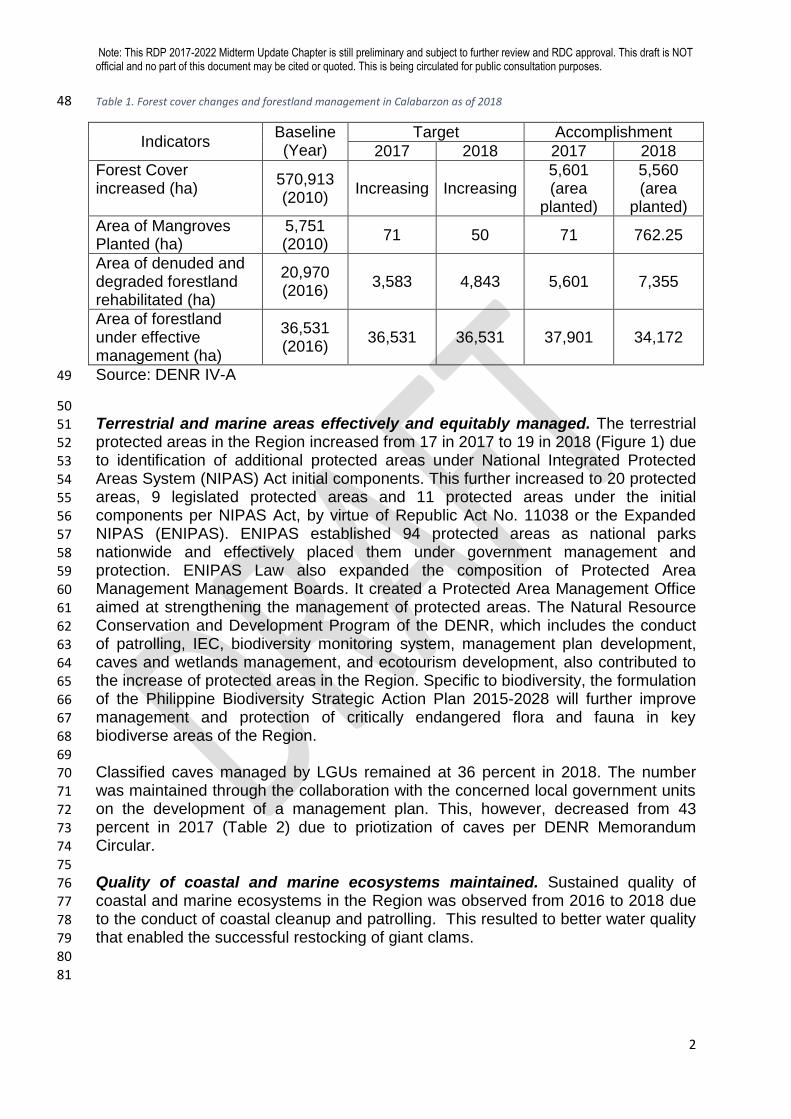
Forest cover and watershed improved but the area of forestland under 31 effective management decreased. The Region’s 570,913 hectare forest cover in 32 2016 was expected to increase as 5,601 hectares and 5,560 hectares were planted 33 with forest trees in 2017 and 2018, respectively because of the Enhanced National 34 Greening Program (ENGP). In terms of area of mangroves planted, there was an 35
increase in mangrove forest extent from 5,751 hectares in 2010 to 6,584.25 hectares 36 in 2018 which exceeded the target of 5,872 hectares for the same period. The same 37 trend was observed in the area of rehabilitated denuded and degraded forestland 38 from 20,970 hectares in 2016 to 33,926 hectares in 2018. The increasing trend is 39 attributed to the ENGP’s maintenance activities, seedling replacement, regular 40
weeding, and watering. However, the area of forestland under effective management 41 decreased from 36, 531 hectares in 2016 to 34,172 hectares in 2018 due to the 42
expiration of the 25-year Stewardship Contract of one tenurial instrument under 43 Community Based Forest Management Agreement and eight other tenurial 44 instruments. Table 1 shows the summary of forest cover changes and forestland 45 management in the Region as of 2018. 46 47
Note: This RDP 2017-2022 Midterm Update Chapter is still preliminary and subject to further review and RDC approval. This draft is NOT official and no part of this document may be cited or quoted. This is being circulated for public consultation purposes.
2
Table 1. Forest cover changes and forestland management in Calabarzon as of 2018 48
Indicators Baseline (Year)
Target Accomplishment
2017 2018 2017 2018
Forest Cover increased (ha)
570,913 (2010)
Increasing Increasing 5,601 (area
planted)
5,560 (area
planted)
Area of Mangroves Planted (ha)
5,751 (2010)
71 50 71 762.25
Area of denuded and degraded forestland rehabilitated (ha)
20,970 (2016)
3,583 4,843 5,601 7,355
Area of forestland under effective management (ha)
36,531 (2016)
36,531 36,531 37,901 34,172
Source: DENR IV-A 49
50
Terrestrial and marine areas effectively and equitably managed. The terrestrial 51 protected areas in the Region increased from 17 in 2017 to 19 in 2018 (Figure 1) due 52 to identification of additional protected areas under National Integrated Protected 53
Areas System (NIPAS) Act initial components. This further increased to 20 protected 54 areas, 9 legislated protected areas and 11 protected areas under the initial 55 components per NIPAS Act, by virtue of Republic Act No. 11038 or the Expanded 56
NIPAS (ENIPAS). ENIPAS established 94 protected areas as national parks 57 nationwide and effectively placed them under government management and 58
protection. ENIPAS Law also expanded the composition of Protected Area 59 Management Management Boards. It created a Protected Area Management Office 60 aimed at strengthening the management of protected areas. The Natural Resource 61
Conservation and Development Program of the DENR, which includes the conduct 62
of patrolling, IEC, biodiversity monitoring system, management plan development, 63 caves and wetlands management, and ecotourism development, also contributed to 64 the increase of protected areas in the Region. Specific to biodiversity, the formulation 65 of the Philippine Biodiversity Strategic Action Plan 2015-2028 will further improve 66
management and protection of critically endangered flora and fauna in key 67 biodiverse areas of the Region. 68 69 Classified caves managed by LGUs remained at 36 percent in 2018. The number 70 was maintained through the collaboration with the concerned local government units 71
on the development of a management plan. This, however, decreased from 43 72 percent in 2017 (Table 2) due to priotization of caves per DENR Memorandum 73 Circular. 74 75
Quality of coastal and marine ecosystems maintained. Sustained quality of 76 coastal and marine ecosystems in the Region was observed from 2016 to 2018 due 77 to the conduct of coastal cleanup and patrolling. This resulted to better water quality 78
that enabled the successful restocking of giant clams. 79 80 81

Note: This RDP 2017-2022 Midterm Update Chapter is still preliminary and subject to further review and RDC approval. This draft is NOT official and no part of this document may be cited or quoted. This is being circulated for public consultation purposes.
3
82 Figure 1. Geographic distribution of protected areas in Calabarzon83

Note: This RDP 2017-2022 Midterm Update Chapter is still preliminary and subject to further review and RDC approval. This draft is NOT official and no part of this document may be cited or quoted. This is being circulated for public consultation purposes.
4
Table 2. Status of terrestrial and marine area management in Calabarzon as of 2018 84
Indicators Baseline (2016)
Target Accomplishment
2017 2018 2017 2018
Percentage of Terrestrial protected areas (PAs)
100% (19)
100% 100% 89% (17)
100%
Percentage of classified caves effectively and equitably managed by LGUs
36% 36% 36% 43% 36%
Quality of coastal and marine habitats improved (ha)
Coral reef: Giant clams reseeded in
133.757 hectares
Maintained quality
Maintained quality
Maintained quality
Maintained quality
Source: DENR IV-A 85 86
Quality of wetlands and caves maintained. Like the coastal and marine 87 ecosystems, the quality of the wetland ecosystems in the Region was maintained. 88 Table 3 shows that the priority inland/wetland effectively managed in remained at 89
eight hectares (two hectares in Batangas, five hectares in Laguna and one hectare in 90 Quezon) from 2016 to 2018 through the collaborative efforts of the DENR IV-A and 91
concerned LGUs in developing the management plan and the latter’s issuance of 92 Sanggunian Resolution. The number, however, declined from 12 wetlands in 2017 93
due to DENR IV-A’s limited resources. 94 95 Table 3. Status of wetlands and caves in Calabarzon as of 2018 96
Indicators Baseline (2016)
Target Accomplishment
2017 2018 2017 2018
Area of priority inland/wetland effectively managed (ha)
8 6 4 12 8
Management of caves with high conservation value improved
5 8 8 8 8
Number of caves effectively managed (No data) 8 8 8 8
Source: DENR IV-A 97 98 Caves with high conservation value improved from five in 2016 to eight in 2018. The 99
improvement may be attributed to the prioritization of caves within protected areas 100 and the issuance of Memorandum Circular 2012-03, 2014-03, and 2015-08. 101 Meanwhile, there were eight caves effectively managed in 2018 found in the 102 Provinces of Laguna and Quezon as seen in Table 4. 103
104 105

Note: This RDP 2017-2022 Midterm Update Chapter is still preliminary and subject to further review and RDC approval. This draft is NOT official and no part of this document may be cited or quoted. This is being circulated for public consultation purposes.
5
Table 4. Caves with approved management plan in Calabarzon in 2018 106
Cave Location
1. Butas Kabag 2 Cave Brgy. San Diego, Luisiana, Laguna
2. Cave No. 2 (Mona Cave)
Brgy. Danlagan Batis, Guinyanagan, Quezon
3. Cave No.3 (Balete Cave)
4. Cave No.4 (Twin Cave I)
5. Cave No. 7 (Pavillion Cave)
6. Cave No. 9 (Unnamed Cave)
7. Cave No. 10 (Unnamed Cave)
8. Malusak Cave Brgy. Malusak, Atimonan, Quezon
Source: DENR IV-A 107 108
109 Beneficiaries with secured land tenure increased. There were 5,466 residential 110
free patents in residential lands zoned as residential areas issued to beneficiaries 111 from 2017 to October 2019. This is less than the 5,850 target for the same time 112
period due to low applications received by DENR Region IV-A. On the other hand, 113 there were 3,741 beneficiaries with secured land tenure in public agricultural 114 alienable and disposable lands from 2017 to October 2019, as seen in Table 5. This 115 is higher than the 2,200 beneficiaries targeted for the same period. The 116
accomplishments may be attributed to the strengthening of the database through the 117 implementation of land administration and management system (LAMS). 118
119 Table 5. Free patents issued to beneficiaries in Calabarzon as of October 2019 120
Indicators Baseline (2016)
Target Accomplishment
2017 2018 2019 2017 2018 2019
Number of residential free patents issued
2,969 2,550 1,700 1,600 2,238 1,944 1,284
(as of Oct)
Number of beneficiaries with secured land tenure in public agricultural A&D lands
1,532 1,000 620 580 1,366 1,114 991
(as of Oct)
Number of beneficiaries with secured land tenure in residential lands zoned as residential areas
2,969 2,550 1,700 1,600 2,238 1,944 1,284
(as of Oct)
Source: DENR IV-A 121 122
123
Land Administration and Management improved through LAMS. The target of 124
14,000 surveys was likewise surpassed as 17,690 were inspected, verified, and 125
approved through LAMS from 2017 to October 2019. The shift from manual to 126 computerized processing through the implementation of LAMS is a major factor in 127 the increasing number of accomplishment for survey approval. 128 129 Meanwhile, jobs generated from reforestation and non-timber/agroforestry 130 enterprises increased from 8,194 in 2016 to 16,829 as of the first half of 2019. This 131
Note: This RDP 2017-2022 Midterm Update Chapter is still preliminary and subject to further review and RDC approval. This draft is NOT official and no part of this document may be cited or quoted. This is being circulated for public consultation purposes.
6
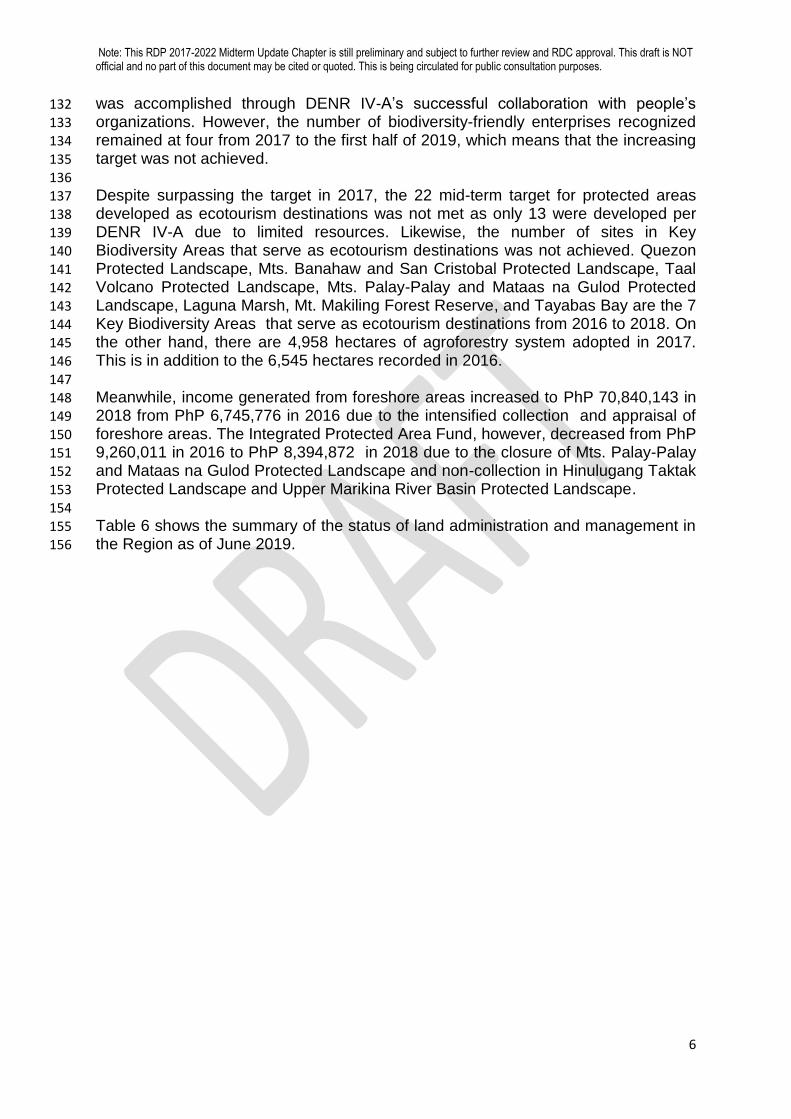
was accomplished through DENR IV-A’s successful collaboration with people’s 132
organizations. However, the number of biodiversity-friendly enterprises recognized 133 remained at four from 2017 to the first half of 2019, which means that the increasing 134 target was not achieved. 135
136 Despite surpassing the target in 2017, the 22 mid-term target for protected areas 137 developed as ecotourism destinations was not met as only 13 were developed per 138 DENR IV-A due to limited resources. Likewise, the number of sites in Key 139 Biodiversity Areas that serve as ecotourism destinations was not achieved. Quezon 140
Protected Landscape, Mts. Banahaw and San Cristobal Protected Landscape, Taal 141 Volcano Protected Landscape, Mts. Palay-Palay and Mataas na Gulod Protected 142 Landscape, Laguna Marsh, Mt. Makiling Forest Reserve, and Tayabas Bay are the 7 143 Key Biodiversity Areas that serve as ecotourism destinations from 2016 to 2018. On 144 the other hand, there are 4,958 hectares of agroforestry system adopted in 2017. 145
This is in addition to the 6,545 hectares recorded in 2016. 146
147 Meanwhile, income generated from foreshore areas increased to PhP 70,840,143 in 148
2018 from PhP 6,745,776 in 2016 due to the intensified collection and appraisal of 149 foreshore areas. The Integrated Protected Area Fund, however, decreased from PhP 150 9,260,011 in 2016 to PhP 8,394,872 in 2018 due to the closure of Mts. Palay-Palay 151
and Mataas na Gulod Protected Landscape and non-collection in Hinulugang Taktak 152 Protected Landscape and Upper Marikina River Basin Protected Landscape. 153 154
Table 6 shows the summary of the status of land administration and management in 155 the Region as of June 2019. 156
Note: This RDP 2017-2022 Midterm Update Chapter is still preliminary and subject to further review and RDC approval. This draft is NOT official and no part of this document may be cited or quoted. This is being circulated for public consultation purposes.
7
Table 6. Status of land administration and management in Calabarzon as of June 2019 157
Indicators Baseline
(2016) Target Accomplishment
2017 2018 2019 2017 2018 2019
Inspection, verification, and
approval of surveys through
LAMS
78,722 6,000 4,000 4,000 6,336 6,271 5,083 (as of
October)
Employment from ecotourism
and resource-based industries
increased
245 Increasing Increasing Increasing Increasing Increasing
Number of biodivesity-friendly
entrerprise recognized
increased.
n.d. Increasing Increasing 7 4 4
Jobs generated from
reforestation and non-
timber/agro forestry enterprises
incresed
8,194 1058 Increasing Increasing 3540 2996 2,099 (as of
June)
Number of sites/ Protected
areas developed as ecotourism
destinations
7 10 22 22 13 13
Number of sites in Key
Biodiversity Areas that serve as
ecotourism destinations
10 10 10 10 10 10
Area of agroforestry system
adopted
6,545 4,958 4,957 2,865 4,948
Increased income generated
from foreshore areas (PhP)
6,745,776 5% increase
from 2016
5% increase
from 2017
5% increase
from 2018
18,702,789 70,840,143
Integrated Protected Area
Fund(IPAF) increased (PhP)
8,502,042 5% increase
from 2016
5% increase
from 2017
5% increase
from 2018
2,564,473.75 2,600,129.75 1,184,273.98
Source: DENR IV-A
Note: This RDP 2017-2022 Midterm Update Chapter is still preliminary and subject to further review and RDC approval. This draft is NOT official and no part of this document may be cited or quoted. This is being circulated for public consultation purposes.
8
Environmental quality 158
159
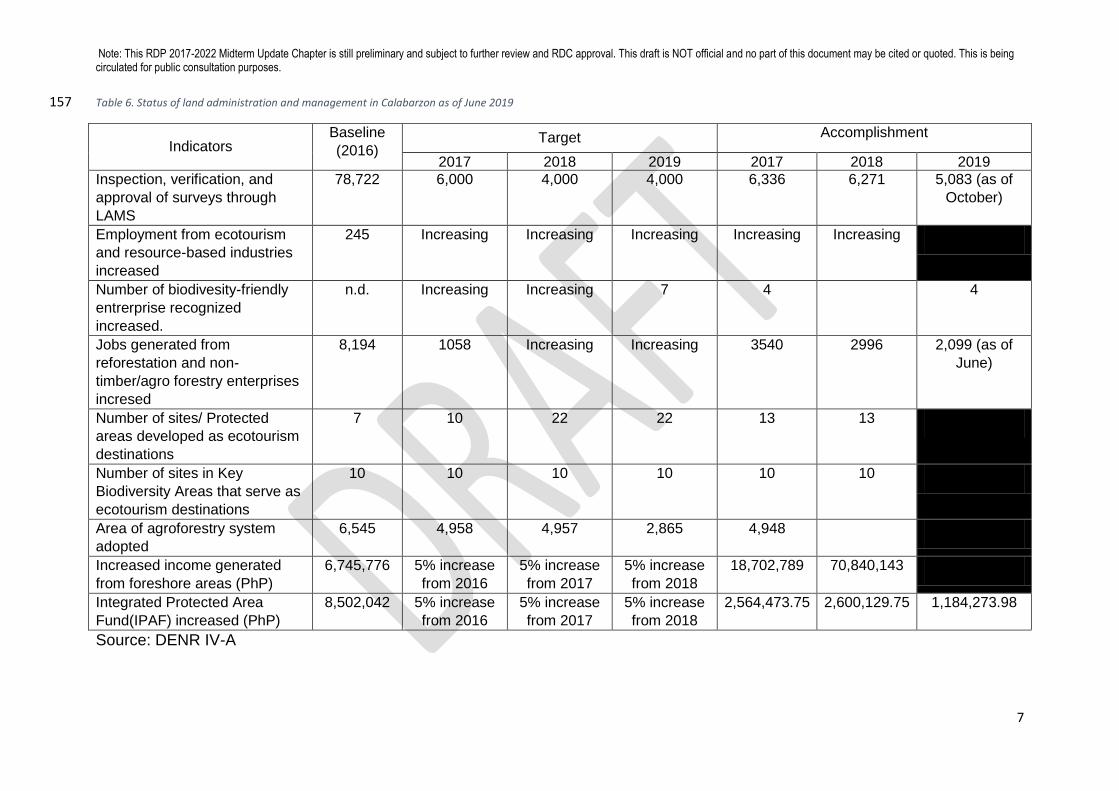
160 Ambient air quality in three monitoring stations generally improved but quality 161
monitoring instruments remain unreliable. The Region has four air quality 162 monitoring stations which are located in the cities of Biñan and Santa Rosa in 163 Laguna, Antipolo in Rizal, and Indang in Cavite. 164 165 In 2017, the City of Santa Rosa 1 did not meet the 25 μg/NCM standard for 166
atmospheric particulate matters2, recording an annual average of 34.12 micrograms 167 per normal cubic meter of air (μg/NCM). The city still failed to pass the standard in 168 2018 despite improving to 27.59 μg/NCM. Air quality in the Cities of Antipolo and 169 Biñan passed the standard at 17.24 and 9.83 μg/NCM, respectively in 2018. 170 171
Meanwhile, air quality monitoring for the first semester of 2019 shows the cities of 172
Biñan and Santa Rosa are within the standard at 18.74 and 10.35 μg/NCM, 173
respectively. 174
175
Table 7. Ambient air quality in three urban areas of Calabarzon from 2017 to 2018 176
Urban Areas/Stations Ambient Air Quality (PM2.5, Annual)
Standard μg/NCM
2017 μg/NCM
2018 μg/NCM
2019 (1st Sem) μg/NCM
Antipolo
25
No reading 17.24 No reading
Biñan City Incomplete reading 9.83 18.74
Santa Rosa City 34.12 27.59 10.35
Source: DENR-EMB IV-A 177 178
Water quality of major water bodies failed to meet Class C and SB standards. 179 Most of the critical water bodies including the 11 priority river systems, Manila Bay, 180
and Matabungkay, Lemery, and Nasugbu Beaches did not meet the targeted water 181 quality standards (Tables 8-11). 182 183 The Region’s priority river systems failed to meet water quality guidelines for Class C 184
Standard or for food production use from 2016 to the first semester of 2019. Failure 185 to meet the target is due to high BOD, chloride, ammonia, and phosphate and very 186 high fecal coliform content, as seen in Table 8. 187
188 189
Table 8. Water quality of priority river systems in Calabarzon 190
River System (Province)
Year BOD mg/L
Chloride mg/L
Color TCU
DO mg/L
FC MPN/100
ml
NH3-N
mg/L
pH PO43-
mg/L T C
TSS mg/L
7 350 75 5 200 0.05 6.5-9.0
0.5 25-32
110
Imus 2017 15.53 181.425 32.25 5.41 1,456,530 1.499 7.92 1.208 43.84
1 Sta. Rosa was the only city that has complete recording on air quality for the whole year of 2017
2 Particulate matters that have a diameter of less than 2.5 micrometers (PM 2.5)

Note: This RDP 2017-2022 Midterm Update Chapter is still preliminary and subject to further review and RDC approval. This draft is NOT official and no part of this document may be cited or quoted. This is being circulated for public consultation purposes.
9
River System (Province)
Year BOD mg/L
Chloride mg/L
Color TCU
DO mg/L
FC MPN/100
ml
NH3-N
mg/L
pH PO43-
mg/L T C
TSS mg/L
7 350 75 5 200 0.05 6.5-9.0
0.5 25-32
110
(Cavite) 2018 10.25 123 8.13 5.41 480,101 3.965 7.80 1.434 19.81
2019* 14.58 372.67 25.98 4.402 1,356,914 7.419 7.50 1.67 199.6
Ylang-Ylang (Cavite)
2017 62.25 93.65 78.25 4.62 56,265 0.62 7.8 0.95 96.1
2018 122.1 468 257.00 5.00 280,001 1.915 7.69 1.669 976.7
2019* 161 656.667 14.167 4.187 315,423 1.185 7.63 1.488 28 141.4
Rio Grande (Cavite)
2017 8.71 12.75 21.07 5.96 1,689,669 0.043 7.56 0.83 68.75
2018 6.00 26.32 9.82 6.07 1,029,080 1.122 8.04 1.499 20.86
2019* 8.048 56.786 11.786 5.450 284,130. 2.338 7.80 1.292 28.8 18.74
Cañas (Cavite)
2017 7.67 1,031 29.46 5.43 449,149 0.27 8.01 1.36 24.63
2018 6.08 956 9.17 5.63 211,769 0.169 7.99 0.790 10.50
2019* 7.61 1,024.333 8.75 5.486 583,528 0.379 7.65 1.4618 26.6 49.86
Iyam (Quezon)
2017 48.5 464 14.2 4.6 421,575 0.088 7.6 0.237 15
2018 10 216 8 5.2 185,396 0.207 8.0 0.274 28 15
2019* 12.889 883 11.667 3.533 409,905.3 7.191 0.325 29.33 13.556
Dumacaa (Quezon)
2017 2.9 625 16.3 6.5 45,392 0.086 7.7 0.334 15.2
2018 4 692 8 6.7 74,640 1.101 8.1 0.468 28 16
2019* 2.53 287.67 12 5.30 29,152.19 7.25 0.42 29.20 10.67
Calumpang (Batangas)
2017 17.1 17 4.9 73,683 2.244 8.0 2.995 16
2018 22.3 7,304 8 5.0 35,543 1.908 8.0 1.834 12
2019* 11.50 220.17 8.33 5.95 170 7.37 2.08 29.3 18.17
Pansipit (Batangas)
2017 4.3 10 6.6 4,963 0.014 8.1 0.645 16
2018 4.0 332 5 6.2 3,926 0.015 7.7 0.658 27.1 13
2019* 3.0 87 5 6.5 37,125 6.8 0.788 28 15
Maragondon (Cavite)
2017
2018 2.58 1,157 5.83 7.91 27,701 0.086 7.80 0.490 95.17
2019* 5 1,227 10 6.6 8,132 7.5 0.37 28 23
Labac (Cavite)
2017
2018 6 2,254 5 6.0 100,929 0.681 7.6 1.018 28.3 71
2019* 9 456 15 5.9 25,344 7.3 0.88 28 35
Timalan (Cavite)
2017
2018 5.8 4,836 6 6.6 66,272 0.246 7.5 0.750 28.5 137
2019* 4 50 10 6 1,284 7.4 0.27 28 12
Obispo (Cavite)
2017
2018 3.8 1,499 6 5.9 25,540 0.447 8.0 0.871 28.5 179
2019* 8 62 10 4.3 95,066 7.3 0.74 28 12
Source: DENR-EMB IV-A 191 192
Among the critical water bodies in the Region is the Manila Bay. The overall ambient 193 water quality in the area did not meet the Class SB water quality parameter. The 194
major concerns include low dissolved oxygen that threatens the health of water 195 bodies, huge amount of fecal coliform content which necessitates water treatment 196 facilities, and exceedance in the total suspended solids (TSS), as seen in Table 9. 197
198 199
Table 9. Water quality in 10 sampling stations along Manila Bay 200
Sampling Stations
Year
Color DO FC NH3-N pH PO43- T TSS
TCU mg/L MPN/100 ml mg/L
mg/L C mg/L
50 6 100 0.05 7.0-8.5 0.5 26-30 50
Bacoor Beach
2017 47.25 5.71 173,875.60 1.79 7.75 1.10
22.25
2018 22.50 5.48 4,709.66 0.99 8.40 0.42 28.49 24.50
2019 7.50 4.42 9,228.08 0.44 7.40 0.22
29.33
Lido Beach
2017 49.83 5.88 2,419.95 0.07 7.93 0.21
70.92
2018 7.92 5.15 7,294.87 0.09 8.07 0.16 28.04 49.08
2019 6.67 5.63 2,423.95 0.03 7.48 0.08
64.67
Villamar I 2017 28.75 5.93 3,271.07 0.08 7.82 0.15
64.67

Note: This RDP 2017-2022 Midterm Update Chapter is still preliminary and subject to further review and RDC approval. This draft is NOT official and no part of this document may be cited or quoted. This is being circulated for public consultation purposes.
10
Sampling Stations
Year
Color DO FC NH3-N pH PO43- T TSS
TCU mg/L MPN/100 ml mg/L
mg/L C mg/L
50 6 100 0.05 7.0-8.5 0.5 26-30 50
2018 8.75 6.01 1,972.54 0.09 7.95 0.12 27.67 47.92
2019 6.67 5.52 5,711.53 0.04 7.57 0.09
77.33
Celebrity
2017 32.08 5.57 20,615.21 0.21 7.80 0.31
84.75
2018 8.75 5.78 18,545.34 0.21 7.95 0.16 28.19 67.00
2019 9.17 5.68 17,029.41 0.09 7.16 0.10
124.33
Garden Coast
2017 65.42 6.14 1,308.96 0.08 8.09 0.21
116.50
2018 7.50 5.95 2,148.76 0.07 7.97 0.21 28.31 75.83
2019 6.67 5.77 2,658.99 0.03 7.14 0.06
111.50
Costa Eugenia
2017 75.83 6.15 1,011.00 0.09 7.94 0.17
100.17
2018 10.42 6.53 3,167.07 0.07 7.79 0.16 28.23 68.75
2019 6.67 6.03 1,577.90 0.06 7.38 0.06
80.83
Villa Criselda
2017 37.50 6.13 2,328.61 0.09 7.95 0.21
106.42
2018 7.50 6.37 3,315.64 0.12 8.03 0.17 27.59 122.33
2019 7.50 5.85 1,627.12 0.04 7.51 0.09
90.00
Antonio’s Hideaway
2017 42.67 6.19 950.98 0.05 7.97 0.15
90.42
2018 5.45 6.48 432.12 0.11 7.74 0.20 28.26 75.73
2019 5.83 6.25 197.47 0.08 7.36 0.09
107.67
Daloroy’s Beach Resort
2017 32.08 6.25 736.89 0.05 7.91 0.14
82.17
2018 5.00 6.58 905.00 0.05 7.39 0.12 27.89 83.92
2019 5.83 6.10 87.80 0.02 7.30 0.06
73.83
Bucana Malaki
2017 108.00 6.16 1,730.25 0.08 7.66 0.16
108.70
2018 7.08 6.20 973.21 0.11 7.79 0.18 28.50 125.33
2019 6.67 6.17 1,529.20 0.15 7.38 0.10
135.00
Villa Excellance
2017 23.50 6.06 4091.25 0.07 7.73 0.14
65.40
2018 9.17 6.45 969.01 0.08 8.15 0.17 28.06 64.75
2019 7.50 6.22 1,137.91 0.04 7.03 0.08
113.17
Dalahican
2017 32.00 4.71 31,100.04 0.29 7.89 0.20
41.10
2018 7.92 8.14 66,279.65 0.31 8.14 0.19 27.87 47.92
2019 6.67 4.33 23,392.53 0.44 7.32 0.17
135.83
Mount Sea Resort
2017 62.50 5.56 18,425.07 0.15 7.65 0.31
73.00
2018 7.92 8.35 17,418.37 0.36 8.35 0.37 28.67 131.58
2019 7.50 5.10 58,929.36 0.32 7.36 0.31
98.33
Source: DENR-EMB IV-A 201 202
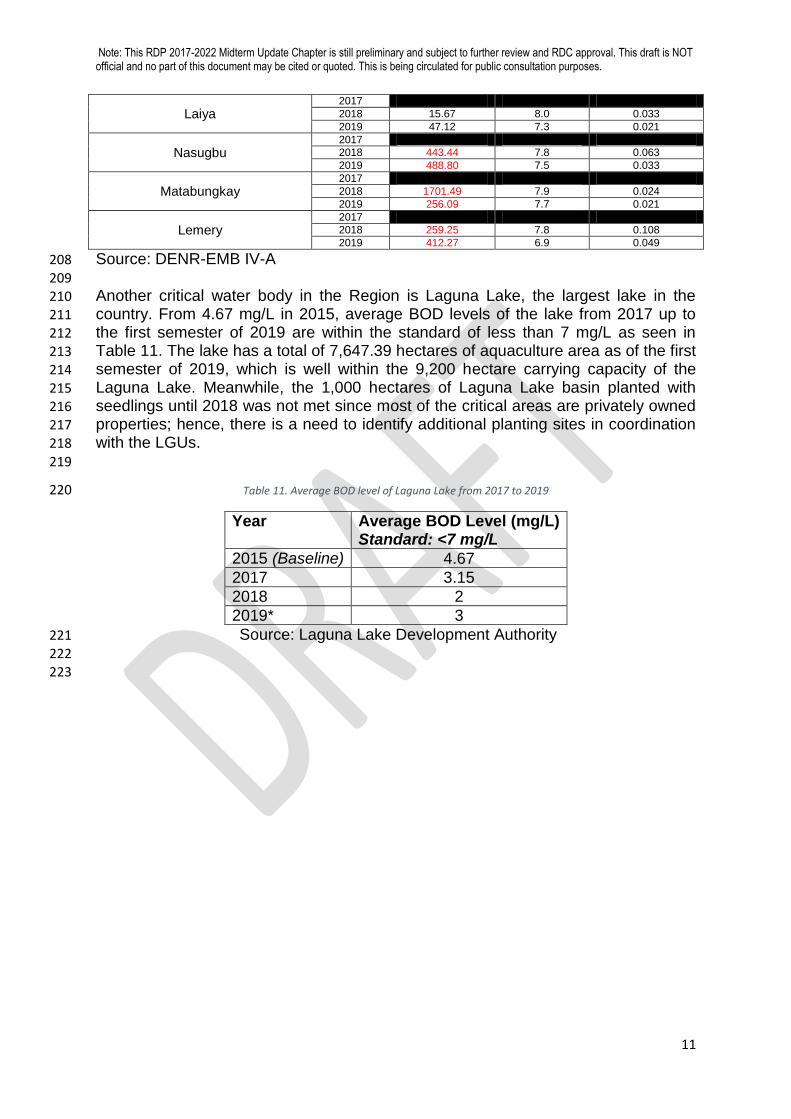
The water quality of major recreational water bodies in the Region also failed the SB 203 Class Standard due to high fecal coliform content save for the sampling stations in 204
Laiya, San Juan, Batangas as seen in Table 10. 205 206 Table 10. Water quality sampling stations in selected recreational water bodies in Calabarzon 207
Sampling Stations Year FC
MPN/100 ml pH PO4
3- mg/L
200 6.0-8.5 0.5
Note: This RDP 2017-2022 Midterm Update Chapter is still preliminary and subject to further review and RDC approval. This draft is NOT official and no part of this document may be cited or quoted. This is being circulated for public consultation purposes.
11
Laiya 2017
2018 15.67 8.0 0.033
2019 47.12 7.3 0.021
Nasugbu 2017
2018 443.44 7.8 0.063
2019 488.80 7.5 0.033
Matabungkay 2017
2018 1701.49 7.9 0.024
2019 256.09 7.7 0.021
Lemery 2017
2018 259.25 7.8 0.108
2019 412.27 6.9 0.049
Source: DENR-EMB IV-A 208 209 Another critical water body in the Region is Laguna Lake, the largest lake in the 210 country. From 4.67 mg/L in 2015, average BOD levels of the lake from 2017 up to 211 the first semester of 2019 are within the standard of less than 7 mg/L as seen in 212
Table 11. The lake has a total of 7,647.39 hectares of aquaculture area as of the first 213 semester of 2019, which is well within the 9,200 hectare carrying capacity of the 214
Laguna Lake. Meanwhile, the 1,000 hectares of Laguna Lake basin planted with 215 seedlings until 2018 was not met since most of the critical areas are privately owned 216 properties; hence, there is a need to identify additional planting sites in coordination 217 with the LGUs. 218
219
Table 11. Average BOD level of Laguna Lake from 2017 to 2019 220
Year Average BOD Level (mg/L) Standard: <7 mg/L
2015 (Baseline) 4.67
2017 3.15
2018 2
2019* 3
Source: Laguna Lake Development Authority 221
222 223
Note: This RDP 2017-2022 Midterm Update Chapter is still preliminary and subject to further review and RDC approval. This draft is NOT official and no part of this document may be cited or quoted. This is being circulated for public consultation purposes.
12
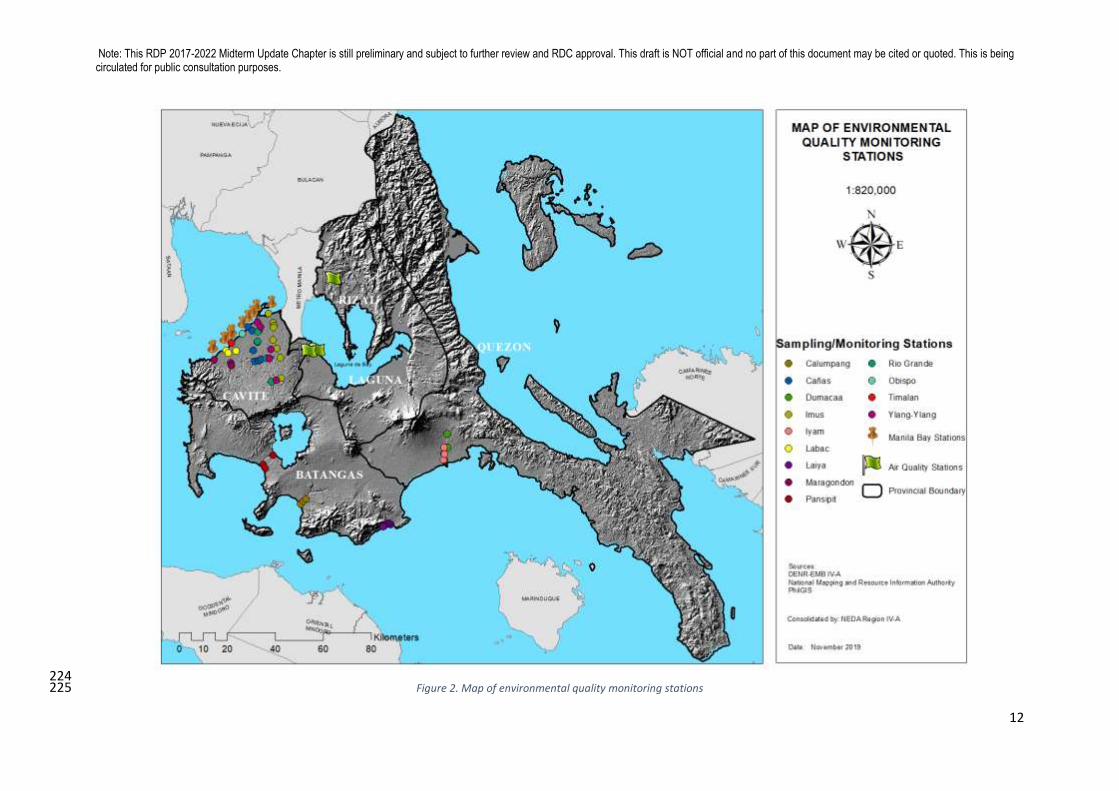
224 Figure 2. Map of environmental quality monitoring stations 225

Note: This RDP 2017-2022 Midterm Update Chapter is still preliminary and subject to further review and RDC approval. This draft is NOT official and no part of this document may be cited or quoted. This is being circulated for public consultation purposes.
13
In terms of water quality management areas (WQMAs), the targets from 2017 to the 226
first semester of 2019 was met. From 1 WQMA (Imus- Ylang ylang- Rio Grande 227 Rivers WQMA) in 2016, the Region now has three operational WQMAs with the 228 addition of Cañas-Maalimango Rivers WQMA and Iyam-Dumacaa River System 229
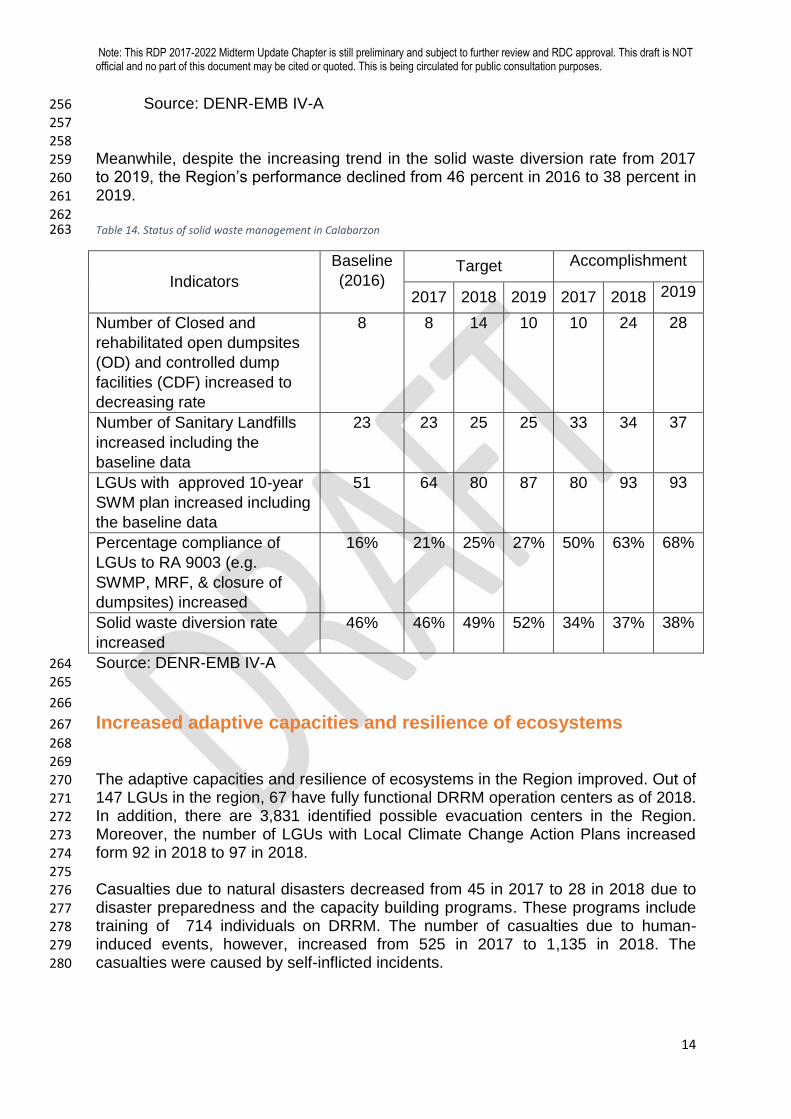
WQMA. 230 231 232 Solid waste management improved but diversion rate targets remained unmet. 233 In terms of solid waste management, the Region achieved most of its targets (Table 234
14). The number of closed and rehabilitated open dumpsites and controlled dump 235 facilities increased from 8 in 2016 to 28 as of the first semester of 2019. Likewise, 236 the number of sanitary landfills in the Region increased from 23 in 2016 to 37 in the 237 first half of 2019. Among the provinces, Quezon has the most number of sanitary 238 landfill at 15 as seen in Table 12. Accomplishment of targets in closed and 239
rehabilitated open and controlled dump facilities and establishment of sanitary 240
landfills is due to DENR-EMB’s provision of financial and technical assistance to 241 LGUs. 242
243 Table 12. Total sanitary landfills in Calabarzon as of June 2019 244
Province 2017 2018 2019 Total Sanitary Landfills
Batangas 7 1 - 8
Cavite 3 - - 3
Laguna 8 - - 8
Quezon 12 - 3 15
Rizal 3 - - 3
TOTAL 33 1 3 37
Source: DENR-EMB IV-A 245
246 Meanwchile, LGUs with approved 10-year Solid Waste Management Plan also 247
increased from 51 in 2016 to 93 by the middle of 2019 due to strict compliance of 248 LGUs. Table 13 shows that the Province of Laguna is the top performing province in 249 the Region with 88 percent of its cities and municipalities with approved Solid Waste 250
Management Development Plans. Likewise, LGU compliance with RA 9003 greatly 251 increased from 16 percent in 2016 to 68 percent in the first semester of 2019 due to 252
frequesnt monitoring of DENR-EMB. 253 254 Table 13. 10-year Solid Waste Management Plan compliance in Calabarzon 255
Province 2017 2018
Approved 10-YR Solid Waste
Management Plan as of 2018
Proportion to total number of
cities/municipalities
Batangas 14 8 22 65%
Cavite 20 2 22 65%
Laguna 30 - 30 88%
Quezon 2 3 5 15%
Rizal 14 - 14 41%
TOTAL 80 13 93 65%
Note: This RDP 2017-2022 Midterm Update Chapter is still preliminary and subject to further review and RDC approval. This draft is NOT official and no part of this document may be cited or quoted. This is being circulated for public consultation purposes.
14
Source: DENR-EMB IV-A 256
257 258
Meanwhile, despite the increasing trend in the solid waste diversion rate from 2017 259
to 2019, the Region’s performance declined from 46 percent in 2016 to 38 percent in 260 2019. 261 262 Table 14. Status of solid waste management in Calabarzon 263
Indicators
Baseline
(2016) Target Accomplishment
2017 2018 2019 2017 2018 2019
Number of Closed and
rehabilitated open dumpsites
(OD) and controlled dump
facilities (CDF) increased to
decreasing rate
8 8 14 10 10 24 28
Number of Sanitary Landfills
increased including the
baseline data
23 23 25 25 33 34 37
LGUs with approved 10-year
SWM plan increased including
the baseline data
51 64 80 87 80 93 93
Percentage compliance of
LGUs to RA 9003 (e.g.
SWMP, MRF, & closure of
dumpsites) increased
16% 21% 25% 27% 50% 63% 68%
Solid waste diversion rate
increased
46% 46% 49% 52% 34% 37% 38%
Source: DENR-EMB IV-A 264
265
266
Increased adaptive capacities and resilience of ecosystems 267
268
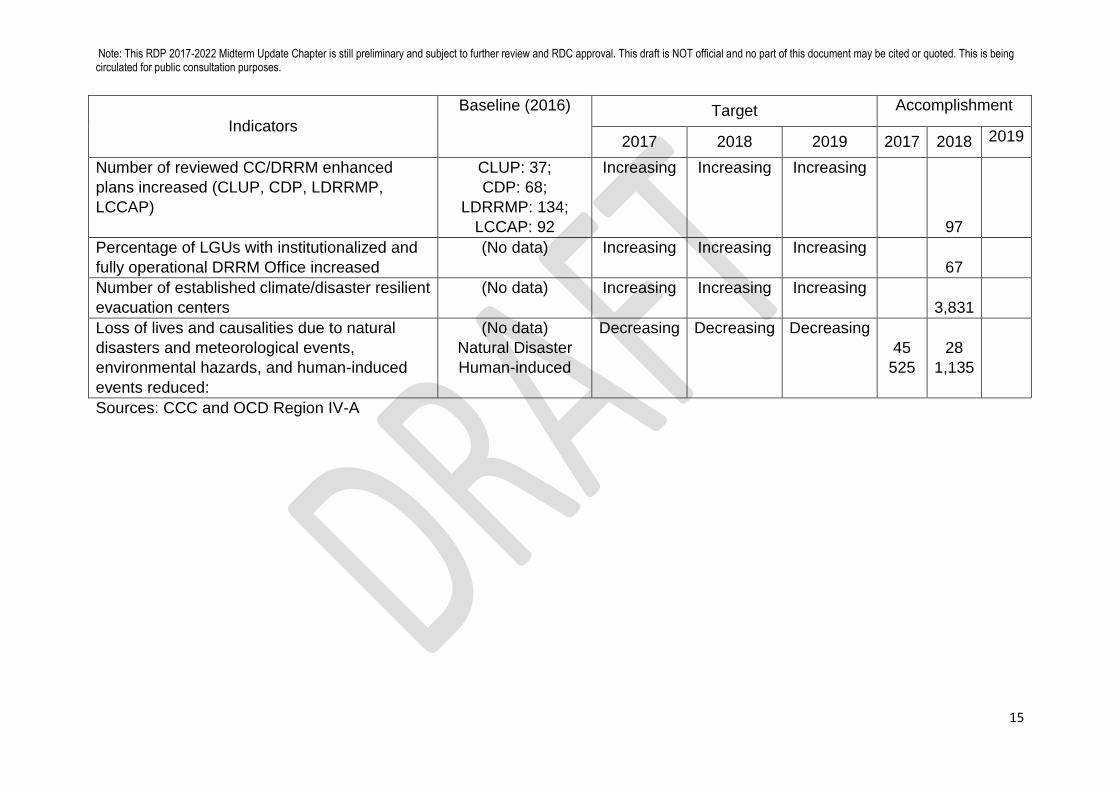
269 The adaptive capacities and resilience of ecosystems in the Region improved. Out of 270
147 LGUs in the region, 67 have fully functional DRRM operation centers as of 2018. 271 In addition, there are 3,831 identified possible evacuation centers in the Region. 272 Moreover, the number of LGUs with Local Climate Change Action Plans increased 273
form 92 in 2018 to 97 in 2018. 274 275 Casualties due to natural disasters decreased from 45 in 2017 to 28 in 2018 due to 276 disaster preparedness and the capacity building programs. These programs include 277
training of 714 individuals on DRRM. The number of casualties due to human-278 induced events, however, increased from 525 in 2017 to 1,135 in 2018. The 279 casualties were caused by self-inflicted incidents. 280
Note: This RDP 2017-2022 Midterm Update Chapter is still preliminary and subject to further review and RDC approval. This draft is NOT official and no part of this document may be cited or quoted. This is being circulated for public consultation purposes.
15
Indicators
Baseline (2016) Target Accomplishment
2017 2018 2019 2017 2018 2019
Number of reviewed CC/DRRM enhanced
plans increased (CLUP, CDP, LDRRMP,
LCCAP)
CLUP: 37;
CDP: 68;
LDRRMP: 134;
LCCAP: 92
Increasing Increasing Increasing
97
Percentage of LGUs with institutionalized and
fully operational DRRM Office increased
(No data) Increasing Increasing Increasing
67
Number of established climate/disaster resilient
evacuation centers
(No data) Increasing Increasing Increasing
3,831
Loss of lives and causalities due to natural
disasters and meteorological events,
environmental hazards, and human-induced
events reduced:
(No data)
Natural Disaster
Human-induced
Decreasing Decreasing Decreasing
45
525
28
1,135
Sources: CCC and OCD Region IV-A

Note: This RDP 2017-2022 Midterm Update Chapter is still preliminary and subject to further review and RDC approval. This draft is NOT official and no part of this document may be cited or quoted. This is being circulated for public consultation purposes.
16
Strategic Framework 281
282
283
The main outcome for the sector is to ensure ecological integrity and to improve the 284 socio-economic conditions of resource-based communities through sustainable 285 integrated area development. In support of the overall sectoral outcome, three major 286 strategies or outcomes will be pursued, namely: a) Biodiversity and functioning of 287 ecosystem services sustained; b) Environmental quality improved; and c) Adaptive 288
capacities and resilience of ecosystems increased. 289 290 Sustainable integrated area development (SIAD) and participatory environmental 291 governance will be an overarching principle in implementing the various strategies to 292 achieve the outcomes. SIAD will be adopted as a strategy to address holistically the 293
environmental, economic, social, political, and cultural challenges and opportunities 294
in a specific area, ensure social justice and improved quality of life. 295 296
Cross-cutting strategies will also be pursued to support the achievement of the 297 environment sector, such as sustainable financing schemes, incentive mechanisms, 298 education and public awareness on ENR, DRRM and CCA efforts will also be 299 operationalized and actively promoted to ensure continuity and effectivity of 300
interventions. 301 302
303
304
305
306

Note: This RDP 2017-2022 Midterm Update Chapter is still preliminary and subject to further review and RDC approval. This draft is NOT official and no part of this document may be cited or quoted. This is being circulated for public consultation purposes.
17
307
Plan Targets 308
309
310
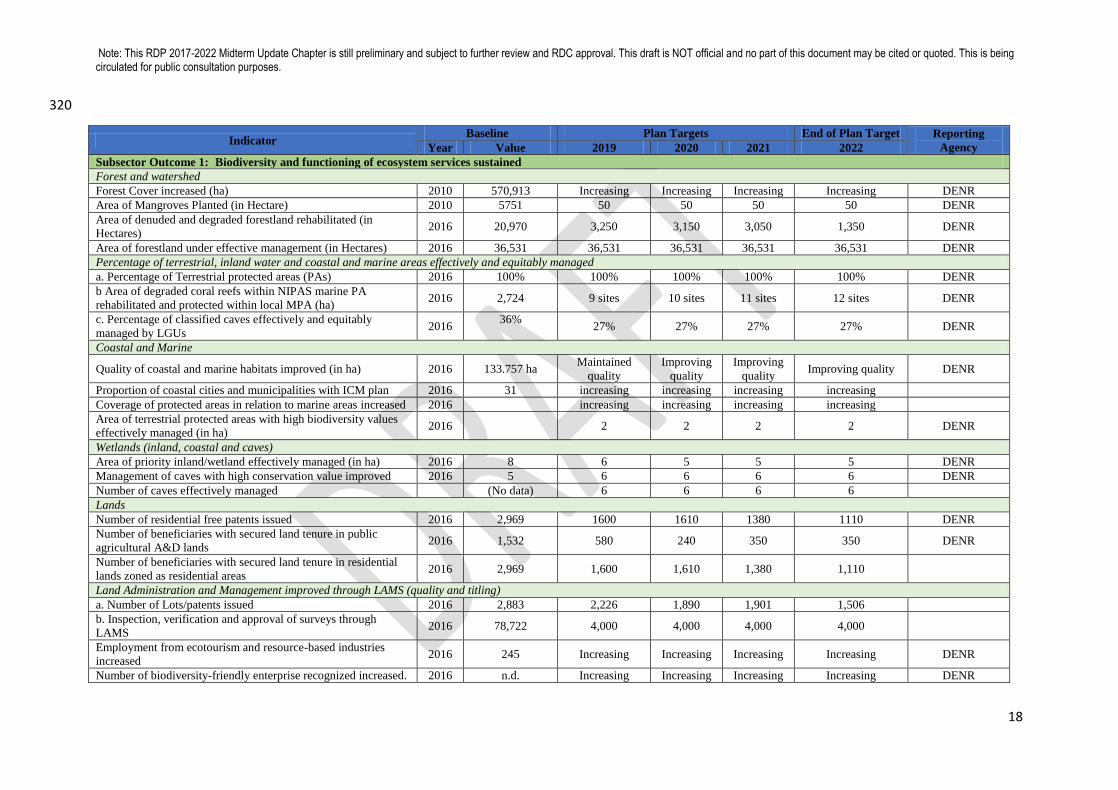
Plan targets for the remaining period, 2020 to 2022, still focus on maintaining the 311
integrity of biodiversity and functioning of ecosystem services, improving the 312
environmental quality, and increasing the adaptive capacity and resilience of 313
ecosystems. 314
Realization of these targets would mean preservation of watersheds and protected 315
areas, effectively and equitably managed resources, air and water quality within the 316
prescribed standards, strict compliance to RA 9003 and solid waste management 317
plans, and religious implementation of climate change and disaster risk and 318
reduction management enhanced plans. 319
Note: This RDP 2017-2022 Midterm Update Chapter is still preliminary and subject to further review and RDC approval. This draft is NOT official and no part of this document may be cited or quoted. This is being circulated for public consultation purposes.
18
320
Indicator Baseline Plan Targets End of Plan Target Reporting
Agency Year Value 2019 2020 2021 2022
Subsector Outcome 1: Biodiversity and functioning of ecosystem services sustained
Forest and watershed
Forest Cover increased (ha) 2010 570,913 Increasing Increasing Increasing Increasing DENR
Area of Mangroves Planted (in Hectare) 2010 5751 50 50 50 50 DENR
Area of denuded and degraded forestland rehabilitated (in
Hectares) 2016 20,970 3,250 3,150 3,050 1,350 DENR
Area of forestland under effective management (in Hectares) 2016 36,531 36,531 36,531 36,531 36,531 DENR
Percentage of terrestrial, inland water and coastal and marine areas effectively and equitably managed
a. Percentage of Terrestrial protected areas (PAs) 2016 100% 100% 100% 100% 100% DENR
b Area of degraded coral reefs within NIPAS marine PA
rehabilitated and protected within local MPA (ha) 2016 2,724 9 sites 10 sites 11 sites 12 sites DENR
c. Percentage of classified caves effectively and equitably
managed by LGUs 2016
36%
27% 27% 27% 27% DENR
Coastal and Marine
Quality of coastal and marine habitats improved (in ha) 2016 133.757 ha Maintained
quality
Improving
quality
Improving
quality Improving quality DENR
Proportion of coastal cities and municipalities with ICM plan 2016 31 increasing increasing increasing increasing
Coverage of protected areas in relation to marine areas increased 2016
increasing increasing increasing increasing
Area of terrestrial protected areas with high biodiversity values
effectively managed (in ha) 2016
2 2 2 2 DENR
Wetlands (inland, coastal and caves)
Area of priority inland/wetland effectively managed (in ha) 2016 8 6 5 5 5 DENR
Management of caves with high conservation value improved 2016 5 6 6 6 6 DENR
Number of caves effectively managed
(No data) 6 6 6 6
Lands
Number of residential free patents issued 2016 2,969 1600 1610 1380 1110 DENR
Number of beneficiaries with secured land tenure in public
agricultural A&D lands 2016 1,532 580 240 350 350 DENR
Number of beneficiaries with secured land tenure in residential
lands zoned as residential areas 2016 2,969 1,600 1,610 1,380 1,110
Land Administration and Management improved through LAMS (quality and titling)
a. Number of Lots/patents issued 2016 2,883 2,226 1,890 1,901 1,506
b. Inspection, verification and approval of surveys through
LAMS 2016 78,722 4,000 4,000 4,000 4,000
Employment from ecotourism and resource-based industries
increased 2016 245 Increasing Increasing Increasing Increasing DENR
Number of biodiversity-friendly enterprise recognized increased. 2016 n.d. Increasing Increasing Increasing Increasing DENR

Note: This RDP 2017-2022 Midterm Update Chapter is still preliminary and subject to further review and RDC approval. This draft is NOT official and no part of this document may be cited or quoted. This is being circulated for public consultation purposes.
19
Jobs generated from reforestation and non-timber/agro forestry
enterprises (NGP,CBFM,) increased 2016 8,194 Increasing Increasing Increasing Increasing
Number of sites/ Protected areas developed as ecotourism
destinations 2016 7 22 22 22 22 DENR
Number of sites in Key Biodiversity Areas that serve as
ecotourism destinations 2016 10 10 10 10 10 DENR
Area of agroforestry system adopted 2016 6,545 2,865 2,865 2,865 7,165 DENR
Increased income generated from foreshore areas (PhP) 2016 6,745,776 5% increase
from 2018
5%
increase
from 2019
5%
increase
from 2020
5% increase from
2021 DENR
Integrated Protected Area Fund(IPAF) increased (PhP) 2016 8,502,042 5% increase
from 2018
5%
increase
from 2019
5%
increase
from 2020
5% increase from
2021 DENR
Subsector Outcome 2: Environmental quality improved
Air Quality
Percentage of urban areas with air quality within ambient air
quality guideline value /standard increased 2016 No data 100% 100% 100% 100% EMB
Number of urban areas with air quality stations (PM 10/2.5,
DOAS) increased 2016 2 4 4 5 5 EMB
Water Quality
Water quality of priority river systems within water quality guideline value/standard (10 parameters: BOD5, NH3-N, CL, Color, DO, pH, PO4, TSS, Fecal Coliform and Temperature)
a) Imus River 2015 Failed Class C Class C Class C Class C Class C EMB
b) Ylang-Ylang River 2015 Failed Class C Class C Class C Class C Class C EMB
c) Rio Grande River 2015 Class C Class C Class C Class C Class C EMB
d) Cañas River 2015 Failed Class C Class C Class C Class C Class C EMB
e) Iyam-Dumacaa River 2015 Class C Class C Class C Class C Class C EMB
f) Calumpang River 2016 Class C Class C Class C Class C Class C EMB
g) Pansipit River 2016 Class C Class C Class C Class C Class C EMB
h) Maragondon River 2018 Class C Class C Class C Class C Class C EMB
i) Labac River 2018 Class C Class C Class C Class C Class C EMB
j) Timalan River 2018 Class C Class C Class C Class C Class C EMB
k) Obispo River 2018 Class C Class C Class C Class C Class C EMB
Water quality of sampling stations in Manila Bay within water quality guideline value/standard (8 parameters: fecal coliform, color, DO, pH, TSS, Temperature, Phosphate, NH3-N)
a) Bacoor beach 2015 Failed Class SB Class SB Class SB Class SB Class SB EMB
b) Lido Beach 2015 Failed Class SB Class SB Class SB Class SB Class SB EMB
c) Villamar I 2015 Failed Class SB Class SB Class SB Class SB Class SB EMB
d) San Isidro 2015 Failed Class SB Class SB Class SB Class SB Class SB EMB
e) Celebrity 2015 Failed Class SB Class SB Class SB Class SB Class SB EMB
f) Garden Coast 2015 Failed Class SB Class SB Class SB Class SB Class SB EMB
g) CoastaEuegenia 2015 Failed Class SB Class SB Class SB Class SB Class SB EMB

Note: This RDP 2017-2022 Midterm Update Chapter is still preliminary and subject to further review and RDC approval. This draft is NOT official and no part of this document may be cited or quoted. This is being circulated for public consultation purposes.
20
h) Villa Criselda 2015 Failed Class SB Class SB Class SB Class SB Class SB EMB
i) Antonio’s Hideaway 2015 Failed Class SB Class SB Class SB Class SB Class SB EMB
j) Daloroy’s beach resort 2015 Failed Class SB Class SB Class SB Class SB Class SB EMB
k) Bucana Malaki 2015 Failed Class SB Class SB Class SB Class SB Class SB EMB
l) Villa Excellance 2015 Failed Class SB Class SB Class SB Class SB Class SB EMB
m) Dalahican (Brgy. 8) 2015 Failed Class SB Class SB Class SB Class SB Class SB EMB
n) Mount Sea Resort 2015 Failed Class SB Class SB Class SB Class SB Class SB EMB
Water quality of recreational water body within water quality guideline value/standard (8 parameters: fecal coliform, color, DO, pH, TSS, Temperature, Phosphate, NH3-N)
a) Laiya 2013 Class SB Class SB Class SB Class SB Class SB EMB
b) Nasugbu 2013 Class SC Class SB Class SB Class SB Class SB EMB
c) Matabungkay 2017 Class SB Class SB Class SB Class SB Class SB EMB
d) Lemery 2013 Class SB Class SB Class SB Class SB Class SB EMB
Percentage of priority water bodies within the water quality
guidelines increased 100% 100% 100% 100% EMB
Number of established and operational water quality
management areas (WQMAs) increased 2015 1 3 3 3 3 EMB
Sustain average BOD level of Laguna Lake within standard of
<7 mg/L 2015 4.67 mg/L <7 mg/L <7 mg/L <7 mg/L <7 mg/L LLDA
Total aquaculture structure area within Laguna Lake’s carrying
capacity 2016 12,476.51 ha <9,200 ha <9,200 ha <9,200 ha <9,200 ha LLDA
Areas of planted seedlings in Laguna lake basin (ha) f 2015 320.03 ha 100 100 100 100 LLDA
Solid Wastes
Number of Closed and rehabilitated open dumpsites (OD) and
controlled dump facilities (CDF) increased to decreasing rate 2016 8 10 8 8 6 EMB
Number of Sanitary Landfills increased including the baseline
data 2016 23 25 25 25 25 EMB
LGUs with approved 10-year SWM plan increased including the
baseline data 2016 51 87 90 95 100 EMB
Percentage compliance of LGUs to RA 9003 (e.g. SWMP, MRF,
& closure of dumpsites) increased 2016 16% 27% 29% 31% 33% EMB
Solid waste diversion rate increased 2016 46% 52% 55% 58% 61% EMB
Subsector Outcome 3: Adaptive capacities and resilience of ecosystems increased
Number of reviewed CC/DRRM enhanced plans increased
CLUP (HLURB)
CDP (DILG)
LDRRMP (OCD)
LCCAP (CCC)
2016
CLUP: 37;
CDP: 68;
LDRRMP: 134;
LCCAP: 92
Increasing Increasing Increasing
100% (including
provinces, if
applicable
HLURB
DILG
OCD
CCC
Percentage of LGUs with institutionalized and fully operational
DRRM Office increased 2016 (No data) Increasing Increasing Increasing 100% OCD
Number of established climate/disaster resilient evacuation
centers 2016 (No data) Increasing Increasing Increasing Increasing OCD
Note: This RDP 2017-2022 Midterm Update Chapter is still preliminary and subject to further review and RDC approval. This draft is NOT official and no part of this document may be cited or quoted. This is being circulated for public consultation purposes.
21
321
322
323
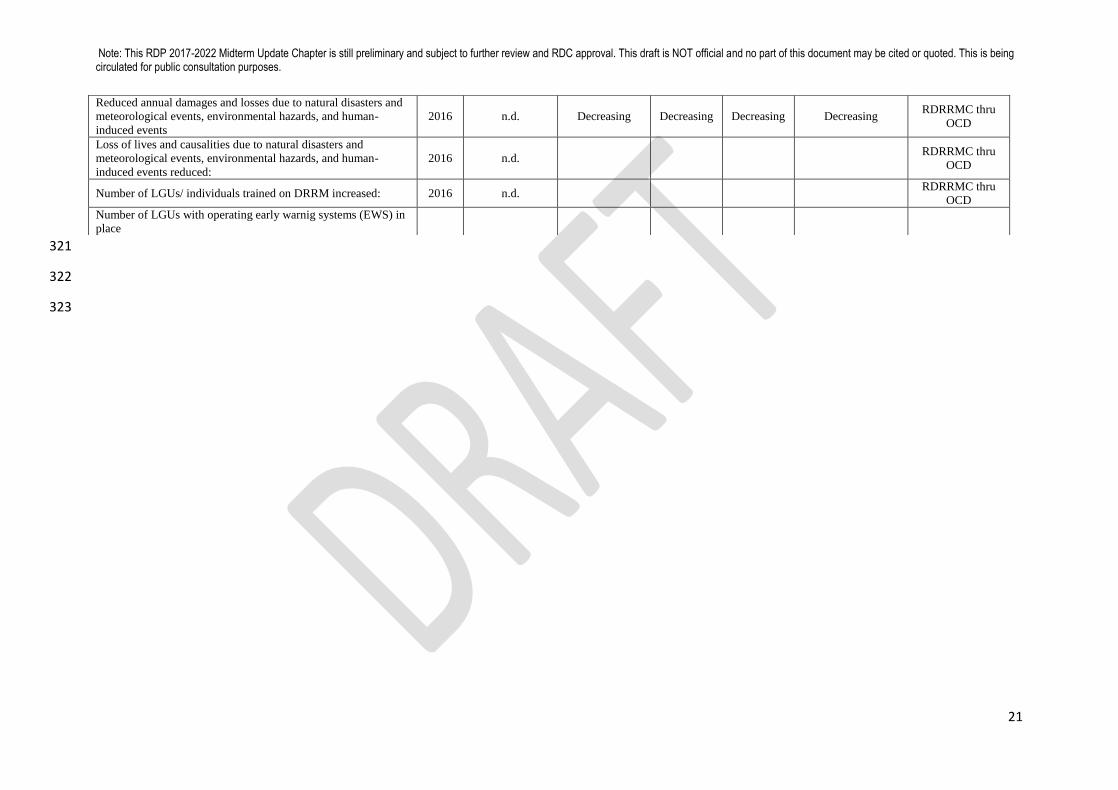
Reduced annual damages and losses due to natural disasters and
meteorological events, environmental hazards, and human-
induced events
2016 n.d. Decreasing Decreasing Decreasing Decreasing RDRRMC thru
OCD
Loss of lives and causalities due to natural disasters and
meteorological events, environmental hazards, and human-
induced events reduced:
2016 n.d. RDRRMC thru
OCD
Number of LGUs/ individuals trained on DRRM increased: 2016 n.d. RDRRMC thru
OCD
Number of LGUs with operating early warnig systems (EWS) in
place
Note: This RDP 2017-2022 Midterm Update Chapter is still preliminary and subject to further review and RDC approval. This draft is NOT official and no part of this document may be cited or quoted. This is being circulated for public consultation purposes.
22
Strategies 324
A. Biodiversity and functioning of ecosystem services sustained 325
1. Intensify protection and sustainable management of forest, watershed, coastal 326
and marine and land through adoption of ridge-to-reef approach 327
Forests and Watershed: 328
Continue the rehabilitation of degraded forestlands, critical watersheds and 329
major river basins through the reforestation efforts under DENR’s Enhanced 330
National Greening Program 331
Strengthen the protection of natural and rehabilitated forest, effective and 332
management areas and key biodiversity areas through shared governance 333
and closer coordination with local governments, indigenous and local 334
communities, CSOs and private sector. For example, CSOs can be engaged 335
in site development, management and monitoring, and partnerships with 336
businesses for area management 337
Adopt the ridge-to-reef approach in the development, review, and 338
implementation of development activities, and environment protection and 339
conservation efforts to take into account the interconnectivity of upland and 340
downstream ecosystems 341
Fast-track the completion of all CLUPs in the region especially for highly 342
urbanized areas and cities and ensure that these are DRR/CCA enhanced 343
and have adequate environmental protection measures, and that zoning 344
ordinance is approved and strictly enforced 345
Complete delineation of final forest limits to identify areas for protection and 346
production 347
348
Coastal and Marine areas: 349
350
Improve management and protection through regular policing and patrolling 351
activities within marine protected areas, activation of marine protected areas 352
network, preparation of marine protected areas management plans, capacity 353
building for local governments on the establishment and expansion of MPAs, 354
and identification of fish sanctuaries 355
Implement integrated coastal and marine resources management (for 356
mangroves, coral reefs, sea grass, etc.) including the conduct of coastal 357
resource mapping and assessment 358
Complete delineation/delimitation and zoning of municipal waters especially 359
among LGUs with overlapping jurisdiction. Mapping and zoning of foreshore 360
areas into production and protection areas will be also be pursued to ensure 361
fisheries sustainability 362
Complete coastal resource mapping and vulnerability assessment based on 363
satellite images and appropriate ground validation activities 364
365
Land: 366
367

Note: This RDP 2017-2022 Midterm Update Chapter is still preliminary and subject to further review and RDC approval. This draft is NOT official and no part of this document may be cited or quoted. This is being circulated for public consultation purposes.
23
Issue appropriate tenure and management instruments in the protection, 368
conservation, rehabilitation and development of forestlands and protected 369
areas. Secured land titles will also be continuously provided to beneficiaries in 370
public agricultural alienable and disposable lands and areas zoned as 371
residential 372
Issue Certificates of Ancestral Domain Title (CADT) to indigenous peoples to 373
support their economic and cultural activities will be facilitated by NCIP 374
Improve land administration and management through the computerization of 375
land titling and related services, updating and sharing of land resources 376
information and capacity building of practitioners down to the LGU level 377
Wetlands: 378
Improve the management of priority caves and wetlands through the strict 379
implementation of regulations, management plans and advocacy of 380 sustainable practices 381 382
Urban biodiversity: 383
384
Promote the establishment of more green spaces in urban areas to improve 385
the air quality, and micro-climate in the area that will also serve as an 386
affordable and accessible socialization area in neighborhoods contributing to 387
better environmental, health and social quality of life for urban residents. 388
Water Resource: 389
Improve management of water resources (i.e. inventory of available 390
groundwater) and promote responsible and sustainable water consuption 391
392
2. Expand the development of ecotourism sites and resource-based enterprises 393
or industries to provide employment, alternative source of livelihood and 394
increased income for local communities 395
396
Promote and develop ecotourism sites in the region particularly upland, 397
coastal, wetlands and caves destinations that will provide alternative sources 398
of income and allow private and public investments to come to rural and 399
coastal communities. Both the government and the private sector can provide 400
assistance in eco-tourism site development, which includes the establishment 401
and maintenance of ecotourism facilities 402
Conduct the following supporting activities: a) identification of tourism 403
destinations and products and promoting them to domestic and international 404
markets; b) diversification of existing destinations and creation of new tourism 405
areas, products, and services using community-based ecotourism approaches; 406
and c) formulation and implementation of cluster tourism master plans in 407
identified tourism development areas to maximize tourism assets and 408
economic benefits 409
Note: This RDP 2017-2022 Midterm Update Chapter is still preliminary and subject to further review and RDC approval. This draft is NOT official and no part of this document may be cited or quoted. This is being circulated for public consultation purposes.
24
Promote sustainable forest-based industries. The development of commercial 410
forest plantations within applicable areas will be guided by the region’s 411
comparative advantage in terms of timber production 412
Adopt agroforestry system by providing assistance to upland farmers, 413
particularly tenure holders, in developing agroforestry farms, which include 414
installation of soil and water conservation measures and the establishment of 415
partnerships with private investors to increase the competitiveness of goods 416
and services in the market 417
Promote sustainable marine-based industries to achieve a blue economy. 418
These industries include: a) sustainable fisheries and aquaculture; b) ocean 419
energy, offshore and gas exploration; c) shipping/marine transportation and 420
shipbuilding; and d) eco-tourism, among others 421
Adopt biodiversity-friendly enterprises and practices in agriculture through 422
capacity building and better access to available technologies 423
Improve the system of collection of appropriate fees and fines in areas 424
covered by tenure (e.g. foreshore lease areas, SAPA, etc.) to increase 425
revenue collected from the use of these resources which can be utilized by 426
the government to sustain management activities of natural resources 427
428
3. Conserve and promote biodiversity through: a) protection of threatened and 429
endemic species; b) prevention, control, and eradication of invasive alien 430 species; c) conduct of scientific studies and regular monitoring of biodiversity 431 population and habitats; and d) conduct of environmental 432
protection/conservation awareness orientations in schools, local communities 433 and among tourists 434
435
4. Encourage the participation of civil society, private sector, indigenous and 436
local communities in the management of natural resources 437
438
5. Cascade implementation of the PBSAP into RBSAP and fast track 439
mainstreaming at the PA level 440
B. Environmental quality improved 441
1. Strengthen the enforcement of environmental laws and ensure conformity with 442
environmental standards 443
Air quality management: 444
Establish and maintain the required number of air quality monitoring stations 445
especially in major urban centers in the region 446
Regularly monitor industries particularly those with high potential for air 447 pollution, ensure that they conform to air quality standards, and enforce 448 necessary sanctions for violators 449
Strengthen the enforcement of anti-smoke belching campaign and vehicle 450 emission testing through increasing the number of personnel and the quality 451 and quantity of necessary equipment/ facilities. The establishment of more 452

Note: This RDP 2017-2022 Midterm Update Chapter is still preliminary and subject to further review and RDC approval. This draft is NOT official and no part of this document may be cited or quoted. This is being circulated for public consultation purposes.
25
government-owned motor vehicle inspection centers and the regular 453
monitoring of private emission testing centers will also be pursued 454
Promote EST (Environmentally Sustainable Transport) including efficient 455 mass transport system and clean fuels 456
Provide support for research and development of clean technologies and 457 strengthen the adoption of green technologies and increased investments of 458 the private sector 459 460
Water quality management: 461
Establish and maintain the required number of water quality monitoring 462
stations in major water bodies in the region 463
Regularly monitor industries and water and sewage treatment plants, ensure 464
that they conform to water quality standards and enforce necessary sanctions 465
for violators 466
Strengthen pollution control from domestic and agriculture sources that are 467
mostly unregulated and have become the major sources of water pollution 468
Establish and operationalize more WQMAs in the region to implement high-469
impact projects such as waste treatment, disposal, resettlement and 470
infrastructure projects to improve water quality. Capacity building of WQMA 471
members and resource mobilization will also be pursued to ensure 472
sustainability of planned activities 473
Revitalize and form river armies in local governments and conduct regular 474
locally-initiated river and coastal clean-ups 475
Regularly monitor water quality of major rivers per province and establish 476
local government- run laboratories on water quality testing 477
Strictly enforce easement of structures in lakes, rivers and coastal areas 478
Survey informal settlers especially those along water bodies, identify 479
relocation sites, and relocate them in low cost housing with proper septage 480
facilities 481
Study and enforce the maximum carrying capacity of fish cages and fish 482
stocks in major lakes (e.g. Laguna lake, Taal lake) in the region; 483
Regularly monitor the ground water extraction and quality to ensure adequate 484
water supply and water quality/potability 485
Solid, toxic and hazardous wastes management: 486
Close and rehabilitate remaining dumpsites and promote alternative waste 487 disposal and waste to energy facilities/ systems/technologies that can be 488
operated in partnership with the private enterprises 489
Operationalize MRFs, treatment facilities, and submission of approved local 490
solid waste management plans 491
Strengthen the implementation of IEC activities that focus on proper waste 492 management, waste reduction and recycling for communities and households. 493
For LGUs, re-orientation of local chief executives and relevant departments 494 on environmental laws and incentives for hosting sanitary landfills will also be 495
regularly conducted 496

Note: This RDP 2017-2022 Midterm Update Chapter is still preliminary and subject to further review and RDC approval. This draft is NOT official and no part of this document may be cited or quoted. This is being circulated for public consultation purposes.
26
Provide technical assistance and capacitate LGUs on: a) the formulating solid 497
waste management plans; b) identifying, establishing, operating and 498 maintaining solid waste technologies and facilities; and c) identifying possible 499 revenue generating schemes to sustain solid waste management facilities. 500 Financial assistance can also be provided by the government through existing 501 programs and projects 502
Increase LGU compliance to R.A. 9003 and LGU investment in waste 503
management system and facilities in combination with public and private 504
funding 505
Promote clustering of sanitary landfill and solid waste management 506
technologies to address its large capital requirement and allow low income 507
LGUs to pool resources to establish such facilities 508
Designate permanent municipal and city environment and natural resource 509
officers in all local governments and provide necessary manpower and 510
funding 511
512
2. Promote Sustainable Consumption and Production 513
514
Develop, promote, and transfer cleaner production technologies, including 515
water and energy- efficient practices (e.g. rainwater catchment facility, cleaner 516
fuels and engine, energy-efficient facilities/green buildings) 517
Promote green procurement in both private and public sectors 518
Promote EST, including mass transport system and clean fuels 519
Promote and provide incentives for the use of renewable energy sources 520
521
C. Adaptive capacities and resilience of ecosystems increased 522
523
1. Strengthen the local implementation of all aspects (i.e. prevention and 524
mitigation preparation, response, rehabilitation and recovery) of disaster risk 525
reduction and management: 526
527
Ensure the availability and access to location-specific hazards and risks, in 528 particular access to large scale (1:10,000) probabilistic hazard maps, through 529 the promotion and use of hazard mapping services of agencies and 530 universities. DOST’s plan to establish a Center for Hazard and Resource 531 Mapping in the region will ensure a centralized and better access to hazard 532 and other resource/thematic maps 533
Develop a regional disaster database to include damages and losses and 534 disaggregated information on gender, and the vulnerable and affected 535 sectors. Supporting activities include: a) collection of baseline data on disaster 536
events in the past five years; b) formulation of a report template and reporting 537
protocol; c) training for agencies and local DRRM officers; and d) linkage to 538 other related databases 539
Continue to mainstream DRR and CCA in regional, sub-national, and local 540 development plans and policies through the use of relevant planning 541 guidelines such as HLURB’s Supplemental Guidelines to generate updated 542

Note: This RDP 2017-2022 Midterm Update Chapter is still preliminary and subject to further review and RDC approval. This draft is NOT official and no part of this document may be cited or quoted. This is being circulated for public consultation purposes.
27
climate change projection, and risk and vulnerability assessment in order to 543
identify appropriate and adequate mitigation and adaptation measures 544
Adopt standards to ensure climate and disaster-resilient natural and human 545 systems, including, but not limited to, communities and critical infrastructure. 546 Retrofitting and construction of climate smart and disaster-resilient 547 infrastructures and facilities will be pursued, especially in hazard- prone areas 548
and environmentally- critical areas 549
Conduct and adopt area or firm level business continuity plans (BCP) not only 550
for large companies but also for small and medium enterprises in order to 551
reduce economic impacts and facilitate the fast recovery of industrial functions 552
and economic activities in the region in times of natural disasters and 553
emergency situations 554
Promote disaster resilient and climate smart businesses and livelihoods to 555
minimize loss of lives and assets 556
Promote available DRRM and CC financing mechanisms such as the 557
People’s Survival Fund to improve access and increase utilization. Technical 558
assistance will be provided by regional and, if needed, national agencies so 559
that LGUs can comply with the requirements and successfully apply to such 560
facilities 561
562
Priority will be given to activities that will further strengthen the institutional, 563
community and individual capacity to improve the timely and adequate response to 564
disasters, as well as to increase resilience: 565
Increase the competency of decision-makers and relevant stakeholders or the 566
public to understand the risk and vulnerability analysis/assessment through 567
capability building on: a) reading/analyzing and integrating thematic or hazard 568
maps for local plans; b) GIS trainings; and c) risk and vulnerability 569
analysis/assessments 570
Continue to strengthen the capacity of concerned agencies to conduct post or 571
rapid disaster needs assessment by building a pool of technical experts and 572
conduct of orientation or trainings on basic concepts and methodologies on 573
damage and loss assessment for LGUs to facilitate timely submission and 574
completion of reports and when necessary, rehabilitation and recovery plans 575
Include the conduct of regular infrastructure audit in the budget of agencies 576
and local governments, and monitor the submission of reports to RDRRMC 577
Review and update land use and post-disaster resettlement plans to ensure 578
that resettlement areas, future residential and built- up areas are not in hazard 579
prone, environmentally-critical and conservation areas 580
Continue to conduct training on DRRM and ICS (Incident Command System) 581
for local governments down to barangay level 582
Continue to conduct IEC for households on the existing hazards in their areas 583
and on the preparation and response in times of disasters and emergencies, 584
and to mainstream DRRM and CC in school curricula at all levels 585
586 587
588

Note: This RDP 2017-2022 Midterm Update Chapter is still preliminary and subject to further review and RDC approval. This draft is NOT official and no part of this document may be cited or quoted. This is being circulated for public consultation purposes.
28
589
590
Major Programs and Projects 591
592
Enhanced National Greening Program 593
Social Forestry Project 594
Forest landscape rehabilitation and restoration 595
Delineation of final forest limits including production and protection forests 596
Complete delineation of municipal waters 597
Development and promotion of ecotourism sites 598
Deployment of new technologies on water quality monitoring, e.g. SENRTY by 599
DOST 600
Establishment of wastewater treatment facilities in cities and municipalities 601
by water concessionaires and water districts 602
Establishment of shared solid waste disposal facilities among LGUs 603
Development and adoption of green infrastructure and technologies such as 604
rainwater harvesting or catching technologies 605
Retrofitting of buildings, establishments and infrastructure according to 606
climate and disaster resilient building standards 607
Regional database on disaster damages and losses 608
609
Priority Researches 610
Study on garbage hauling fees and on alternative, and affordable solid waste 611
disposal systems according to the income capacities of local governments 612
Study on the environmental impacts of dumpsites 613
Mapping on ecological assessment for local governments 614
Identifying pollutants in priority river systems 615
Baseline studies on biodiversity population 616
Study on the legal measures to address long term TROs and writ of 617
preliminary injunctions especially for demolishment of illegal and non- 618
compliant industries 619
620
Legislative Agenda 621
Enactment of Sustainable Forest Management Bill 622
Enactment of National Land Use Act 623
Enactment of local comprehensive environmental codes to cover land, water 624
and air pollution control 625
Establishment of clear coordination mechanism between National Water 626
Resource Board, water concessionaires and local governments on ground 627
water monitoring and extraction permit 628
Note: This RDP 2017-2022 Midterm Update Chapter is still preliminary and subject to further review and RDC approval. This draft is NOT official and no part of this document may be cited or quoted. This is being circulated for public consultation purposes.
29
629