chapter 2: population and health key issue #1: where is...
TRANSCRIPT
Chapter 2: Population and Health Key Issue #1: Where is the World’s Population Distributed? Rubenstein, pages 44‐49 As you read complete your vocabulary list.
INTRODUCTION
1. Complete: At a local _________________, geographers find that overpopulation is a threat in some
_______________ of the world but not in others because some ______________ have a favorable balance
between people and ___________________________________________ whereas others do not. Further the
regions with the most people are not necessarily the regions with the unfavorable balance.
2. How do geographers display the concentration of population?
POPULATION CONCENTRATIONS
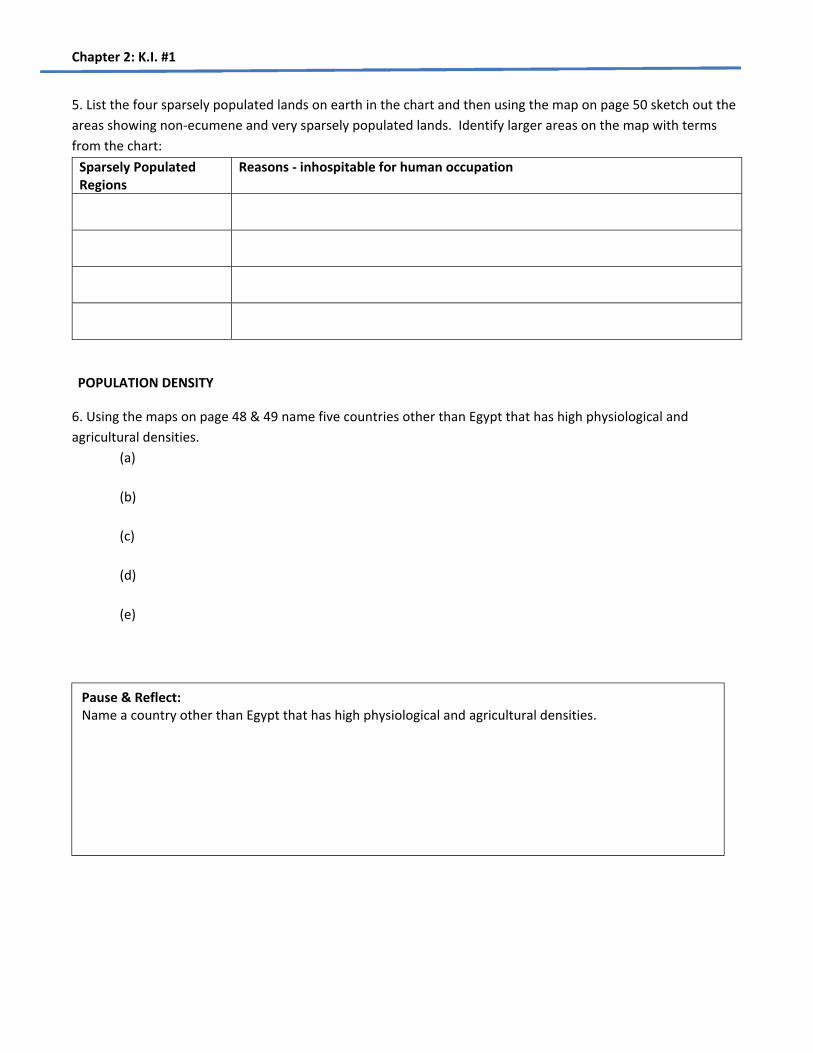
3. There are four major population concentrations, as well as two smaller concentrations, identified in the text.
Shade and label these highly and emerging clusters on the map provided.

Chapter 2: K.I. #1
4. Complete the chart below, listing significant characteristics, facts, features, and countries involved in each
population concentration. Circle the two secondary concentrations.
EAST ASIA
SOUTH ASIA
SOUTHEAST ASIA
EUROPE
OTHER CLUSTERS
Pause & Reflect: Why isn’t North America one of the four major population clusters?
Chapter 2: K.I. #1
5. List the four sparsely populated lands on earth in the chart and then using the map on page 50 sketch out the
areas showing non‐ecumene and very sparsely populated lands. Identify larger areas on the map with terms
from the chart:
Sparsely Populated Regions
Reasons ‐ inhospitable for human occupation
POPULATION DENSITY
6. Using the maps on page 48 & 49 name five countries other than Egypt that has high physiological and
agricultural densities.
(a)
(b)
(c)
(d)
(e)
Pause & Reflect: Name a country other than Egypt that has high physiological and agricultural densities.
Chapter 2: Population Key Issue #2: Why is Global Population Increasing? Rubenstein, pages 50‐55 As you read complete your vocabulary list.
COMPONENTS of POPULATION GROWTH
1. What is the current NIR?
2. What year did global NIR peak, and what was it?
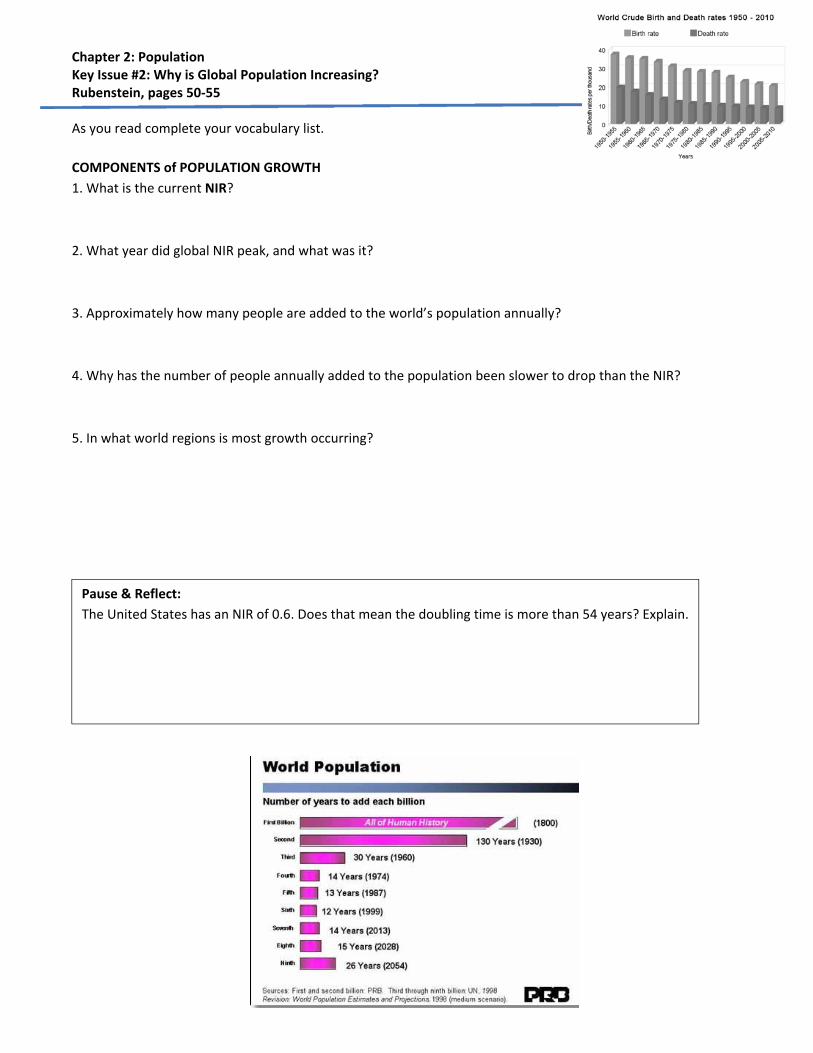
3. Approximately how many people are added to the world’s population annually?
4. Why has the number of people annually added to the population been slower to drop than the NIR?
5. In what world regions is most growth occurring?
Pause & Reflect:
The United States has an NIR of 0.6. Does that mean the doubling time is more than 54 years? Explain.

Chapter 2: K.I. #2
6. What is the global average TFR?
7. What are the rates and locations of the global “highs and lows” in TFR?
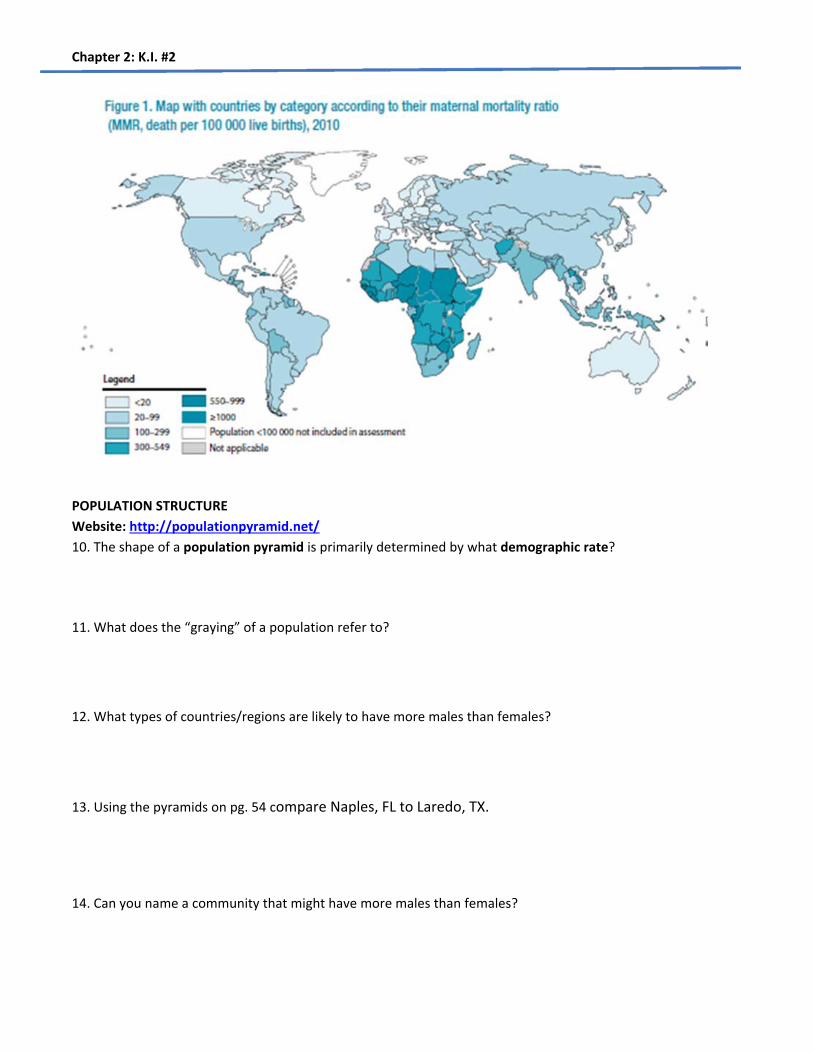
9. How are these mortality rates distributed globally, in terms of developed and developing nations?
Pause & Reflect: How does the TFR in your family compare to the overall figure in North America?
Chapter 2: K.I. #2
POPULATION STRUCTURE
Website: http://populationpyramid.net/
10. The shape of a population pyramid is primarily determined by what demographic rate?
11. What does the “graying” of a population refer to?
12. What types of countries/regions are likely to have more males than females?
13. Using the pyramids on pg. 54 compare Naples, FL to Laredo, TX.
14. Can you name a community that might have more males than females?

Chapter 2: K.I. #2 Be prepared to discuss these questions from article and video
Article:
http://www.familycare.org/special‐interest/if‐the‐world‐were‐a‐village‐of‐100‐people/
Video of the Miniature Earth Project:
https://www.youtube.com/watch?v=i4639vev1Rw
1. After reading the article and watching the video, explain how the current trends in population change will change by the year 2020? 2050?
2. How might this impact you and America (especially in terms of politics)?
Chapter 2: Population Key Issue #3: Why Does Population Growth Vary among Regions? Rubenstein, pages 56‐63 As you read complete your vocabulary list.
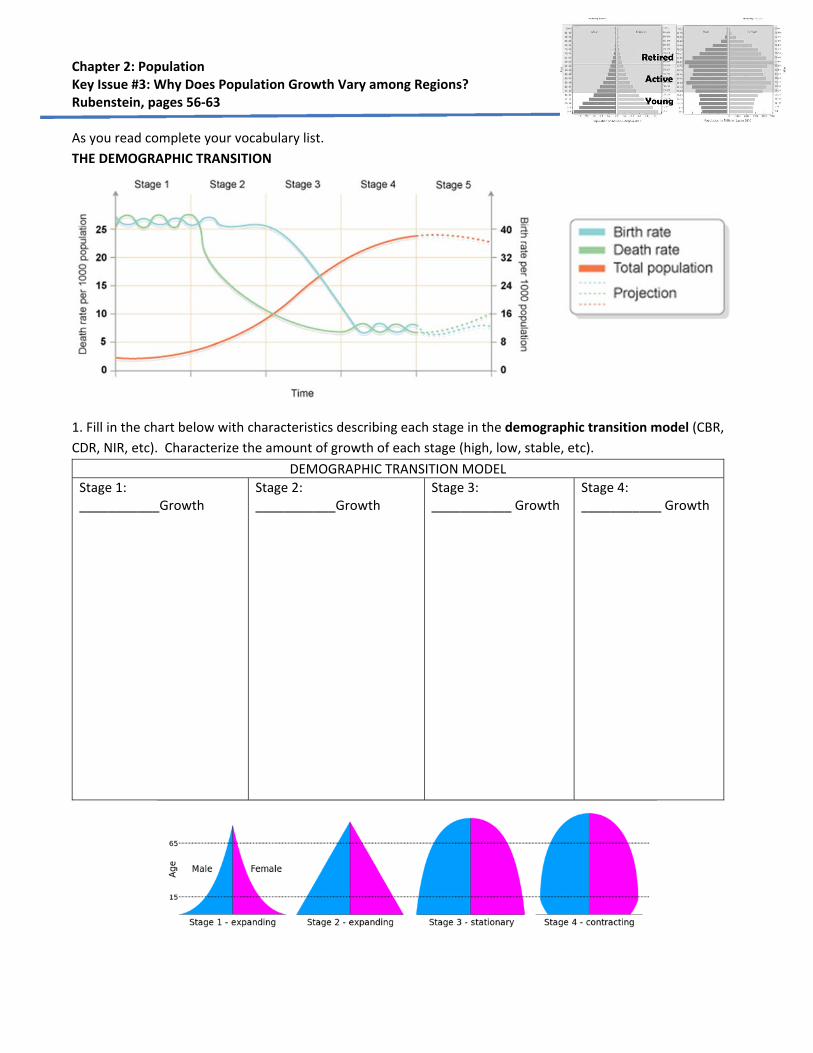
THE DEMOGRAPHIC TRANSITION
1. Fill in the chart below with characteristics describing each stage in the demographic transition model (CBR,
CDR, NIR, etc). Characterize the amount of growth of each stage (high, low, stable, etc).
DEMOGRAPHIC TRANSITION MODEL
Stage 1: ___________Growth
Stage 2: ___________Growth
Stage 3: ___________ Growth
Stage 4: ___________ Growth

Chapter 2: K.I. #3
2. Complete the chart, which represents the four stages of demographic transition, identify some characteristic
countries which are in that stage and briefly explain how they arrived, as described in the text.
STAGES OF DEMOGRAPHIC TRANSITION: EXAMPLES COUNTRIES
STAGE 1 STAGE 2 STAGE 3 STAGE 4
DEMOGRAPHIC TRANSITION and WORLD POPULATION GROWTH
3. How many countries are in each of the following stages of the demographic transition?
(a) Stage 1
(b) Stage 2 & 3
(c) Stage 4
4. Identify the two big breaks in the demographic transition and their causes:
(a) first break
(b) second break
5. The first break appears to have come to different world regions for different reasons and in different ways.
Explain.
(a) Europe and North America
(b) Africa, Asia, and Latin America
Chapter 2: K.I. #3
Declining Birth Rates
6. Describe two ways of reducing the natural increase rate (NIR)
(a)
(b)
7. What two strategies have proven successful to lower birth rates?
(a)
(b)
8. From your reading, list important facts regarding the distribution of contraceptives (be country specific):
9. Why is birth‐control not more successful?
Pause & Reflect:
Why have countries in Northern Europe had little if any decline in CBR since 1990?

Chapter 2: K.I. #3
MALTHUS on OVERPOPULATION
10. Complete the chart by describing the theories and views of various population theorists
Thomas Malthus 1766‐1834 Neo‐Malthusians (2) Malthus Critics (2)
11. In what way was Malthus mistaken?
CASE STUDY: JAPAN’S DECLINING POPULATION 12(a) What are Japan’s current problem?
(b) Why did Japan resist immigration?
(c) What is the future outlook for Japan?
(d) How is it addressing the problem? Will it have side‐effects?
Chapter 2: K.I. #3
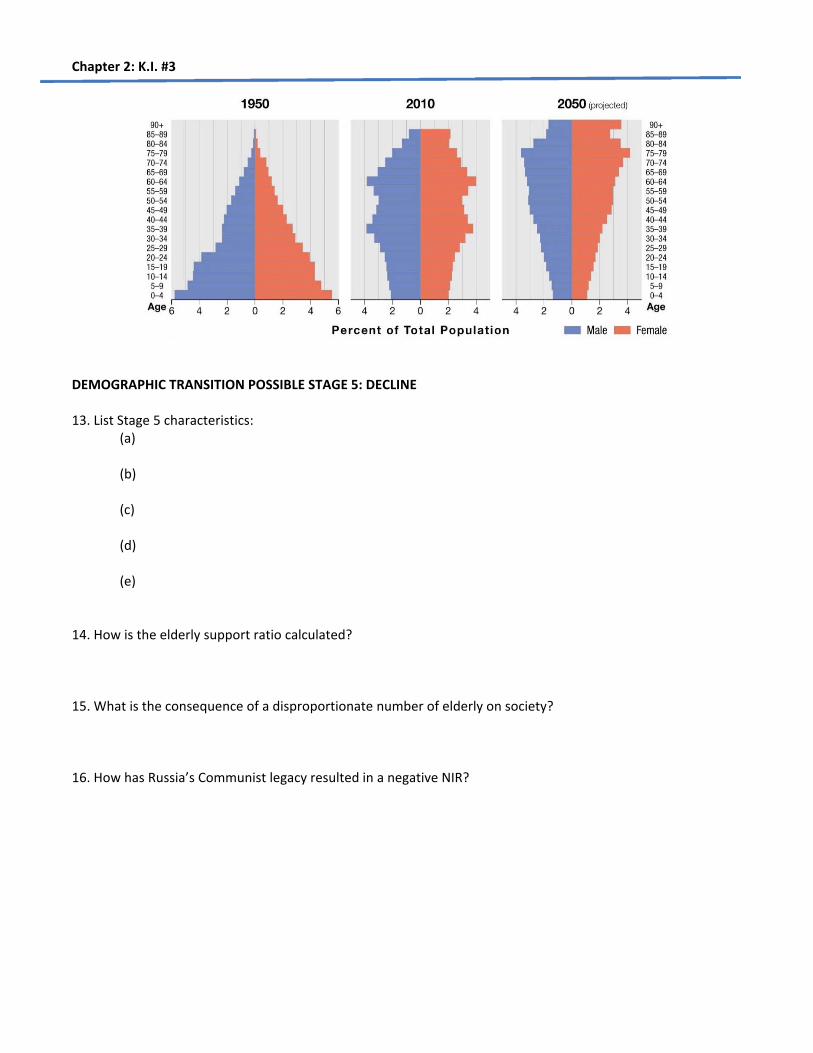
DEMOGRAPHIC TRANSITION POSSIBLE STAGE 5: DECLINE 13. List Stage 5 characteristics: (a)
(b)
(c)
(d)
(e)
14. How is the elderly support ratio calculated?
15. What is the consequence of a disproportionate number of elderly on society?
16. How has Russia’s Communist legacy resulted in a negative NIR?
Chapter 2: K.I. #3
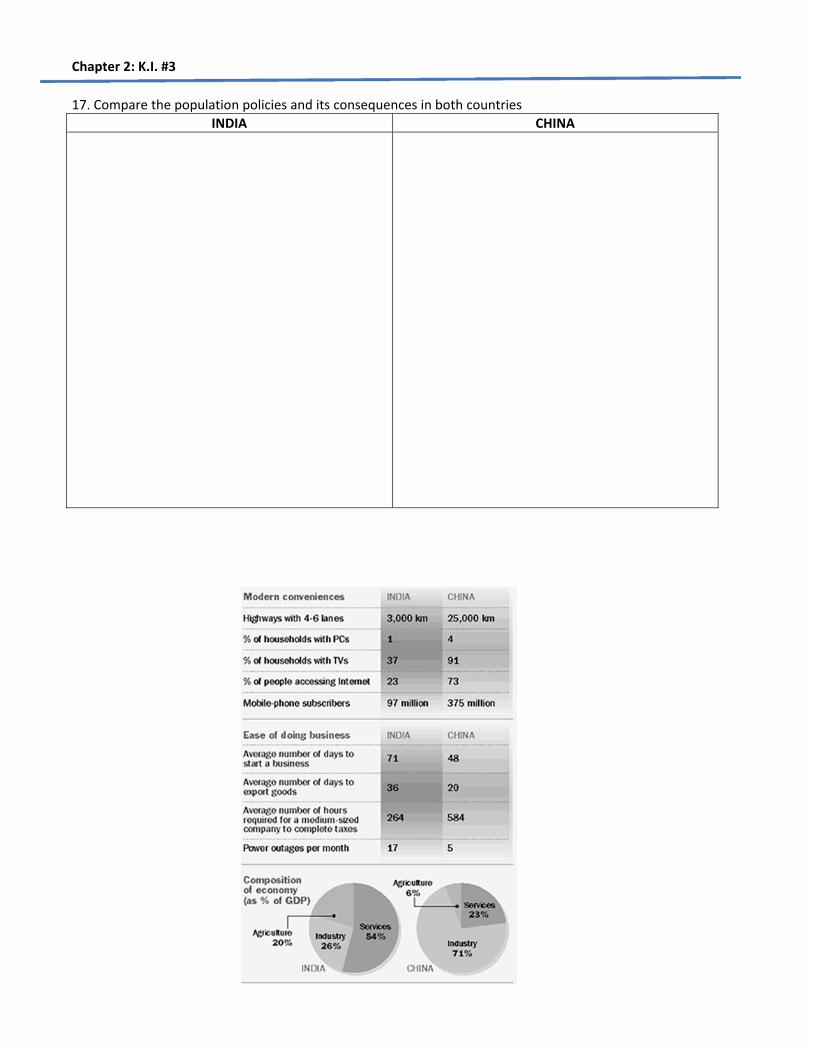
17. Compare the population policies and its consequences in both countries
INDIA CHINA
Chapter 2: Population and Health Key Issue # 4: Why Do Some Regions Face Health Threats? Rubenstein, pages 64‐73 As you read complete your vocabulary list.
WORLD HEALTH THREATS
1. Make notes in the chart below on the stages of epidemiologic transition
EPIDEMIOLOGIC TRANSITION
STAGE 1 STAGE 2 STAGE 3 STAGE 4
2(a) What is cholera? (b)How is it transmitted? (c) In what climate zone are most of the countries that have experienced cholera recently? (d) How did Dr. John Snow use spatial reasoning to detect the cause of this disease?
Chapter 2: K.I. #4
INFECTIOUS DISEASES
3. What are the reasons for a possible Stage 5 in the epidemiologic transition?
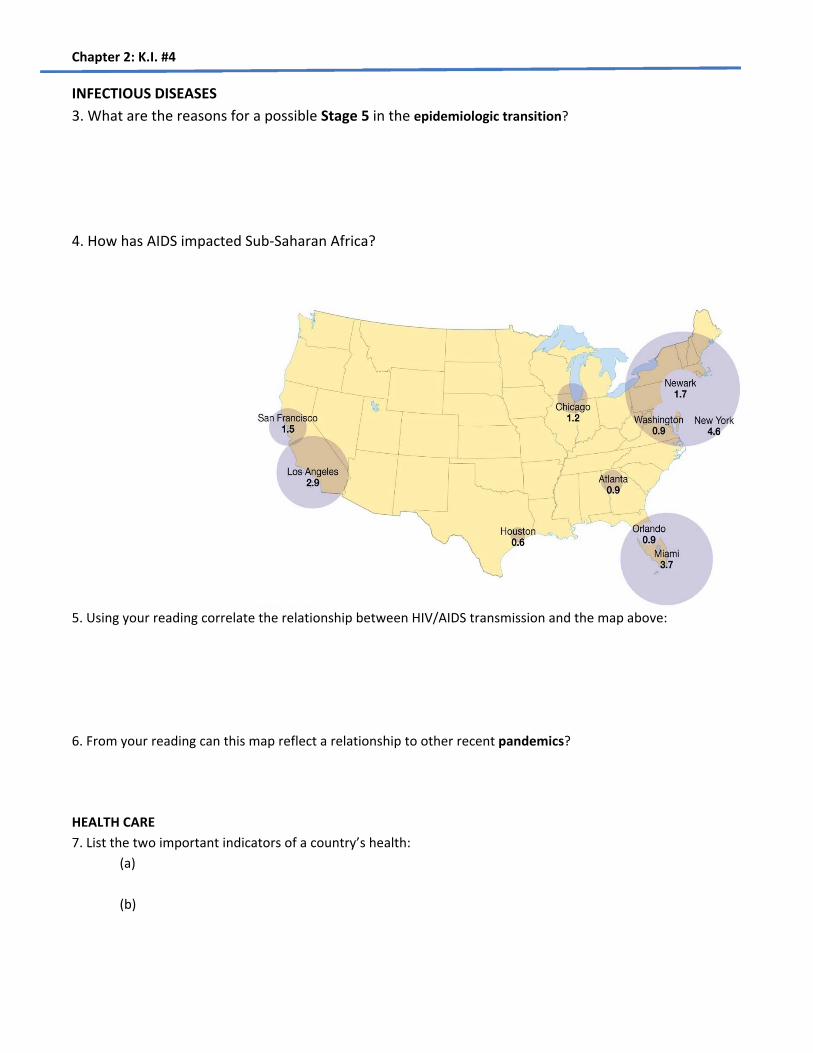
4. How has AIDS impacted Sub‐Saharan Africa?
5. Using your reading correlate the relationship between HIV/AIDS transmission and the map above:
6. From your reading can this map reflect a relationship to other recent pandemics?
HEALTH CARE
7. List the two important indicators of a country’s health:
(a)
(b)
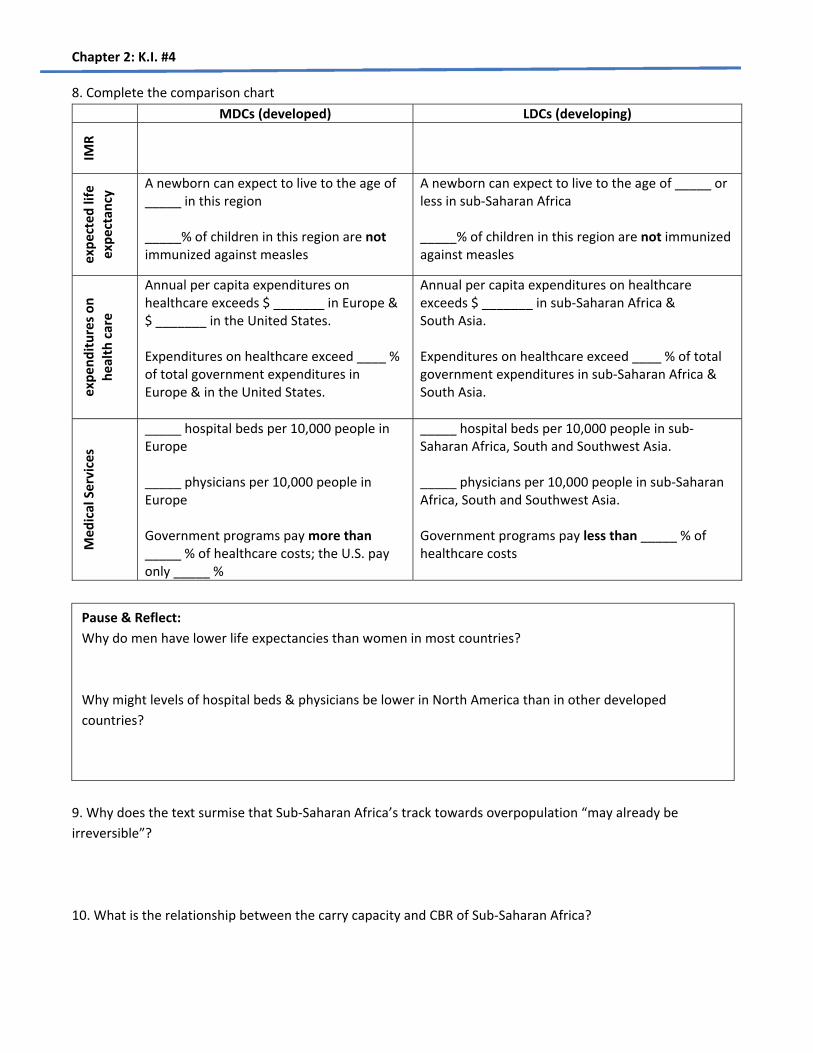
Chapter 2: K.I. #4 8. Complete the comparison chart
MDCs (developed) LDCs (developing)
IMR
expected life
expectan
cy A newborn can expect to live to the age of
_____ in this region _____% of children in this region are not immunized against measles
A newborn can expect to live to the age of _____ or less in sub‐Saharan Africa _____% of children in this region are not immunized against measles
expenditures on
health care
Annual per capita expenditures on healthcare exceeds $ _______ in Europe & $ _______ in the United States. Expenditures on healthcare exceed ____ % of total government expenditures in Europe & in the United States.
Annual per capita expenditures on healthcare exceeds $ _______ in sub‐Saharan Africa & South Asia. Expenditures on healthcare exceed ____ % of total government expenditures in sub‐Saharan Africa & South Asia.
Medical Services
_____ hospital beds per 10,000 people in Europe _____ physicians per 10,000 people in Europe Government programs pay more than _____ % of healthcare costs; the U.S. pay only _____ %
_____ hospital beds per 10,000 people in sub‐Saharan Africa, South and Southwest Asia. _____ physicians per 10,000 people in sub‐Saharan Africa, South and Southwest Asia. Government programs pay less than _____ % of healthcare costs
9. Why does the text surmise that Sub‐Saharan Africa’s track towards overpopulation “may already be
irreversible”?
10. What is the relationship between the carry capacity and CBR of Sub‐Saharan Africa?
Pause & Reflect:
Why do men have lower life expectancies than women in most countries?
Why might levels of hospital beds & physicians be lower in North America than in other developed
countries?