chapter: 2 physical properties of soils · chapter: 2 physical properties of soils contents:...
TRANSCRIPT
CHAPTER: 2
PHYSICAL PROPERTIES OF SOILS
CONTENTS: Definition of soils, origin of soils, soil particle shapes, three phase
diagram, relationship between void ratio and porosity, relation between void ratio and
water content, expression for total unit weight in terms of s, e, w & g, expression for
dry unit weight, submerged unit weight, particle size & gradation, particle size analysis,
particle size distribution curve, grading of soils & uses of particle size distribution
curve.
2.1 DEFINITION OF SOILS
Soil can be defined as an assemblage of nonmetallic solid particles (mineral grains), and
it consists of three phases: solid, liquid (water), and gas (air). Commonly used terms
such as gravel, sand, silt and clay are the names of soils based on their particle grain
sizes. Quartz, mica, feldspar etc. are based on their crystal names.
2.2 ORIGIN OF SOILS
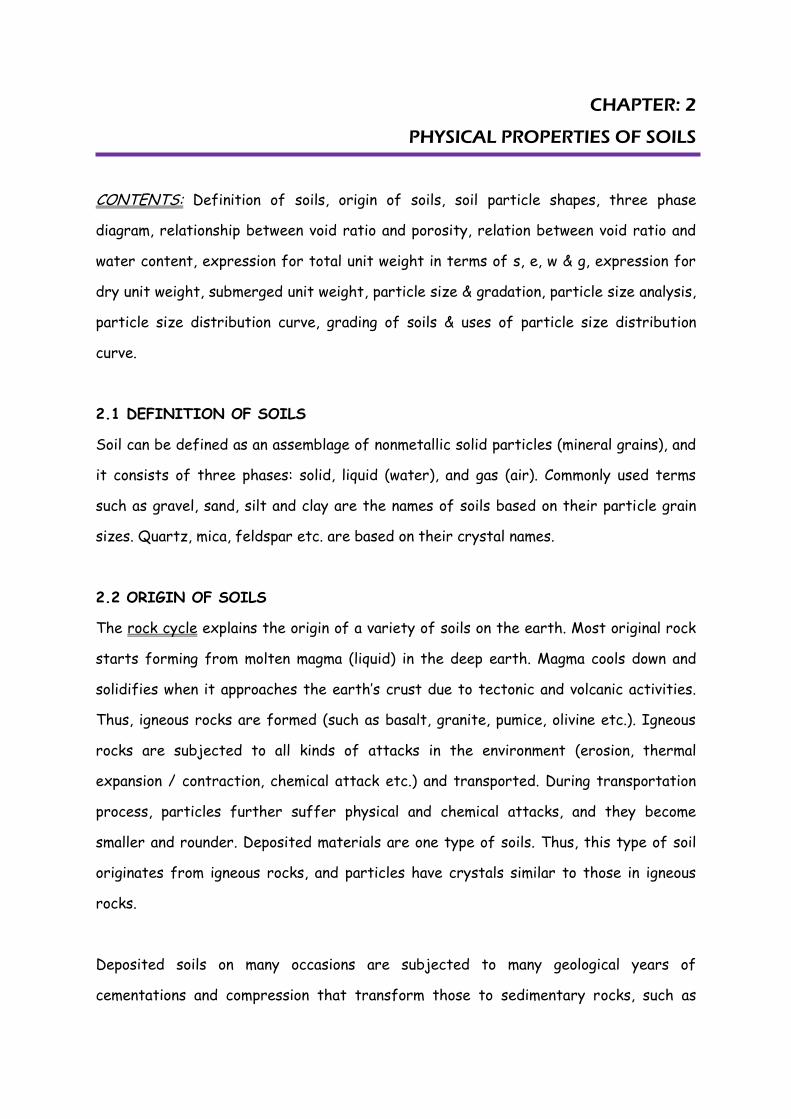
The rock cycle explains the origin of a variety of soils on the earth. Most original rock
starts forming from molten magma (liquid) in the deep earth. Magma cools down and
solidifies when it approaches the earth’s crust due to tectonic and volcanic activities.
Thus, igneous rocks are formed (such as basalt, granite, pumice, olivine etc.). Igneous
rocks are subjected to all kinds of attacks in the environment (erosion, thermal
expansion / contraction, chemical attack etc.) and transported. During transportation
process, particles further suffer physical and chemical attacks, and they become
smaller and rounder. Deposited materials are one type of soils. Thus, this type of soil
originates from igneous rocks, and particles have crystals similar to those in igneous
rocks.
Deposited soils on many occasions are subjected to many geological years of
cementations and compression that transform those to sedimentary rocks, such as
Physical Properties of Soils
Page | 7
sandstone, shale, limestone, dolomite, and many others. Rock might go through further
transformation due to high heat pressure in a deeper earth but without melting. This
process is called metamorphism, and metamorphic rocks are formed. Sedimentary and
metamorphic rocks are also subjected to weathering, transportation and deposition
processes to form sediments. Those rocks can also become the origin of soil particles in
addition to the ones from igneous rocks. Complete rock cycle is outlined in Figure 2.1.
Figure 2.1: Rock Cycle
2.3 SOIL PARTICLE SHAPES
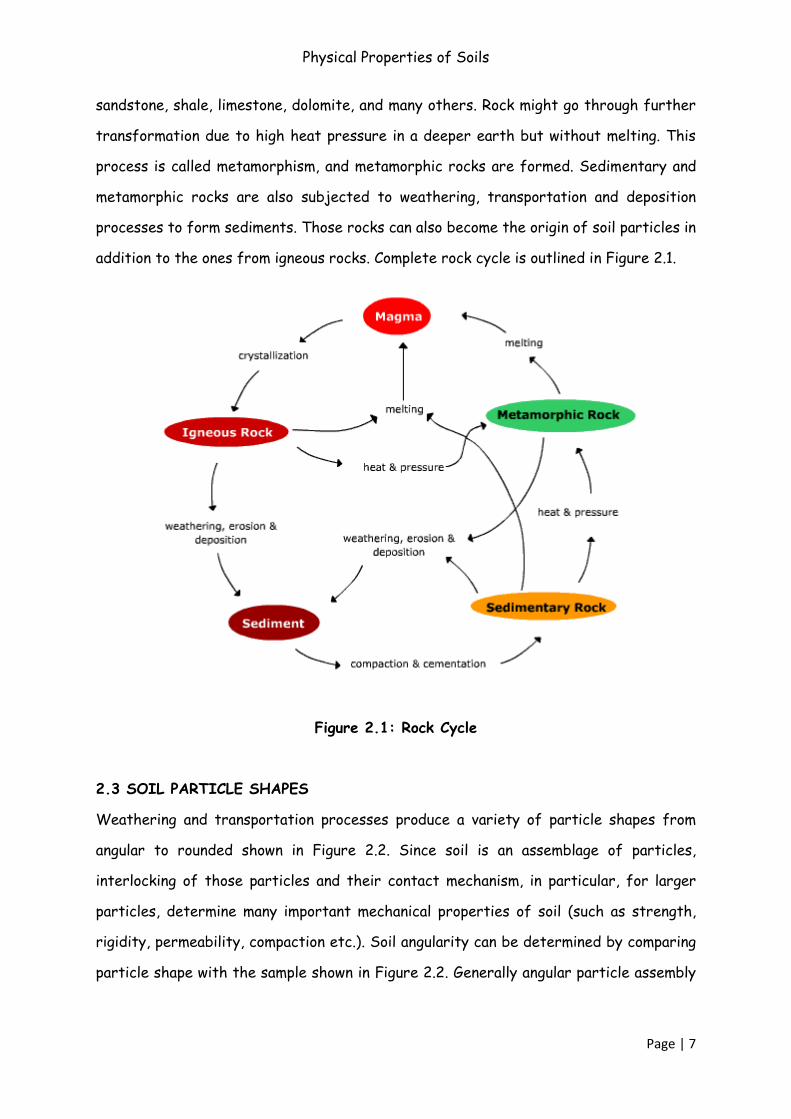
Weathering and transportation processes produce a variety of particle shapes from
angular to rounded shown in Figure 2.2. Since soil is an assemblage of particles,
interlocking of those particles and their contact mechanism, in particular, for larger
particles, determine many important mechanical properties of soil (such as strength,
rigidity, permeability, compaction etc.). Soil angularity can be determined by comparing
particle shape with the sample shown in Figure 2.2. Generally angular particle assembly
Physical Properties of Soils
Page | 8
will give more resistance to sliding deformation as compared with round particle
assembly.
Figure 2.2: Soil Particle Shape
For smaller particles, particle shapes are much flatter and sometime flaky. Short –
range inter particle forces play an important role to determine the behavior of soils.
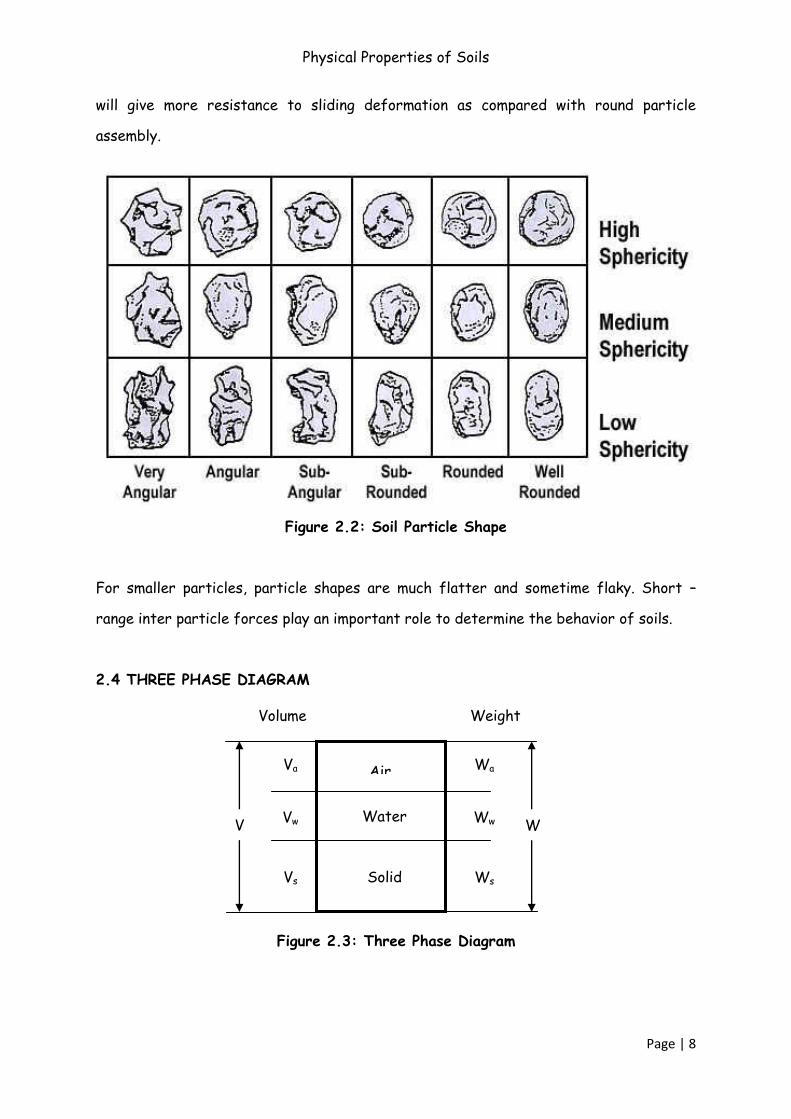
2.4 THREE PHASE DIAGRAM
Figure 2.3: Three Phase Diagram
Air
Water
Solid Vs
Vw
Va
V
Ws
Ww
Wa
W
Volume Weight

Physical Properties of Soils
Page | 9
Soil is an assemblage of particles and thus, there are separate volumes of solid and
void. Voids are occupied with water and air. In reality, it is almost impossible to
distinguish the soil elements i.e. solid, water and air from their natural contact.
However, to analyze the soil mechanics problem, soil assemblage modeled into a three
phase diagram identifying the three phases (solid, water & air) individually. Three phase
diagram of soils are illustrated in Figure 2.3. Individual components of volume and
weight of solid , water & air are symbolized by Vs , Ws , Vw , Ww , Va , Wa respectively.
The total volume and the total weight are also designated as V and W, respectively. The
volume of void is the sum of volume of air and volume of water. Note that weight of air
is assumed as zero since it is negligible to other weights of elements.
Porosity: Porosity is defined as ratio of volume of void to total volume and is generally
expressed as percentage. Porosity is also known as percentage voids.
𝒏 =𝒗𝒐𝒍𝒖𝒎𝒆 𝒐𝒇 𝒗𝒐𝒊𝒅
𝒕𝒐𝒕𝒂𝒍 𝒗𝒐𝒍𝒖𝒎𝒆=
𝑽𝒗
𝑽=
𝑽𝒂 + 𝑽𝒘
𝑽
Void ratio: Void ratio is defined as volume of void to volume of soil and is generally
expressed as percentage.
𝒆 =𝒗𝒐𝒍𝒖𝒎𝒆 𝒐𝒇 𝒗𝒐𝒊𝒅
𝒗𝒐𝒍𝒖𝒎𝒆 𝒐𝒇 𝒔𝒐𝒍𝒊𝒅=
𝑽𝒗
𝑽𝒔
Void ratio is more commonly used in soil mechanics rather porosity.
Degree of Saturation: Degree of saturation is the ratio of volume of water to volume
of voids.
𝑺 =𝒗𝒐𝒍𝒖𝒎𝒆 𝒐𝒇 𝒘𝒂𝒕𝒆𝒓
𝒗𝒐𝒍𝒖𝒎𝒆 𝒐𝒇 𝒗𝒐𝒊𝒅=
𝑽𝒘
𝑽𝒗 (𝒙 𝟏𝟎𝟎%)
S value changes from 0% for completely dry soil condition to 100% for fully saturated
soil. The soils with 0 <S <100% are called partially saturated soils.
Water content: Water content is the ratio of weight of water to weight of solids and
expressed as percentage. The water content is also known as moisture content. It is an
Physical Properties of Soils
Page | 10
important property of soil. The characteristics of a soil, especially a fine grained soil,
change to a marked degree with a variation of its water content.
𝒘 =𝒘𝒆𝒊𝒈𝒉𝒕 𝒐𝒇 𝒘𝒂𝒕𝒆𝒓
𝒘𝒆𝒊𝒈𝒉𝒕 𝒐𝒇 𝒔𝒐𝒍𝒊𝒅=
𝑾𝒘
𝑾𝒔 (𝒙 𝟏𝟎𝟎%)
Total unit weight / Bulk unit weight: Total unit weight is defined as the total weight per
unit volume of soil. It is also known as wet unit weight.
𝜸𝒕 =𝑾
𝑽=
𝑾𝒔 + 𝑾𝒘
𝑽𝒔 + 𝑽𝒘 + 𝑽𝒂
Dry unit weight: Dry unit weight is defined as the weight of solid per unit total volume.
Note that, is not necessarily physically dry unit weight of soils, but it rather is treated
as a case by mathematically removing water while maintaining constant total volume V
without shrinkage, which takes place during the physical drying process.
𝜸𝒅 =𝑾𝒔
𝑽
2.5 RELATIONSHIP BETWEEN VOID RATIO AND POROSITY
From definition,
𝑛 =𝑉𝑣𝑉
………… (2.1)
𝑒 =𝑉𝑣𝑉𝑠
………… (2.2)
From equation (2.1),
𝑛 =𝑉𝑣
𝑉𝑣 + 𝑉𝑠
Divided the above equation by Vv ,
𝒏 =𝒆
𝟏 + 𝒆 ………… (2.3)
2.6 RELATION BETWEEN VOID RATIO AND WATER CONTENT:
From definition,
Physical Properties of Soils
Page | 11
𝑒 =𝑉𝑣𝑉𝑠
𝑆 =𝑉𝑤𝑉𝑣
Specific gravity,
𝐺 =𝛾𝑠𝛾𝑤
Water content,
𝑤 =𝑊𝑤
𝑊𝑠
⟹ 𝑤 =𝛾𝑤𝑆𝑉𝑣𝐺𝛾𝑤𝑉𝑠
𝒘 =𝑺𝒆
𝑮 ………… (2.4)
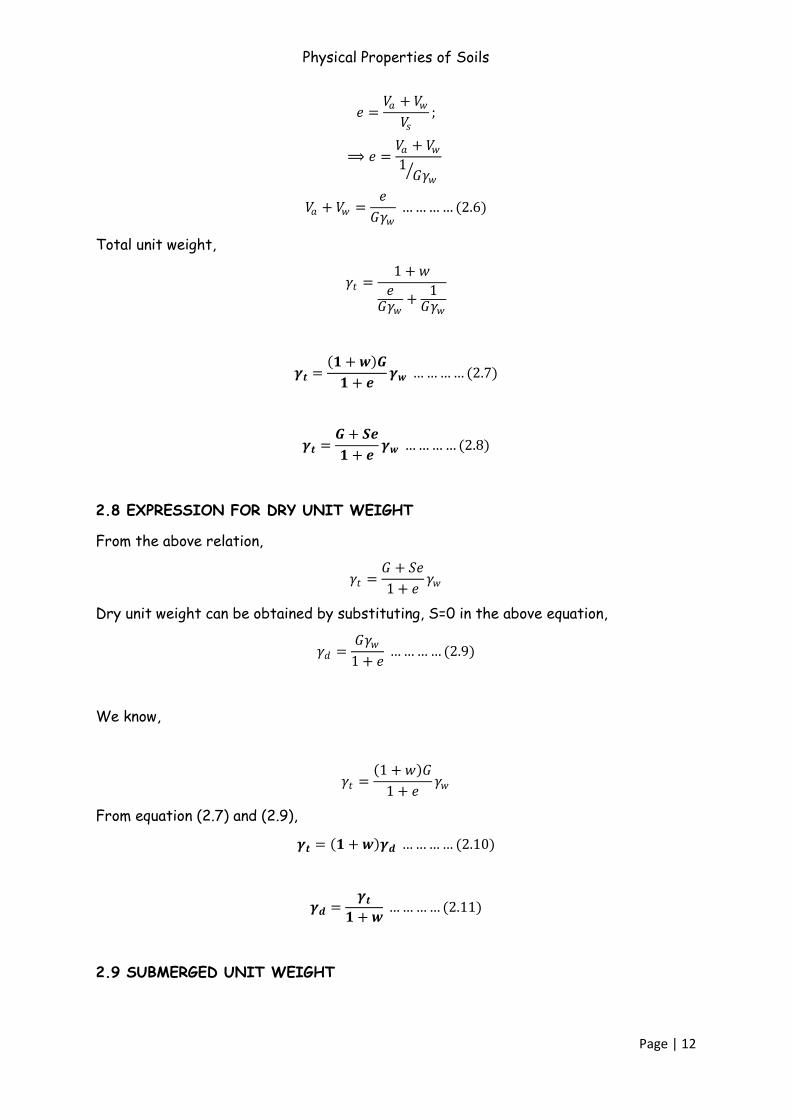
2.7 EXPRESSION FOR TOTAL UNIT WEIGHT IN TERMS OF S, e, w & G
Figure 2.4: Definition of void ratio and porosity
From definition, water content,
𝑤 =𝑊𝑤
𝑊𝑠 ; ⟹ 𝑊𝑤 = 𝑤
Specific gravity,
𝐺 = 𝛾𝑠𝛾𝑤
=
𝑊𝑠𝑉𝑠
𝛾𝑤
𝑉𝑠 =1
𝐺𝛾𝑤 ………… (2.5)
Void ratio,
Void=
Air + Water
Solid
1.0
e
1.0
1+e
n
1-n
Physical Properties of Soils
Page | 12
𝑒 =𝑉𝑎 + 𝑉𝑤
𝑉𝑠;
⟹ 𝑒 =𝑉𝑎 + 𝑉𝑤1
𝐺𝛾𝑤
𝑉𝑎 + 𝑉𝑤 =𝑒
𝐺𝛾𝑤 ………… (2.6)
Total unit weight,
𝛾𝑡 =1 + 𝑤
𝑒𝐺𝛾𝑤
+1
𝐺𝛾𝑤
𝜸𝒕 = 𝟏 + 𝒘 𝑮
𝟏 + 𝒆𝜸𝒘 ………… (2.7)
𝜸𝒕 =𝑮 + 𝑺𝒆
𝟏 + 𝒆𝜸𝒘 ………… (2.8)
2.8 EXPRESSION FOR DRY UNIT WEIGHT
From the above relation,
𝛾𝑡 =𝐺 + 𝑆𝑒
1 + 𝑒𝛾𝑤
Dry unit weight can be obtained by substituting, S=0 in the above equation,
𝛾𝑑 =𝐺𝛾𝑤
1 + 𝑒 ………… (2.9)
We know,
𝛾𝑡 = 1 + 𝑤 𝐺
1 + 𝑒𝛾𝑤
From equation (2.7) and (2.9),
𝜸𝒕 = 𝟏 + 𝒘 𝜸𝒅 ………… (2.10)
𝜸𝒅 =𝜸𝒕
𝟏 + 𝒘 ………… (2.11)
2.9 SUBMERGED UNIT WEIGHT
Physical Properties of Soils
Page | 13
Submerged unit weight is the soil’s unit weight under water. A buoyant force acts on
the soil solids. According to the Archimedes principle, the buoyant force is equal to the
weight of water displaced by the solids. The net mass of the solids is reduced. The
reduced mass is known as the submerged mass or buoyant mass.
𝛾′ = 𝛾𝑡 − 𝛾𝑤 =𝐺 + 𝑆𝑒
1 + 𝑒𝛾𝑤 − 𝛾𝑤 =
𝐺 − 1 − 𝑒 1 − 𝑆
1 + 𝑒𝛾𝑤
(For partially saturated)
𝛾′ = 𝛾𝑡 − 𝛾𝑤 =𝐺 + 𝑒
1 + 𝑒𝛾𝑤 − 𝛾𝑤 =
𝐺 − 1
1 + 𝑒𝛾𝑤
(For fully saturated)
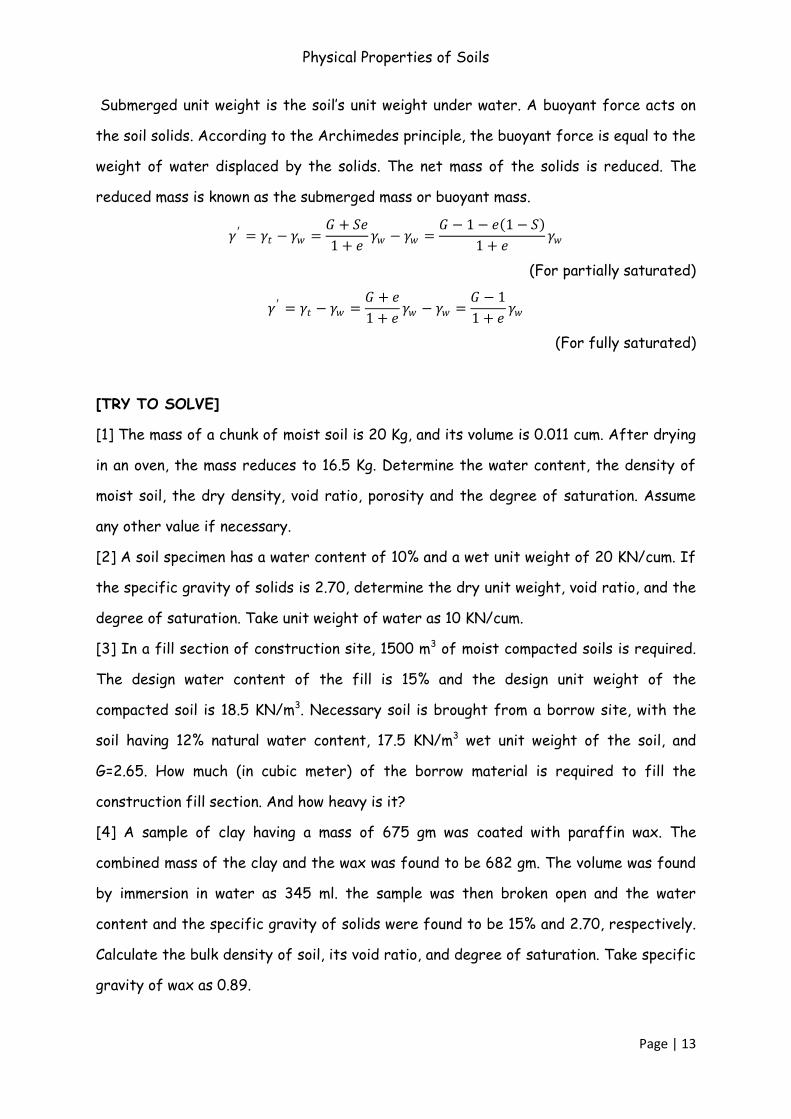
[TRY TO SOLVE]
[1] The mass of a chunk of moist soil is 20 Kg, and its volume is 0.011 cum. After drying
in an oven, the mass reduces to 16.5 Kg. Determine the water content, the density of
moist soil, the dry density, void ratio, porosity and the degree of saturation. Assume
any other value if necessary.
[2] A soil specimen has a water content of 10% and a wet unit weight of 20 KN/cum. If
the specific gravity of solids is 2.70, determine the dry unit weight, void ratio, and the
degree of saturation. Take unit weight of water as 10 KN/cum.
[3] In a fill section of construction site, 1500 m3 of moist compacted soils is required.
The design water content of the fill is 15% and the design unit weight of the
compacted soil is 18.5 KN/m3. Necessary soil is brought from a borrow site, with the
soil having 12% natural water content, 17.5 KN/m3 wet unit weight of the soil, and
G=2.65. How much (in cubic meter) of the borrow material is required to fill the
construction fill section. And how heavy is it?
[4] A sample of clay having a mass of 675 gm was coated with paraffin wax. The
combined mass of the clay and the wax was found to be 682 gm. The volume was found
by immersion in water as 345 ml. the sample was then broken open and the water
content and the specific gravity of solids were found to be 15% and 2.70, respectively.
Calculate the bulk density of soil, its void ratio, and degree of saturation. Take specific
gravity of wax as 0.89.

Physical Properties of Soils
Page | 14
2.10 PARTICLE SIZE AND GRADATION
Particle size plays a dominant role in distinguishing soil types. Commonly used soil names
are
Gravel
Sand
Silt
Clay
The boundary particle sizes are slightly different, depending on the standards.
Boundary particle size in AASHTO (American Association of State Highway and
Transportation Officials) and USCS (Unified Soil Classification System) standards are
given below
Figure 2.5: Soil’s names with grain size (AASHTO System)
Figure 2.6: Soil’s names with grain size (USCS System)
Sand
Coarse Fine Gravel Silt Clay
2.0 mm
Particle size (not in scale)
0.425 mm 0.075 mm
0.005 mm
Particle size (not in scale)
0.075 mm 4.75 mm
Gravel Sand Fine
Physical Properties of Soils
Page | 15
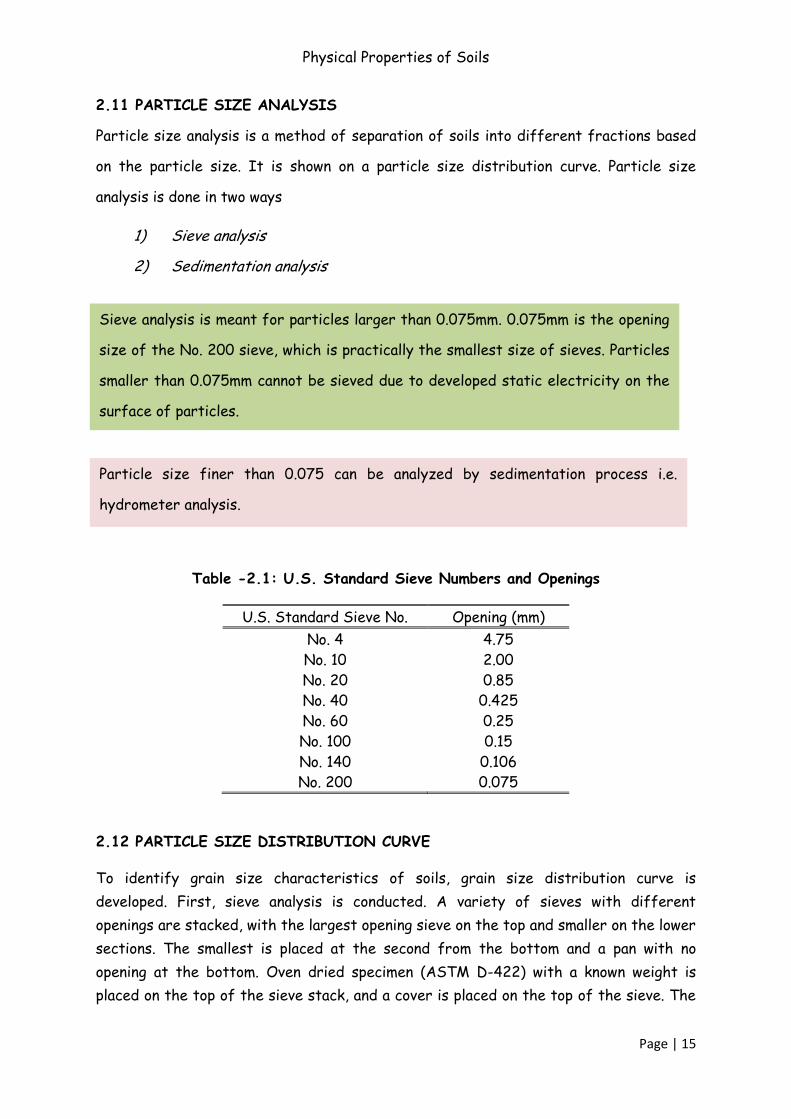
2.11 PARTICLE SIZE ANALYSIS
Particle size analysis is a method of separation of soils into different fractions based
on the particle size. It is shown on a particle size distribution curve. Particle size
analysis is done in two ways
1) Sieve analysis
2) Sedimentation analysis
Table -2.1: U.S. Standard Sieve Numbers and Openings
U.S. Standard Sieve No. Opening (mm)
No. 4 4.75
No. 10 2.00
No. 20 0.85
No. 40 0.425
No. 60 0.25
No. 100 0.15
No. 140 0.106
No. 200 0.075
2.12 PARTICLE SIZE DISTRIBUTION CURVE
To identify grain size characteristics of soils, grain size distribution curve is
developed. First, sieve analysis is conducted. A variety of sieves with different
openings are stacked, with the largest opening sieve on the top and smaller on the lower
sections. The smallest is placed at the second from the bottom and a pan with no
opening at the bottom. Oven dried specimen (ASTM D-422) with a known weight is
placed on the top of the sieve stack, and a cover is placed on the top of the sieve. The
Sieve analysis is meant for particles larger than 0.075mm. 0.075mm is the opening
size of the No. 200 sieve, which is practically the smallest size of sieves. Particles
smaller than 0.075mm cannot be sieved due to developed static electricity on the
surface of particles.
Particle size finer than 0.075 can be analyzed by sedimentation process i.e.
hydrometer analysis.
Physical Properties of Soils
Page | 16
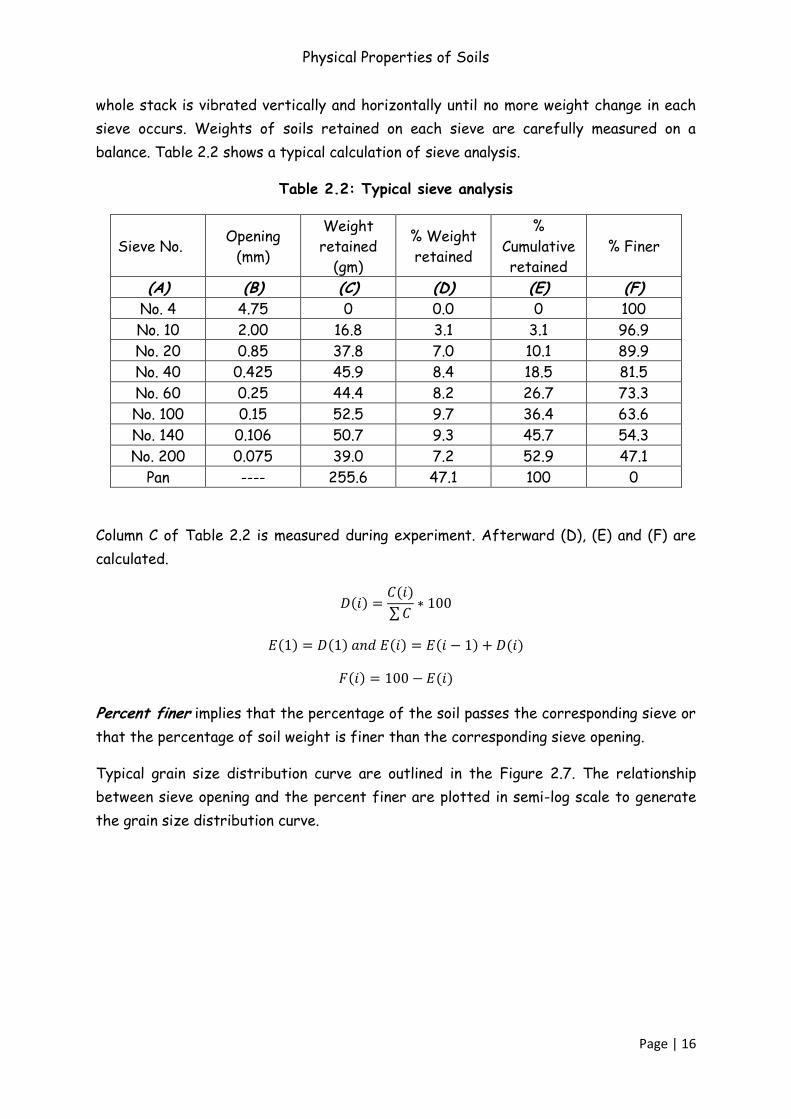
whole stack is vibrated vertically and horizontally until no more weight change in each
sieve occurs. Weights of soils retained on each sieve are carefully measured on a
balance. Table 2.2 shows a typical calculation of sieve analysis.
Table 2.2: Typical sieve analysis
Sieve No. Opening
(mm)
Weight
retained
(gm)
% Weight
retained
%
Cumulative
retained
% Finer
(A) (B) (C) (D) (E) (F)
No. 4 4.75 0 0.0 0 100
No. 10 2.00 16.8 3.1 3.1 96.9
No. 20 0.85 37.8 7.0 10.1 89.9
No. 40 0.425 45.9 8.4 18.5 81.5
No. 60 0.25 44.4 8.2 26.7 73.3
No. 100 0.15 52.5 9.7 36.4 63.6
No. 140 0.106 50.7 9.3 45.7 54.3
No. 200 0.075 39.0 7.2 52.9 47.1
Pan ---- 255.6 47.1 100 0
Column C of Table 2.2 is measured during experiment. Afterward (D), (E) and (F) are
calculated.
𝐷 𝑖 =𝐶(𝑖)
𝐶∗ 100
𝐸 1 = 𝐷 1 𝑎𝑛𝑑 𝐸 𝑖 = 𝐸 𝑖 − 1 + 𝐷(𝑖)
𝐹 𝑖 = 100 − 𝐸(𝑖)
Percent finer implies that the percentage of the soil passes the corresponding sieve or
that the percentage of soil weight is finer than the corresponding sieve opening.
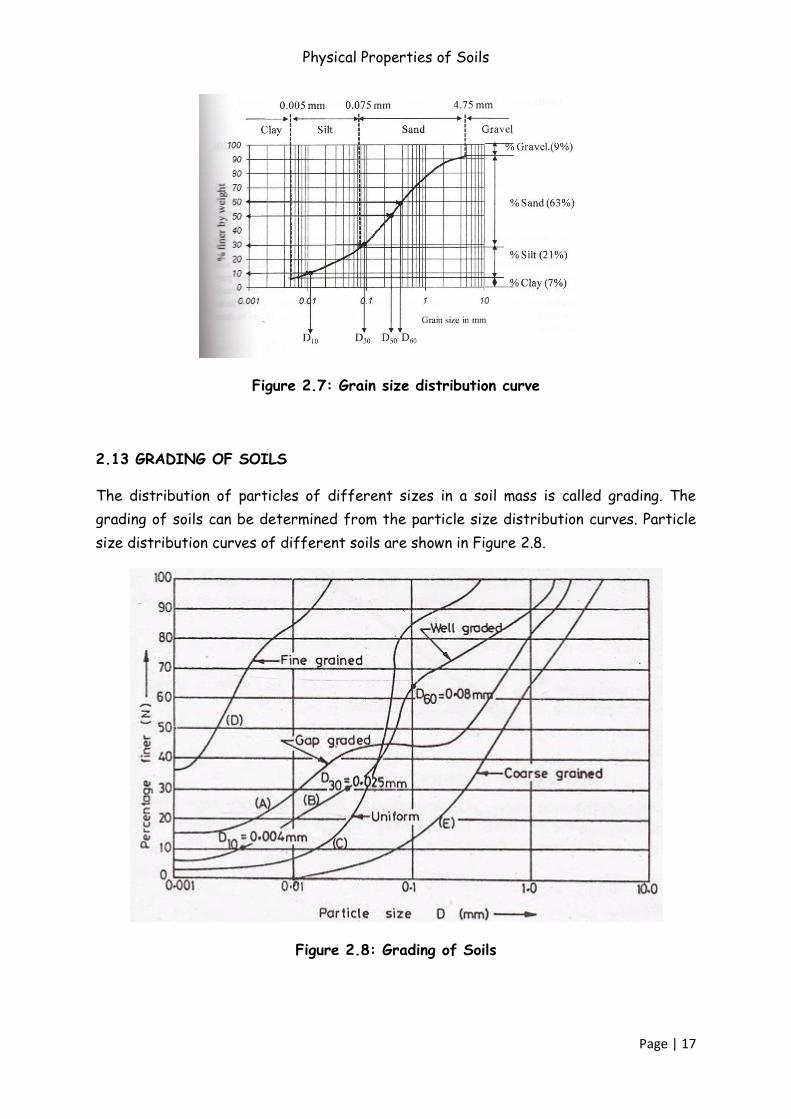
Typical grain size distribution curve are outlined in the Figure 2.7. The relationship
between sieve opening and the percent finer are plotted in semi-log scale to generate
the grain size distribution curve.
Physical Properties of Soils
Page | 17
Figure 2.7: Grain size distribution curve
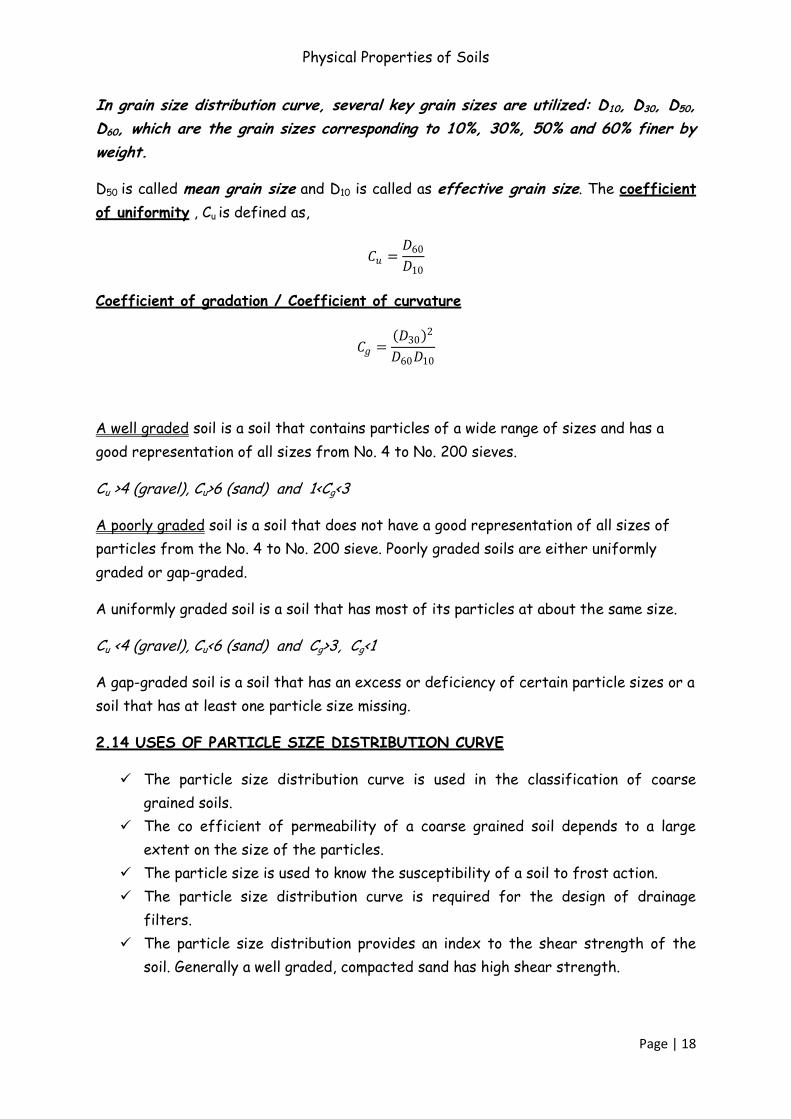
2.13 GRADING OF SOILS
The distribution of particles of different sizes in a soil mass is called grading. The
grading of soils can be determined from the particle size distribution curves. Particle
size distribution curves of different soils are shown in Figure 2.8.
Figure 2.8: Grading of Soils
Physical Properties of Soils
Page | 18
In grain size distribution curve, several key grain sizes are utilized: D10, D30, D50,
D60, which are the grain sizes corresponding to 10%, 30%, 50% and 60% finer by
weight.
D50 is called mean grain size and D10 is called as effective grain size. The coefficient
of uniformity , Cu is defined as,
𝐶𝑢 =𝐷60
𝐷10
Coefficient of gradation / Coefficient of curvature
𝐶𝑔 = 𝐷30
2
𝐷60𝐷10
A well graded soil is a soil that contains particles of a wide range of sizes and has a
good representation of all sizes from No. 4 to No. 200 sieves.
Cu >4 (gravel), Cu>6 (sand) and 1<Cg<3
A poorly graded soil is a soil that does not have a good representation of all sizes of
particles from the No. 4 to No. 200 sieve. Poorly graded soils are either uniformly
graded or gap-graded.
A uniformly graded soil is a soil that has most of its particles at about the same size.
Cu <4 (gravel), Cu<6 (sand) and Cg>3, Cg<1
A gap-graded soil is a soil that has an excess or deficiency of certain particle sizes or a
soil that has at least one particle size missing.
2.14 USES OF PARTICLE SIZE DISTRIBUTION CURVE
The particle size distribution curve is used in the classification of coarse
grained soils.
The co efficient of permeability of a coarse grained soil depends to a large
extent on the size of the particles.
The particle size is used to know the susceptibility of a soil to frost action.
The particle size distribution curve is required for the design of drainage
filters.
The particle size distribution provides an index to the shear strength of the
soil. Generally a well graded, compacted sand has high shear strength.

Physical Properties of Soils
Page | 19
The copressibility of a soil can also be judged from its particle size distribution
curve. A uniform soil is more compressible than a well graded soil.
The particle size distribution curve is useful in soil stabilisation and for the
design of pavements.
The particle size distribution curve may indicate the mode of deposition of a
soil.
The particle size distribution curve of a residual soil may indicate the age of the
soil deposit. With increasing age, the average particle size decreases because of
weathering. The particle size distribution curve which is initially wavy becomes
smooth and regular with age.
Physical Properties of Soils
Page | 20
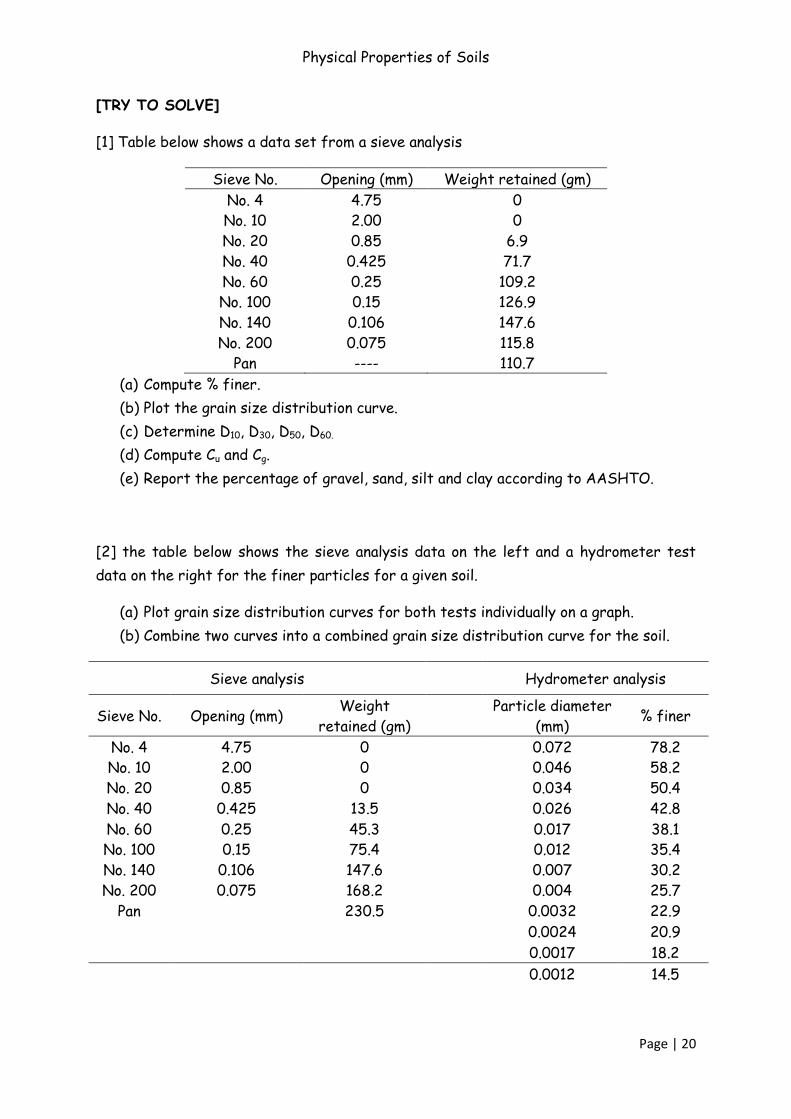
[TRY TO SOLVE]
[1] Table below shows a data set from a sieve analysis
Sieve No. Opening (mm) Weight retained (gm)
No. 4 4.75 0
No. 10 2.00 0
No. 20 0.85 6.9
No. 40 0.425 71.7
No. 60 0.25 109.2
No. 100 0.15 126.9
No. 140 0.106 147.6
No. 200 0.075 115.8
Pan ---- 110.7
(a) Compute % finer.
(b) Plot the grain size distribution curve.
(c) Determine D10, D30, D50, D60.
(d) Compute Cu and Cg.
(e) Report the percentage of gravel, sand, silt and clay according to AASHTO.
[2] the table below shows the sieve analysis data on the left and a hydrometer test
data on the right for the finer particles for a given soil.
(a) Plot grain size distribution curves for both tests individually on a graph.
(b) Combine two curves into a combined grain size distribution curve for the soil.
Sieve analysis Hydrometer analysis
Sieve No. Opening (mm) Weight
retained (gm)
Particle diameter
(mm) % finer
No. 4 4.75 0 0.072 78.2
No. 10 2.00 0 0.046 58.2
No. 20 0.85 0 0.034 50.4
No. 40 0.425 13.5 0.026 42.8
No. 60 0.25 45.3 0.017 38.1
No. 100 0.15 75.4 0.012 35.4
No. 140 0.106 147.6 0.007 30.2
No. 200 0.075 168.2 0.004 25.7
Pan 230.5 0.0032 22.9
0.0024 20.9
0.0017 18.2
0.0012 14.5