chapter 2: issues and opportunities
TRANSCRIPT

Door County Comprehensive and Farmland Preservation Plan 2035: Volume II, Resource Report
3 | Chapter 2: Issues and Opportunities
CHAPTER 2: ISSUES AND OPPORTUNITIES
Door County Comprehensive and Farmland Preservation Plan 2035: Volume II, Resource Report
4 | Chapter 2: Issues and Opportunities
INTRODUCTION This chapter provides a summary of the results from four county-wide “visioning” meetings held between October 2006 and May 2007 for Door County residents and property owners. It also describes the general issues and opportunities currently facing the county identified in those visioning meetings. Finally, it contains population data required by the comprehensive and farmland preservation planning legislation and relevant to all comprehensive planning topics.
COUNTY VISIONING RESULTS At county-wide visioning meetings held between 2006 and 2007, Door County residents and property owners explored two questions: 1) What are the county's greatest assets? and 2) What words or phrases best capture your vision for the county's future? Participants wrote on note cards as many responses as they liked for each question; cards were collected and responses later transcribed by Door County Planning Department staff members. Participants also verbally shared top response(s) to each question at the meetings; those responses were recorded on flipcharts upon which participants placed six “votes” for their top response choices. Those shared responses and vote tallies were also later transcribed. Planning staff grouped all of the responses, note card and flipchart, into ten main categories (two of which had subcategories) that generally followed the topical elements described in Wisconsin’s comprehensive planning statutes for inclusion in comprehensive plans. Though some responses incorporated multiple themes, each response was placed into only one category. Based on both the number of responses written on individuals’ note cards and the number of votes cast for the shared/flipchart responses given for the question “What are the county’s greatest assets?”, residents and property owners value natural resources as the county’s greatest assets. Response categories receiving the second and third highest number of responses, respectively, were community character, and utilities and community facilities. Based on both the number of responses written on individuals’ note cards and the number of votes cast for the shared/flipchart responses given to the question “What words or phrases best capture your vision for the county’s future?”, residents and property owners value community character as most important to their vision of the county’s future. Response categories receiving the second, third, and a close fourth highest number of responses were economic development, utilities and community facilities, and land use, respectively. The following chart provides further detail on the visioning session results. Complete results from all four planning meetings are posted on the Door County Planning Department Web site, http://map.co.door.wi.us/planning.

Door County Comprehensive and Farmland Preservation Plan 2035: Volume II, Resource Report
5 | Chapter 2: Issues and Opportunities

Door County Comprehensive and Farmland Preservation Plan 2035: Volume II, Resource Report
6 | Chapter 2: Issues and Opportunities
GENERAL ISSUES AND OPPORTUNITIES FACING THE COUNTY The following lists of issues and opportunities are based on input received from Door County residents and property owners during the 2006-2007 county-wide visioning sessions. The lists were reviewed and revised for the 2014 update, this plan. ISSUES
Issues facing the county were defined as weaknesses internal to the county and/or existing or potential threats due to external factors or trends originating from outside the county. Sustainability
We need to focus on sustaining and balancing the economy, environment, and social systems so that human needs and desires are balanced with the preservation of the natural environment.
We are nearly completely reliant on non-renewable energy sources and lack the infrastructure to utilize renewable energy resources.
We need to manage tourism in a sustainable manner, including developing tourism programs that focus on education and appreciation of the county’s unique resources.
Natural Resources
Future growth needs to be balanced with the preservation of natural resources. We need effective and efficient land management, such as concentrating/clustering growth, which would help retain open space and natural beauty.
Economic Development
There is a lack of diversity in our economy. The county has few job opportunities with benefits and loses young people to better job opportunities elsewhere. That, combined with our lack of affordable housing options, will continue to keep young people from living and raising families here.
The Northern Door economy especially is very dependent on tourism. The Southern Door economy offers somewhat more diverse economic activity, but, such as in the case of agriculture, is also limited or threatened by various forces.
Limited internet technology in parts of the county may be preventing establishment of various businesses.
Agricultural Resources
We are faced with decreasing agricultural diversity and fewer people making a living in agriculture.
Fewer local and small family farms means less food security and sustainability.

Door County Comprehensive and Farmland Preservation Plan 2035: Volume II, Resource Report
7 | Chapter 2: Issues and Opportunities
Community Character
Growth may jeopardize our rural character, such as our open land, historic/old buildings, scenic vistas, and small-town character.
Community Facilities and Utilities
We need more educational opportunities for people of all ages, particularly in the tourism off-season.
We are faced with an aging population that will greatly increase the demand for senior support and health care services.
Our trail system outside of our parks is limited and will become increasingly difficult to develop as the cost of land increases.
We have good school systems, but several are faced with declining enrollment. Transportation. There are a lack of alternative transportation options to-and-from the county. Land Use. New development is often not contiguous with existing development and encroaches on ecologically and aesthetically valuable open space. Housing. The county is increasingly becoming less accessible to people of all incomes and ages. We lack an adequate supply of housing options for people of all income levels, resulting in less economic, social, and cultural diversity. Culture/History. We need more year-round cultural and education activities. OPPORTUNITIES Opportunities were defined as strengths or assets internal to the county or opportunities arising due to external forces or trends. Sustainability
We have many socially and environmentally conscientious residents who could promote more sustainable alternatives for the county’s economy, environment, and social systems.
We have unique resources that can be used to shape tourism programs focused on education and appreciation of the county’s natural assets.
We have the capacity to develop some renewable energy resources, which will make us less dependent on outside energy sources and help control costs.
Natural Resources
We still have a significant quantity of rural character remaining we can work towards preserving, including agriculture, orchards, scenery, and open space.
The county has exceptional water resources that we can and should work to protect for its continued usage by humans and wildlife, and for scenic and recreational purposes. Our roughly 300 miles of shoreline plus lakes, streams, and wetlands offer tourists and residents high quality beaches, parks, fishing, and other recreation.
Door County Comprehensive and Farmland Preservation Plan 2035: Volume II, Resource Report
8 | Chapter 2: Issues and Opportunities
We have abundant and diverse natural resources that will continue to provide habitat for a variety of wildlife if we protect what remains.
We have a good base of protected lands to continue to add to through future land protection and acquisition efforts.
The county is rich in non-metallic mineral resources, which can continue to provide necessary sand and gravel for municipal and construction uses if the extraction process is well-planned and orderly.
Economic Development
We have a relatively clean and beautiful environment, offering high quality living, which can aid in attracting clean and green industries.
The county’s unique geology, including the Niagara Escarpment, is a current focal point for some tourism-based activities and can be further promoted as part of an eco-tourism program.
We have strong cultural assets, including the arts, music, theatre, history, and architecture, which could grow into year-round education and economic development activities.
The county is an ideal retirement location that will continue to attract retirees. They will in turn require more services, providing potential business opportunities.
We can work toward keeping the next generation in the county by developing better job and housing opportunities.
Agricultural Resources
We still have agriculture left to preserve.
We have continuing opportunities to support local agriculture and, for the most part, smaller family farms.
Local programs/incentives could be established to make organic and naturally grown food more accessible to residents.
Community Character
We have a relatively clean, safe, and tranquil living environment to preserve.
If we work to retain them, we can continue to have small-town character and a sense of community with the advantage of big city amenities, convenience, and accessibility.
Community Facilities and Utilities
If we maintain and improve our recreational assets, we can help maintain the long-term health of our residents and promote more recreation-based tourism.

Door County Comprehensive and Farmland Preservation Plan 2035: Volume II, Resource Report
9 | Chapter 2: Issues and Opportunities
The existing snowmobile trail system has potential to be expanded and developed into a multi-use trail system.
Our growing senior population could support more specialized health care for seniors.
There is the potential to establish large medical institutions to serve as both economic development and tourism enhancement.
Public/private partnership opportunities to offer increased and better services for seniors will arise as the need develops.
Transportation. Increased community and government support for transportation initiatives. Land Use. We can plan for development that will be dense and contiguous to existing development. Housing. We can establish public/private initiatives and programs to increase the supply of affordable housing, helping keep and attract young people to the area. Culture/History. We have a variety of cultural and historical resources that can be used, expanded, or improved upon to support eco-tourism programs and educational opportunities for both tourists and residents.
POPULATION AND DEMOGRAPHICS An area’s population numbers and composition, as well as growth and trends, affects economic development, housing, transportation systems, community facilities, utilities, land use, and more. This section provides population data for Door County in order to guide planning efforts addressing those and other issues. First discussed in this section are Door County’s historical population levels from 1900 to 2010 and estimates for the county’s 2013 population level. United States Census Bureau (Census) data from the year 2010 is then more closely analyzed, providing further insight into the county’s population characteristics. Finally, information regarding population trends at the national, state, and county levels is presented, along with discussion regarding the county’s non-resident population levels and projections as to future population levels for year-round residents. Note: Population “estimates” refer to present and previous population levels in years for which there were no official counts, while “projections” refer to anticipated future population levels.
HISTORICAL POPULATION DATA According to the Wisconsin Department of Administration (DOA), between 1900 and 1970 Door County’s year-round population saw a net increase of only 2,523 people. Then, between the 1970 and 1980 Censuses, the area’s year-round population increased by another 4,923 persons, over 24%. (See Table 2.1.) This sudden increase in the county’s population has been anecdotally attributed to an increase in local shipyard employment/activity in the 1970s and to a National Geographic article published in March 1969 that praised the county’s culture and natural beauty, giving the county unprecedented exposure to a large audience; no comparable population growth occurred in that decade at the state or national level (6.5% and 9.8%, respectively). Although the county’s population growth rate has slowed since the 1970s, population overall continued to increase until the 2010 Census showed a population decrease for the first time since the
Door County Comprehensive and Farmland Preservation Plan 2035: Volume II, Resource Report
10 | Chapter 2: Issues and Opportunities
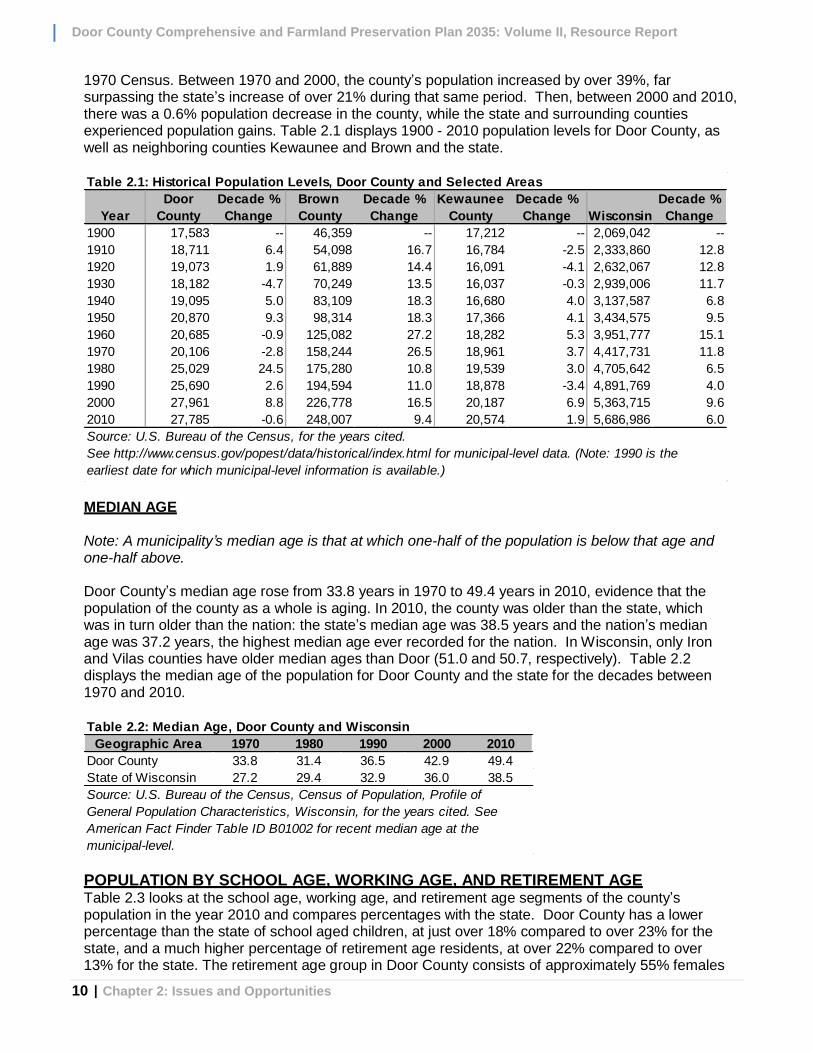
1970 Census. Between 1970 and 2000, the county’s population increased by over 39%, far surpassing the state’s increase of over 21% during that same period. Then, between 2000 and 2010, there was a 0.6% population decrease in the county, while the state and surrounding counties experienced population gains. Table 2.1 displays 1900 - 2010 population levels for Door County, as well as neighboring counties Kewaunee and Brown and the state.
MEDIAN AGE Note: A municipality’s median age is that at which one-half of the population is below that age and one-half above. Door County’s median age rose from 33.8 years in 1970 to 49.4 years in 2010, evidence that the population of the county as a whole is aging. In 2010, the county was older than the state, which was in turn older than the nation: the state’s median age was 38.5 years and the nation’s median age was 37.2 years, the highest median age ever recorded for the nation. In Wisconsin, only Iron and Vilas counties have older median ages than Door (51.0 and 50.7, respectively). Table 2.2 displays the median age of the population for Door County and the state for the decades between 1970 and 2010.
POPULATION BY SCHOOL AGE, WORKING AGE, AND RETIREMENT AGE Table 2.3 looks at the school age, working age, and retirement age segments of the county’s population in the year 2010 and compares percentages with the state. Door County has a lower percentage than the state of school aged children, at just over 18% compared to over 23% for the state, and a much higher percentage of retirement age residents, at over 22% compared to over 13% for the state. The retirement age group in Door County consists of approximately 55% females
Door Brown Kewaunee
Year County County County Wisconsin
1900 17,583 -- 46,359 -- 17,212 -- 2,069,042 --
1910 18,711 6.4 54,098 16.7 16,784 -2.5 2,333,860 12.8
1920 19,073 1.9 61,889 14.4 16,091 -4.1 2,632,067 12.8
1930 18,182 -4.7 70,249 13.5 16,037 -0.3 2,939,006 11.7
1940 19,095 5.0 83,109 18.3 16,680 4.0 3,137,587 6.8
1950 20,870 9.3 98,314 18.3 17,366 4.1 3,434,575 9.5
1960 20,685 -0.9 125,082 27.2 18,282 5.3 3,951,777 15.1
1970 20,106 -2.8 158,244 26.5 18,961 3.7 4,417,731 11.8
1980 25,029 24.5 175,280 10.8 19,539 3.0 4,705,642 6.5
1990 25,690 2.6 194,594 11.0 18,878 -3.4 4,891,769 4.0
2000 27,961 8.8 226,778 16.5 20,187 6.9 5,363,715 9.6
2010 27,785 -0.6 248,007 9.4 20,574 1.9 5,686,986 6.0
Table 2.1: Historical Population Levels, Door County and Selected Areas
Source: U.S. Bureau of the Census, for the years cited.
See http://www.census.gov/popest/data/historical/index.html for municipal-level data. (Note: 1990 is the
earliest date for which municipal-level information is available.)
Decade %
Change
Decade %
Change
Decade %
Change
Decade %
Change
Geographic Area 1970 1980 1990 2000 2010
Door County 33.8 31.4 36.5 42.9 49.4
State of Wisconsin 27.2 29.4 32.9 36.0 38.5
Source: U.S. Bureau of the Census, Census of Population, Profile of
General Population Characteristics, Wisconsin, for the years cited. See
American Fact Finder Table ID B01002 for recent median age at the
municipal-level.
Table 2.2: Median Age, Door County and Wisconsin

Door County Comprehensive and Farmland Preservation Plan 2035: Volume II, Resource Report
11 | Chapter 2: Issues and Opportunities
and 45% males.
POPULATION BY RACE Table 2.4 shows that while Door County’s residents continue to be predominantly white, there were significant increases between 1990 and 2010 in the number of people of color, both single race (“alone”) and bi-racial or more, and in the number of persons of Hispanic/Latino ethnicity (who may be of any race) residing in the county. American Indian or Aleut was the only category that lost population, for the same timeframe.
POPULATION BY HOUSEHOLD COMPOSITION While the total number of family households in Door County increased between 1990 and 2012, the total number of natural born or adopted children decreased. (See Table 2.5.) In 1990, there were 7,578 natural-born or adopted children living in family households; this figure dropped to 4,607, or a decrease of 2,971, by 2012. Also, the number of householders living with people they are not related to has grown significantly between 1990 and 2012, increasing from 345 households in 1990 to 1,147 households in 2012.
POPULATION ESTIMATES AND PROJECTIONS Year-round population projections are calculated by the DOA using birth rates, death rates, and net migration. Typically, natural growth (births minus deaths) outpaces net migration to an area (the difference between residents moving into an area minus those leaving). Door County is atypical in that the county’s population growth between 1990 and 2010 came from net migration and not natural growth; during this time, the number of deaths surpassed the number of births. The DOA expects this trend to continue, projecting deaths to outpace births in Door County by 5,719 during the time period between 2010 and 2040. However, the DOA also projects that Door County will grow by 4,554 additional residents because of net migration. It is important to note that predicting net migration is difficult and the DOA warns that it “is the most elusive in sketching the future population scenario.” In particular, migration that is not related to job growth is the most difficult to project, and, in recent decades, the in-migration of retirees has been a significant contributor to Door County’s
Age
Groups Male Female Total Door County Wisconsin
School Age (<18) 2,583 2,493 5,076 18.3 23.6
Working Age (18-64) 8,277 8,187 16,464 59.3 62.8
Retirement Age (65+) 2,819 3,426 6,245 22.5 13.7
Total Population 13,679 14,106 27,785 -- --
Table 2.3: Population by Age Groups and Sex, Door County and Wisconsin
Source: U.S. Bureau of the Census, 2010 Census of Population and Housing.
See American Fact Finder Table ID S0101 for municipal-level information.
Age Group as % of
Total Population
Change 1990 - 2010
Race 1990 2000 2010 # %
White (alone) 25,387 27,356 26,839 1,452 6%
Black (alone) 29 53 144 115 397%
American Indian or Aleut (alone) 178 183 162 -16 -9%
Asian or Pacific Islander (alone) 47 81 116 69 147%
Hispanic or Latino (of any race) 153 267 671 518 339%
Two or More Races (not Hispanic or Latino) 49 194 227 178 363%
Source: U.S. Bureau of the Census, for the years cited.
See American Fact Finder Table ID QT-P3 for municipal-level data.
Table 2.4: Race Composition, Door County

Door County Comprehensive and Farmland Preservation Plan 2035: Volume II, Resource Report
12 | Chapter 2: Issues and Opportunities
population growth.
YEAR-ROUND POPULATION ESTIMATES AND PROJECTIONS According to the Census, Door County had 27,785 residents in 2010. The DOA estimates Door County’s population in 2013 to have been 27,966, an increase of 181 (0.7%) people from 2010. (See Table 2.6.) The county’s natural population is estimated to have decreased by 223 residents, but net migration to have increased the total population by 404 (1.5%), with the resultant net growth at 181 (0.7%). During these same years, the state grew an estimated 1.0% via natural increase, but had 0.5% net migration decrease, for an overall increase of 0.5%.
Table 2.7 shows the DOA population projections, along with natural increase and net migration, for Door County for the 10-year increments between 2010 and 2040. Over this 30-year period, deaths are projected to outpace births by 5,719 and net migration is projected to total 4,554, resulting in a projected net loss of 1,165 residents. This loss in population is projected to take place between 2030 and 2040, when deaths outpace births by 2,603 and net migration is at 858, resulting in a population loss of 1,745 for that decade. There is a slight projected increase in population for the decades between 2010 and 2030. Note that the DOA projects Door County’s population to be 27,755 in the year 2035. This figure is not shown in Table 2.7, though, because they do not project natural increase or net migration in five-year increments. For this reason, the remainder of this volume of the plan will discuss population, household, and land use projections through the year 2040, providing five-year data
Household Composition 1990 2000 2010*
In family households:
Householder 7,192 7,997 8,560
Spouse 6,262 6,867 7,455
Child:
Natural-born or adopted 7,578 6,997 4,607
Step 290 332 126
Grandchild 112 162 114
Other relatives 363 161 21
Nonrelatives 249 373 498
In nonfamily households:
Householder living alone 2,529 3,640 3,988
Householder not living alone 345 509 1,147
Nonrelatives 425 638 907
In group quarters: 345 381 386
Source: U.S. Bureau of the Census, for the years cited.
See American Fact Finder Table ID B09019 for
municipal-level information.
*3-year estimate 2010-2012.
Table 2.5: Household Composition, Door County
Births Deaths
Natural
Increase
Net
Migration Total
Natural
Increase
Net
Migration
Total %
Change
State 5,686,986 5,717,110 189,290 132,980 56,310 -26,186 30,124 1.0% -0.5% 0.5%
Door County 27,785 27,966 627 850 -223 404 181 -0.8% 1.5% 0.7%
Table 2.6: Population by Components of Change, State and Door County
Estimated # Change Estimated % Change
Source: Wisconsin Department of Administration, Estimated Components of Population Change for
Wisconsin Counties. Population data by components of change not available at the municipal-level.
Area
4/1/2010
Census
1/1/2013
Estimate

Door County Comprehensive and Farmland Preservation Plan 2035: Volume II, Resource Report
13 | Chapter 2: Issues and Opportunities
only where applicable or required by comprehensive planning legislation.
Door County’s population is significantly older than that of the state or the nation and is projected to continue to grow older at a faster rate. For 2010, the DOA projected that 23% of the county’s population was 65 or older, compared to only 14% for the state for the same year. (See Table 2.8.) By 2040, that same group is projected to comprise 38% of the county’s population, compared to only 24% for the state. At the same time the 65 and older segment of the county’s population is increasing as a proportion of the total population, county residents aged 24 and younger are going to comprise a smaller proportion of the population. In 2010, county residents 24 years of age and under were projected to make up 23% of the county’s population, compared to 33% for the state; by 2040, these percentages are projected to fall to 21% for the county and 30% for the state.
SEASONAL POPULATION ESTIMATES Census data, DOA, and other agency population counts, estimates, and projections only deal with year-round residents. Door County has many seasonal or part-time residents – persons with homes in the county but whose primary residence is outside the county – and hundreds of thousands of tourists throughout the year who visit the county for just the day or stay overnight in hotel units, campsites, condominium unit rentals, house/cottage rentals, etc. The presence of these part-time residents and visitors obviously affects local economic development and housing markets; the use, maintenance, and potential expansion of transportation systems, recreational and other community facilities, and utilities; and land use. Because of the difficulties in counting, estimating, or projecting seasonal populations, the DOA does not even attempt to do so. Others have used simplistic methods of estimating Door County’s
Year
Actual/
Projected
Natural
Increase
Net
Migration
Decadal
Growth/Loss
2010 27,785 -- -- --
2020 27,890 -1,282 1,387 105
2030 28,365 -1,834 2,309 475
2040 26,620 -2,603 858 -1,745
Change
2010 - 2040 -1,165 -5,719 4,554 --
Source: Wisconsin Department of Administration, Population Projections,
Vintage 2013. For municipal-level population projections in 5-year
increments, see http://www.doa.state.wi.us/divisions/intergovernmental-
relations/demographic-services-center/projections#preliminary and select
"MCD and Municipal Population Projections, 2010-2040."
Table 2.7: Population Projections, Door County
Age Group 2010 2040 2010 2040
0 - 24 23% 18% 33% 30%
25 - 64 54% 44% 53% 46%
65+ 23% 38% 14% 24%
Total Population 100% 100% 100% 100%
Table 2.8: Population Projections by Age Group, State
and Door County
Door County State
Source: Wisconsin Department of Administration, Population
Projections, Vintage 2013.

Door County Comprehensive and Farmland Preservation Plan 2035: Volume II, Resource Report
14 | Chapter 2: Issues and Opportunities
seasonal resident population, such as multiplying the number of housing units counted by the Census as being for “seasonal, recreational, or occasional use” by the average number of persons per household found in the county. Note that there are problems with this method of estimation, including: the assumption that the number of persons per household for a seasonal residence would be equal to that found in a year-round residence; the fact that it excludes all tourists, whether overnight or day-trippers; and the inability to determine when and for how long seasonal units are occupied. Perhaps the best effort to estimate Door County’s “true” population, year-round residents plus seasonal residents and all visitors, was undertaken in 1999 by University of Wisconsin-Extension, Door County. In making calculations, the study author developed three estimates: 1) economic activity attributable to the seasonal population of the county; 2) geographic distribution of the seasonal population, based on municipal share of seasonal homes, hotel and motel rooms, and campground sites; and 3) time of year the seasonal population is in the county, based on traffic counts. Estimates and methods were meant to include and take into account seasonal residents, overnight tourists, and day-trippers. Note that in developing these figures the author assumed January to be a “baseline” month: traffic levels and economic activity during that month were presumed to be those of year-round residents. The study found that the county’s “true” total population, counted in “whole” persons or full-time equivalency residents, was between 20% and 161% higher, depending on the month, than the number of year-round residents counted in Census data for that same year. The monthly percentages from this 1999 study are shown in Table 2.9. Also shown in Table 2.9 are the 2010 estimated seasonal population and total “true” population by month for Door County, using the 2010 Census year-round population of 27,785 residents as the base population in January. While keeping in mind that these numbers are rough estimates and that the population counts (both the Census and the “true” estimates) are now outdated, the “percent over Census” calculations can provide at least some guidance in thinking about the county’s “true” population levels when looking at current and projected populations.
JAN FEB MAR APR MAY JUN JUL AUG SEP OCT NOV DEC
Percent over Census 0% 20% 24% 43% 82% 111% 161% 147% 116% 95% 37% 25%
People in addition to
2010 Census (27,785) 0 5,634 6,805 11,890 22,943 30,944 44,886 40,999 32,296 26,582 10,243 6,930
"True" Population 27,785 33,419 34,590 39,675 50,728 58,729 72,671 68,784 60,081 54,367 38,028 34,715
Table 2.9: Estimated Monthly Seasonal and "True" Population, Door County
Source: University of Wisconsin-Extension Door County Study: “Estimating the Seasonal Population of Door
County,” 1999.

Door County Comprehensive and Farmland Preservation Plan 2035: Volume II, Resource Report
15 | Chapter 2: Issues and Opportunities
RESOURCES AND FURTHER INFORMATION Bay-Lake Regional Planning Commission (http://www.baylakerpc.org/) The Bay-Lake Regional Planning Commission was created in 1972 by Governor Lucey under s. 66.945, Wis. Stats., as the official area-wide planning agency for northeastern Wisconsin. It currently encompasses eight counties: Brown, Door, Florence, Kewaunee, Manitowoc, Marinette, Oconto, and Sheboygan. Bay-Lake provides planning services on area-wide issues, represents local interests on state and federal planning program activities, and provides local planning assistance to communities in the Bay-Lake Region. Door County Economic Development Corporation (http://www.doorcountybusiness.com/) The DCEDC is a public/private partnership dedicated to improving the economic vitality of the county and its residents. Founded in 1989, DCEDC has a variety of programs and initiatives working to attract new businesses to the area and helping existing businesses create and retain jobs. Door County Planning Department (http://map.co.door.wi.us/planning/) The Planning Department’s primary functions are administration and enforcement of the county’s zoning, land division, and other land use management ordinances; preparation and implementation of the county comprehensive and farmland preservation plans; acting as a resource for local public officials and residents on a variety of community development plans and projects; and administering the county addressing program. Door County Visitor Bureau (http://www.doorcounty.com) The Door County Visitor Bureau is the county’s official tourism marketing organization with the mission to generate incremental economic impact for the Door County Peninsula and Washington Island by attracting visitors using sustainable tourism marketing strategies and management principles. University of Wisconsin-Extension, Door County (http://www.uwex.edu/ces/cty/door/) The Door County UW-Extension Office works to bring the knowledge of the University to Door County citizens and to help people apply this information. Contact the Door County Planning Department (listed above) for a copy of the study “Estimating the Seasonal Population of Door County” by Greg Lamb, University of Wisconsin Extension-Door County, 1999. Wisconsin Department of Administration – Demographic Services (http://www.doa.state.wi.us/) The Demographic Services Center's primary responsibility is to develop annual total population estimates for all Wisconsin towns, villages, and cities. In addition, the Center develops population and household estimates and projections for all municipalities and population projections by age and sex for counties. U.S. Bureau of the Census (http://www.census.gov/) The Census Bureau serves as the leading source of quality data about the nation's people and economy with the goal to provide the best mix of timeliness, relevancy, quality, and cost for the data collected and services provided. The Census Bureau conducts the following censuses and surveys:
Population and Housing Census - every 10 years
Economic Census - every 5 years
Census of Governments - every 5 years
American Community Survey - annually
Demographic & Economic surveys
Economic Indicators