chapter 2 inventory - oregon 2 inventory ... the inventory process. ... • future land use plans,...
TRANSCRIPT

Oregon Department of Aviation (Final Document February 2008) 2-1
Chapter 2 Inventory To evaluate the adequacy of the Oregon system of airports, an inventory of the existing
conditions was necessary. The Project Team was able to evaluate the existing condition of
individual airports, and the state aviation system as a whole, from information collected through
the inventory process. The data compiled by the inventory process includes:
• Physical airport characteristics
• Activity levels
• Environmental considerations
• Navigational aids
• Local socio-economic data
• Airport financial data
• Surface transportation access
• Terminal, airspace, and airfield capacity
The inventory process is summarized in the following sections, which include:
• 2.1 Aviation Inventory
• 2.2 Surveys
• 2.3 Oregon System of Airports
2.1 Aviation Inventory
The Oregon Aviation Plan 2007 (OAP 2007) assesses 97 public-use airports, which include 85
publicly-owned and 12 privately owned airports stretched out over 98,386 square miles of the
state of Oregon, the ninth largest of the 50 states. Understanding the needs of an aviation
system this large required extensive coordination with the Oregon Department of Aviation (ODA),
airport managers, owners, local communities, and users of the system. The Project Team
developed a comprehensive data collection strategy that engaged each of these groups, fostered
a working relationship, and created a sense of local ownership in the project.
To encourage project involvement at the local level, individual site visits were conducted at each
of the 97 public-use airports, something that is typically not done as a part of an aviation system
plan. Prior to the site visits, the Project Team sent out a letter to airport managers and airport
owners notifying them of the site visits and requesting a variety of aviation related data. The
requested information was intended to provide the Project Team with background information for
each of the individual airports. The data received was cataloged and evaluated prior to the
airport site visits. The data that was requested from the airports included:
• Number of total based aircraft
• Number of total airport operations

Oregon Aviation Plan 2007 Chapter 2
Oregon Department of Aviation (Final Document February 2008) 2-2
• Number of total enplanements
• A copy of existing Airport Layout Plans / Master Plans
• A copy of existing Exhibit “A” property plans
• Existing State Aviation System Plan documents
• Existing ODA airport database
• Existing aerial photography
• Existing land use documents
• Existing community plans, special area studies, and zoning ordinances which govern the
airport and the area in proximity to the airport
• Existing methods of coordination and communication between the airport and its host
community to gauge the level of interest and authority between the two entities
• Future land use plans, which govern the airport and the airport vicinity
Note: Not every individual airport provided all the various pieces of the requested data.
The individual airport site visits proved to be the most critical component of the data collection
process. The site visits afforded the Project Team the opportunity to inventory the existing airside
and landside facilities, evaluate their condition, and observe the type of aviation activity occurring
at the airport, catalog development challenges such as environmental or topographic concerns,
and, most importantly, to meet with each airport manager to discuss the issues related to their
airport.
An inventory of this magnitude required a consistent and methodical approach based on sound
planning principles. The Project Team began their assessment with the Federal Aviation
Administration (FAA) published the Airport Master Record (Form 5010), which is a
comprehensive record of existing airport facilities, services, based aircraft, and operations. A
checklist was created based on the Airport Master Record and the information was verified during
the inventory process. The data collected through the initial coordination with airport managers
and owners was used to support the findings of the inventory.
It is essential to understand the role of each individual airport within its host community in order to
evaluate the existing airport system and recommend future improvements. The physical
characteristics of each airport were documented during the inventory process and the interviews
conducted with each airport manager provided additional information that allowed the Project
Team to evaluate the role of each airport in the state aviation system. A questionnaire was
mailed to each airport manager prior to the interview to facilitate an informative discussion. A
sample of the questionnaire is included in Appendix B, Surveys. The following is a summary of
the topics discussed:
• Review of facility inventory
• Type of airport users
• Airport activity levels
• Environmental considerations

Oregon Aviation Plan 2007 Chapter 2
Oregon Department of Aviation (Final Document February 2008) 2-3
• Land use considerations
• Airport financial information
• Surface transportation and access
• Local relationship
• Future development plans
2.2 Surveys
Seven surveys were developed to assist in the data collection process for the OAP 2007 and
were distributed to more than 2,000 individuals and agencies that have an interest or role in the
state aviation system. Each of the seven surveys requested similar information, although each
was created with the specific recipient in mind in order to provide multiple perspectives on the
role of aviation in Oregon. The survey results were analyzed in an effort to develop a
comprehensive foundation from which to begin evaluating the state airport system.
As previously noted, the OAP 2007 is a combination of three individual planning studies which
include the Oregon State System Plan Update, Economic Impact Study, and Aviation Master
Plan. The surveys combine questions from each of the three studies to avoid multiple survey
requests from the same individual or agency. The surveys asked for input on operational,
economic, and development questions. The sample surveys are found in Appendix B Surveys.
The following paragraphs describe the seven surveys and the response rates, while the following
section, 2.2.a Survey Analysis, contains an overall summary of all survey responses.
• Airport Manager Survey
The airport manager survey was sent out to each of the 97 public-use airports in the state.
The survey requested information regarding:
• Airport use and development
• Aircraft operations and hangar occupancy
• Airport revenue and expenditures
• Community perception of the airport
• Options for airport improvements
• Airport manager’s view of how their airport fits into the state aviation system
The airports to receive the survey include eight National Plan of Integrated Airports System
(NPIAS) air carrier airports, 48 NPIAS reliever and general aviation airports, and 41 non-
NPIAS general aviation airports. Portland International Airport was not involved in the survey
since they conduct their own planning studies and economic impact assessments. Table 2.1
illustrates the response rate from the airport manager survey.

Oregon Aviation Plan 2007 Chapter 2
Oregon Department of Aviation (Final Document February 2008) 2-4
Table 2.1 Airport Manager Survey Response Rate
Airport Category Response Rate Response
Percent
No Response
Percent
NPIAS air carrier 5 of 8 63% 37%
NPIAS reliever and general aviation 35 of 40 88% 12%
Non-NPIAS general aviation 17 of 49 35% 65%
TOTAL 57 of 97 59% 41%
Source: Mead & Hunt, Inc.
• Business Survey
The business survey was completed by businesses that are located on airport property, are
reliant on the airport, or are members of the aerospace industry. This survey requested
information about:
o Nature of the business
o Reliance of the business on the existence of the airport
o Options for airport improvements
o Options for use of other airports
o Options for potential users/clients
o Company revenues, expenditures, and taxes
The business survey was sent out to 1,251 businesses and aerospace organizations
identified by ODA of which responses were received from 98 recipients. Some survey
respondents did not submit answers to all of the questions; therefore, some questions will
have fewer responses than others. Table 2.2 illustrates the response rate from the business
survey.
Table 2.2 Business Survey Response Rate
Response Rate Response Percent No Response Percent
TOTAL 98 of 1,251 8% 92%
Source: Mead & Hunt, Inc.
• Chamber of Commerce Survey
The chamber of commerce survey was completed by the local chambers of commerce. This
survey evaluated the chambers’ promotion and/or reliance on their local airport for economic
development in the community. In addition, the survey requested information about:
• Economic climate of the local area
• Local interest in airport development
• Other important economic information

Oregon Aviation Plan 2007 Chapter 2
Oregon Department of Aviation (Final Document February 2008) 2-5
The chamber of commerce survey was sent out to 60 chamber organizations identified by ODA,
with assistance from Advisory Committee member Mike Schmidt. Responses were received from
18 chambers. Some survey respondents did not submit answers to all of the questions;
therefore, some questions will have fewer responses than others. Table 2.3 illustrates the
response rate from the chamber of commerce survey.
• County Government Survey
The county government survey was completed by county judges, commissioners, planners,
and economic development agencies. The survey evaluated the following from the various
counties:
• Economic climate of the county
• Importance of the airport to the community it serves
• Interest in airport development with a county’s jurisdictional boundaries
Responses were received from 64 county government officials out of a total of 109 identified
by ODA. Some survey respondents did not submit answers to all of the questions; therefore,
some questions will have fewer responses than others. Table 2.4 illustrates the response
rate from the county government survey.
Table 2.4 County Government Survey Response Rate
Response Rate Response Percent No Response Percent
TOTAL 64 of 109 59% 41%
Source: Mead & Hunt, Inc.
• Host Community Survey
The host community survey was to be completed by local economic development agencies
and the local planning agency for each community that hosts a local airport, of which the
community is not the owner of that airport. This survey assessed the level of interest in the
individual local community regarding the development and existence of the various airports.
Responses were received from 24 host communities out of a total of 80 identified by ODA.
Some survey respondents did not submit answers to all of the questions; therefore, some
questions will have fewer responses than others. Table 2.5 illustrates the response rate from
the host community survey.
Table 2.3 Chamber of Commerce Survey Response Rate
Response Rate Response Percent No Response Percent
TOTAL 18 of 60 30% 70%
Source: Mead & Hunt, Inc.

Oregon Aviation Plan 2007 Chapter 2
Oregon Department of Aviation (Final Document February 2008) 2-6
Table 2.5 Host Community Survey Response Rate
Response Rate Response Percent No Response Percent
TOTAL 24 of 80 30% 70%
Source: Mead & Hunt, Inc.
• Local Government Survey
The local government survey was completed by local planners, local economic development
agencies, and local mayors who have airports located within, and are owned by, their
community. This survey evaluated the following:
• Importance of the airport to the local community
• Local interest in the development of the airport
• Local economic climate
Responses were received from 36 cities out of a total of 109 identified by ODA. Some survey
respondents did not submit answers to all of the questions; therefore, some questions will
have fewer responses than others. Table 2.6 illustrates the response rate from the local
government survey.
Table 2.6 Local Government Survey Response Rate
Response Rate Response Percent No Response Percent
TOTAL 39 of 109 33% 67%
Source: Mead & Hunt, Inc.
• State Legislature Survey
The state legislature survey was completed by various members of the state and federal
legislatures. This survey provided insight into the needs of the community as they relate to
aviation services, business development, and tourism.
Responses were received from 14 state government officials out of a total of 90 identified by
the Oregon Department of Aviation. Some survey respondents did not submit answers to all
of the questions; therefore, some questions will have fewer responses than others. Table 2.7
illustrates the response rate from the state legislature survey.
Table 2.7 State Legislature Survey Response Rate
Response Rate Response Percent No Response Percent
TOTAL 14 of 90 16% 84%
Source: Mead & Hunt, Inc.

Oregon Aviation Plan 2007 Chapter 2
Oregon Department of Aviation (Final Document February 2008) 2-7
• Pilot Survey
This survey was created for pilots utilizing Oregon airports. The pilot survey was distributed
through FlightLines, the ODA quarterly newsletter, as well as the project web page.
Respondents could complete the survey in either a paper format or electronic format. The
pilot survey provided insight into the needs of the pilots using the airports in the state, as well
as the amount of spending attributed to pilots within the state of Oregon. Survey responses
were received from 347pilots and from 102 different locations throughout the state. The
responses were representative of the state population, as most responses came from the
Portland Metropolitan Area, followed by Salem and Eugene. Some survey respondents did
not submit answers to all of the questions; therefore, some questions will have fewer
responses than others.
2.2.a Survey Analysis
Business
Economic Development
The survey results confirm that aviation plays a significant role in the state economy by
supporting business efforts throughout the state. Eighty-four percent (84%) of responding
businesses indicate that if the airport they currently use is no longer available, it would have a
negative effect on their business and the economy. These respondents also indicate that
upgrading airport facilities would support economic growth. A few of these essential needs to
promote strong economic growth include:
• Additional runway length
• Navigational aids
• FBO services
Intra-state Shuttle
Seventy percent (70%) of responding businesses perceive that an intra-state air service
shuttle would fulfill a vital community need. Should the shuttle service be implemented, the
respondents indicated that eighty-six percent (86%) of the users would be businesses.
The survey responses showed that a daily service would be desirable with an arrival at the
destination around 8:00 a.m. and a departure time from the destination around 4:00 p.m.
Many stated that they would be willing to spend $0-$100 per seat to “guarantee” seats on the
shuttle with an estimated user rate of zero to five individuals per day.
Airport Manager
Economic Development
The survey results indicate that fifty-six percent (56%) of responding airport managers feel
that aviation growth is important to the economic well-being of their community. Nearly sixty-
seven percent (67%) of managers indicate that airport development projects would increase

Oregon Aviation Plan 2007 Chapter 2
Oregon Department of Aviation (Final Document February 2008) 2-8
economic growth in the community. The most important improvements to support economic
development as identified by the responding airport managers are listed below:
• Increase runway length – Twenty-seven percent (27%)
• NAVAIDs – Twenty-four percent (24%)
• Other – Thirteen percent (13%)
• Aircraft storage and parking– Nine percent (9%)
• Fuel availability – Nine percent (9%)
• FBO services – Seven percent (7%)
Airport Development
The airport manager responses indicate that medical rescue flights, fire protection, and
mail/cargo delivery are a few of the uses that rely on aviation in Oregon. Currently, sixty-five
percent (65%) of airport managers estimate that communities have land use protection
measures in place. Thirty-four percent (34%) of responses indicate that existing or future
issues pose a threat to future airport use, which include:
• Incompatible land use
• Lack of political interest
• Tall structures
The operational limitations and concerns that were expressed include:
• Insufficient runway length – Twenty-six percent (26%) of respondents
• Lack of navigational aids – Twenty-one percent (21%) of respondents
Intra-state Shuttle
The Intra-state Shuttle concept would provide an air transportation connection between
various cities and the state capital on small aircraft. The purpose of the shuttle would be to
transport local, state, and federal government employees, businesses, health care workers,
and various other users to and from the state capital. The state government could potentially
subsidize portions of the service, while the users would pay for the remainder of the operating
expense. The concept would not compete with air service or travel to cities with commercial
service. Further study would be required to determine the destination cities, route, and
frequency of travel.
The survey results indicate that eighty-two percent (82%) of airport managers perceive that
an intra-state air service shuttle would fulfill a vital community need. Only fifty percent (50%)
of these managers feel that the shuttle would provide economic growth to their community.
The primary users of the shuttle service as indicated by the airport managers would be
business, emergency services, and government.

Oregon Aviation Plan 2007 Chapter 2
Oregon Department of Aviation (Final Document February 2008) 2-9
The survey responses showed that a weekly service would be desirable with an arrival at the
destination around 8:00 a.m. and 10:00 a.m. and a departure time from the destination
around 8:00 a.m. Many stated that they would be willing to spend $0-$100 per seat to
“guarantee” seats on the shuttle for their local community and would expect users to pay
between $51 and $100 per seat for this service, with an estimated user rate of zero to five
individuals per day.
Chamber of Commerce
Economic Development
According to the survey results, there is a significant interest in the economic impact and
growth that airports have on local communities. The tabulated results indicated eighty-nine
percent (89%) of chamber of commerce’s perceive their local airport as a valuable economic
asset. This same eighty-nine percent (89%) believe the communities see a need for
upgrades to the current aviation system to support economic growth. A few of these
essential needs to promote strong economic growth include:
• Aircraft storage and parking
• Additional runway length
• Navigational aids
• Weather services
If an airport no longer existed in their community, seventy-eight percent (78%) of the
respondents noted that there would be a negative impact on the growth and development
associated with that community.
Airport Development
Respondents noted that medical rescue flights, fire protection, and mail/cargo delivery are a
few of the uses that rely on aviation in Oregon. Tourism, timber, and agriculture are some of
the primary industries that use the facilities frequently. Currently, fifty-six percent (56%) of
chamber respondents estimate that their communities have land use protection measures in
place to assist with the implementation of compatible land uses near the airports. Many
indicate operational limitations exist at the various airports, which include:
• Runway length – Fifty-five percent (55%) of respondents
• Terminal amenities – Twenty-eight percent (28%) of respondents
• Aircraft parking/spaces – Twenty-two percent (22%) of respondents
• Navigational aids – Twenty-two percent (22%) of respondents
Intra-state Shuttle
Many chamber members perceive that an intra-state air service shuttle would fulfill a vital
community need. Should the shuttle service be implemented, the respondents indicated
various uses as illustrated below in Table 2.8.

Oregon Aviation Plan 2007 Chapter 2
Oregon Department of Aviation (Final Document February 2008) 2-10
Table 2.8 Intra-state Air Shuttle Service Benefits
User Category Percent to Benefit from the
Shuttle Service
Percent Expected to use
the Shuttle Service
Businesses 29% 20%
Emergency Services 11% 0%
Government 15% 30%
Health Services 16% 12%
Higher Education 13% 12%
Local Residents 0% 22%
Transportation of Cargo 16% 0%
Other 4%
Source: Mead & Hunt, Inc.
The survey responses showed that a daily service would be desirable with an arrival at the
destination around 8:00 a.m. and a departure time from the destination around 5:00 p.m.
Many stated they would be willing to spend up to $0-$100 per seat to “guarantee” seats on
the shuttle for their local community and would expect users to pay between $101and $150
per seat for this service, with an estimated user rate of over 20 individuals per day.
County Government
Economic Development
According to the survey results, there is interest in the economic impact and growth that
airports have on local communities. The results indicated that county government officials
believed that communities perceive their local airport as a valuable economic asset.
Approximately seventy-five percent (75%) of the respondents believe the local communities
see a present need for upgrades to the current aviation system to support economic growth.
Supporting this idea is the fact that sixty-four percent (64%) of county government officials
note that they would expect a negative impact if an airport closed within their local
community. Some of the noted essential services needed to promote strong economic
growth include:
• Additional runway length
• Navigational aids and terminal amenities
• Aircraft parking and storage, availability of fuel, FBO services, taxiways
• Commercial flights
Airport Development
The county government responses indicate that medical rescue flights, fire protection, and
mail/cargo delivery are a few of the uses that rely on aviation in Oregon. Currently, sixty-six
percent (66%) of county government officials estimate that communities have land use

Oregon Aviation Plan 2007 Chapter 2
Oregon Department of Aviation (Final Document February 2008) 2-11
protection measures in place. Twenty-seven percent (27%) of responses indicate that
existing or future issues pose a threat to future airport use, which include:
• Incompatible land use
• Lack of political interest
• Tall structures
The operational limitations and concerns that were expressed include:
• Insufficient runway length – Twenty-four percent (24%) of respondents
• Lack of navigational aids – Thirty-one percent (31%) of respondents
Intra-state Air Shuttle
Many county government officials perceive that an intra-state air shuttle service would fulfill a
community need. The respondents indicated various uses of the proposed shuttle, as
illustrated below in Table 2.9.
Table 2.9 Shuttle Service Benefits
User Category Percent to Benefit from the
Shuttle Service
Percent Expected to use
the Shuttle Service
Businesses 22% 26%
Emergency Services 17% 0%
Government 20% 22%
Health Services 16% 16%
Higher Education 12% 11%
Local Residents 0% 25%
Transportation of Cargo 13% 0%
Source: Mead & Hunt, Inc.
The survey showed that a daily schedule would be desirable, with an arrival at the destination by
8:00 a.m. and a departure time from the destination by 6:00 p.m. County government officials
noted they may be willing to spend up to $100 per seat to “guarantee” seats on the shuttle for
their local community and would expect users to pay anywhere from $51 to $150 per seat for this
service. An estimated user rate of over 20 individuals per day was also noted.
Host Community
Economic Development
According to the survey results, there is significant interest in the economic impact and
growth that airports have on local communities. The results indicate that seventy-one
percent (71%) of respondents perceive their local airport as a valuable economic asset.
Approximately eighty-three percent (83%) of respondents believe the local communities see
a present need for upgrades to the current aviation system in order to support economic
growth. If an airport no longer existed in their community, seventy-five percent (75%) of the
Oregon Aviation Plan 2007 Chapter 2
Oregon Department of Aviation (Final Document February 2008) 2-12
respondents stated that there would be a negative impact on the growth and development
associated with that community.
Airport Development
Currently, sixty-seven percent (67%) of the host communities believe that their airport has
land use protection measures in place, however, it was noted that incompatible land uses are
still a significant concern. Numerous host communities expressed a concern that the runway
length poses an operational limitation to their airports.
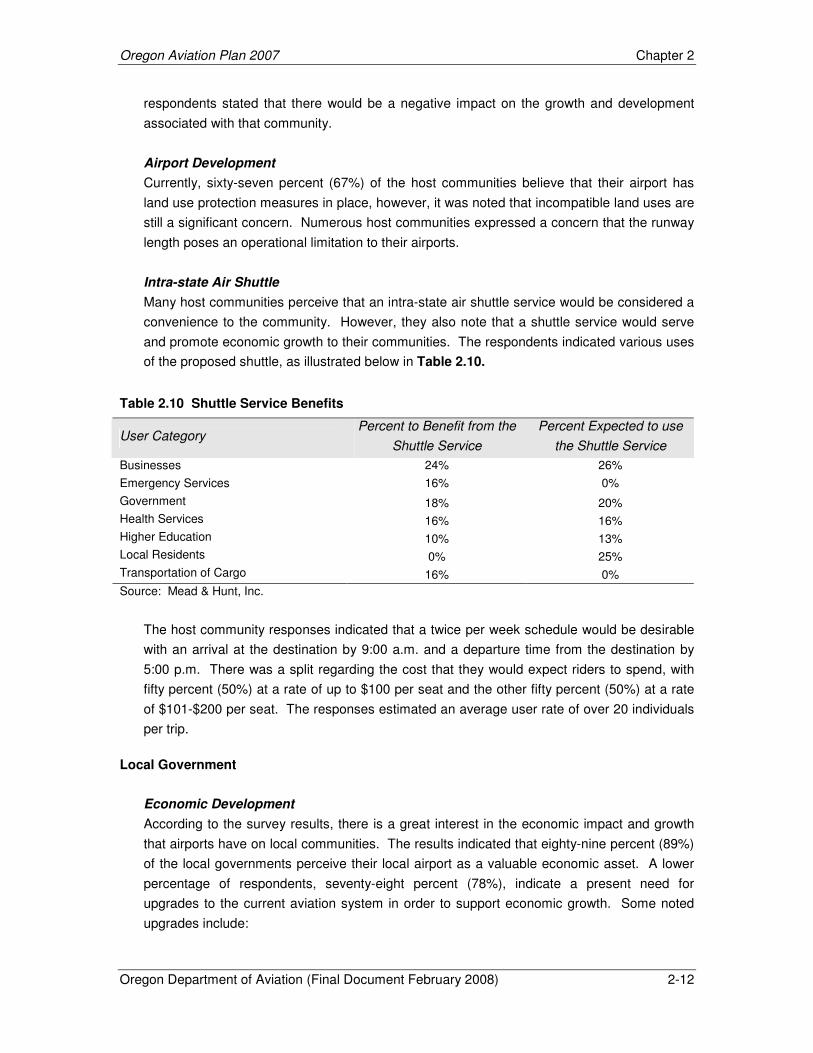
Intra-state Air Shuttle
Many host communities perceive that an intra-state air shuttle service would be considered a
convenience to the community. However, they also note that a shuttle service would serve
and promote economic growth to their communities. The respondents indicated various uses
of the proposed shuttle, as illustrated below in Table 2.10.
Table 2.10 Shuttle Service Benefits
User Category Percent to Benefit from the
Shuttle Service
Percent Expected to use
the Shuttle Service
Businesses 24% 26%
Emergency Services 16% 0%
Government 18% 20%
Health Services 16% 16%
Higher Education 10% 13%
Local Residents 0% 25%
Transportation of Cargo 16% 0%
Source: Mead & Hunt, Inc.
The host community responses indicated that a twice per week schedule would be desirable
with an arrival at the destination by 9:00 a.m. and a departure time from the destination by
5:00 p.m. There was a split regarding the cost that they would expect riders to spend, with
fifty percent (50%) at a rate of up to $100 per seat and the other fifty percent (50%) at a rate
of $101-$200 per seat. The responses estimated an average user rate of over 20 individuals
per trip.
Local Government
Economic Development
According to the survey results, there is a great interest in the economic impact and growth
that airports have on local communities. The results indicated that eighty-nine percent (89%)
of the local governments perceive their local airport as a valuable economic asset. A lower
percentage of respondents, seventy-eight percent (78%), indicate a present need for
upgrades to the current aviation system in order to support economic growth. Some noted
upgrades include:

Oregon Aviation Plan 2007 Chapter 2
Oregon Department of Aviation (Final Document February 2008) 2-13
• Additional runway length
• Commercial service and business operations
• Executive shuttles
• Additional taxiways
• Greater terminal amenities
The majority of respondents, eighty-one percent (81%), indicated that if an airport no longer
existed within a given community, that community would experience a negative impact on the
growth and development.
Airport Development
Currently, sixty-nine percent (69%) of local governments believe that their communities have
land use protection measures in place and forty-seven percent (47%) percent believe existing
or future issues pose a threat to future airport use. The issues include:
• Wetland regulations
• Incompatible land use
• Structure height
A few operational limitations and concerns were also expressed and include:
• Runway length – forty-four percent (44%) of respondents
• Navigational aids – twenty-eight percent (28%) of respondents
• Approach conditions, paved runways, taxiways, and aircraft parking – twenty-
two percent (22%) of respondents
• Terminal amenities – seventeen percent (17%) of respondents
Intra-state Air Shuttle
Many local governments perceive that an intra-state air shuttle service would be considered a
convenience to the community. However, they indicated that they believe many groups
would benefit from and would be expected to use this service if it were available, as
illustrated below in Table 2.11.

Oregon Aviation Plan 2007 Chapter 2
Oregon Department of Aviation (Final Document February 2008) 2-14
Table 2.11 Shuttle Service Benefits
User Category Percent to Benefit from the
Shuttle Service
Percent Expected to use
the Shuttle Service
Businesses 29% 29%
Emergency Services 14% 0%
Government 17% 20%
Health Services 17% 17%
Higher Education 9% 9%
Local Residents 0% 23%
Transportation of Cargo 14% 0%
Other 0% 2%
Source: Mead & Hunt, Inc.
The survey responses indicated that a twice per week schedule would be desirable with an
arrival at the destination by 10:00 a.m. and a departure time from the destination by 6:00 p.m.
There was a split regarding the cost that they would expect riders to spend. Fifty percent
(50%) of respondents indicate a rate of up to $100 per seat, while the other fifty percent
(50%) said $101-$200 per seat would be acceptable. They estimated an average user rate
of over 20 individuals per trip.
State Legislature
Economic Development
According to the survey results, there is a great amount of interest in the economic impact
and growth that airports have on local communities. The results indicated that one-hundred
percent (100%) of the respondents believed that their local airport is a valuable economic
asset. Seventy-four percent (74%) indicated a present need for upgrades to the current
aviation system to support economic growth. Seventy-one percent (71%) of these officials
indicate that airports promote growth in a community. A few of the needs identified as
essential to promote strong economic growth included:
• Commercial service
• Additional commercial service locations
• Runway length and navigational aids
If an airport were no longer available in a community, ninety-three percent (93%) noted there
would be a negative impact on the growth and development associated with that community.

Oregon Aviation Plan 2007 Chapter 2
Oregon Department of Aviation (Final Document February 2008) 2-15
Airport Development
Forty-three percent (43%) of the responding state officials believe their local airport has land
use protection measures in place and note that existing or future issues that pose a threat to
future airport use include:
• Adjacent terrain
• Incompatible land use
• Competition from out-of-state airports
• Population decrease
The operational limitations and concerns that were discussed include:
• Runway length – thirty-six percent (36%) of respondents
• Navigational aids – twenty-one percent (21%) of respondents
• Terminal amenities – fourteen percent (14%) of respondents
Intra-state Air Shuttle
Many of the government officials noted that an intra-state air shuttle service would be
considered a convenience to the local communities. Similar to the other surveys, various
segments are expected to benefit from a shuttle, should it be developed, as illustrated below
in Table 2.12.
Table 2.12 Shuttle Service Benefits
User Category Percent to Benefit from the
Shuttle Service
Percent Expected to use
the Shuttle Service
Businesses 32% 28%
Emergency Services 9% 0%
Government 25% 28%
Health Services 6% 9%
Higher Education 9% 9%
Local Residents 0% 26%
Transportation of Cargo 19% 0%
Source: Mead & Hunt, Inc.
The survey responses indicated that a twice per week schedule would be desirable, with an
arrival at the destination by 10:00 a.m. and a departure time from the destination by 6:00 p.m.
There was a split regarding the cost that they would expect riders to spend. Fifty percent
(50%) indicate a rate of up to $100 per seat, while the other fifty percent (50%) said $101-
$200 per seat would be acceptable. The estimated user rate of more than 20 individuals per
trip was indicated.

Oregon Aviation Plan 2007 Chapter 2
Oregon Department of Aviation (Final Document February 2008) 2-16
Pilot
Airside Needs
Evaluating the existing airside infrastructure within the state is an essential element of the
project. Pilots who utilize the existing system provided insight when identifying system
deficiencies. Overall, pilots who responded to the survey are generally satisfied with the
condition and availability of airside facilities, as summarized in the following paragraphs.
Runway Length
According to the survey results, ninety-eight percent (98%) of pilots who responded indicate
that the existing runway length at the airport they most frequently use meets the needs of
their aircraft. The runway length requirements for those pilots who completed the survey
include:
• Runway length of 0 to 1,500 feet from 132 respondents
• Runway length of 1,501 to 3,000 feet from162 respondents
• Runway length of 3,001 to 4,500 feet from 10 respondents
• Runway length greater then 4,501 feet from three respondents
Taxiways
The survey results illustrate that ninety-five percent (95%) of pilot respondents believe that
the existing taxiway system at the airport they most frequently use meets the needs of airport
users.
Navigational Aids
The survey results indicate that eighty-two percent (82%) of the respondents feel that the
existing navigational aids at the airport they most frequently utilize are adequate. Those
pilots who indicated that navigational aids did not meet the needs of airport users are
generally located in the coastal region where the weather is less predictable.
Landside Needs
The pilot survey explored several landside development categories, as summarized in the
following paragraphs.
Aircraft Parking/Spaces
The survey results illustrate that seventy-nine percent (79%) of pilot respondents are
generally satisfied with parking options, feel that the aircraft parking/spaces are adequate and
meet the needs of airport users.

Oregon Aviation Plan 2007 Chapter 2
Oregon Department of Aviation (Final Document February 2008) 2-17
Fuel
The survey results illustrate that eighty percent (80%) of respondents feel that the availability
of fuel is adequate and meets the needs of airport users.
Terminal
The survey results illustrate that sixty-five percent (65%) of pilot respondents feel that
terminal amenities are adequate and meet the needs of airport users.
FBO Services
The survey results illustrate that sixty-nine percent (69%) of respondents feel that the FBO
services are adequate and generally meet the needs of airport users.
Auto Parking/Access
Similar to the aircraft parking, eighty-six percent (86%) of pilot respondents indicate that the
FBO services are adequate and meet the needs of airport users.
Maintenance
Respondents to this survey indicate that the average cost of maintenance on their aircraft
was between $1,001 and $2,000 annually.
Hangar Rent
Pilot respondents indicate that the average cost for hangar rent for storage of their aircraft
was less than $500 annually.
Insurance
The respondents indicate that the average cost for insurance on their aircraft was between
$1,001 and $2,000 annually.
2.3 Oregon System of Airports
When airports are discussed, the general public typically thinks of large commercial service
airports. Such airports are normally the beginning of memorable vacations or important business
trips, or they provide residents with just-in-time delivery services, such as Federal Express,
United Parcel Service, or DHL. Oregon has a significant number of public and private use
airports that play a significant role in the transportation system and economy. Each airport,
regardless of size or ownership, serves a purpose and has a significant impact on the aviation
system.
The OAP 2007 includes 97 public-use airports that make up the system of Oregon airports. The
following provides a summary of these facilities, which are separated by ConnectOregon regions
and the state as a whole. ConnectOregon is a lottery-bond-based initiative approved by the
2005-2007 Oregon Legislative Assembly to invest in air, rail, marine, and transit infrastructure to
ensure Oregon’s transportation system is strong, diverse, and efficient. It is focused on improving

Oregon Aviation Plan 2007 Chapter 2
Oregon Department of Aviation (Final Document February 2008) 2-18
the connections between the highway system and other modes of transportation to better
integrate the components of the system, improve flow of commerce, and remove delays. The
state law makers have continued this program with ConnectOregon II. Projects throughout the
state are evaluated on criteria outlined within the law.
Figure 2.1 illustrates the OAP 2007 study airports and their relationship to ConnectOregon
regions. In addition to assessing the public-use airports by ConnectOregon regions, it is also
important to evaluate their roles by FAA classification and ownership.

Oregon Aviation Plan 2007 Chapter 2
Oregon Department of Aviation (Final Document February 2008) 2-19
Insert Figure 2.1

Oregon Aviation Plan 2007 Chapter 2
Oregon Department of Aviation (Final Document February 2008) 2-20
This Page Left Intentionally Blank

Oregon Aviation Plan 2007 Chapter 2
Oregon Department of Aviation (Final Document February 2008) 2-21
2.3.a National Plan of Integrated Airport System
The National Plan of Integrated Airport Systems (NPIAS) is a published national plan for the
development of public-use airports. It is produced by the FAA and is derived from a compilation
of local, regional, and state planning studies. The national system of airports is designed to
provide communities with access to safe and adequate airports. Only airports included in the
NPIAS are eligible for federal funding through a program called the Airport Improvement Program
(AIP). Inclusion in the NPIAS, along with the acceptance of funding from the FAA, requires that
an airport sponsor (owner of the airport) maintain their airport in a safe and effective manner for
the flying public.
The OAP 2007 includes 56 NPIAS airports and 41 non-NPIAS airports. Figure 2.2 illustrates the
study airports within each ConnectOregon region by NPIAS classification. Table 2.13
summarizes the breakdown of NPIAS classification throughout the state.
Table 2.13 OAP 2007 and ConnectOregon Public-Use Airports
Study Airports NPAIS Non-NPAIS Total Number of Public-
Use Airports
OAP 2007 57 40 97
ConnectOregon
Region 1 8 9 17
Region 2 16 10 26
Region 3 10 7 17
Region 4 12 8 20
Region 5 11 6 17
Source: Mead & Hunt, Inc.
2.3.b Ownership
Public-use airports can be owned and operated by a diverse range of entities and it is not
required that they be owned by a single body. In Oregon, there are six categories of airport
owners, which include:
• Airport authorities (government entity)
• County and/or city governments
• Federal entity
• Port authorities (government entity)
• Private entity
• State entity
Figure 2.3 graphically illustrates the OAP 2007 and ConnectOregon study airports ownership
type and Table 2.14 provides a numerical breakdown of ownership type.

Oregon Aviation Plan 2007 Chapter 2
Oregon Department of Aviation (Final Document February 2008) 2-22
Table 2.14 OAP 2007 and ConnectOregon Public-Use Airports by Ownership Type
Ownership OAP
2007
Region 1 Connect Oregon
Region 2 Connect Oregon
Region 3 Connect Oregon
Region 4 Connect Oregon
Region 5 Connect Oregon
Airport Authority 1 0 0 1 0 0
Joint City – County 2 0 0 0 2 0
Federally Owned 2 0 0 0 1 1
Port Authority Owned 5 4 0 0 0 1
County 5 0 0 2 1 2
Privately Owned 15 6 4 1 4 0
State Owned 27 1 12 5 5 4
City Owned 40 4 11 8 8 9
Total Airports 97 15 27 17 21 17
Source: Mead & Hunt, Inc.

Oregon Aviation Plan 2007 Chapter 2
Oregon Department of Aviation (Final Document February 2008) 2-23
Insert Figure 2.2

Oregon Aviation Plan 2007 Chapter 2
Oregon Department of Aviation (Final Document February 2008) 2-24
This Page Left Intentionally Blank

Oregon Aviation Plan 2007 Chapter 2
Oregon Department of Aviation (Final Document February 2008) 2-25
Insert Figure 2.3

Oregon Aviation Plan 2007 Chapter 2
Oregon Department of Aviation (Final Document February 2008) 2-26
This Page Left Intentionally Blank

Oregon Aviation Plan 2007 Chapter 2
Oregon Department of Aviation (Final Document February 2008) 2-27
2.3.c Airside Facilities
The airside facilities of an airport consist of many components that are required to accommodate
safe aircraft operations and include:
• Runways
• Taxiways
• Apron network
• Visual and electronic navigational aids associated with runways
• Other general aviation facilities
Tables 2.15 through Table 2.18 provide a comprehensive inventory of airside facilities for the
OAP 2007 study airports.
2.3.d Landside Facilities
Landside facilities are considered to be all facilities at an airport which do not fall into the airside
facilities category as previously discussed and typically include:
• Airport terminal buildings
• Aircraft storage facilities
• Automobile parking
• Other general facilities
Table 2.15 through Table 2.18 display the facilities provided throughout system of airports in Oregon.

Oregon Aviation Plan 2007 Chapter 2
Oregon Department of Aviation (Final Document February 2008) 2-28
This Page Left Intentionally Blank

Oregon Aviation Plan 2007 Chapter 2
Oregon Department of Aviation (Final Document February 2008) 2-29
Insert Tables 2.15

Oregon Aviation Plan 2007 Chapter 2
Oregon Department of Aviation (Final Document February 2008) 2-30
This Page Left Intentionally Blank

Oregon Aviation Plan 2007 Chapter 2
Oregon Department of Aviation (Final Document February 2008) 2-31
Insert Tables 2.15 (page 2)

Oregon Aviation Plan 2007 Chapter 2
Oregon Department of Aviation (Final Document February 2008) 2-32
This Page Left Intentionally Blank

Oregon Aviation Plan 2007 Chapter 2
Oregon Department of Aviation (Final Document February 2008) 2-33
Insert Tables 2.15 (page 3)

Oregon Aviation Plan 2007 Chapter 2
Oregon Department of Aviation (Final Document February 2008) 2-34
This Page Left Intentionally Blank

Oregon Aviation Plan 2007 Chapter 2
Oregon Department of Aviation (Final Document February 2008) 2-35
Insert Tables 2.16

Oregon Aviation Plan 2007 Chapter 2
Oregon Department of Aviation (Final Document February 2008) 2-36
This Page Left Intentionally Blank

Oregon Aviation Plan 2007 Chapter 2
Oregon Department of Aviation (Final Document February 2008) 2-37
Insert Tables 2.16 (page 2)

Oregon Aviation Plan 2007 Chapter 2
Oregon Department of Aviation (Final Document February 2008) 2-38
This Page Left Intentionally Blank

Oregon Aviation Plan 2007 Chapter 2
Oregon Department of Aviation (Final Document February 2008) 2-39
Insert Tables 2.16 (page 3)

Oregon Aviation Plan 2007 Chapter 2
Oregon Department of Aviation (Final Document February 2008) 2-40
This Page Left Intentionally Blank

Oregon Aviation Plan 2007 Chapter 2
Oregon Department of Aviation (Final Document February 2008) 2-41
Insert Tables 2.17

Oregon Aviation Plan 2007 Chapter 2
Oregon Department of Aviation (Final Document February 2008) 2-42
This Page Left Intentionally Blank

Oregon Aviation Plan 2007 Chapter 2
Oregon Department of Aviation (Final Document February 2008) 2-43
Insert Tables 2.17 (Page 2)

Oregon Aviation Plan 2007 Chapter 2
Oregon Department of Aviation (Final Document February 2008) 2-44
This Page Left Intentionally Blank

Oregon Aviation Plan 2007 Chapter 2
Oregon Department of Aviation (Final Document February 2008) 2-45
Insert Tables 2.17 (page 3)

Oregon Aviation Plan 2007 Chapter 2
Oregon Department of Aviation (Final Document February 2008) 2-46
This Page Left Intentionally Blank

Oregon Aviation Plan 2007 Chapter 2
Oregon Department of Aviation (Final Document February 2008) 2-47
Insert Tables 2.18

Oregon Aviation Plan 2007 Chapter 2
Oregon Department of Aviation (Final Document February 2008) 2-48
This Page Left Intentionally Blank

Oregon Aviation Plan 2007 Chapter 2
Oregon Department of Aviation (Final Document February 2008) 2-49
Insert Tables 2.18 (page 2)

Oregon Aviation Plan 2007 Chapter 2
Oregon Department of Aviation (Final Document February 2008) 2-50
This Page Left Intentionally Blank

Oregon Aviation Plan 2007 Chapter 2
Oregon Department of Aviation (Final Document February 2008) 2-51
Insert Tables 2.18 (page 3)
Oregon Aviation Plan 2007 Chapter 2
Oregon Department of Aviation (Final Document February 2008) 2-52
This Page Left Intentionally Blank