chapter 2 groundwater contamination and its impacts
TRANSCRIPT

Chapter 2
Groundwater Contaminationand Its Impacts

Contents
PageChapter Overview. . . . . . . . . . . . . . . . . . . . . . . . . . . . . . . . . . . . . . . . . . . . . . . . . . . . . . . 19
Extent and Nature of Groundwater Contamination . . . . . . . . . . . . . . . . . . . . . . . . . . . . 20Assessing the Nationwide Extent of Groundwater (contamination . . . . . . . . . . . . . . . . . . . . 20Substances Known to Occur in Groundwater . . . . . . . . . . . . . . . . . . . . . . . . . . . . . . . . . . . . . 22
Health Impacts . . . . . . . . . . . . . . . . . . . . . . . . . . . . . . . . . . . . . . . . . . . . . . . . . . . . . . . . . . 23General Issues. ...... . . . . . . . . . . . . . . . . . . . . . . . . . . . . . . . . . . . . . . . . . . . . . . . . . . . . . 23Adverse Impacts of Chemicals . . . . . . . . . . . . . . . . . . . . . . . . . . . . . . . . . . . . . . . . . . . . . . . . . . . 32Potential Toxicity or Potency of Chemicals . . . . . . . . . . . . . . . . . . . . . . . . . . . . . . . . . . . . . . . 33Interactions Among Multiple Chemicals, . . . . . . . . . . . . . . . . . . . . . . . . . . . . . . . . . . . . . . . . . 34Biological Substances . . . . . . . . . . . . . . . . . . . . . . . . . . . . . . . . . . . . . . . . . . . . . . . . . . . . . . . . . . 34Radioactive Substances . . . . . . . . . . . . . . . . . . . . . . . . . . . . . . . . . . . . . . . . . . . . . . . . . . . . . . . . 35
Non-Health Impacts . . . . . . . . . . . . . . . . . . . . . . . . . . . . . . . . . . . . . . . . . . . . ... . . . ... 36Economic Impacts . . . . . . . . . . . . . . . . . . . . . . . . . . . . . . . . . . . . . . . . . . . . . . . . . . . . . . . . . . . . . 36Environmental and Social Impacts . . . . . . . . . . . . . . . . . . . . . . . . . . . . . . . . . . . . . . . . . . . . . . . 38
Concentration and Frequency of Substances Found in roundwater . . . . . . . . . . . . . . 38Concentration of Substances in Groundwater . . . . . . . . . . . . . . . . . . . . . . . . . . . . . . . . . . . . . . 38Frequency of Occurrence of Substances in Groundwater . . . . . . . . . . . . . . . . . . . . . . . . . . . . . 40Concentration and Frequency Data in Relation to Governmental Standards . . . . . . . . . . . . 41
Potential But as Yet Undetected Substances in Groundwater . . . . . . . . . . . . . . . . . . . . 43
Types of Sources and Associated Substances . . . . . . . . . . . . . . . . . . . . . . . . . . . . . . . . . . 43Types of Sources . . . . . . . . . . . . . . . . . . . . . . . . . . . . . . . . . . . . . . . . . . . . . . . . . . . . . . . . . . . . . . 43Association o! Substances Found in Groundwater With Sources . . . . . . . . . . . . . . . . . . . . . . 44
Factors lnfluencing a Source’s Potential To Contaminate Groundwater . . . . . . . . . . . 47Release Characteristics . . . . . . . . . . . . . . . . . . . . . . . . . . . . . . . . . . . . . . . . . . . . . . . . . . . . . . . . . 47Geographic Location: Pervasiveness and Regionality . . . . . . . . . . . . . . . . . . . . . . . . . . . . . . . . 49Numbers of Sources and Amounts of Material Flowing Through or Stored in Sources . . . 51
Potential for Sources To Contribute Substances to Groundwater . . . . . . . . . . . . . . . . . 55Modeling the Potential of Sources To Contaminate Groundwater . . . . . . . . . . . . . . . . . . . . . 55Identifying Sources With “Significant” Potential To Contribute Substances
to Groundwater . . . . . . . . . . . . . . . . . . . . . . . . . . . . . . . . . . . . . . . . . . . . . . . . . . . . . . . . . . . . . 55
Chapter 2 References . . . . . . . . . . . . . . . . . . . . . . . . . . . . . . . . . . . . . . . . . . . . . . . . . . . . . 58
TABLESTabIe No. Page1. Substances Known to Occur in Groundwater, Ranges of Detected Concentrations,
Exceeded Standards, Examples of Uses, and Quantitative Estimates ofCarcinogenic Potency and Noncarcinogenic Toxicity . . . . . . . . . . . . . . . . . . . . . . . . . . . . . 24
2. Examples of Economic, Environmental, and Social Impacts Resulting FromGroundwater Contamination . . . . . . . . . . . . . . . . . . . . . . . . . . . . . . . . . . . . . . . . . . . . . . . . . . 37
3. Examples of Economic Costs Resulting From Contaminated Groundwater . . . . . . . . . . . 394. Potential Groundwater Contaminants Displaying Serious Adverse Health Effects . . . . . 445. Sources of Groundwater Contamination . . . . . . . . . . . . . . . . . . . . . . . . . . . . . . . . . . . . . . . . 456. Sources and Classes of Associated Substances. . . . . . . . . . . . . . . . . . . . . . . . . . . . . . . . . . . . 487. Summary of Source Characteristics . . . . . . . . . . . . . . . . . . . . . . . . . . . . . . . . . . . . . . . . . . . . 508. Numbers of Sources and Amounts of Material Flowing Through or
Stored in Sources, . . . . . . . . . . . . . . . . . . . . . . . . . . . . . . . . . . . . . . . . . . . . . . . . . . . . . . . . . . . 529. “Important” Sources of Groundwater Contamination
Based on Selected Sets of Criteria . . . . . . . . . . . . . . . . . . . . . . . . . . . . . . . . . . . . . . . . . . . . . 57

Chapter 2
Groundwater Contamination and Its Impacts
CHAPTER OVERVIEW
Groundwater is an increasingly important re-source in the United States—it is relied on for about50 percent of drinking water supplies; it is used tosupply water for almost 80 percent of rural domesticand livestock needs, about 40 percent of irrigationneeds, many commercial activities, and almost 25percent of self-supplied industrial needs (other thanthermoelectric power); it is used for stream flowmaintenance and as a barrier to salt-water intru-sion; and it is both an intentional and unintentionaldepository for society’s waste and non-waste prod-ucts (USGS, 1983a).
The degree of reliance on groundwater varies sig-nificantly around the Nation. For example, ground-water withdrawals for public water supplies varyfrom 11 percent in the Great Lakes region to 75percent in the Rio Grande region, for rural usesfrom 12 percent in the Upper Colorado to 100 per-cent in New England, and for irrigation from 1 per-cent in the Upper Colorado to over 90 percent inthe Upper Mississippi.
Contamination of the Nation’s groundwater re-source has recently become an issue of widespreadpublic concern. This chapter analyzes currentknowledge about the nationwide extent of con-tamination, the substances known to occur ingroundwater and their associated impacts, andknown sources of contamination. Specific topicsaddressed are:
● the extent of groundwater contamination anddifficulties in its assessment;
● substances known to occur in groundwater andtheir uses;
● health impacts of contamination;. non-health impacts of contamination (e. g.,
economic and environmental impacts);
1 Substance is defined in this study as any organic or inorganic chem-ical, micro-organism, radionuclide, or other material (e. g., sediments).Whether or not a substance is a ‘ ‘contaminant’ depends on its asso-ciation with adverse impacts and on other site-specific factors (e. g,,hydrogeology).
●
●
●
●
●
concentration and frequency of compounds ingroundwater;potential but as yet undetected substances ingroundwater;types of sources and their associated sub-stances;factors influencing a source’s potential to con-taminate groundwater (including estimates ofnumbers of sources and amounts of materialflowing through or stored in sources); andthe potential for sources to contaminategroundwater.
Major conclusions drawn from this information aresummarized below.
The portion of the Nation’s groundwater re-sources that is contaminated is believed by expertsto be small. No matter how small, this portion isnevertheless significant because of its location nearheavily populated areas and because of the manyuses of and increasing dependence on groundwater.The site-to-site variability of contamination, com-bined with the expense and time required to inves-tigate potential contamination problems, meansthat a detailed nationwide description of ground-water quality may never be attainable.
A variety of adverse impacts due to groundwatercontamination is possible—including effects onpublic health, the environment, agricultural pro-ductivity (e. g., due to increased salinity in irriga-tion water), and on the output of industries requir-ing high-quality water. Public attention has focusedprimarily on the potential for health effects; becauselittle information is available on other impacts, thischapter focuses on potential damage to humanhealth.
Even if a comprehensive description of ground-water quality were available, the magnitude andexact nature of public health effects resulting fromcontamination could not be estimated with confi-dence. At best, evidence would involve the docu-mentation of effects attributable to contamination,
19

20 • Protecting the Nation’s Groundwater From Contamination
with predictions regarding the magnitude and typesof future effects. This type of information is typ-ically obtained from risk assessment analyses,wherein data on: 1 ) the adverse effects and 2) tox-icity (i. e., dosage levels at which adverse effects areobserved) of substances are linked with 3) exposuredata to identify probabilities of adverse impacts onhuman health.
Data limitations preclude a risk assessment of themagnitude of public health risks from groundwater.Some of the data required for risk assessment analy-sis of groundwater contamination are available, pri-marily regarding known or possible hazards andknown toxicities, but much of this information isnot precise enough. Almost no data are availableon human exposure to the substances of concern.These types of data are not likely to be obtainablein sufficient detail in most cases because of the in-herent limitations of epidemiological investigations.For example, data would be needed—and, again,are probably unattainable—on the amount of ex-posure to substances from only groundwater (e. g.,as opposed to exposure to the same substances fromother media such as air and surface water), on thenumber of people exposed to various concentra-tions, and on interactions among substances whenmore than one substance is present.
Although the magnitude of the impacts of ground-water contamination cannot be estimated with con-fidence, the nature of many impacts is known.There is also a substantial body of indirect evidenceindicating the large potential for groundwater con-tamination and subsequent health effects. Over 200substances have already been detected in ground-water—substances that are used throughout society
in a multiplicity of commercial, industrial, andhousehold activities. For some, but not all, of theseknown substances, information is available abouttheir adverse effects on laboratory animals andhumans, toxicity levels, and the range of concen-trations found in groundwater. Many of the sub-stances present in groundwater can cause liver andkidney damage, damage to the central nervous sys-tem, cancers, and eye and skin irritation.
The pathways by which substances eventually en-ter groundwater are diverse and extremely com-plex—i.e., they can enter during production, han-dling, storage, processing, disposal, transport, anduse. One focal point along these pathways, whichCongress has started to address in recent legisla-tion, is the sources from which contaminants en-ter groundwater. Sources of contamination are con-venient for assessing possible detection, correction,and prevention actions. At least 33 major sourcesare known. There is a vast diversity among sourcesin terms of their associated substances, releasecharacteristics, amounts of materials, geographiclocation, and role in society.
So far, most attention given to sources has con-cerned waste discharges (particularly hazardouswastes) from point sources. As shown by OTA’Sanalysis, many potential sources of contaminationalso are associated with both non-hazardous wastesand non-waste products; and contaminants can en-ter groundwater from both point and non-pointsources. Important advances have been made inthe information base concerning sources since theU.S. Environmental Protection Agency’s 1977 Re-port to Congress on waste disposal practices (EPA,1977),
EXTENT AND NATURE OFGROUNDWATER CONTAMINATION
Assessing the Nationwide Extent of and the Safe Drinking Water Act—groundwaterGroundwater Contamination contamination has historically received little atten-
tion at the national level. One major reason wasAlthough contamination of surface water has the common belief that groundwater was pristine,
long been of concern to the public and to Con- i.e., that potential contaminants percolating throughgress—as demonstrated by passage of the Federal the subsurface would adhere to the soil or be de-Water Pollution Control Act (the Clean Water Act) graded by natural processes and, therefore, would

Ch. 2—Groundwater Contamination and Its Impacts ● 2 1
} Unsaturated zone
Unconfined aquifer (fresh groundwater)
Confined aquifer(fresh groundwater)
Confined aquifer(brackish groundwater)
Credit: Geraghty & Miller, 1983
Pathways of groundwater contamination vary depending on the source. Examples of sources are shown here for eachof OTA’S six source categories (I-VI) (see the section on Types of Sources and Associated Substances, below).
not enter or greatly affect groundwater quality.Thus the subsurface, and groundwater, had beenregarded as a safe and convenient depository forthe wastes and non-waste byproducts generated bysociety.
But there is a growing consensus that the qualityof groundwater is in decline. Incidents of contami-nation are being reported with increasing frequencyand have now occurred in every State. Althoughthe activities and practices that cause contamina-tion are varied and were often begun many yearsago, groundwater contamination recently has cometo the attention of the public, primarily in the con-text of threats to human health. Most of the atten-tion has focused on sources associated with hazard-ous wastes (e. g., landfills, surface impoundments,and waste piles) because of the severity of their im-pacts on surrounding populations and environ-ments—groundwater has been seriously contami-nated by toxic chemicals associated with thesesources in at least 34 States (CEQ 1981). How-ever, non-hazardous wastes and non-wastes alsocontribute to the contamination of groundwater.
A small amount of the Nation’s groundwater isgenerally believed to be contaminated (estimatesrange from about 1-2 percent). Although this por-tion may seem very small, it is significant because
contamination is often near heavily populated areasand groundwater is being increasingly relied on fora variety of uses.
The extent of groundwater contamination is alsolikely to be greater than 1-2 percent. Descriptionsof groundwater quality problems often includeanecdotal or non-comparable data, making themdifficult to interpret and analyze. In addition, muchof the current information on the extent and mag-nitude of contamination reflects only the nature ofinvestigations —where and which substances havebeen looked for and where they have been found.For example, groundwater that is not used for pub-lic drinking water supplies is not always tested, andmore information is generally available about haz-ardous waste sources than about non-point sourcesand sources with non-hazardous wastes and non-waste products. Further, substances known to con-taminate groundwater are used throughout society;thus, more widespread detection of contaminationcan be expected as efforts increase to monitorknown, as yet undetected, and potential problems.Little is known about how much contamination isreversible and how rapidly new sites and sourcesof contamination are being created.
A complete description of contamination wouldrequire detailed information about groundwater

“ ” ” ” ” ” ” ” - – – - - ,
Thirty-four of the 100 largest cities in the United
quality on a site-by-site basis throughout the Na-tion and about associated site-specific hydrogeologicconditions (e. g., the vulnerability of groundwaterto the entrance of substances). A difficulty in assess-ing the extent of groundwater contamination is thatnot all substances entering groundwater may haveadverse impacts. Whether the presence of sub-stances in groundwater results in a contaminationproblem depends on site-specific hydrogeology, thepotential for adverse impacts (health, economic,environmental, and social), current and futuregroundwater use patterns, the exposure of humansto the substances, the availability of alternativewater supplies, and the feasibility of correctivemeasures including management alternatives.
The lack of data about groundwater quality stemsfrom the technical complexity of groundwater.Groundwater and associated problems often can-not be directly observed and are not easily meas-
Photo credit: State of Florida Department of Environmental Regulation
States rely completely or partially on groundwater.
ured, and the behavior of substances in ground-water is not well understood—the movement ofsubstances varies temporally and spatially in dif-ferent hydrogeologic environments, and chemicaland biological processes can alter the nature andsubsequent behavior of substances. For these rea-sons, groundwater contamination problems arehighly site-specific. Given this complexity and thecosts and time that would be needed to gather data,a complete description of groundwater quality maynever, for all practical purposes, be attainable.
Substances Known to Occurin Groundwater
As part of the OTA study, information wasgathered that documents the presence of over 200substances known to occur in the Nation’s ground-water. Specific substances detected in groundwater

Ch. 2—Groundwater Contamination and Its Impacts ● 2 3
thus far, and examples of major uses of these sub-stances, are shown in table 1. These substances in-clude about 175 organic chemicals, over 50 inor-ganic chemicals (metals, non-metals, and inorganicacids), biological organisms, and radionuclides.
The presence of substances in groundwater andan understanding of how, why, and where they arepresent are directly related to their use and/ordisposition. As shown in table 1, many substancesfound in groundwater are widely used by indus-try, agriculture, commerce, and households. Po-tential contaminants can thus enter groundwaterat numerous points as materials flow through so-ciety. Although most points-of-entry are associatedwith particular sources, the sources themselves arenot the only places for controlling the entry ofsubstances to groundwater (preventive strategies arediscussed in chs. 11 and 12). However, focusingon sources is convenient to, assess how substancesenter groundwater. The relationship between sub-stances and specific sources is discussed below inTypes of Sources and Associated Substances.
HEALTH
General Issues
Many naturally occurring and synthetic sub-stances can cause biological injury, disease, or deathunder certain conditions of exposure. Whether in-jury or illness occurs depends on many factors, in-cluding properties of the substance, dosage of andexposure to the substance, and characteristics of theindividuals exposed. Many of the diseases and ef-fects associated with groundwater contaminants arediscussed below; however, data are insufficient fordetermining the relative importance of these con-taminants in causing various effects.
Relationships between health impacts and dif-ferent groups of substances-organic and inorganicchemicals (non-radioactive), micro-organisms, andradionuclides— are not understood with the samedegree of knowledge and certainty. For example,there is a long history of public health efforts to un-
Detection of substances in groundwater is biasednot only by sampling and analytical limitations (seech. 5) but also by the circumstances that prompteddetection and reporting. There appear to be twomajor circumstances under which substances arebeing detected in groundwater: 1) as the result ofplanned activities (e. g., regulatory compliance,analysis and data management activities, routinemonitoring, research, and liability protection); and2) in response to apparent impacts (e. g., citizencomplaints stemming from the observable or fearedpresence of substances, accidents, and aerial pho-tography) (University of Oklahoma, 1983). Thetwo most frequently cited reasons for detection ofsubstances are regulatory compliance as a plannedactivity and response to public complaints. Relianceon public observation probably will not lead to thedetection of many substances—most substancesof concern are odorless, colorless, andunobservable without use of specialequipment.
IMPACTS
derstand and address micro-organisms,. . .
otherwiseanalytical
albeit pri-marily in surface water, and many sources of dataare available. Radionuclides have been studied ex-tensively since the 1940s, and much is now knownabout their health impacts, although not often atlow concentrations. In contrast, health effectsresulting from exposure to many chemicals are notwell understood, in large part because of the rela-tively recent occurrence of and exposure to certainchemicals in the environment. Health effects ofchemicals are of the greatest concern because chem-icals are pervasive and persist in the environment.
Assessing risks from substances in groundwaterrequires information about adverse effects, toxicity,and exposure (extensive details on risk assessmentare available in NAS, 1983, and Environ Corp. ,1983; a brief summary is presented in app. A. 1.);and available data are often insufficient to conductsuch an assessment. Thus human health impair-

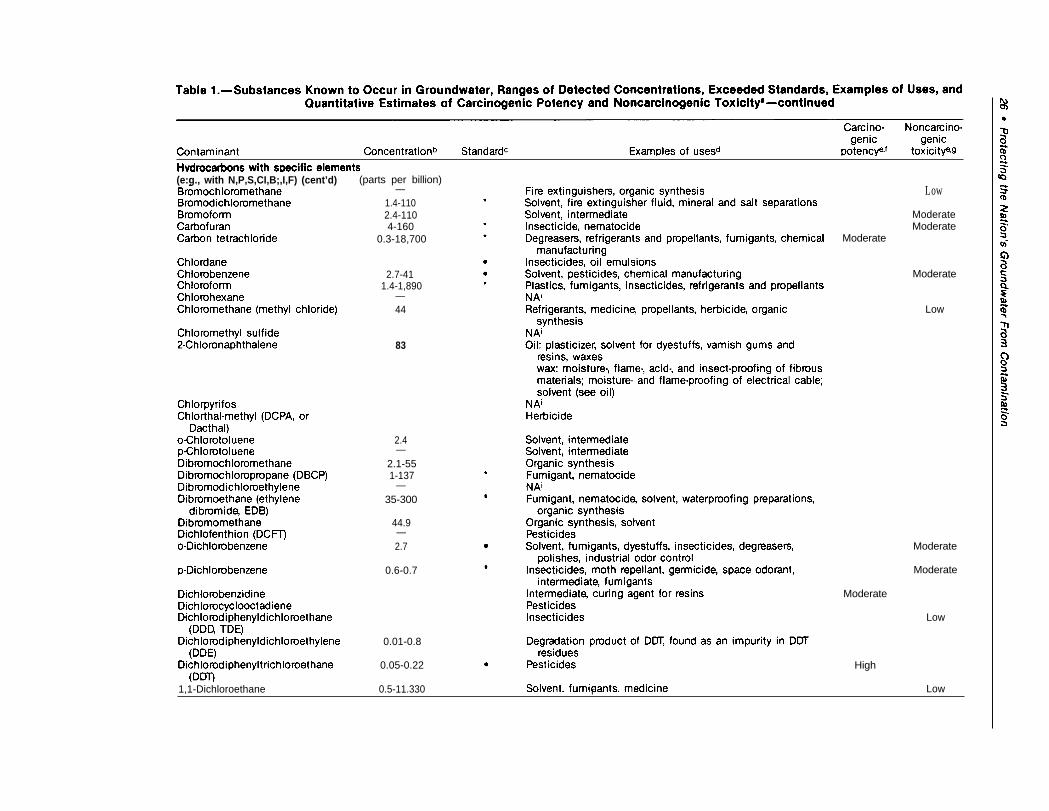
Table 1 .—Substances Known to Occur in Groundwater, Ranges of Detected Concentrations, Exceeded Standards, Examples of Uses, andQuantitative Estimates of Carcinogenic Potency and Noncarcinogenic Toxicitya
Carcino- Noncarcino-
Contaminant Concentration b
genie genieStandardC Examples of usesd potency e,f toxicititye,g
Aromatic hydrocarbons. , . . . . .
Acetanilide-A!kyl benzene sulfonatesAniline
AnthraceneBenzeneBenzidineBenzyl alcohol
ButoxymethylbenzeneChryseneCreosote mixtureDiben[a.h.]anthraceneDi-butyl-p-benzoquinoneDihydrotrimethylquinoline4,4-DinitrosodiphenylamineEthyl benzeneFluorantheneFluoreneFluoresceinIsopropyl benzene4,4’-Methylene-bis-2-chloroaniline
(MOCA)MethylthiobenzothiazoleNaphthalene
o-Nitroaniline
Nitrobenzene4-Nitrophenoln-NitrosodiphenylaminePhenanthrenen-PropylbenzenePyreneStyrene (vinyl benzene)Toluene
1,2,4-Trimethylbenzene
Xylenes (m,o,p)
(parts per billion)—
1 8h
0.6-20,230
10
0.9-4,00031
290
6.7-82
18-471h
48
0.1-6,400
0.07-300
Oxygenated hydrocarbonsAcetic acid
photographic chemicals, insecticides
LowHigh
Low
Low
Low
Moderate
LowLow
Low
Low
●

Table 1 .—Substances Known to Occur in Groundwater, Ranges of Detected Concentrations, Exceeded Standards, Examples of Uses, andQuantitative Estimates of Carcinogenic Potency and Noncarcinogenic Toxicitya—continued
oOxygenated hydrocarbons (cent’d) (parts per billion)
IAcetone 1O-3,OOO Dyestuffs, solvent, chemical manufacturing, cleaning and
drying of precision equipmentOrganic synthesis, odor fixative, flavoring, pharmaceuticalsSolventPlastics, intermediatePlasticizer, solvent, adhesives, insecticides, safety glass,
inks, paper coatingsChemical manufacturing, solvent, analytical chemistry,
anesthetic, perfumesPlastics, explosives, solvent, insecticides, perfumesSolvent, rubber cements, paint and varnish removersIntermediate, solvent, lubricantPharmaceuticals, plastics, disinfectants, solvent, dyestuffs,
insecticides, fungicides, additives to lubricants andgasolines
Plasticizer for polyvinyl chloride and other vinylsSolvent, lacquers, paints, varnishes, cleaning and detergent
preparations, fumigants, paint and varnish removers,wetting agent, cosmetics
Polymers, acrylic paints, intermediateDyeing and finishing, chemicals, manufacture of fumigants,
insecticides, solvents, plastics, refrigerantsChemical manufacturing, solvents, automotive antifreeze, fuelsSolvent, lacquersSolvent, paint removers, cements and adhesives, cleaning
fluids, printing, acrylic coatingsNal
Resins, solvent, pharmaceuticals, reagent, dyestuffs andindicators, germicidal paints
Dyestuffs, medicine, perfumes, reagentChemical manufacturing, solvent, deicing agent, pharmaceu-
ticals, perfumes, lacquers, dehydrating agent, preservativesSolventSolventPaint and varnish thinner
Low
Low
Low
BenzophenoneButyl acetaten-Butyl-benzylphthalateDi-n-butyl phthalate
I
10-38470
●
●
wDiethyl ether
Diethyl phthalateDiisopropyl ether2,4-Dimethyl-3-hexanol2,4-Dimethyl phenol
20-34
Di-n-octyl phthalate1,4-Dioxane
Ethyl acrylateFormic acid
Methanol (methyl alcohol)MethylcyclohexanoneMethyl ethyl ketone
High
Methylphenyl acetamidePhenols (e.g., p-Tert-butylphenol) 1O-234,OOO ●
Phthalic acid2-Propanol
2-Propyl-1-heptanolTetrahydrofuranVarsol
Hydrocarbons with specific elements(e.g., with N, P,S,Cl,Br,l,F)Acetyl chlorideAlachlor (Lasso)Aldicarb (sulfoxide and sulfone;
Temik)AldrinAtrazineBenzoyl chlorideBromacilBromobenzene
Dyestuffs, pharmaceuticals, organic preparations● Herbicides● Insecticide, nematocide
190-1,70038-405
ModerateHigh
HighModerate
ModerateModerate
● Insecticides● Herbicides, plant growth regulator, weed control agent
Medicine, intermediate* Herbicides
Solvent, motor oils, organic synthesis72-1101.9-5.8
(e:g., with N,P,S,CI,B;,I,F) (cent’d) (parts per billion)—
1.4-1102.4-1104-160
0.3-18,700
2.7-411.4-1,890
—44
83
2.4—
2.1-551-137
—35-300
44.9—2.7
0.6-0.7
0.01-0.8
0.05-0.22
0.5-11.330
●
●
●
Low
ModerateModerate
Moderate
Moderate
Low
Moderate
Moderate
Moderate
Low
High
Low1,1-Dichloroethane r

Ch. 2—Groundwater Contamination and Its Impacts ● 2 7
cl o ).- .-1 1
. -x
l
5-E%—
)—
* ● ☛ ● ● ● * * ● ● 0
E-0.-—
oo
o0 II I I I
n—
II
I-.

Hexachloroethane
Trichlomethanes (1,1,1 and 1,1,2)1,1,2-Trichloroethylene (TCE)
(parts per billion)6
3.8
0.5-43
4.6
7.44.6——
8-40—
3,400
5,–m4
717-2,405
1-5702
37
0.2-26,000210-37,000
26——
● Insecticides
● Insecticides
● Insecticides
●
●
●
●
●
●
●
Intermediate for resins, dyestuffs, pesticides, fungicides,pharmaceuticals
Solvent, pyrotechnics and smoke devices, explosives,organic synthesisN Ai
PesticidesInsecticidesInsecticidesFumigants, pesticides, organic synthesisInsecticidesInsecticidesInsecticides, fungicides, bactericide, algicides, herbicides,
wood preservativeInsecticides
●
•●
●
Flame retardant for plastics, paper, and textilesHeat-exchange and insulating fluids in closed systemsHerbicidesExplosivesHerbicidesN Ai
Degreasers, paint removers, varnishes, lacquers, photo-graphic film, organic synthesis, solvent, insecticides,fumigants, weed killer
Degreasers, drycleaning, solvent, drying agent, chemicalmanufacturing, heat-transfer medium, vermifuge
InsecticidesHerbicidesSolvent, dyestuffs, insecticides, lubricants, heat-transfer
medium (e.g., coolant)Pesticides, degreasers, solventDegreasers, paints, drycleaning, dyestuffs, textiles, solvent,
refrigerant and heat exchange liquid, fumigant, inter-mediate aerospace operations
Solvent, refrigerants, fire extinguishers, intermediateFungicides, herbicides, defoliant
● Herbicides, defoliant
Low
LowModerate
Moderate
Moderate
Low
Moderate
LowLow
Moderate
High
Moderate
HighModerate
ModerateLow
Moderate

Ch. 2—Groundwater Contamination and Its Impacts ● 2 9
)
● ● * ● * * ● ☛ *
I I I
t-0-

Metals and cations (cent’d)Chromium
Cobalt
Copper
IronLead
LithiumMagnesium
ManganeseMercury
MolybdenumNickelPalladium
PotassiumSeleniumSilver
Sodium
ThalliumTitaniumVanadium
Zinc
Nonmetals and anionsAmmonia
BoronChlorides
Cyanides
FluoridesNitratesNitritesPhosphatesSulfatesSulfites
(parts per million)0.06-2,740
0.01-0.18
0.01-2.8
0.04-6.2000.01-5.6
—0.2-70
0.1-1100.003-0.0”
0.4-400.05-0.5
—
0.5-2.40.6-209-330
3.1-211
——
243
0.1-240
1-900
—1,0-49,500
1.05-14
0.1-2501.4-433
0.4:330.2-32,318
—
●
●
☛
●
●
●
●
●
●
●
●
●
●
☛
●
●
●
●
●
●
●
●
●
Alloys, electroplating, electronics, automotive parts, fungi-cides, roofing, cable wrappings, nutrition
Fertilizers, chemical manufacturing, refrigerants, syntheticfibers, fuels, dyestuffs
Alloys, fibers and filaments, semi-conductors, propellantsChemical manufacturing, water purification, shrink-proofing,
flame-retardants, food processingPolymer production (heavy duty tires), coatings, metallurgy,
pesticidesToothpastes and other dentrifices, additive to drinking waterFertilizers, food preservativesFertilizers, food preservativesDetergents, fertilizers, food additivesFertilizers, pesticides
High
High
Moderate
High
Low
HighHigh
Moderate HighLow
HighHigh
HighLow
High,moderateModerate
High
Moderate
Pulp production and processing, food preservatives
●

Table I.—Substances Known to Occur in Groundwater, Ranges of Detected Concentrations, Exceeded Standards, Examples of Uses, andQuantitative Estimates of Carcinogenic Potency and Noncarcinogenic Toxicitya—continued
Carcino- Noncarcino-
(parts per million)— ●
(picocuries permilliliter)
—
6.4
Iron 59 —
Lead 210 —Phosphorus 32 —
Plutonium 238, 243Radium 226 0.8-25Radium 228 12.5Radon 222 — ●
Ruthenium 106 —Scandium 46 —Strontium 90 0.817 ●
Thorium 270 —Tritium 150-353 ●
Uranium 238 10-500 ●
Zinc 65 —
genie genieExamples of usesd potency e,f toxicity e,g
Gamma radiation source for certain foodsDiagnosis of blood volume, blood cell life, cardiac output, etc.Radiation therapy, irradiation, radiographic testing, researchMedical diagnosis, therapy, leak detection, tracers (e.g., to
study efficiency of mixing pulp fibers, chemical reactions,and thermal stability of additives to food products),measuring film thicknesses
Medicine, tracerN Ai
Tracer, medical treatment, industrial measurements (e.g., tiretread wear and thickness of films and ink)
Energy source weaponryMedical treatment, radiographyN Ai
Medicine, leak detection, radiography, flow rate measurementCatalystTracer studies, leak detection, semi-conductorsMedicine, industrial applications (e.g., measuring thicknesses,
density control)NAi
Tracer, luminous instrument dialsNuclear reactorsIndustrial tracer (e.g., to study wear in alloys, galvanizing, body
metabolism, function of oil additives in lubricating oils)
CA

32 ● Protecting the Nation’s Groundwater From Contamination
ment is not easily linked to substances found ingroundwater. Adverse effects and toxicity are dis-cussed below. With respect to exposure, five pos-sible pathways of human exposure have been iden-tified (Environ Corp., 1983):
1. direct ingestion through drinking;2. inhalation of contaminants (e. g., during show-
ering);3. skin absorption from water;4. ingestion of contaminated food; and5. skin absorption from contaminated soil.
Except for drinking water containing known levelsof substances, there appear to be no general mod-els available for estimating exposure through theseroutes.
Adverse Impacts of Chemicals
Many of the chemicals detected in groundwaterare known or suspected to cause a variety of adversehealth effects, including depression of central ner-vous system functions, liver and kidney damage,and eye and skin irritation. Some of these chemi-cals are known or suspected human carcinogens.The discussion below summarizes the known ad-verse effects of individual chemicals found ingroundwater; the data upon which the summaryis based are shown in appendix A.2.
Much of the data reviewed below concerning theeffects of chemicals is derived from experimentalstudies on laboratory animals, but some informa-tion (e. g., acute effects such as eye and skin irrita-tion, some cancers) is based on studies of humanpopulations. The inference of human health effectsfrom animal studies is controversial and is reviewedelsewhere (Environ Corp., 1983). However, formany chemicals, data from laboratory studies arethe only means available for assessing potential im-pacts upon humans. Although there is usually nodirect, conclusive evidence that these effects are in-duced at the concentrations at which these chemi-cals are detected in groundwater, a variety ofinformation— qualitative human health studies con-ducted at sites of groundwater contamination (e.g.,at Hardeman County, TN; Harris, et al., no date),data on human health impacts of specific chemi-cals (whether studied directly in humans or in-
directly in laboratory animals), and much anecdotalinformation—suggests that the consumption ofgroundwater contaminated with chemicals can re-sult in acute, subchronic, and chronic human healthimpacts. An important recent study shows a sta-tistically significant relationship between two wellscontaminated with chloroform and TCE and ele-vated leukemia and birth defect rates in Woburn,MA (reported in Science News, 1984).
Apart from the controversial nature of labora-tory data, the information in appendix A.2 is alimited data base because:
●
●
●
●
not all chemicals have been tested for allimpacts,documentation is not available for cases inwhich specific impacts were not observed dur-ing studies of specific chemicals,chemicals that dominate the list of potentialhealth effects are the ones that have been mostthoroughly studied, andthe data were obtained from secondary sources.
Thus the purpose of appendix A.2 is not to estab-lish either that effects will be realized with certaintyin exposed human populations or the probabilityof their occurrence. Rather, the information shownshould be viewed as an indication of the nature ofpotential human health impacts from substances ingroundwater.
A given effect can be caused by numerous chem-icals (see app. A. 2). The effects associated with thelargest numbers of chemicals include (in decreas-ing order of the number of chemicals known tocause these effects): eye and skin irritation, effectson the central nervous system, liver damage, lungand respiratory tract effects, kidney damage, can-cers, and genetic mutation. Of these effects, anddepending on dosage, central nervous system(CNS) damage, liver and kidney damage, andcancers may be the most commonly expected seri-ous forms of adverse health impacts associated withknown groundwater chemical contaminants (En-viron Corp. , 1983). More specifically:
1. Liver, kidney, and CNS toxicants includeethylbenzene and toluene (alkyl-substitutedbenzenes); carbon tetrachloride, chloroform,and TCE (halogenated aliphatic hydrocar-bons); bromobenzene, PBBs, and PCBs (halo-

Ch. 2—Groundwater Contamination and Its Impacts ● 3 3
genated aromatic hydrocarbons); chlordane,DDT, and toxaphene (chlorinated hydrocar-bon pesticides); and some heavy metals.
2. Known or suspected carcinogens listed in table1 include 32 of the organic chemicals-chlori-nated aliphatic hydrocarbons and chlorinatedhydrocarbon pesticides—and 5 of the heavymetals (3 of which may be active only via in-halation). The evidence for human carcino-genicity of some substances has been obtainedfrom human studies and is quite strong. Thereis very little doubt that benzene, benzidine,inorganic arsenic, vinyl chloride, chromium,and nickel are human carcinogens (the lattertwo, however, are not likely to be present ingroundwater in their carcinogenic forms).
Studies of experimental animals where thepredominant effect is on the rodent liver pro-vide the main evidence for carcinogenicity ofchlorinated aliphatic hydrocarbons (e. g., car-bon tetrachloride, chloroform, TCE, PCE,and others; note from above that vinyl chlor-ide is an exception) and chlorinated hydrocar-bon pesticides (e. g., aldrin, chlordane, DDT,dieldrin, heptachlor, toxaphene, and others).It is also possible that nitrates are transformedinto nitrosamines, which are carcinogenic inlaboratory animals (NAS, 1977).
In a review of 31 substances commonlyfound in groundwater (Crump, et al., 1980,cited in Harris, 1983), two compounds withknown human carcinogenic effects were docu-mented. In addition, 12 compounds (includ-ing six chlorinated aliphatic hydrocarbons andfour chlorinated hydrocarbon pesticides) hadcarcinogenic effects in at least one laboratoryanimal species and two compounds had effects
suggestive of carcinogenicity. Despite somescientific debate on the biological relevance ofthese findings for humans (Environ Corp.,1983), Federal regulatory agencies considermany of these substances potential human car-cinogens. One compound had no observableeffects in preliminary tests, and 14 chemicalshad not even been tested in animal exper-iments.
3. Only a few compounds are known to be ca-pable of damaging the reproductive system orcausing birth defects, but some of them arewidely used throughout society. The major
4.
In
substances in this category are DBCP, vinylchloride, EDB, benzene, toluene, and xylene(Harris, 1983) and selected chlorinated eth-anes and phthalate esters, PCBs, and thechlorinated dibenzo-p-dioxins (Environ Corp.,1983).Skin and eye irritation, particularly duringshowering and bathing, might be expectedwhen chemicals are found in groundwater.Data suggest that these effects are reversibleupon cessation of exposure.
Potential Toxicity orPotency of Chemicals
addition to requiring information on the gen-eral adverse effects of groundwater contammants,a standard risk assessment analysis requires infor-mation on the non-carcinogenic toxicity and car-cinogenic potency of the chemicals. That is, adverseeffects are associated with certain chemicals, butthey are elicited at only certain dosages and/or ex-posure levels —and different chemicals have differ-ent abilities to elicit those effects. As part of OTA’sstudy, chemicals found in groundwater were rankedaccording to their relative degree of non-carcino-genic toxicity and carcinogenic potency using dose-response data when available (see table 1; EnvironCorp., 1983).2 Three broad categories are defined:‘ ‘high, ‘‘ ‘‘moderate, and ‘ ‘low’; note that thedefinitions shown in table 1 are different for non-carcinogenic toxicity and carcinogenic potency.
Based on these broad rankings, the followinggeneral conclusions are drawn (Environ Corp.,1983):
1.
2.
Some chemicals are of high toxicity and canelicit non-carcinogenic responses (e. g., liver,kidney, and CNS damage) at relatively lowdoses and/or exposure levels. These chemicalsinclude endosulfan, endrin, and kepone (pes-ticides), and heavy metals (see table 1).Many other chemicals with potential to affectthe liver, kidney, and CNS are of low to mod-erate toxicity and thus require higher dosesand/or exposure levels to elicit these effects.
‘The susceptibility of humans to various substances is also variableamong individuals and is affected by factors such as age, general health,and genetic background.
34 “ Protecting the Nation’s Groundwater From Contamination
3.
These chemicals include trichlorofluorometh-ane, bromochloromethane, chloromethane,and 1,1 -dichloroethane (halogenated aliphatichydrocarbons), bromobenzene and dichloro-benzene (halogenated aromatic hydrocar-bons), and ethylbenzene and toluene (alkyl-substituted benzenes).Substances with high to moderate carcinogen-ic potency can elicit carcinogenic responses atrelatively low doses and/or exposure levels.These chemicals include aldrin, DDT, diel-drin, and chlordane (pesticides), carbon tetra-chloride, chloroform, and 1,1 -dichloroethy -lene (halogenated aliphatic hydrocarbons),benzidine (an aromatic amine), and PCBs(halogenated aromatic hydrocarbons).
There are substantial numbers of chemicalsknown to occur in groundwater for which no tox-icity or potency data are available (beyond someacute effects). Approximately two-thirds of theorganic chemicals and one-half of the inorganicchemicals listed in table 1 may not have associatedtoxicity or potency data. 3 In addition, substancesnot generally thought of in terms of toxicity orpotency (e. g., salt water, micro-organisms, or ni-trates) can also contaminate aquifers, causing bothhealth and non-health impacts.
3Data may be available for these substances in sources not reviewedby OTA.
Photo credit: State of Florida Department of Environmental Regulation
Research on health impacts will provide informationnow lacking about many groundwater contaminants.
Interactions Among MultipleChemicals
One of the potentially most important, and asyet relatively unexplored, health issues of ground-water contamination is that contaminated aquifersusually contain more than one substance. Knowl-edge is almost totally lacking about possible inter-actions among combinations of substances. Suchinteractions, in which subsequent impacts are quali-tatively and quantitatively different than expected(and usually greater—i.e., synergistic), are com-mon in many chemical and biological processes(Odum, 1971).
At least one type of synergistic interaction hasbeen identified that is of potential importance ingroundwater: the liver toxicity of carbon tetrachlor-ide, TCE, and 1 ,1,1 -trichloroethane (halogenatedaliphatic hydrocarbons) is known from animal ex-periments to increase greatly in the presence ofalcohol. This effect has been confirmed in humancase studies for carbon tetrachloride and TCE(Radike, et al., 1977; EPA, 1980a and b). Livertoxicity of TCE and PCE is also affected by Aroclor1254, a polychlorinated biphenyl (PCB) (seeNRDC, 1982; EPA, 1980c).
Biological Substances
Pathogenic biological organisms that have beenfound in groundwater include:
1. bacteria (e. g., typhoid, bacillary dysentery,cholera, gastroenteritis, and tuberculosis);
2. viruses (e. g., enteroviruses and hepatitis); and3. parasites (e. g., protozoa, worms, and fungi).
The micro-organisms most frequently found ingroundwater are bacteria that inhabit the gastro-intestinal tract, and the most common category ofdisease resulting from micro-organisms in ground-water is gastrointestinal. Contaminated ground-water was identified as the cause of approximatelyone-half of all outbreaks of acute waterborne dis-ease occurring in the United States from 1971 to1977, and bacterial contamination has been themost frequently identified source of groundwater-related disease outbreaks (e. g., EPA cites 94 suchoutbreaks between 1945 and 1980; see EnvironCorp., 1983). The potential for bacterial contami-

Ch. 2—Groundwater Contamination and Its Impacts • 35
nation of groundwater depends on both the survivalrate of the species and characteristics of the sub-surface (e. g., moisture content, pH, and temper-ature). Bacterial contamination most commonlyresults from the introduction of human (or animal)fecal material, usually when septic tanks or cess-pools leak or overflow (Environ Corp., 1983).
Viruses and parasites have been implicated ingroundwater contamination incidents in relativelyfew instances. The low rate for viruses may be at-tributed to limitations in detection methods (En-viron Corp. , 1983). The analytical limitations re-garding detection of viruses, coupled with estimatesby the World Health Organization that about 60percent of the cases of waterborne disease reportedin the United States are caused by unrecognizedor unknown agents, suggest that viral contamina-
tion of drinking water (including groundwatersources) may be of greater significance than hasbeen recognized (Environ Corp., 1983). The prin-cipal sources of viruses in groundwater are sewageeffluent (e. g., from septic tanks, cesspools, and landapplication practices), animal feedlots, and dairies.The factors that affect the occurrence of viruses ingroundwater are complex and poorly understood;it is likely that they are similar to those for bacteria.
Radioactive Substances
Most groundwater contains trace levels of natu-rally occurring radioactive substances or their by-products. The types and levels vary from area toarea, depending principally on subsurface materi-als. In addition to natural radiation, radioactive
A , - - - - A - L , -
Credit: Southeast Michigan Council of Governments, 1982
Septic systems can cause both biological and chemical contamination of groundwater and surface water.

36 . Protecting the Nation’s Groundwater From Contamination
substances in groundwater can result from humanactivities. These sources include radioactive wastedisposal sites, waste tailings and piles, and minedrainage related to uranium mining.
Health protection from radiation is a highly de-veloped science, and data accumulated over manyyears link adverse health effects and exposure. Im-portantly, health effects are generally understoodonly at high exposure levels; only in isolated cir-cumstances are these levels of radioactivity likelyto occur in groundwater. The National Academyof Sciences, in its discussion of the health risks ofradioactive drinking water (NAS, 1977), estimatedtotal average body exposure from drinking contam-inated water at less than 1 percent of total averageyearly background radiation exposure received bythe population (total exposure is approximately 100mrem/year). The risk of cancer from total averagenatural background radiation is estimated at 4.5to 45 fatalities per million persons per year (esti-mates depend on particular assumptions; NAS,1977), including 0.6 fatal cases of bone cancer permillion persons per year.
Because radioactive content can vary from aver-age conditions, there can be situations in which
doses are significantly greater than average. For ex-ample, in areas with high groundwater radium lev-els (e. g., 25 pCi/liter of Ra226 and 12.5 pCi/literof Ra228), exposure of the human skeleton couldbe as much as a sixfold increase (up to 600 mrem/year) over that from all natural background sources.Radiation in groundwater could thus be a seriousproblem in localized areas, e.g., parts of NewEngland (Harris, 1984; Duncan, et al., 1976, citedin Prichard et al., 1983). Under the “high”groundwater radium levels mentioned above, therisk of fatal bone cancer could increase to an esti-
mated 4.2 fatalities per million persons per year.
Radiation exposure can also cause developmentalor teratogenic effects; the lowest dose at which anydevelopmental or teratogenic effect has been re-ported is 1,100 mrem/year. Under ‘ ‘average’ con-ditions, doses received by the population are sosmall that no measurable developmental or tera-togenic effects from drinking radioactive ground-water would be found, even during the sensitiveperiod of gestation (NAS, 1977).
NON-HEALTH IMPACTS
There is a general absence of both methodologi-cal experience and data on evaluating the non-health impacts—economic, environmental, andsocial—of groundwater contamination. Examplesof these impacts are shown in table 2. Because avail-able data are insufficient for quantifying or other-wise comparing most of these impacts, this sectionfocuses on the nature of non-health impacts andthe difficulties in their assessment.
Economic Impacts
Data about various types of economic impactsassociated with groundwater contamination aregenerally not available (University of Oklahoma,1983). The data that are available tend to be thedirect costs of corrective action; and they either en-compass such a broad range that they are difficult
to interpret apart from site-specific conditions (e. g.,Corrective actions can cost tens of millions of dollarsor more depending on site conditions), or they lacksufficient documentation (e. g., in terms of describ-ing site conditions) for subsequent comparison andanalysis. Some data may also be unobtainable be-cause of their proprietary nature or use in litigation.
In addition to empirical difficulties, there aremethodological difficulties in assessing the value ofgroundwater quality in terms of both the costs ofcontamination and the benefits of protection. Fewstudies are available that systematically approachan assessment of economic impacts (see Raucher,1983; Sharefkin, et al., 1983; Reitman, 1982).These conceptual difficulties, some of them com-mon to the assessment of impacts on other envi-ronmental media (e. g., surface water and air),include:

Ch. 2—Groundwater Contamination and Its Impacts ● 3 7
Table 2.—Examples of Economic, Environmental, and Social ImpactsResulting from Groundwater Contamination
Agriculture
Households
Municipalities
Economic impactsIndustry Higher operation/maintenance or capital costs (e.g., for accelerated repair or replacement of
damaged equipment or materials)Lost output from downtime during repairs, during the search for alternative water supplies, and
during relocationRelocation costsDecreases in property valueDecreases in revenue if quantity of products sold or their prices fall as a result of lower product
qualitySecondary costs (e.g., incurred by suppliers to inputs to the industry or by receivers of the output
such as by processors or marketing agents)Legal and administrative costsCosts of detection, correction, and prevention activitiesHigher operation/maintenance or capital costs (e.g., for accelerated repair or replacement of
damaged equipment or materials)Loss of output due to damage to productivity of land (also reflected in decreases in property value)Lost revenue from discarding of food products unsuitable for consumptionLoss of output due to injury or death to perennial plants and treesDecreases in livestock productivity, including illness and deathSecondary costs (e.g., incurred by suppliers of inputs to agriculture or by receivers of output)Legal and administrative costsCosts of detection, correction, and prevention activitiesHigher operation/maintenance or capital costs (e.g., for cleaning, replacement, and/or rehabilitation of
damaged pipes, plumbing, appliances)Decreased value of residential propertyRelocation expenses, including search costs, higher purchase prices, higher interest rates and fees,
and moving costsSecondary costs (e.g., contraction or expansion of commercial activities)Loss of income due to sicknessLegal costsCosts of detection, correction, and prevention activities (e.g., pre-treatment and purchase of bottled
water)Lost receipts from property, sales, or income taxesRe-allocation of additional resources to provide emergency servicesCosts of procuring alternative suppliesLegal and administrative costsDetection, correction, and prevention activities
Environmental impactsAesthetics Odor
TasteAppearance
Surface watercontamination bygroundwater
Biota
Air pollutionSoil contamination
Social impactsPsychological stressInconvenience
Damage to vegetation, waterfowl, and aquatic lifeContamination of fish
Social disruption
SOURCE Off Ice of Technology Assessment
Ž determination of the effects of various activi- . selection of an appropriate time horizon forties and practices on groundwater quality; the analysis and an appropriate discount rate
● determination of the effects of changes in for the time value of money; andgroundwater quality on groundwater use; ● assessment of the cost and effectiveness of
● lack of a perfectly competitive economic mar- various approaches to detection, correction,ketplace for valuing groundwater quality; and prevention of groundwater contamination.

38 Protecting the Nation’s Groundwater From Contamination
The economic damages resulting from ground-water contamination shown in table 3 illustrate thetypes and magnitude of documented costs. Dataare easiest to obtain for perceptible, short-term ef-fects on users that are reflected in the marketplace.Importantly, although the real value lost to the Na-tion from any one incident may not be significantcompared to, say the gross national product, theeconomic costs of groundwater contamination aresignificant if the costs for all incidents are com-bined and if the time over which these costs willbe incurred is considered. In addition, the coststo the Nation associated with the contamination ofmany aquifers may well exceed the sum of the costsassociated with individual aquifers—e. g., if thereis widespread loss of potable drinking water or ofagricultural produce. Further, the economic dam-ages from any one incident may be significantfrom the perspective of the populations and usersaffected. For example, cash-flow imbalances orother dislocations (e. g., layoffs) can result, espe-cially during emergencies when impacts may notbe anticipated or planned for.
Environmental and Social Impacts
Contaminated groundwater causes diverse envi-ronmental and social impacts; they are generallynot quantifiable and little documentation isavailable.
Because groundwater provides a significant por-tion of baseflow to streams, the potential for adverseimpacts on surface water quality may be large, espe-cially during periods of low rainfall when dilutionis minimal. Changes in the quantity of groundwateralso influence the quality of groundwater (e. g., thepumping of groundwater can induce the migrationof contaminants). The extent of other environmen-tal impacts is unknown; some cases document dam-age to fish, vegetation, and wildlife. The potentialfor groundwater contaminants (e. g., volatile organ-ics) to enter the atmosphere in the vicinity of cer-tain sources (e. g., landfills) or from volatilizationduring showering has now been recognized.
Social impacts are related largely to the anxietycaused by fear and uncertainty about exposure tocontaminants. Exposure can occur unknowingly be-cause many contaminants are odorless, colorless,and tasteless. Exposure to contaminants occurs overmany years and via many pathways, includingdrinking contaminated water, eating foods thathave been in contact with contaminated ground-water, bathing in contaminated water, and breath-ing contaminants when they volatilize in the show-er. Social impacts also arise from decreasedproperty values, and from lost income because ofillness, relocation, and inconvenience (e. g., in pro-curing alternative water supplies).
CONCENTRATION AND FREQUENCY OFSUBSTANCES FOUND IN GROUNDWATER
Concentration of Substancesin Groundwater
A substance is ‘ ‘detected’ or ‘ ‘reported” if itsconcentration sufficiently exceeds the detection lim-its of sampling and measurement equipment so thatits presence is verifiable. Detection limits (typicallyreferred to as ‘‘trace levels’ imply that valuesbelow the measurement threshold will not bereported as positive even if substances are in factpresent at lower concentrations.
A wide range of concentrations of various sub-stances has been found in groundwater (table 1).The most important conclusions about the concen-tration data are:
. concentrations of substances in groundwaterare site-specific and thus are highly variablespatially;
. concentrations are highly variable temporal-ly—they may fluctuate at a particular site bya factor of 10 during the course of a year (Har-

Location Contaminants Nature of costs Direct costs incurred DocumentationCanton, CT Well closings; extension
of water lines toaffected areas
$145,000-379,000 CRS, 1980a
Oscoda Ml
South Brunswick, NJ
Cohansey Aquifer, NJ
Well closings; provision ofnew source of water
Well closings; extension ofmunicipal water lines to af-fected area
Well closings (148); removalof drums; interimemergency water supply(via tanker trucks); drillingof new wells; extension ofpublic water supply (60°/0
of total monetary costs)Loss of irrigation wellPartial rice crop lossEstimated loss in profits
for changing from irrigatedto nonirrigated crops
Reduced service lives of house.hold plumbing andappliances
$140,000
300,000
CRS, 1980a
CRS, 1980aChloroform, toluene,xylene, trichloroethane,trichloroethylene
Wastes from manufac-ture of organic chem-icals, plastics, resin
$417,000(Residential cost ofwater increased froman average of $45/yearto $75/year)
U.S. EPA, 1976CRS, 1980b
Miller County, AR Brine contaminationfrom oil and gasactivities
$4,000$36,000$150/acre/year for rice$35/acre/year for cotton$20/acre/year for soybeansIncreased annual capital
cost per household of40% as total dissolvedsolids increase from250 ppm to 1,750 ppm
$2 million
Fryberger, 1972
38 communities in 11Midwestern Statesc
Mineral content Patterson, et al., 1968
As reported in Sharefkin,et al., 1983
Atlantic City, NJ Chemical wastes(Price’s Landfill)
Estimated cost of new wellfield to replace contaminatedwells
Cost of alternative water supplyto 35 private residences
Estimated cost of reducedservice lives of householdplumbing and appliances
Estimated average annual costof water softeners or in-creased cost of cleaningproducts
Estimated average costs ofusing bottled water
Loss of farm incomeLoss of farm incomeAlternative water supply for
affected areaPurchase of water by residentsConnection to district water
supply
$250,000
$6.5 million total annualcapital cost
$12.3 million
Orange County, CAd Mineral content Orange County Water District,1982
$2.2 million
$5 million per year$31.2 million per year$180,000
$3-5 per 5 gallons$150 per connection,
monthly operatingcosts of $4-1o
$1.2 million
MontanaSan Joaquin Valley, CAAuburn, MA
Lathrop, CA
Miller, 1980Sheridan, 1981U.S. House of Representatives,
1980CRS, 1980b
SalinitySalinityUnspecified chemicals
Pesticides
Jackson Township, NJ Chloroform, methyl Costs of planned water systemto replace closing of 100wells
CRS, 1980achloride benzenetoluene, trichloro-ethylene, ethyl-benzene, acetone

40 • Protecting the Nation’s Groundwater From Contamination
ris, et al. , no date), and they may vary fromday to day (Harris, 1984);
● concentrations of substances are often manytimes higher in groundwater than in surfacewater; and
● higher concentrations of substances are typi-call y found near the site of their release(Westerhoff, et al., 1982), especially if that sitecontains concentrated amounts of the sub-stance, sources are numerous, and/or the siteis characterized by relatively permeable soils.
A number of surveys focusing on public drink-ing water wells have been conducted by the Statesand the Federal Government in the last 10 years—including the early Environmental Protection Agen-cy (EPA) National Organics Reconnaissance Sur-vey (NORS) and National Organics MonitoringSurvey (NOMS) and, more recently, the Commu-nity Water Supply Survey (CWSS) and GroundWater Supply Survey (GWSS).4 Efforts in thesestudies were oriented toward detection of volatileorganic chemicals (VOCs), as opposed to non-VOCs (NAS, 1977). These studies show that vola-
tile organic compounds are frequently present atdetectable concentrations in public drinking waterwells.5 The studies also reveal that concentrationsof compounds in groundwater are often muchhigher than in surface water; for example, TCE,toluene, and 1,1,1-trichloroethane are up to 1,000times more concentrated in groundwater than insurface water (Burmaster, et al. , 1982).6
The National Inorganic and Radionuclides Sur-vey (NIRS) is an ongoing EPA study of ground-
water-supplied community water systems; 38 in-organic (26 of which have already been detectedin groundwater), 4 radionuclides (all previouslydetected in groundwater), and 2 common measuresof radioactivity are the focus of this investigation.
Because of the site-specific nature of groundwatercontamination, it is not possible to draw more de-tailed conclusions about or to predict typical con-taminant concentrations. At best, concentrationdata indicate the severity of site-specific contamina-tion problems and immediate local risks to publichealth and the environment (see the sections onStandards and Health Impacts). Such data are alsoessential to determine the suitability of alternativecorrective actions (see ch. 8).
Generalizations about concentration data at anylevel more aggregated than at an individual siteare highly tentative. Systematic collection of datain space or time can show how concentrations varyin an area and can provide historical information,thus establishing contamination trends for a par-ticular source and/or type of hydrogeologic setting.In all cases, however, the concentration data aresnapshots at one point in time and thus do not takeinto account the dynamics of system behavior.
Frequency of Occurrence ofSubstances in Groundwater
Frequency of occurrence generally refers to thenumber of positive samples (i. e., number for whichthe substance of concern is detected) in the totalnumber of samples tested. Like concentration data,frequency data can be biased by sampling proce-dures and analytical detection limits (University ofOklahoma, 1983; Westrick, et al., 1983). In addi-tion, data are not usually collected with sufficientdetail for frequency analysis (e. g., detection limitsof the measuring instrumentation are often notspecified), and there may be no information avail-able on frequency distributions. Most importantly,there is often no attempt to link frequency data withconcentration data; thus a ‘ ‘positive’ sample im-plies that the substance is detectable, but it doesnot indicate the concentration.
Interpretation of frequency data is more mean-ingful if information is also available about suchfactors as historical land uses and sources. At least

Ch.2—Groundwater Contamination and Its Impacts ● 41
at the site-specific level, frequency data can givean impression of the pervasiveness of substancesin groundwater. From a regional or national per-spective, however, interpretation of frequency databecomes much more difficult. Nationwide frequen-c}’ studies would require extensive sampling (hun-dreds to thousands of sites) and, like concentrationstudies, would provide only snapshots.
With these limitations in mind, data concerningthe frequency of occurrence for specific chemicalsare summarized in appendix A.3. The national sur-veys listed in the section on Concentration of Sub-stances in Groundwater (NORS, NOMS, CWSS,GWSS), the National Screening Program for Or-ganics in Drinking Water (NSP), and some Statesurveys have all yielded data on the frequency oforganic chemicals in groundwater-supplied drink-ing water. Information on the percentage of totalgroundwater samples in Federal surveys which con-tained detectable levels of VOCs is summarized byConiglio (1982).
General conclusions about the frequency dataare:
c
●
●
several organic chemicals associated withchlorinated solvents, especially TCE and PCE,have frequently been detected in groundwatercontamination incidents;public drinking water systems relying ongroundwater are frequently contaminated withVOCs; andtwo or more VOCs are frequently detected si-multaneously in groundwater supplies.
In studies of drinking water wells conducted by18 States, frequencies of detection of various VOCswere compiled for both random and non-randomsamples (CEQ 1981). For the most common chem-icals in the random samples, frequency of detec-tion ranged among the States from 1 .7-11.3 per-cent for TCE and from 3.6-4.5 percent for 1,1-dichloroethane. Random samples both are more in-dicative of general conditions and generate moreconservative estimates than non-random samples.
The two most recent Federal studies (CWSS andGWSS) provide much information regarding fre-quency of VOCs in groundwater. Information fromthe CWSS indicated that 15 percent of public watersystems relying on groundwater contained at least
one VOC; VOCs were detected in 45 percent ofthe public water systems serving more than 10,000people and in 12 percent of the more numerouspublic water systems serving fewer than 10,000 peo-ple. Because the samples were 1-2 years old at thetime of analysis, some VOCs may have degraded;thus, these percentages are regarded as minimumestimates (Brass, et al. , 1981, cited in NRDC,1982).
The GWSS (Westrick, et al., 1983) provides in-formation on the frequency with which one or moreVOCs were detected in groundwater samples. Inthe GWSS, random samples of groundwater sup-plies from public water systems were collected from466 randomly selected communities. The percent-age of random samples with one or more VOCsdetected was 16.8 percent for small systems (serv-ing fewer than 10,000 people) and 27.9 percent forlarge systems (serving more than 10,000 people).TCE and PCE were detected in 3.2 percent and4.6 percent of the random samples from small sys-tems, respectively, and both were detected in 11.3percent of the random samples from large systems.More importantly, the percentage of random sam-ples with two or more VOCs present was 6.8 per-cent for small systems and 13.4 percent for largesystems. An additional part of the survey focusedon non-random supplies selected by State agencies.
Concentration and Frequency Data inRelation to Governmental Standards
Evaluation of health risks associated with ground-water contamination requires, among other things,information concerning both frequency and con-centration of substances—specifically, the frequencywith which groundwater contains one or more sub-stances at concentrations exceeding levels that areconsidered unsafe. Standards promulgated by gov-ernment agencies specify those limits above whichthe presence of a substance is considered unsafe;they thus serve as a gauge of the potential impactsof contamination. Concentration data alone can re-veal potential problems, but only if they can becompared with standards or health impact data re-lated to those specific concentrations.
No Federal standards have been developed spe-cifically for substances found in groundwater. But

42 ● Protecting the Nation’s Groundwater From Contamination
various Federal standards and guidelines-some de-veloped for drinking water-have been applied togroundwater. These include National InterimDrinking Water Regulations (Primary and Second-ary), Health Advisories, and Ambient Water Qual-ity Criteria. In addition, individual States have de-veloped standards which they are applying togroundwater, including State drinking water stand-ards and State groundwater standards (see chs. 3and 4 and app. C. 3 for additional information re-lated to standards).
Standards or guidelines of some type (State orFederal) have been promulgated for less than one-half the substances that have been detected ingroundwater (refer to table 1). Although Federalstandards or guidelines exist for over 60 substances,there are only 22 enforceable standards (establishedby the National Interim Primary Drinking WaterRegulations) and of these, 18 are for individualsubstances. An additional six Federal standards arenon-enforceable under the Secondary Relations;remaining standards or guidelines are Health Ad-visories or Ambient Water Quality Criteria. Over150 substances and other quality indicators haveState standards; less than one-half of them also havesome type of Federal standard or guideline.
Because there is no consistent approach to thedevelopment of standards, because different stand-ards are used by different Federal and State agen-cies, and because standards do not exist for manysubstances, people in different States do not re-ceive a uniform level of health protection againstgroundwater contaminants. For example, someStates (especially in the Northeast, but also in otherparts of the country) have closed contaminateddrinking water wells in order to prevent human ex-posure to specific chemicals (e. g., TCE, PCE, di-chloroethane, benzene, chloroform, toluene, andvinyl chloride; Environ Corp. , 1983). Concentra-tions of the chemicals in the closed wells almostalways exceeded Ambient Water Quality Criteria,but the levels at which the wells were closed variedgreatly from State to State. For example, wells inNew York, Rhode Island, and Massachusetts wereclosed at levels of tetrachloroethylene ranging from1-61 parts per billion (Ambient Water Quality Cri-terion = 0.8 ppb); and wells in New York andRhode Island were closed at levels of 1,1,1-trichlor-oethane ranging from 3-1400 ppb (Ambient Water
Photo credit: State of Florida Department of Environmental Regulation
About one-half of the Nation’s population depends ongroundwater for drinking, and the level of health protectionagainst groundwater contaminants varies from State to State.
Quality Criterion = 18.4 ppb). Although these dataindicate the levels at which wells were closed, theydo not indicate the minimum threshold concentra-tions that would have elicited well-closing decisions(Environ Corp., 1983).
Theoretically, frequency data could be linkedwith concentration data and various standards toascertain the percentage of contamination incidentsin which some type of standard is exceeded. If thestandard reflects an exposure level that could re-sult in adverse health effects, then this type of analy-sis would yield information on the frequency withwhich the public is exposed to unsafe concentra-tions of contaminants in groundwater. In general,both concentration and frequency data are usuallynot reported in enough detail for such an analysis.
OTA’s study attempted such an analysis, as afirst approximation, for examples with sufficientdata. Documentation showed 38 organic chemicals,25 inorganic chemicals, and two radionuclides forwhich concentrations in at least one groundwatersample are known to have exceeded one or moreof the above types of standards or guidelines (seeapp. A.4 for details of which standards or guide-lines have been exceeded). Of these 65 substances,14 (3 organics, 10 inorganics, and 1 radionuclide)involve National Interim Primary Drinking WaterRegulations, and an additional 5 inorganic chem-icals involve Secondary Regulations. In most caseswhere standards or guidelines were exceeded, State

Ch. 2—Groundwater Contamination and Its Impacts ● 43
standards or Ambient Water Quality Criteria wereinvolved.
Frequency and concentration data are availablefor 13 of the 38 organic chemicals known to exceedsome standard or guideline in at least one sample;for none of these 13 compounds have the NationalInterim Primary or Secondary Drinking WaterRegulations been promulgated. Calculations in-dicate that 4 of the 13 compounds are known toexceed at least one type of standard or guidelinein .5-10 percent of groundwater contamination in-cidents (the type of standard or guideline exceededis shown in parentheses in the following list):
1.
2.3.
4.
carbon tetrachloride (State groundwater andAmbient Water Quality);1,1-dichloroethylene (Ambient Water Quality);tetrachloroethylene (Ambient Water Quality);andtrichloroethylene (Ambient Water Quality).
This list is not intended to be exhaustive; rather,it documents situations where substances are knownto exceed specified standards or guidelines fre-quently.
POTENTIAL BUT AS YET UNDETECTEDSUBSTANCES IN GROUNDWATER
Many substances have the potential to entergroundwater because of their molecular propertiesand association with sources (see the section onAssociation of Substances Found in GroundwaterWith Sources, which follows); they may alreadybe present in groundwater but have not yet beendetected. This study has been unable to determinewhether these substances have not yet been detectedbecause they are not being looked for, or are be-ing looked for but have not been found. A num-
ber of them are known or are suspected to exhibittoxic properties. Table 4 presents some generaliza-tions about potential groundwater contaminantsthat could have serious health effects; these gener-alizations are derived primarily from animal ex-periments. Table 4 should not be viewed as eitherexhaustive or definitive. It appears that some, butnot all, of the contaminants of potential concerncan be detected with standardized analytical meth-ods (Environ Corp., 1983).
TYPES OF SOURCES AND ASSOCIATED SUBSTANCES
Types of Sources
The quality of groundwater is altered by a widevariety of human activities and naturally occurringsituations. Sources are points along the pathwaysthat substances travel as they flow through society,where the substances can be released into ground-water. To illustrate, substances can be stored in orflow through sources in a variety of ways, from thestorage of raw materials (e. g., materials stockpiles)to manufacturing (e. g., product storage) to distri-bution (c. s., pipelines) to use (e. g., pesticide appli-cations) to disposal (which can take place almostan?’where in the process).
OTA’s study has identified 33 sources known tohave contaminated groundwater and has catego-rized them based on the nature of their release ofsubstances to groundwater (table 5). It is impor-tant to note that these categories are for the con-venience of discussion. Depending on emphasis, asource could be categorized in another way. Forexample, non-waste injection wells (for enhancedrecovery and artificial recharge) could be placed inCategories I or V. In addition, sources interact witheach other— a leak from an above ground storagetank could result in substances entering ground-water directly (Category II) or entering urban run-off and, subsequently, groundwater (Category IV).

44 . Protecting the Nation’s Groundwater From Contamination
Table 4.—Potential Groundwater ContaminantsDisplaying Serious Adverse Health Effectsa
Compound or class Potential effects
AcrylonitrileAlkyl lead compounds
Alkylamines and alkanol-amines (alkyl polyamides,secondary amines)
Carbon disulfideDimethyl sulfate
n-HexaneMercaptans
N-NitrosaminesPesticides which are not in-
cluded in Table 1.1Phenols which are not in-
cluded in Table 1.1Propylene oxide
CarcinogenicityNeurotoxicity; damage to
kidneys and hemato-poietic system
Allergic sensitization; liverand kidney injury; poten-tial to form carcino-genic N-nitrosomines
NeurotoxicityCarcinogenicity; mutagen-
icityNeurotoxicityCNS depression; liver and
kidney damageCarcinogenicityNeurotoxicity; enzyme
inhibitionNeurotoxicity; variety of
systemic effectsSuspect carcinogenicity;
mutagenicityadditional details in Environ Corp., 1983.
SOURCE: Off Ice of Technology Assessment
Other categorization schemes are also possible(e.g., according to the nature of the user: agricul-tural, industrial, domestic, and municipal; or thephysical location of the source: above the land sur-face, below the land surface and above the ground-water table, and below the groundwater table).However, classification based on discharge char-acteristics has the advantage of identifying andcharacterizing the entry of substances into thegroundwater system. The points-of-entry, in turn,are places where actions can be taken to discoverand alter the entry— i.e., to detect, correct, and pre-vent contamination.
Three general conclusions can be reached fromthis categorization:
1. There is a great diversity of sources, and theyare associated with a broad range of indus-trial, agricultural, commercial, and domesticactivities. Both wastes and non-wastes are po-tential contaminants of groundwater. How-ever, most attention has been focused onwastes, particularly hazardous wastes, frompoint sources or clusters of point sources. (A‘‘point’ source is an easily identified facility,such as a landfill or impoundment. )
2
3.
Only a few source types (Category I) are spe-cifically designed to discharge substances (i. e.,wastes) into the subsurface.Non-waste releases result from some sourcesdesigned to retain non-waste products (Cate-gories II and III) and as a consequence ofother activities (Category IV) or altered flowpatterns (Category V).
Association of Substances Found inGroundwater With Sources
The occurrence of substances in groundwaterand an understanding of how, why, and where theyare present are directly related to their use and/ordisposition. One way of approaching this topic isto examine the association of various substanceswith specific sources.
Rather than examine all substances shown intable 1 individually, this study relates nine generalclasses of substances to specific sources7 (table 6).Classes of substances with the potential to be foundin association with a source are also indicated.Table 6 does not represent a comprehensive surveyof the literature, even though one was attempted.New information about actual contamination in-cidents is being obtained continually, especially asthe States survey their groundwater resources or
ings in the hierarchy. The groupings shown deviate from convention-al approaches to contaminant categorization: these groupings are basedon molecular properties as well as detectability; conventional catego-ries are based strictly on molecular properties (and thus tend to bemore detailed).

Ch. 2—Groundwater Contamination and its Impacts ● 4 5
Table 5.—Sources of Groundwater Contamination
Category l—Sources designed to discharge substancesSubsurface percolation (e.g., septic tanks and cesspools)Injection wells
Hazardous wasteNon-hazardous waste (e.g., brine disposal and drainage)Non-waste (e.g., enhanced recovery, artificial recharge,
solution mining, and in-situ mining)Land application
Wastewater (e.g., spray irrigation)Wastewater byproducts (e.g., sludge)Hazardous wasteNon-hazardous waste
Category 11—Sources designed to store, treat, and/ordispose of substances; discharge through unplannedrelease
LandfillsIndustrial hazardous wasteIndustrial non-hazardous wasteMunicipal sanitary
Open dumps, including illegal dumping (waste)Residential (or local) disposal (waste)Surface impoundments
Hazardous wasteNon-hazardous waste
Waste tailingsWaste piles
Hazardous wasteNon-hazardous waste
Materials stockpiles (non-waste)GraveyardsAnimal burial Aboveground storage tanks
Hazardous wasteNon-hazardous wasteNon-waste
Underground storage tanksHazardous wasteNon-hazardous wasteNon-waste
ContainersHazardous wasteNon-hazardous wasteNon-waste
Open burning and detonation sitesRadioactive disposal sites
Category Ill–Sources designed to retain substances duringtransport or transmission
PipelinesHazardous wasteNon-hazardous wasteNon-waste
Materials transport and transfer operationsHazardous wasteNon-hazardous wasteNon-waste
Category IV—Sources discharging substances asconsequence of other planned activities
Irrigation practices (e.g., return flow)Pesticide applicationsFertilizer applicationsAnimal feeding operationsDe-icing salts applicationsUrban runoffPercolation of atmospheric pollutantsMining and mine drainage
Surface mine-relatedUnderground mine-related
Category V—Sources providing conduit or inducingdischarge through altered flow patterns
Production wellsOil (and gas) wellsGeothermal and heat recovery wellsWater supply wells
Other wells (non-waste)Monitoring wellsExploration wells
Construction excavation
Category Vi—Naturally occurring sources whose dischargeis created and/or exacerbated by human activity
Groundwater—surface water interactionsNatural leachingSalt-water intrusion/brackish water upconing (or intrusion of
other poor-quality natural water)
SOURCE Office of Technology Assessment.
respond to contamination incidents, inventorysources, and monitor supplies, and as efforts areundertaken to recover and/or remove substances 2.prior to their entry into the groundwater.
Four general conclusions can be drawn from thistable:
1. A diversity of classes of substances is associ-ated with known sources of contamination.The most common are the metals/cations andnon-metals/anions, followed by hydrocarbonswith specific elements (e. g., pesticides and
chlorinated solvents), miscellaneous hydrocar-bons (e. g., fuels), and radionuclides.The association of substances with specificsources often varies according to the natureof the use and disposal of substances by dif-ferent segments of society. For example, pes-ticides may enter groundwater from the stor-age tanks of manufacturers, from aerialspraying during agricultural operations, andfrom residential disposal in backyards. In con-trast, because of their design and operatingconstraints (see app. A.5), radioactive disposal

46 ● Protecting the Nation’s Groundwater From Contamination
Photo cradlt: State of Florfda Department of Environmental Regulation
Wafer supply well
~ ~ 1 Unsaturated zone
Saturated zone
Credit: USGS, 14
3,
4.
sites are not likely to contain many organicchemicals. In addition, substances associatedwith a source are not necessarily found atevery facility of a given source type, and theycan vary from facility to facility and over timeat a given facility. The essential conclusion isthat generalizations about the association ofsubstances with sources are not possible —specific substances associated with a singlesource depend on past and present uses, andthus the association of substances with sourcesis highly site-specific.Almost all sources are likely to release simul-taneously a number of substances with verydifferent properties. Eight sources (subsurfacepercolation, disposal wells, land application,landfills, open dumps, residential disposal,surface impoundments, and undergroundstorage tanks) have already been associatedwith substances from five or more classes, andan additional nine sources have a similar po-tential (table 6). Even if only one class of sub-stances is involved in a particular situation,many individual substances within that classcould be present, and their properties (e. g.,toxicity) could vary.For sources associated with particular activi-ties (e. g., agricultural practices and materialsstorage), fewer classes of substances are likelyto be found combined. Even then, however,a broad range of substances may be presentin groundwater, depending on past and pres-ent land uses.
Poorly constructed and maintained or abandoned wellscan provide a conduit for the introduction ofcontaminants into groundwater because of, forexample, the migration of water through corrodedcasings. In this case, uncontrolled discharge from an
artesian well is causing brackish water upconing.

Ch. 2—Groundwater Contamination and Its Impacts ● 4 7
Photo credit: U.S. .Environmenta/ Protection Agency
Residential disposal as a source of groundwater contamination involves theindiscriminant disposal of household products.
FACTORSTO
INFLUENCING A SOURCE’S POTENTIALCONTAMINATE GROUNDWATER
The extent to which a source has the potentialto contribute to groundwater contamination de-pends on factors that characterize both the generaltype of facility or activity (e. g., all landfills) andthe particular facility or activity of concern (e. g.,a specific landfill). These factors include:
● design, operation, and maintenance charac-teristics;
● release characteristics;● geographic location (pervasiveness and re-
gionality);. number of sources and amounts of material
flowing through or stored in sources; and● hydrogeology.
Design, operation, and maintenance can influ-ence a source potential to contribute substancesto groundwater through faulty operation and main-tenance procedures or through mechanical failureor deterioration; these factors are relatively random.Release characteristics, pervasiveness and region-ality, and the number of sources and amounts of
material are described in this section. (For generaldescriptions of sources and details of calculations,see app. A.5. )
Hydrogeology is site-specific, and it influencesthe potential contribution of individual facilities oractivities primarily by affecting the movement ofsubstances into and within groundwater. (See ch.5 for a discussion of hydrogeologic factors and in-vestigative techniques. )
Release Characteristics
Potential sources of groundwater contaminationare highly variable in the spatial (areal) pattern oftheir releases (table 7). These releases can be: 1)discrete releases, where substances emanate froma single identifiable unit; 2) diffuse releases overa large area, so that substances cannot be tracedto a single identifiable source; or 3) frontal orboundary releases, which may or may not emanate

48 ● Protecting the Nation’s Groundwater From contamination
Table 6.—Sources and Classes of Associated Substancesa
Organic chemicals Inorganic chemicals Biological Radionuclides
ICategory I
Subsurface percolation
Injection wells
Land applicationb
a Wastewater
b Wastewater byproducts
c. Hazardous waste
Category II
Landfills
Open dumps
Residential disposal
Surface impoundments
Waste tailings
Waste piles
Materials stockpiles
Graveyards
Animal burial
Above-ground storage tanks
Underground storage tanks
Containers
Open burning anddetonation sites
Radiooactlve disposal sites
Category I I I
Pipelines
Materials transport andtransfer operations
Category IV
Irrigation practices
Pesticide applications
Fertilizer applications
Animal feeding operations
De-icing salts applications
Urban runoff
Percolation ofatmospheric pollutants
Mining and mine drainage
Potential exists for contaminant in class to be found in groundwater associated with source.

Ch. 2—Groundwater Contamination and Its Impacts ● 4 9
Table 6.—Sources and Classes of Associated Substances—Continued
Category V
Production wells
a 011
b Geothermal and heat recovery
c Water supply
Other wells
Construction excavation
Category VI
Ground Water surface waterI Interactions
Natura l leaching
Salt water Intrusion
from a single source but which generally impactgroundwater along a front or boundary.
The first pattern, discrete releases, is typical ofpoint sources; diffuse and frontal release describenon-point sources. But there are exceptions. Forexample, point sources may be so densely situated(e. g., oil production fields) that substances are re-leased in an essentially diffuse pattern, and no singlesource can be identified. If numerous different typesof point sources are located in an area (e. g., ur-ban area), the specific source of the substancesfound in groundwater may also be obscured. Forthese reasons, the categorization of a source accord-ing to spatial release patterns is often site-specificand thus not rigid.
Sources also vary in the temporal pattern of po-tential releases (table 7). Some sources that are ac-tive year-round are influenced by seasonal patternsof rainfall and recharge (e. g., subsurface percola-tion, materials stockpile runoff, and natural leach-ing). Other year-round sources are not affected bythe elements because their associated materials areenclosed or otherwise protected from climate (e. g.,storage tanks and containers); in these cases, re-leases are random with respect to season. Somesources are active only at certain times of the year
(e. g., agricultural activities and de-icing salts ap-plications).
The age of an individual facility may also influ-ence temporal release patterns. For example, moreconcentrated levels of substances may be releasedduring the active years of a facility’s operations,or if there is increasing mechanical failure or de-terioration over time. Salinity from irrigation flow(a Category IV source, which is seasonal in inten-sity) may also be age-dependent in salts built upin the soil over time.
Geographic Location: Pervasivenessand Regionality
Sources of groundwater contamination are eitherwidespread throughout the Nation, located in a fewconcentrated areas or regions, or extremely local-ized (table 7). The majority of widespread sourcesare point sources; they are numerous but also tendto be concentrated in heavily populated areas. Mostpoint sources are Category II sources and are waste-related (e.g., landfills and surface impoundments).Some non-waste point sources (e. g., storage tanksand water supply wells) and, importantly, somenon-point sources (e. g., pesticide applications and

50 ● Protecting the Nation’s Groundwater From Contamination
Table 7.—Summary of Source Characteristics
Individual facility/activity Aggregate of facilities/activities
Spatial Temporal Diversityrelease release of known Amounts of
Purposea patternb patternc Pervasivenessd contaminantse Numbers f materialg
Category ISubsurface percolation .Injection wells . . . . . . .Land application . . . . . .Category IILandfills. . . . . . . . . . . . .
Open dumps . . . . . . . . .Residential disposal . . .Surface
impoundments . . . . .Waste tailings . . . . . . . .Waste piles . . . . . . . . . .Materials stockpiles . .Graveyards . . . . . . . . . . .Animal burial. . . . . . . . .Aboveground storage
tanks . . . . . . . . . . . . . .Underground storage
tanks . . . . . . . . . . . . . .Containers. . . . . . . . . . .Open burning and
detonation sites. . . . .Radioactive disposal
sites . . . . . . . . . . . . . . .
Category IllPipelines . . . . . . . . . . . .Materials transport and
transfer operations . . .
Category IVIrrigation practices . . . .Pesticide
applications . . . . . . . .Fertilizer applications . . .Animal feeding
operations . . . . . . . . . .De-icing salts
applications . . . . . . . .Urban runoff . . . . . . . . .Percolation of
atmosphericpollutants . . . . . . . . .
Mining and minedrainage. . . . . . . . . . .
Category VProduction wells. . . . . .Other wells . . . . . . . . . .Construction
excavation . . . . . . . . .Category VIGroundwater-surface
water interactions. . . .Natural leaching . . . . . .Salt-water intrusion. . . .
NW
NWNW
w
NWw
w
w
NW
w
wNW
HighModerateModerate
High
HighHigh
HighModerateModerate
LowModerate
Low
Low
ModerateLow
Low
Low
Low
Moderate
Low
LowModerate
Low
LowModerate
Low
Moderate
ModerateLow
Low
LowModerate
NW D,F s Moderate
HighHigh
Moderate
High
Moderate?
High?
HighModerate (?)
Low (?)
Low
Moderate
Moderate
Moderate
HighHigh
Moderate
?Moderate
?
High
High?
?
NANANA
HighHighLow
Moderate(High?)
Moderate7
HighHighHighHigh
?7
7
ModerateModerate
Low
Low
High
Moderate
Moderate
LowModerate
LOW
Moderate?
?
Low (?)
Moderate?
Moderate
???

Ch. 2—Groundwater Contamination and Its Impacts ● 5 1
urban runoff) are also widespread. But widespreadpoint sources may be of greater concern in someregions than in others because of variations in hy -drogeology or the level of dependence on ground-water.
Regional sources tend to be associated with heav-ily populated areas or major economic activities;often they are numerous or have large amounts ofmaterial associated with them. They include sourcesin Categories I, II, V, and VI. For example, sep-tic tanks are relatively more concentrated in Califor-nia and the Northeast, fertilizers and pesticides areapplied primarily in the West and Midwest, brinedisposal wells are located primarily in the South-west, and mine drainage is found mostly in theEast, Midwest, and Southwest. A regional sourcesuch as salt-water intrusion is naturally limited tocertain coastal areas. In addition, because the dis-tribution of sources is dynamic (e. g., industrializa-tion is increasing in the South, and energy devel-opment is increasing in Appalachia and in theMidwest), sources related to previous land uses,rather than present-day activities, may be respon-sible for the contamination.
The regional nature of some activities does notpreclude their associated substances from becom-ing widespread. For example, only a few manu-facturers are primary producers of the active in-gredients in pesticides, but their products are usedby intermediate manufacturers, small industries,residential households, and agricultural operationsthroughout the country.
Maps could be used to show the predominanceof sources on a regional scale as well as the perva-siveness of sources nationwide. Maps are not in-cluded in this report for two major reasons:
1. Available maps generally refer to one sourceor to several related sources. Because the in-formation contained on different maps in-volves different assumptions and levels of de-tail, the relative importance of differentsources is difficult to ascertain.
2. Most importantly, site-specific conditions (in-cluding hydrogeology), which are essential forany conclusions or predictions about ground-water contamination, are not included onthese maps. Relationships would need to beestablished between source locations and hy -
drogeologic areas most vulnerable to the en-trance and subsequent movement of sub-stances in groundwater and source locations.
Numbers of Sources and Amountsof Material Flowing Through
or Stored in Sources
Current estimates of the number of sources andthe amounts of materials flowing through or storedin these sources are presented in table 8. As canbe seen, many of the estimates in the 1977 Reportto Congress (EPA, 1977; Miller, 1980) are updated,and initial estimates for many additional sourceshave been developed in OTA’s analysis. Details ofthe calculations are in appendix A.5.
At least four limitations are inherent in theseestimates:
1.
2.
3,
The estimates are specifically for the amountsof material flowing through or stored in thesource and are not estimates of the amountsof material actually reaching the groundwater(unless otherwise indicated). Thus the esti-mates suggest only the maximum potential forgroundwater contamination.An estimate of the amount reveals nothingabout the nature and concentration of sub-stances in that material. Industrial and mu-nicipal sludge provides an example. Theamount of industrial sludge used in land ap-plications is roughly 7 percent of that usedfrom municipal systems, yet often the chem-ical compounds or their concentrations in in-dustrial sludge (e. g., inorganic acids andhigher concentrations of hydrocarbons) posegreater health threats than the chemical com-pounds found in municipal sludge.Accuracy of the quantitative estimates variesconsiderably from source to source, dependingon the underlying assumptions and complete-ness of the data. This study has attempted toaddress this problem by indicating the rangeof values within which the true value proba-bly falls (see app. A.5 for details), but eventhis approach is arbitrary. It is important toremember that there is a high degree of un-certainty underlying the estimates and that

52 ● Protecting the Nation’s Groundwater From Contamination
Table 8.—Numbers of Sources and Amounts of Material Flowing Through or Stored in Sourcesa
OTA Update 1977 Report
Possible PossibleApproximate Approximate uncertainty uncertainty Approximatenumber of amount of in number in amount amount of
Source facilities material b estimate c estimate c material
Category ISubsurface percolation
Domestic. ... , . . . . . . . . . . .
Industrial . . . . . . . . . . . . . . . .Injection wells
Hazardous waste . . . . . . . . .Drainage, etc. . . . . . . . . . . . .Brine . . . . . . . . . . . . . . . . . . .
Non-waste (enhancedoil recovery) . . . . . . . . . . . I
Non-waste (solution,in-situ) . . . . . . . . . . . . . . . .
Land applicationMunicipal sludge . . . . . . . . .
Industrial hazardous waste .Spray irrigation . . . . . . . . . . .
Category IILandfills
Industrial hazardouswaste. . . . . . . . . . . . . . . . .
Industrial non-hazardous waste. . . . . . . .
Utility. . . . . . . . . . . . . . . . . . .Municipal . . . . . . . . . . . . . . .
Open dumps. . . . . . . . . . . . . . .Residential disposal sites . . . .Surface impoundments. , . . .
Hazardous waste . . . . . . . . .Non-hazardous waste. . . . . .
Waste tailings. . . . . . . . . . . . . .Waste piles
Hazardous waste . . . . . . . . .Non-hazardous waste. ... , .
Materials stockpiles . . . . . . . . .Graveyards. . . . . . . . . . . . . . . . .Animal burial . . . . . . . . . . . . . .Aboveground storage
tanks . . . . . . . . . . . . . . . . . .Underground storage
tanks . . . . . . . . . . . . . . . . . .Hazardous waste . . . . . . . . .Non-hazardous waste. . . . . .Non-waste . . . . . . . . . . . . . . .
ContainersHazardous waste . . . . . . . . .Non-hazardous waste. . . . . .Non-waste . . . . . . . . . . . . . . .
Open burning and detonationsites . . . . . . . . . . . . . . . . . . .
Radioactive disposal sites . . . .
Category IllPipelines
Hazardous waste . . . . . . . . .Non-hazardous waste. . . . . .
16.6 -19.5million25,000
350,000
140,000
12,000
2,500
70485
199
75,700?
15-20,0002,400
?
1,078180,000
?
174????
?
2,0312.5 million
?
3,577??
‘?31’
?700,000miles
820-1,460bgy
1-2 bgy
< 2 x < 2 x 800 bgy
1.2 bgy>10 x > 10x
8.6 bgyd
?525 bgy
<10 x< 10x<10 x
< 10x?
<10 x 460 bgy
24.5 bgy < 10x
<10 x 0.3 mt
4 mty3-4 mty(dry)
0.10 bgyd
?
< 10x < 10x
<10 x>10 x
< 10x?
< 10x >10 x 50 bgy0.81 bgyd
40-140 mty (wet)30 mty (wet)
138 mty
<10 x?
< 2 X>10 x
‘?
>10 x> 10x< 2 x>10 x
?
90 bgy10 bgy
‘?
35.8 bgyd
1,800 bgye
580 mty
< 10x< 2 x
?
< 10x<10 x< 2 X
161 bgy—
0.4 bgy1,730 mty700 mty
??
> 10x< 2 x< 10x
?‘?
?
13.8 bgy25 bg
7
< 10x< 2 x
?
<10 x<10 x
?
>10 x??
>10 x?‘?
?3.7 millioncubic yards
?< 2 x
?< 2 X
?280 bgye
?
< 10x?
>10 x 250 bgy

Ch. 2—Groundwater Contamination and Its Impacts ● 5 3
Table 8.—Numbers of Sources and Amounts of Material Flowing Through or Stored in Sourcesa—continued
OTA Update 1977 Report
Possible PossibleApproximate Approximate uncertainty uncertainty Approximatenumber of amount of in number in amount
Sourceamount of
facilities materialb estimate c estimate c material
Category Ill—continuedNon-waste . . . . . . . . . . . . . . . 175,000 10 billion ? ? —
miles barrelsMaterials transport and
transfer operationsHazardous waste . . . . . . . .
16,000spills
?
14 mty <10 x >10 x
50-60million acres280 million
acre-treatments229 million
acre-treatments
169 million < 2 x < 2 xacre-feet0.26 mty < 2 x < 2 X
activeingredients
42 mty < 2 x < 2 x
Pesticide applications. . . . . .
Fertilizer applications. . . . . . . .
Animal feedingoperations . . . . . . . . . . . . .
De-icing saltsapplications . . . . . . . . . . . .
Urban runoff . . . . . . . . . . . . . . .
8 mty < 2 x
?< 2 x
< 10x
< 2 x?
1,935
?21.2-32.6
million acres
10-12 mty‘?
Percolation ofatmospheric pollutants . . . .
Mining and mine drainageSurface . . . . . . . . . . . . . . . . .
NA
4 millionacres; \
? ?
15,000 active< 10x < 10x 108 billion
gallonsUnderground . . . . . . . . . . . . . 67,000inactive
0.36-1.0mty acid \
Category VProduction wells
Oil wells . . . . . . . . . . . . . . . . 548,000 activity2 million
abandoned
< 10x<10 xg
Geothermal, heatrecovery. . . . . . . . . . . . . . .
Water supply. . . . . . . . . . . . .Other wells (non-waste)
Monitoring . . . . . . . . . . . . . .Exploration . . . . . . . . . . . . . .
Construction excavation . . . . .
Category VIGroundwater-surface
water interactions . . . . . . .Natural leaching . . . . . . . . . . . .Salt-water intrusion . . . . . . . . .
32 ? ? ? —350,000 ? ? ? —
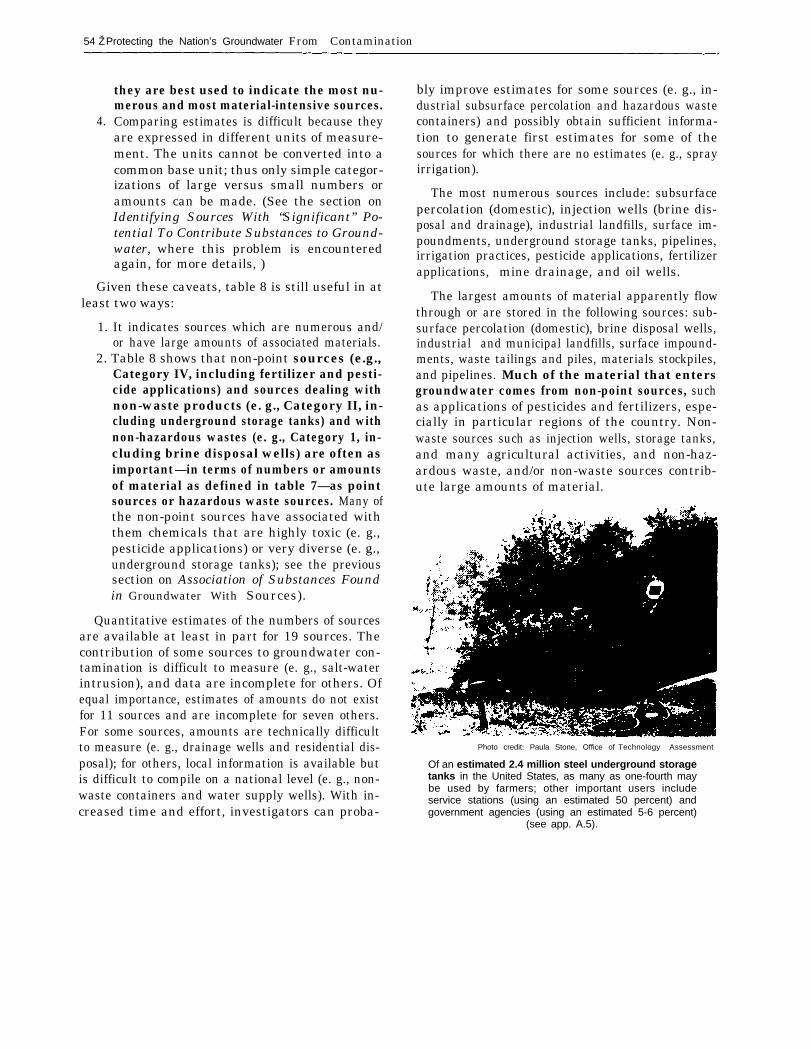
54 Ž Protecting the Nation’s Groundwater From Contamination
4.
they are best used to indicate the most nu-merous and most material-intensive sources.Comparing estimates is difficult because theyare expressed in different units of measure-ment. The units cannot be converted into acommon base unit; thus only simple categor-izations of large versus small numbers oramounts can be made. (See the section onIdentifying Sources With “Significant” Po-tential To Contribute Substances to Ground-water, where this problem is encounteredagain, for more details, )
Given these caveats, table 8 is still useful in atleast two ways:
1. It indicates sources which are numerous and/or have large amounts of associated materials.
2. Table 8 shows that non-point sources (e.g.,Category IV, including fertilizer and pesti-cide applications) and sources dealing withnon-waste products (e. g., Category II, in-cluding underground storage tanks) and withnon-hazardous wastes (e. g., Category 1, in-cluding brine disposal wells) are often asimportant—in terms of numbers or amountsof material as defined in table 7—as pointsources or hazardous waste sources. Many ofthe non-point sources have associated withthem chemicals that are highly toxic (e. g.,pesticide applications) or very diverse (e. g.,underground storage tanks); see the previoussection on Association of Substances Foundin Groundwater With Sources).
Quantitative estimates of the numbers of sourcesare available at least in part for 19 sources. Thecontribution of some sources to groundwater con-tamination is difficult to measure (e. g., salt-waterintrusion), and data are incomplete for others. Ofequal importance, estimates of amounts do not existfor 11 sources and are incomplete for seven others.For some sources, amounts are technically difficultto measure (e. g., drainage wells and residential dis-posal); for others, local information is available butis difficult to compile on a national level (e. g., non-waste containers and water supply wells). With in-creased time and effort, investigators can proba-
bly improve estimates for some sources (e. g., in-dustrial subsurface percolation and hazardous wastecontainers) and possibly obtain sufficient informa-tion to generate first estimates for some of thesources for which there are no estimates (e. g., sprayirrigation).
The most numerous sources include: subsurfacepercolation (domestic), injection wells (brine dis-posal and drainage), industrial landfills, surface im-poundments, underground storage tanks, pipelines,irrigation practices, pesticide applications, fertilizerapplications, mine drainage, and oil wells.
The largest amounts of material apparently flowthrough or are stored in the following sources: sub-surface percolation (domestic), brine disposal wells,industrial and municipal landfills, surface impound-ments, waste tailings and piles, materials stockpiles,and pipelines. Much of the material that entersgroundwater comes from non-point sources, suchas applications of pesticides and fertilizers, espe-cially in particular regions of the country. Non-waste sources such as injection wells, storage tanks,and many agricultural activities, and non-haz-ardous waste, and/or non-waste sources contrib-ute large amounts of material.
Photo credit: Paula Stone, Office of Technology Assessment
Of an estimated 2.4 million steel underground storagetanks in the United States, as many as one-fourth maybe used by farmers; other important users includeservice stations (using an estimated 50 percent) andgovernment agencies (using an estimated 5-6 percent)
(see app. A.5).

Ch. 2—Groundwater Contamination and Its Impacts ● 5 5
POTENTIAL FOR SOURCES TO CONTRIBUTESUBSTANCES TO GROUNDWATER
Determining the contribution of any source togroundwater contamination depends on under-standing a broad range of technical, economic, andsocial factors. Economic and social factors affectwhere sources are located, how they are used, andwhat they are used for. The actual contribution ofsubstances by any source will depend on such tech-nical factors as biodegradation rates, surface andsubsurface hydrology (e. g., percolation and adsorp-tion rates), the amount and type of wastes, releasepatterns, number of sources, and source charac-teristics (condition, maintenance, and operationprocedures).
Two basic approaches are discussed below foridentifying which sources have the potential for con-tributing significant amounts of substances togroundwater. One approach involves the use ofphysical and mathematical models to predict whenand which sources release substances to ground-water and what happens to the substances once theyenter groundwater. This approach can also involverecord-keeping at individual facilities. In the sec-ond approach, descriptive criteria are developed inorder to generate lists of important sources (ascl(’fined on the basis of those criteria).
Modeling the Potential of SourcesTo Contaminate Groundwater
Efforts m protect groundwater would be aidedby a priori information on when an individual fa-cility or activity will release substances with the po-tential to enter groundwater, and by estimates ofwhat portion of these substances will actually en-ter groundwater.
Little work has been done to develop measuresof the potential for sources to contribute substancesto groundwater-. In general, the site-specific natureof hydrogeology and the varying characteristics ofindividual sources have precluded development ofpredictive models. One existing model for steelunderground storage tanks uses tank age and localsoil condition data to generate predictions aboutthe’ situations in which tanks will develop leaks(Rogers, no date). If an inventory of underground
storage tanks (including specific age data) wereavailable, at-risk situations identified by the modelcould be investigated. Apparently this type of mod-eling has not been developed for other sources andis limited by data availability.
Physical and mathematical models are availablethat predict the behavior and movement of sub-stances once they enter groundwater. (See app. A.5for references. ) Most of the models yield a tem-porally varying description of the spatial distribu-tion of a substance in an aquifer (see ch. 5). Inputrequirements generally relate to underlying soilsand other hydrogeologic features and the amountor rate at which the aquifer is receiving the sub-stance. If existing contamination and aquifer char-acteristics are known, some models can be run inreverse to determine the amount of the substancethat must have been released from its source to pro-duce the given conditions. These models rely onempirical measurements for input; the value of theiroutput, therefore, is highly dependent on both theunderlying assumptions and the quality of the in-put data.
Measuring contamination potential thus also in-volves record-keeping at individual facilities. Lossescaused by leakage or infiltration of leachate can beestimated via water balance, injected waste leakage,or back-calculation procedures (University of Okla-homa, 1983). However, these procedures are ba-sically empirical or bookkeeping for an individualfacility, and the information gained is used to esti-mate leachate generation or the amount of contam-inated recharge at that particular facility. Appli-cability of these prediction methods to other similarfacilities is limited. Historic flow records could con-tribute to crude predictions, but the records are gen-erally not available.
Identifying Sources With‘‘Significant” Potential To Contribute
Substances to Groundwater
OTA’s analysis attempted to develop objectivecriteria that could be used to identify and list im-

56 ● Protecting the Nation’s Groundwater From Contamination
portant sources, i.e., sources with a ‘‘significantpotential to contaminate groundwater. However,in the course of developing these lists, a numberof problems became apparent that severely limitedthe usefulness of the lists.
Developing a single unambiguous set of objec-tive criteria is not a simple task. One investigatormight believe that amounts of material are a suffi-cient indicator of importance, and others mightbe concerned with the diversity of substances as-sociated with various sources. Groups of criteriamight be used, but the lists of important sourceswill differ depending on which sets of criteria areselected, as shown below.
An additional problem concerns comparisons ofdifferent units of measurement for a single criterion.For example, suppose that the amount of materialhandled by a source is the criterion under consid-eration. In table 7, amounts of material are meas-ured in gallons, tons, cubic yards, barrels, acres,and acre-feet. Definition of a “large” versus‘‘small” amount is arbitrary because of the inabil-it y to make comparisons among different units ofmeasurement. In addition, documentation or esti-mation of large amounts of material (using any def-inition of large) does not necessarily mean that largeamounts of substances will be released into thegroundwater; estimates of large amounts should beviewed only as upper bound indicators of the po-tential for contaminant release.
To illustrate some of the above problems and toindicate the context in which such lists could beused, listing is examined in detail. As an example,one set of criteria was selected, comprised of fourcharacteristics described in the section on FactorsInfluencing a Source’s Potential To ContaminateGroundwater: number, amounts of material, diver-sity of substances, and pervasiveness. Althoughthese criteria might seem to be relatively objective,all entail arbitrary definitions of low (or small),moderate, and high (or large), The definitions thusdetermine the evaluations made in any list.
Information is even more subjective or sparse forother possible criteria, such as the degree to whichsource control (of operating and maintenance pro-cedures) is required to prevent the release ofsubstances, the potential of the source to introducenew substances into groundwater, the toxicity of
associated substances, and the nature of releasecharacteristics. These criteria are useful in char-acterizing sources, but they are more difficult tointerpret when considering the question of the po-tential of any particular source to contaminategroundwater. For example, the release of sub-stances with any of the spatial or temporal releasepatterns discussed above could result in little to sig-nificant contamination.
Using the above four criteria, several lists ofsources were generated by using different group-ings of the criteria and different levels of impor-tance for particular criteria (e. g., use of high num-bers in one list, moderate to high numbers inanother list). A selection of these lists is presentedin table 9. Although some sources fit into many ofthese lists, a major conclusion is that the exact listingchanges as different criteria are selected. For ex-ample, if regulatory authorities are interested ingroundwater contaminated by a high diversity ofsubstances, there are five important sources (sub-surface percolation, landfills, open dumps, residen-tial disposal, and surface impoundments) and, ofthese, the most important source would be surfaceimpoundments (based on table 6). If the numberof facilities alone is important (e. g., as a gauge ofregulatory efforts required for control), nine sourcesare of primary interest and, of these, the most im-portant source would be subsurface percolation(based on table 8).
Among the first nine lists in table 9, seven sourcesappear on more than one-half the lists: subsurfacepercolation, injection wells, landfills, open dumps,surface impoundments, underground storage tanks,and fertilizer application. Of all sources, only thesurface impoundment source is widespread and hasa ‘ ‘high” ranking for the other three criteria (seetable 7). Additional criteria could justify the inclu-sion of specific sources. For example, it is knownthat a high percentage of underground storage tanksare leaking gasoline and causing a number of con-tamination incidents (see app. A. 5). Location overvulnerable aquifers (e. g., sole-source aquifers)would be another reason for including surface im-poundments and other sources on a list.
The first nine lists are based exclusively on theabove four criteria, which tend to be quantitative;quantitative criteria will generally bias a list toward

Ch. 2—Groundwater Contamination and Its Impacts ● 5 7
I
x x
x x
x x
x
x
x
xx x
x x
x
x
x
x
x X x x x x x
x
x
x
x
x
x
x
x
x
x
x
x

58 ● Protecting the Nation’s Groundwater From Contamination
point sources, because point sources are relativelyeasy to identify and count or measure (note thatof the above seven sources, only fertilizer applica-tions is a non-point source). In contrast, supposetoxicity, a criterion that is more descriptive of thepotential health effects of substances and is notbiased toward point sources, is selected. Then thelist (see the toxicity column in table 9) would in-clude pesticide applications, open dumps, residen-tial disposal (e. g., TCE and other halogenatedaliphatic hydrocarbons), open dumps, and the fa-cilities/activities of each source type that deal withhazardous wastes. Although this list does focus onhazardous waste sources, it also includes severalnon-point sources (pesticide applications, residen-tial disposal, land application, pipelines, and ma-terials transport). Other criteria that could be used
in this manner include economic impacts and envi-ronmental impacts.
This exercise illustrates the difficulty in identi-fying one single list of sources that would satisfyall sets of criteria— the list of sources generated de-pends on the criteria selected for identifying” im-portant” sources. In addition, groundwater con-tamination problems differ from region to regionand from site to site, thereby making national listssomewhat tenuous. Listing the sources is not as im-portant as recognizing that materials flow throughsociety; that problems involve non-point, non-haz-ardous, and non-waste sources; that problems varyfrom region to region; and that groundwater con-tamination is highly site-specific.
CHAPTER 2 REFERENCES
Congressional Research Service, Six Case Studies ofCompensation for Toxic Substances Pollution: Ala-bama, California, Michigan, Missouri, NewJersey,and Texas, prepared for the Committee on Environ-ment and Public Works, U.S. Senate, 1980b.
Coniglio, W., ‘‘Criteria and Standards Division Brief-ing on Occurrence/Exposure to Volatile OrganicChemicals, ” Office of Drinking Water, U.S. Envi-ronmental Protection Agency, 1982.
Considine, D. M., and G. D. Considine (eds. ), VanNostrand’s Scientific Encyclopedia, 6th ed. (NewYork: Van Nostrand Reinhold, 1983)
Council on Environmental Quality, “Contamination ofGround Water by Toxic Organic Chemicals, ”Washington, DC, 1981.
Environ Corp., “Approaches to the Assessment ofHealth Impacts of Groundwater Contaminants, ”draft report prepared for the Office of TechnologyAssessment, August 1983.
Fryberger, J., “Rehabilitation of a Brine-PollutedAquifer, ” Office of Research and Monitoring, U.S.Environmental Protection Agency, 1972.
Geraghty & Miller, Inc., “The Fundamentals ofGround-water Quality Protection, ” New York,1983.
Harris, R. H., ‘ ‘The Health Risks of Toxic OrganicChemicals Found in Groundwater, ” PrincetonUniversity/Center for Energy and EnvironmentalStudies, Report No. 153, 1983.

Ch. 2—Groundwater Contamination and Its Impacts ● 5 9
Harris, R. H., Center for Energy and EnvironmentalStudies, Princeton University, personal communi-cation, January 1984.
Harris, R. H., J. V. Rodricks, R. K. Rhamy, and S.S. Papadopulos, ‘ ‘Adverse Health Effects at a Ten-nessee Hazardous Waste Disposal Site, draft man-uscript, Fourth Annual Symposium on Environmen-tal Epidemiology, University of Pittsburgh, no date.
Hawley, G. G., The Condensed Chemical Dictionary,9th ed. (New York: Van Nostrand Reinhold, 1977).
Kaplan, E. M. G., B. Royce, E. F. Riedel, and J.Sathaye, ‘ ‘Assessment of Environmental ProblemsAssociated With Increased Enhanced Oil Recoveryin the United States: 1980 -2000,” BrookhavenNational Laboratory 51528 UC-92a, under U.S.Department of Energy contract No. DE-AC02-76CH00016, 1983.
Lewis, R. J., and R. L. Tatken (eds. ), Registry of ToxicEffects of Chemical Substances, 1979 ed., U.S. De-partment of Health and Human Services (Washing-ton, DC: U.S. Government Printing Office, Septem-ber 1980).
Metropolitan Area Planning Council, “A Guide to theSafe Use and Disposal of Hazardous HouseholdProducts, Boston, MA, 1982.
Miller, D. W. (cd.), Waste Disposal Effects on GroundWater (Berkeley, CA: Premier Press, 1980).
National Academy of Sciences, Drinking Water andHealth (Washington, DC: National Academy Press,1977).
National Academy of Sciences, Risk Assessment in theFederal Government: Managing the Process (Wash-ington, DC: National Academy Press, 1983).
Natural Resources Defense Council, “Comments of theNatural Resources Defense Council, Inc. on NationalRevised Primary Water Regulations, Volatile Syn-thetic Organic Chemicals in Drinking Water, Ad-vanced Notice of Proposed Rulemaking, 47 FederalRegister, 9350-9358 (Mar. 4, 1982), ” Sept. 30, 1982.
O’Brien, R. P., and J. L. Fisher, ‘ ‘There is an Answerto Groundwater Contamination," WATER\Engi-neering and Management, p. 30ff, May 1983.
Odum, E. P., Fundamentals of Ecology, 3d ed. (Phila-delphia: W. B. Saunders Co., 1971).
Orange County Water District, “Water Quality andConsumer Costs, ” 1972.
Patterson, W. L., and R. F. Banker, “Effects of HighlyMineralized Water on Household Plumbing and Ap-pliances, ’ paper presented at the Annual Confer-ence, American Water Works Association, June1968.
Prichard, H. M., and T. F. Gesell, “Radon-222 inMunicipal Water Supplies in the Central UnitedStates, Health Physics 45:991-993, 1983.
Radike, M. J., K. L. Stemmer, P. G. Grown, E. Lar-son, and E. Bingham, ‘ ‘Effect of Ethanol and VinylChloride on the Induction of Liver Tumors: Prelimi-nary Report, Environmental Health Perspectives21:153-155, 1977.
Raucher, R. L., ‘‘A Conceptual Framework for Meas-uring Benefits of Groundwater Protection, WaterResources Research 19:320-326, 1983.
Reitman, F., “Costs and Benefits in Aquifer Protec-tion, New England Journal, Business and Econom-ics 19(1), 1982.
Ridgley, S. M., and D. V. Galvin, ‘ ‘Summary Reportof the Household Hazardous Waste Disposal Proj-e c t , Toxicant Control Planning Section, WaterQuality Division, Municipality of Metropolitan Seat-tle, WA, 1982.
Rogers, W., ‘‘Tank Integrity Program, Warren Rog-ers Associates, Inc., Newport, RI, no date.
San Francisco Bay Regional Water Quality ControlBoard, “Underground Tank Leak Detection Pro-gram Status Report, ’ 1983.
Science News, vol. 125, No. 104, Feb. 18, 1984.Sharefkin, M. F., M. Schecter, and A. V. Kneese, “Im-
pacts, Costs, and Techniques for Mitigation of Con-taminated Groundwater, pp. 93-126 in Papers forand a Summary of a Workshop on Groundwater Re-sources and Contamination in the United States(Washington, DC: National Science Foundation,PRA Report 83-12, August 1983).
Sheridan, D., “Desertification of the United States’(Washington, DC: Council on Environmental Qual-ity, 1981).
Southeast Michigan Council of Governments, “PublicReview Summary Draft: Genoa Township PolicyPlan for Groundwater Protection, March 1982.
Tucker, R. K., ‘‘Groundwater Quality in New Jersey:An Investigation of Toxic Contaminants, New Jer-sey Office of Cancer and Toxic Substances Research,1981.
U.S. Environmental Protection Agency, “HazardousWaste Disposal Damage Reports, ” No. 3, 1976.
U.S. Environmental Protection Agency, ‘ ‘The Reportto Congress; Waste Disposal Practices and Their Ef-fects on Ground Water, ” 1977.
U.S. Environmental Protection Agency, “AmbientWater Quality Criteria for Carbon Tetrachloride,NTIS PB81-117376, 1980a.
U.S. Environmental Protection Agency, “Ambient

60 ● Protecting the Nation’s Groundwater From Contamination