chapter 2 effects of repeated treatments of …
TRANSCRIPT

CHAPTER 2
EFFECTS OF REPEATED TREATMENTS OFDEMETHYLATION-INHIBITOR (DMI)
FUNGICIDES ON DMI-SENSITIVE POPULATIONSOF RUTSTROEMIA FLOCCOSUM
41

LITERATURE REVIEW
Thousands of compounds continue to be isolated,
synthesized, and screened in hopes of finding
antimicrobial properties. Most of the compounds shown to
be successful in clinical trials were active on bacteria
and not fungi (21). The first uses of antifungal
compounds were restricted to human medicine, followed by
veterinary applications, before being expanded possibly
for the treatment of fungal diseases of plants (44). The
development of compounds that interfere with sterol
function and metabolism within fungal pathogens have
become increasingly prevalent in plant-, animal-, and
human-disease management (11).
The Ergosterol-Biosynthesis Pathway and Sterol-
Biosynthesis Inhibitors
Sterols are important in the maintenance of cell-
membrane integrity, synthesis of bile acids, and the
production of steroid hormones (44). Campesterol,
sitosterol, and stigmasterol are the main sterols found In
plants (10)
mammals (69).
Cholesterol is the predominant sterol in
Ergosterol is the characteristic sterol in
the ascomycetes, basidiomycetes, and deuteromycetes (95),
which are the three classes of the higher fungi (1).
42

Koller classified sterol-interfering antifungal
agents into four groups (44). The first of these was the
polyene microlides, which began with the description of
nystatin in 1950 (34). Amphotericin B followed in 1956
(29) and became the most useful of the polyene microlides
(21) of which more than 200 compounds were described by
1981 (68). They have been successfully used in the
treatment of candidiasis (23,42). Their mode of action lS
to bind preferentially to ergosterol molecules that
reinforce the cell membrane resulting in a loss of the
membrane's structural integrity with subsequent leakage of
critical lons from within the cell (41,42). No macrolide
products have been developed for use on plants (44).
The other three groups are collectively known as
"sterol biosynthesis inhibitor" (SBl) fungicides
(11,44,71,76), "sterol inhibitor" (Sl) fungicides (64,65)
and "ergosterol biosynthesis inhibitor" (EBl) fungicides
(20,72). All three terms are synonymous. Their mode of
action is to interfere with ergosterol biosynthesis,
thereby affecting cell-membrane maintenance and formation
(73)
The ergosterol biosynthesis pathway lS highly
conserved (44) and can be segmented into three parts. The
first is the formation of squalene; this is common to all
43

sterol production in animals, plants, and fungi (12). The
synthesis of squalene begins with acetyl-CoA and involves
ten enzymatic steps with farnesyl diphosphate being the
immediate precursor to squalene (44).
The second part contains the conversion of squalene
into lanosterol (57). An essential step within this
segment is the formation of squalene epoxide (66). The
newest class of SBI fungicides, the allylamines, inhibits
squalene epoxidase, thus leading to an accumulation of
squalene and a subsequent deficiency of lanesterol (67)
The allylamines are still restricted to the
chemotherapeutic treatment of human mycoses; no uses on
plant pathogenic fungi have been reported (44).
The third segment of the ergosterol biosynthesis
pathway is catalyzed by membrane-bound enzymes and
involves the conversion of lanosterol into ergosterol
(59). Action sites of the other two classes of SBI
fungicides, the azole fungicides and the morpholine
fungicides, occur within this final segment. The azoles
were introduced in the late 1960s and were routinely
screened for potential as pesticides as well as drugs
(44) . The azoles are structurally diverse (97) but share
a common site of action.
44

Specifically, they interfere with demethylation at
the C-14 position of lanosterol by outcompeting 24-
methylene dihydrolanosterol to bind with its respective
enzyme, the 14a-sterol demethylase. This results in an
accumulation of lanesterol, and ergosterol is not
subsequently synthesized (13,45). Accordingly, this class
was called the sterol C-14-demethylation inhibitor
fungicides, or SDIs, by Buchenauer (14) and Lyr (53) in
1987. Scheinpflug and Kuck referred to them more
concisely in the same monograph as the demethylation
inhibitor (DMI) fungicides (47), and this name became
commonly used (27,28,31,71,75,89,91).
The morpholines were first utilized in agriculture
before later being developed as antimycotic
pharmaceuticals (44). Its first member, dodemorph, was
introduced in 1965 as the first plant-protective SBI (63),
although its specific mode of action was not understood at
the time (97). Morpholines have dual action sites that
are both within the lanosterol to ergosterol segment of
the ergosterol biosynthesis pathway (40). Both sites
occur after the C-14 demethylation (58) and involve
enzymatic mechanics that are very similar to each other
(44). Specifically, they block 614 double-bond reduction
45

and ~8-~7-isomerization. These actions have the lethal
effect of inhibiting mycelial growth as chitin becomes
irregularly distributed in the cell (58).
The sterol-biosynthesis pathway has been a productive
metabolic area in terms of research, development, and
production of phytofungicides. The SBIs constitute the
largest and most important group of these (24). The most
commercially viable group has been the DMIs (35). It is
also the largest. All products in use today were
described as early as 1992 when Koller listed 40 DMI
fungicides and antimycotic drugs with 23 of them then used
in agriculture (44). The relative ease of patentability
can be attributed somewhat to the diverse-structural
differences among molecules that can inhibit C-14
demethylation. The chemistry of the DMls would have been
broadened much earlier had biochemists recognized this
sooner (13).
DMI Fungicides - Product Development
The DMls are used to manage a broad spectrum of plant
diseases. Schulz and Scheinpflug (74) iterated several
advantages:
(a) They can be used in a prophylactic, curative, or
eradicative manner.
46

(b) They can be applied as sprays, granulars, or
seed treatments.
(c) They control not only individual pathogens but
often whole disease complexes.
(d) They cause phytotoxicity less frequently because
of their systemic nature and specific mechanism
of action.
(e) They make possible low application rates because
of their high fungicidal potency.
The DMI-fungicide class can be further divided into sub-
groups based on structural differences that may account
for their selectivity and variation among themselves.
These groups are the piperazines, imidazoles, pyridines,
triazoles, and pyrimidines.
The first DMI to be introduced was the piperazine
triforine launched in 1969 by Boehringer Sohn Company
(74) . It controls powdery mildew and rusts and is the
sole piperazine used in plant protection (72). The first
imidazole, imizalil, was presented by Janssen in 1972 for
use as a seed treatment to inhibit soil-borne pathogens of
cereals (72,74). The only commercially available pyridine
is buthiobate launched as Denmert by Sumitomo in 1975
(72). Kato reported it having in vitro effectiveness on
several ascomycetes and deuteromycetes (39), but in
47

Its current registrant is Bayer
practice it has been used primarily on powdery mildew In
Japan (72).
In 1973, Grewe and Buchel (33) reported the
effectiveness of fluotrimazole on powdery mildew. Bayer
subsequently introduced it as the first commercially
available triazole fungicide (72,74). Steffens and
wieneke later documented its systemic activity (79).
However, no record could be found of it having been
registered for use in the U. S. (92,93,94).
Triadimefon, another Bayer triazole, was introduced
in the same year and was the first to have broad-spectrum
activity on a number of ascomycetes, basidiomycetes, and
deuteromycetes (72,74). It received U. S. Environmental
Protection Agency (EPA) registration as Bayleton in 1980
(94). Triadimefon set new standards for chemical control
of plant diseases (97) and became the first DMI labeled
for use on turf (38). Registration of the product was
passed on from Mobay to Miles and to Bayer Crop
Protection, which were all subsidiaries of the Bayer
Corporation (9)
CropScience.
The pyrimidines were developed from the pyridines as
plant-protection fungicides (97). The Eli Lily
Corporation developed the only commercial products,
48

triamirol and fenarimol (44). The latter has been the
most successful having been launched into the crops market
in 1975 as Rubigan EC by its agricultural subsidiary at
the time, the Elanco Products Company (3). Rubigan AS was
labeled for turf in 1983 (61). The product was passed
onto DowElanco in 1989 and Dow AgriSciences in 1997 before
being sold to the Gowan Company of Yuma, Arizona, in 2001
(8) .
Rubigan has proven to be an effective fungicide on
many turf diseases. However, it is unique in that 75% of
its sales In recent years have been as a niche-market,
preemergence herbicide (S. Farrington, personal
communication) that can suppress the germination of annual
bluegrass (poa annua L.) in bermudagrass (Cynadon dactylon
[L.] Pers.) golf-course greens and tees overseeded with
perennial ryegrass (Lolium perenne L.), rough bluegrass
(Poa trivialis L.), or creeping bentgrass (Agrostis
stolonifera L.) (88). Current registrant Dow
Agriscience's Supplemental Label D06-027-001 issued by the
EPA stipulates two applications spaced 14 days apart at
least 14-days prior to overseeding with perennial
ryegrass. Rough bluegrass or creeping bentgrass should
receive three applications at 14-day-spray intervals (5)
49

The total dosage of active ingredient (AI) for both
programs is 370 g 100 m-2.
Menn and Beard achieved excellent control with
similar timings using maximum total dosages of only 90 g
AI 100 m-2 with higher rates causing discoloration of
Tifgreen and Tifdwarf bermudagrass (Cynodon dactylon (L.)
Pers. x C. transvaalensis Burt-Davy (54,55,56). No other
fungicides were tested in these studies and no dollar spot
was evident (W. Menn, Personal Communication). The lack
of dollar-spot incidence is understandable since the
maximum-application rate of fenarimol for dollar spot is
less than 50 g AI 100 m-2 every 14 days (7). No reports of
any testing with other DMls have been found. The
uniqueness of fenarimol for this use may be because it lS
the only pyrimidine labeled for turf.
Other triazoles besides triadimefon have been shown
to be effective turf fungicides. Propiconazole was
originally discovered and patented by Jansen
Pharmaceuticals (72,74). Ciba Geigy then acquired the
compound's agricultural-use rights and introduced it in
1979 as Tilt. The company acquired EPA registration
numbers for several more formulations directed toward
different market segme~ts. The product labeled for turf
and ornamentals was released in 1987 and trade-named
50

Banner (4). Ciba-Geigy became known as Ciba in 1992
before it merged with Sandoz in 1996 to form Novartis,
which in turn joined with AstraZeneca to form Syngenta,
which exists today (9).
Cyproconazole was registered as Sentinel 1994 by
Sandoz Crop Protection, but it was sold to Bayer to meet
antitrust requirements set forth by the European
Commission that allowed the formation of Syngenta (6).
The most recent triazole turf-fungicide is trade-named
Eagle. It contains myclobutanil and was registered ln
1997 by Rohm and Haas, which was acquired by Dow
AgriSciences in 2001. Triton with AI triticonazole was
expected to be registered by Bayer for turf use in 2004
(96) . However, it and tetrabutrazole have been delayed
indefinitely due to recent EPA concerns with the
environmental fate of DMI metabolites (R. Hanrahan,
personal communication). No other DMIs are being
developed for use on turf by Syngenta (J. DiPaola,
personal communication), Bayer (R. Hanrahan, personal
communication), Dow (F. Pretzer, personal communication),
or Gowan (S. Farrington, personal communication), at this
time.
Current products labeled for use on U. S. golf
courses are shown in Table 2.1. They may have identical
51

or different trade names when sold elsewhere depending
upon the product and the country. The U. 8. patents for
triadimefon, fenarimol, and propiconazole have expired
resulting in similar products being offered by more than
one company.
DMI-Fungicide Formulations and Efficacies
The DMI fungicides are a class of some of the most
systemically fungistatic compounds available for use on
plant diseases (74). Demethylation inhibitors trans locate
primarily in the apoplast but some symplastic transport
does occur (72). Formulations containing DMIs for spray
applications in diluted forms include wettable powders,
water-dispersible granules, dry flowables, aqueous
suspensions, microemulsions, gels, and emulsifiable
concentrates. Dry applications can be made as granulars
or combined with fertilizers. The DMIs are typically
applied at lower quantities of AI per unit area when
compared to the benzimidazoles and dicarboximides.
The DMIs are single-site (88) fungicides under
multigenic control (85,87). This action site is within
the sterol biosynthesis pathway, which is critical to a
higher fungi metabolism. Ascomycetes, basidiomycetes, and
deuteromycetes produce ergosterol and oomycetes do not,
52

which explains their respective sensitivities and
tolerances to DMIs (43).
DMI Use on Dollar Spot
Those DMIs labeled for use on turf have been
effective in suppressing Rutstroemia floccosum, the causal
pathogen of dollar spot. Most product labels recommend
application intervals of up to 28 days. Golf-course
superintendents in the Upper Midwest reported reduced
control of dollar spot in the late 1990s when using DMIs
(38,89). Shortened lengths of suppression were observed
and could only be restored by increasing application
rates. This was consistent with DMI resistance shown with
other plant diseases (26,46). Golembiewski et al.
documented R. floccosum cross-resistance to the DMIs in
1995 (31).
DMI-SENSITIVE R. FLOCCOSUM STUDY
Combining or alternating different classes of
fungicides has long been touted as a means of preventing
or retarding the shift toward a fungal population
dominated by those resistant to at least one of the
classes having been applied (77,78). Turfgrass
pathologists have often recommendeded tank-mixing or
53

alternating systemic- and contact-type fungicides
(16,22,90). However, Vargas has contended that combining
or alternating different SS-fungicide classes results in
multiresistance to those classes; therefore, it is not a
viable strategy for delaying R. floccosum resistance
(84,86,87,88) .
The objective of the experiment presented here was to
determine if a DMI-sensitive population of R. floccosum
could be shifted to a predominantly DMI-resistant
population by the directional-selection pressure of
repeated applications of a DMI fungicide. Another goal
was to determine any differences that occurred among
applications made solely with a DMI, a DMI combined with a
fungicide of a different class, or a DMI alternated with
such. A subsequent objective was to determine the number
of applications needed to effect any such shifts.
Agronomic Practices and Site Assessment
The study was conducted at the Hancock Turf Research
Center at Michigan State University (MSU) in East Lansing,
Michigan. The experimental area was primarily annual
bluegrass (poa annua L.) with some creeping bentgrass.
The soil was a silty clay loam. Supplemental irrigation
to prevent visual wilt was applied in early evening except
54

following significant rainfall events after which the soil
was allowed to dry down. The turf received nitrogen
applications totaling 19 to 29 kg 100 m-2 annually via five
to eight fertilizer applications. Other plant-available
nutrients were adequate according to soil tests conducted
by the MSU Soil and Plant Nutrient lab.
The turf was mowed at a 13-mm height with clippings
collected and removed from the site. The mowlng frequency
was two to three times weekly during the growing season,
and the direction was parallel to the longitudinal axis of
each plot. The removal of any clippings that remained was
attempted using a lawn sweeper. The plots were arranged
ln a randomized-complete-block design with four blocks.
Each plot measured 2.1 m by 8.4 m or 17.6 m2 (See Figure
2.1) .
Dollar-spot incidence increased in late July 1994 until
the entire plot area was severely diseased. A 25-mm-
diameter soil-probe was used to collect plugs that
included diseased tissue from the middle of each plot.
This area measured 1.2 m by 3 m (3.6 m2). The end-to-end
and side-to-side distances between the sampling areas in
adjacent plots were 4.2 m and 5.8 m respectively. Ten or
more sub samples were taken from each plot. The samples
55

were then stored In a freezer until they could be analyzed
in the lab.
Samples were removed from the freezer as needed and
allowed to thaw at room temperature. Three diseased
leaves from each sample were then placed on plastic Petri
plates containing autoclaved potato-dextrose agar (PDA)
(Difco Laboratories, Detroit MI) that had been cooled to
50 C before being amended with 10 pg ml-1 penicillin and pg
ml-1 streptomycin. Mycelia were allowed to grow for one
week at room temperature (21 C). The pure culture was re-
isolated on PDA and grown for three days.
A 10,000-ppm stock-solution of concentrated fungicide
was prepared by suspending 1 g of the DMI Bayleton 25
(0.25 g triadimefon) in 25 ml of water that had been
purified via reverse osmosis and then autoclaved. One I
of PDA was autoclaved and allowed to cool to 50 C before
0.2 ml of thoroughly-agitated stock-solution was slowly
stirred into the media. The resulting concentration of
triadimefon was 2 pg ml-1. Plates were filled with 15 ml
each of this amended-PDA media.
Seven-mm-diameter plugs of each isolate were placed
on two different 88-mm-diameter plates with one containing
PDA and the other having the triadimefon-amended PDA.
Each plate contained a single plug. The cultures were
56

allowed to grow at room temperature until the mycelia had
covered the entire or nearly the entire surface of the
unamended plate; this usually took four days. The colony
diameters were measured in two perpendicular directions
using a metric ruler. The 7-mm diameter of the plug was
subtracted from these values. The effective diameters of
the unamended colonies ranged from 72 to 81 mm. The
average-colony diameter was then calculated.
The average-colony diameter on the amended plate was
divided by the average diameter of the unamended colony.
This value was expressed as a percentage. The percent-
relative growth for an isolate was zero if no mycelia were
observed growing from the plug. The average of two
replicates determined the average-percent-relative growth
for each isolate. These values for each isolate were
averaged to calculate the mean-percent-relative growth for
each plot.
Triadimefon completely inhibited 211 of the 560
isolates tested for this survey (see Table 2.2). Slight
gradations in the degrees of sensitivities were found
among the rest of the isolates. The greatest average-
percent-relative-growth measurements were 3.9% with one
isolate and 3.8% with two. These three isolates were the
57

only ones to have 3.0% or greater average-percent-relative
growth.
None of the isolates were nearly as insensitive as
those reported by Golembieski (30) nor Gilstrap (28) on
isolates collected from turf sites dominated by DM1-
resistant R. floccosum. An analysis of variance (AOV) was
performed that compared the plots where the ensuing
treatments (see below) would be applied. A P-value of
0.595 was insufficient evidence to reject the null-
hypothesis that observations were a result purely of
chance. Therefore, it was concluded that the experimental
site at the HTRC had a R. floccosum population sensitive
to DM1 fungicides.
Fungicide Treatments
Treatment 1 was the control or check treatment with
no fungicides applied to it. The remaining treatments
were different fungicides and timing intervals (see Table
2.3). Changes in the formulations used and their
suppliers changed over the course of the study.
Chlorothalonil applied as Daconil 2787 4.17 FL was
obtained early on from 15K Biotech Co. in Mentor, Ohio,
and later from Zeneca Ag Products in Wilmington, Delaware.
Iprodione (Chipco 26019 2 FL) was supplied by Rhone-
58

Poulenc Ag. Co. in Research Triangle Park, North Carolina.
Triadimefon was provided as Bayleton. Fenarimol (Rubigan
1 AS) was provided by DowElanco of Indianapolis, Indiana.
Propiconazole was applied first as Banner 1.1 EC (Ciba
Co., Greensboro, North Carolina) and later as Banner Maxx
1.3 ME (Novartis, Greensboro, North Carolina).
Treatment 2 received only chlorothalonil, a contact
or multisite (MS) fungicide. Treatment 3 received only
iprodione, a SS fungicide of the dicarboximide class.
Treatments 4, 5, and 7 were triadimefon, fenarimol, and
propiconazole respectively, all at rates and intervals
typically used on dollar spot. Treatment 6 was at the
same propiconazole rate as Treatment 7 but at 14-day
instead of 21-day intervals. Treatment 9 was
propiconazole at four times the typical dollar-spot rate,
which was the maximum specified to control ectotrophic-
root diseases (see below) Treatments 10 and 11 were
intended to test the effects of a DMI- and an MS-fungicide
In combination and alternation respectively. Treatments
12 and 13 were to test the same theory except with a DMI
and a dicarboximide.
Treatment 14 incorporated the use of a DMI applied as
a preventative to suppress summer patch caused by
Magnaporthe poae, Landschoot & Jackson and/or take-all
59

patch caused by Gaeumannomyces graminis (Sacc.) Arx &
Olivo var. avenae (E. M. Turner) Dennis., which are both
ectotrophic-root diseases found on many Michigan golf
courses. The first application of propiconazole occurred
when soil temperatures at a 50-mm depth reached 24 C for
five consecutive days. A second application was then made
28 days later. These annual applications of propiconazole
were followed in years 1 and 4 with propiconazole only,
year 2 with chlorothalonil only, and year 3 with iprodione
only. This treatment simulated the "Yearly Rotation
Theory" recommended by Vargas at the time (85).
Treatments were applied in each of three-sequential-
growing seasons. Treatments 1, 2, 3, 4, and 5 received no
propiconazole. The total number of propiconazole
applications with the other treatments from 1994 through
19~7 ranged from six (treatment 13) to 20 (treatments 6
and 10) as shown in Table 2.4. The total amount of
propiconazole applied to these treatments varied from 25.2
g 100 m-2 (treatments 11 and 13) to 235.2 g 100 m-2
(treatment 9), a greater than nine-fold increase (see
Table 2.5) .
60

Fungicide-Application Techniques
The fungicides were diluted with water and applied
under C02 pressure using a hand-pushed, rolling boom-
sprayer. All passes across the plots with the sprayer
were made with a spray-volume rate of 4.1 I 100 m-2.
Treatment 8 was at two times the propiconazole rates of
Treatments 6 and 7; therefore, two passes were made and
the resulting spray volume applied was equivalent to 8.2 I
100 -2m . The four passes needed to apply the 4 X
propiconazole rates called for in Treatments 9 and 14
resulted in an equivalent spray-volume rate of 16.4 1 100
m-2. The same application method resulted in equivalent
spray-volume rates of 8.2 I 100 m-2 with treatments 10 and
12. Fungicide treatments were initiated in early August
1994 and reapplied according to experimental protocol
until early September.
Sample Collection
The collecting and handling of the samples were the
same as that described above. On 14 October 1994, ten
isolates were taken from each plot if ten infection
centers were present; otherwise, the number of isolates
was the same as the number of infection centers present.
More samples were collected on 14 July 1995. Treatments
61

were then resumed until early September. Dollar-spot
incidence increased until at least ten dollar spots were
present in each plot. Isolates were collected in the same
manner as above on 20 October 1995.
Dollar-spot incidence had been minimal due to
unusually cool weather when a reduced number of samples
were collected on 12 July 1996. Treatments were resumed
on the following day. More favorable conditions for
dollar-spot activity occurred in late summer and early
fall.
Treatments continued through mid October in an
attempt to maximize selection pressure. Isolates were
next collected on 1 August 1997 followed by a resumption
of treatments that continued through mid October. The
next and final sampling occurred on 21 August 1998.
In Vitro Sensitivity Assessments and Statistical Analysis
Ten isolates or fewer from each plot with each
sampling were assayed for DMI resistance as described
above. Ten 4-mm plugs from an unamended plate of each
isolate were stored in individual 1.5 microfuge tubes with
1 ml of mineral oil. An AOV table for each observation
was calculated using Microsoft Office Excel software.
62

Accuracy was checked using the GLM function of SAS and
mlnor errors were corrected on the Excel spreadsheets
Sensitivity Differentiation Using AFLP Markers
A study was conducted in 2002 with Drs. Kurt Lamour,
Brandon Horvath, Mary Hausbeck and Joseph Vargas, Jr.
using the resources of the Hausbeck lab at MSU. The
object of this collaboration was to determine if AFLP
markers could be used effectively to differentiate DMI-
sensitive and DMI-resistant isolates of R. floccosum. Six
isolates already determined to be DMI sensitive and ten
isolates known to be DMI resistant in another study (see
Chapter 3) were analyzed using a commonly used DNA-
extraction and AFLP-fingerprinting methodology described
fully by Lamour (49).
An AFLp™ Microbial Fingerprinting Kit (Perkin-Elmer
Corp., Foster City, California) supplied the PCR-core mix,
core-primer sequences, adaptor sequences, and florescence.
An MJ Research Minicycler (MJ Research Inc., Waltham,
Mass.) was used to perform all PCR reactions. The
selective primers EcoRI-AA, -AC, -AG, and -AT, were used
in all 16 combinations with Msel-CA, -CC, -CG, and -CT
selective primers to perform the PCR amplifications. This
study was of a larger investigation, and further
63

information including a description of the statistical
analysis used to interpret the data has been provided by
Horvath (36).
Results and Discussion
The mean-percent-relative-growth values for each
block and treatment at each observation are shown in
Tables 2.6-2.11. The effective diameters of the unamended
colonies ranged from 70 to 81 mm. Average-percent-
relative growth for any isolate did not exceed 10% until 1
August 1997 when two isolates each measured 10.6% in the
fourth block of Treatments 4 and 10. Isolates in
Treatments 2 and 4 of block 4 measured 14.7 and 27.5
average-percent-relative growth respectively on 21 August
1998. An AOV showed significant differences among
treatments on 20 October 1995 (P < 0.039), 1 August 1997
(P < 0.068), and 21 October 1998 (P <> 0.029). The
relative ranking of treatments on those dates is shown on
Tables 2.12-14.
None of the block or treatment means approached those
that have been found earlier with DMI-resistant
populations of R. floccosum (28,31). Therefore, the
results are best presented and discussed in terms of
relative sensitivities. Several terms will be used as
64

defined below. Mean-percent-relative growth is truncated
to 'relative growth'. The term 'group' denotes a cluster
of treatments separated by values less than the LSD. The
word 'higher' signifies greater R. floccosum sensitivity
to DMls and 'lower' indicates lesser such sensitivity when
comparing two treatments, two groups, or a treatment and a
group. The words 'highest' and 'lowest' designate similar
relationships except that the comparisons involve three or
more groups, treatments, or any combinations thereof. The
use of 'top' or 'bottom' refers to the relative ranking of
any of the above. 'Dollar-spot rate' means the rate or a
rate indicated on the respective-fungicide-product's label
for dollar spot. The words 'observation' and 'date' refer
to those time points having significance. Comparisons on
the first and third dates were made using an LSD value at
p ~ 0.05. Comparisons at the second observation were made
using an LSD value at P ~ 0.10.
Treatment 4 with triadimefon only and Treatment 7
with propiconazole only (see Table 2.3) were in the lowest
group on the first two dates. Both of these treatments
were at dollar-spot rates applied every 21 days.
Treatment 4 was among the second highest group on the last
date. Treatment 6 (propiconazole at the dollar-spot rate
every 21 days) had lower relative-growth values than
65

Treatments 4 and 7 but the differences were not
significant. Treatment 5, (fenarimol at the dollar-spot
rate every 21 days) was the highest ranking member of the
lowest group on the first observation and of the second-
lowest group on the second date. Propiconazole treatments
at higher rates every 21 days (Treatments 8 and 9) were
ranked below all of the above treatments on all dates but
not different than them. These trends lend credence to
the principle that as DMI resistance increases in a
population of R. floccosum, higher rates and/or shorter
intervals of a DMI fungicide are needed to achieve the
same results seen earlier with the same fungicide when the
population was DMI sensitive.
Treatment 10 (propiconazole at the same rate as
Treatments 6 and 7 plus chlorothalonil on 14-day
intervals) was ranked in the second-lowest group and among
the top group on the first date. Treatment 10 had the
highest ranking at the second and third observations.
These measurements increased almost 50% between the first
and second date and 35% between the second and third dates
representing a two-fold difference between the first and
third dates (see Figure 2.2).
Chlorothalonil alone every 14 days (Treatment 2) was
among the treatments in the higher group as well as the
66

lower group on the first dates. It was In the higher
group and not different than Treatments 4, 7, and 10 on
the second date. It was In the highest group and not
different than Treatment 10 at the last observation where
it was also at the top of the second highest group on the
last observation and not different than Treatments 4, 5,
6, 7, 11, and 14.
Increased R. floccosum sensitivities to the DMls over
time in treatments that utilized chlorothalonil have been
noted in earlier small-plot studies by Golembieski et al.
(31) and Gilstrap et al. (28). Both phenomena were
explained by the possible occurrence of migration events
of resistant fungi from adjacent or nearby DMI-treatment
plots. However, chances of such influx were lessened here
because this large-plot experiment was designed to
minimize plot-to-plot movement of diseased clippings (see
Figure 2.1).
Isolates with decreased DMI sensitivities were
detected in Block 4 of Treatment 2, the chlorothalonil
only treatment, on 1 August 97 (see Table 2.10). Isolates
taken the next year had similar levels of resistance
except for one that had an average-percent-radial-growth
value of 14.7, which was next to greatest value detected
at that observation or in the experiment, overall. This
67

isolate could have been the result of a mutation that had
occurred or it could have been a migrant, which was
unlikely (see above). As noted, other isolates with
decreased DMI sensitivities were detected. This leads to
speculation that this subpopulation underwent
physiological changes during this experiment. One such
hypothesis is that repeated exposures to the MS-fungicide
chlorothalonil can enhance R. floccosum resistance to DMls
and perhaps other SS-fungicide classes.
Pujls and Shaw made single applications of the DMI
flutriafol and chlorothalonil each alone and ln
combination or ln alternation to three successive
plantings of wheat each having a DMI-sensitive population
of Septoria tritici Rob. ex Desm., the causal organism or
wheat blotch. In vitro differences in DMI tolerances were
not found to be significant. However, a full rate of
flutriafol combined with a full rate of chlorothalonil
showed the greatest shifts towards less sensitive isolates
(62 )
Koller and wilcox reported increased resistance to
both the DMls and benzimidazoles in Venturia inaequalis
(Cook) G. populations already resistant to dodine, also an
MS fungicide (25), as compared to those dodine sensitive
(47) . The greatest and most significant increases to both
68

the DMls and benzimadazoles occurred with those isolates
that were already multiresistant to both classes prior to
further exposures.
Dodine was one of the first MS fungicides to which
field resistance developed (82). Anilazine is also an MS
fungicide, and resistance to it by R. floccosum was
reported by Nicholson et al. in 1971 (60). Reduced
sensitivity of Colletotrichum gloeosporioides (Penz.)
Penz.&Sacc. to the MS fungicide chlorothalonil has been
shown in vitro (48).
Koller and wilcox speculated that a membrane-
transport system enabled the active outflux of unrelated
fungicides and could have been responsible for their
findings (47). Such physiology has been suggested as a
possible mechanism that could facilitate such
multiresistance (17,19). Multidrug resistance (MDR) has
been linked to an increased expression of transporter
genes that produce transporter proteins belonging to the
ubiquitous superfamily of ATP-binding cassette (ABC)
transporters (2), which is one of the largest known
protein classes (51).
These proteins use energy produced Vla ATP hydrolysis
to traffic molecules across biological membranes (81).
Single proteins can facilitate a diversity of substrates
69

(83). They are known to confer MDR to anti-tumor drugs
(37) and are a major concern for cancer therapy (70). An
over-expression of some of these transporters has been
linked to MDR in laboratory-induced mutants of filamentous
fungi (2,80). These phenomena have also been documented
with field isolates of Botrytis cenerea (50) and
Mycosphaerella graminicola (81). It is conceivable that
ABC transporters in R. floccosum contributed to the
pathogen's increased-DMI sensitivity shown with Treatment
2 and Treatment 10, both of which involved sequential
applications to chlorothalonil, compared to other
treatments as described above.
Treatment 11 that alternated propiconazole and
chlorothalonil was among the lowest groups at all three
observations. This was most likely because of the fewer
number of exposures as well as the overall lower amount of
the DMI applied compared to the other propiconazole
treatments, and perhaps the other chlorothalonil
treatments as well (see Tables 2.4 and 2.5). These
results support the alternation of DMIs with
chlorothalonil as an effective strategy to delay DMI
resistance.
The treatments using iprodione (Treatments 3, 12, and
13) also ranked similarly at the bottom. Implementing one
70

or more of these four treatments into a dollar-spot
management program appears to have merit. However,
questions concerning R. floccosum resistance to iprodione
and whether or not it occurred in this experiment are
valid. That issue was beyond the scope of this
experiment, but it could be investigated as long as the
isolates from those iprodione plots could be grown again
from stored samples.
The treatment effects with the yearly-rotation theory
are difficult to interpret in relation to the other
treatments since it was the only one having two DMI
applications annually prior to the advent of dollar-spot
treatments. The fact that it was among the second and
third groups on the second and third observations is
reason to consider its utility. An attribute is that it
allows three-year intervals between iprodione treatments.
This respite could allow time during which dicarboximide-
sensitive could regain dominance as the dicarboximide-
resistant isolates fail to survive due to their poor
environmental fitness (32,52). How the results would have
changed had the other treatments included early DMI
applications were not answered due to area and resource
limitations of this experiment.
71

The fewer numbers of isolates collected in Treatment
10 in the third and fourth blocks at the last observation
were a result of fewer dollar spots being present at the
time when a full contingent of isolates were collected
from 46 of the 54 plots. This suggests that the repeated
applications of propiconazole in combination with
chlorothalonil eliminated sensitive strains. This would
reduce the competition in the infection court so that a
resistant strain could begin to flourish. This process
appears to have started in Block 4 and to a lesser degree
in block B in Treatment 10. This reasoning suggests that
a shift could have begun in Treatment 12 since only four
isolates were collected in each of its blocks as well as
In block 2 of Treatment 6.
Burpee challenged two propiconazole-sensitive strains
to series of 10 in-vitro exposures to propiconazole
concentrations of 0.2 pg ml-1 and 0.3 pg ml-1 and observed
only slight but significant (P ~ 0.05) decreases in
sensitivities that did not approach nearly the lack of
sensitivity demonstrated by an isolate known to be DMI
resistant (15). De Waard and Van Nistelrooy also showed
in vitro loss of sensitivity with penicillium italicum
Wehrner. to DMls using similar methodology (18). Results
presented here are evidence that repeated applications of
72

DMls to field populations of R. floccosum may cause
similar decreases in DMI sensitivity in planta.
The reduced DMI sensitivity with Treatment 10 on 1
August 1997 (see Table 2.13) occurred after 14
applications of a DMI (see Table 2.4). The further
reduction on 21 August 1998 followed six more DMI
applications. This evidence supports Vargas' estimate
that between 20 and 30 applications of a DMI can be made
before resistant isolates begin to emerge (86,87).
Opportunities to extend this range may exist by limiting
the long-distance, inward migration of leaf tissue, some
of which could influx DMI-resistant isolates of R.
floccosum. This may be particularly true for new golf
courses where the turf was established solely from seed.
Greater attention toward the sanitation of golf clubs,
golf shoes, and turf-maintenance equipment that comes from
other golf courses may be strategically beneficial.
The goals of this study could probably have been
addressed more efficiently if each plot's sampling area
had been inoculated initially and equally with a DMI-
resistant strain. A suitable amount of inoculum would
have been that needed to be detected in approximately 20%
of the baseline samples. Also, the use of a single DMI at
its respective dollar-spot rate would have reduced the
73

total number of treatments. An example of such a
treatment regime is shown in Table 2.16.
The AFLP analysis was inconclusive. The markers used
were linked to random base pairs and did not provide
adequate resolution. Identification of a DNA sequence or
sequences that could be used to differentiate DMI-
resistant and DMI-sensitive R. floccosum would have been a
serendipitous discovery. However, it might be attained
uSlng additional sets of markers different than those used
here. Comparisons of radial growth on PDA only and PDA
amended with fungicides continue to be the most efficient
and discriminate method for assessing the relative-
fungicide sensitivities of R. floccosum strains.
The experimental objective of determining if a DMI-
sensitive population of R. floccosum could be shifted to a
predominantly DMI-resistant population by the directional-
selection pressure of repeated applications of a DMI
fungicide was not achieved. However, a population with
reduced sensitivity was detected following repeated
applications of propiconazole when combined with
chlorothalonil (Treatment 10). This occurred after 20
applications of a DMI. Determining this number of
applications was an alm of this study.
74

Reduced DMI sensitivity with the R. floccosum
population that occurred with Treatment 10 was greater
than that detected when propiconazole was alternated with
chlorothalonil (Treatment 11). This finding addressed one
of the questions concerning the effects of a DMI combined
with a fungicide of a different class, or a DMI alternated
with such.
The R. floccosum populations associated with several of
the other DMI treatments appeared to be on the verge of
shifting toward reduced DMI sensitivities when the
experiment was terminated. The relative lack of dollar-
spot incidence ~n some of those treatments indicated that
the common strains of R. floccosum were being eliminated
due to repeated exposures to a DMI fungicide. It IS
suspected that significant reductions in the DMI
sensitivities of these populations would have occurred had
the experiment been extended for several more years.
75

Table 2.1. Common names, chemical names, trade names, andcurrent registrants of demethylation-inhibitor fungicideslabeled for use on commercial turf in the U. S.
Fungicide VII Andersons1% Bayleton
Common Name
triadimefon
Chemical Name
1-(4-chloro-phenoxy)-3,3-dimethyl) -1- (lH-1,2,4-triazol-1-yl)-2-butanone
Trade Name
Bayleton 50
Granular TurfFungicide
Regi-strant
fenarimol Q-(2-chlorophenyl) -Q-(4-chloro-phenyl)-5-pyrimi-dine-methanol)
propiconazole 1-[[2(2,4-dichlo-rophenyl)-4-propyl -1,3-dioxolan-2-yl]methyl]l-H-1,2,4-triazole)
myclobutanil 2-(4-chloro-phenyl)-2-(lH-1,2, 4-triazol-1-yl methyl)hexane-nitrile
Accost Verdicon4
Rubigan A.S. Gowan5
Twosome Lesco
Banner GL syngenta6
Banner Maxx
Spectator Lesco
Propiconazole BASF7
ProEagle Dow8
Manhandle Lesco
Golden Eagle Andersons
lBayer CropScience, Kansas City MO2Lesco, Inc., Rocky River OH3Andersons Golf Products, Maumee OH4Verdicon, Inc., Sioux Falls IA5Gowan Company, Yuma AZ6Syngenta Professional Products, Greensboro NC7BASF Professional Turf, Research Triangle Park NCsDow AgroSciences, Indianapolis IN
76

Table 2.2. Average-percent-relative growth for each blockof ten subsamples collected on 29 July 1994 and mean-percent-relative growth for each treatment shown alongwith the fungicides for each treatment.
TreatmentX
1. control
2. chlorothalonil (95.5)
3. iprodione (15.3)
4. triadimefon (7.6)
5. fenarimol (6.7)
6. propiconazole (4.2)
7. propiconazole (4.2)
8. propiconazole (8.4)
9. propiconazole (16.8)
10. propiconazole (4.2) +chlorothalonil (95.5)
11. chlorothalonil (95.5) alt.wi propiconazole (4.2)
12. propiconazole (4.2) +iprodione (15.3)
13. iprodione (15.3) alt.wi propiconazole (4.2)
14. Yr 1 and 4propiconazole (16.8)propiconazole (4.2)
Yr 2propiconazole (16.8)chlorothalonil (95.5)
Yr 3propiconazole (16.8)iprodione (15.3)
XRates in 9 AI 100 m-2.
YIntervals between applications.
77
DaysY I II III IV Mean
0.91 0.89 1.17 0.77 0.94
14 1.17 0.89 1. 02 1. 32 1.10
21 0.75 0.76 0.50 0.65 0.67
21 0.64 0.90 0.41 0.76 0.68
21 0.78 0.37 0.77 0.91 0.71
14 1. 28 0.88 0.88 1. 03 1. 02
21 1. 68 0.52 1. 03 1. 03 1. 06
21 1. 02 1. 40 0.90 1. 28 1.15
21 0.78 1. 43 0.63 0.75 0.90
14 1. 01 0.64 1.15 0.77 0.89
14 alt. 0.00 1. 30 1. 28 1. 39 0.99wi 21
21 0.63 0.75 0.91 1.18 0.87
21 0.64 1. 64 0.89 0.77 0.99
24C&28d 0.65 0.89 1.27 1.15 0.9928
24C&28d14
24C&28d21
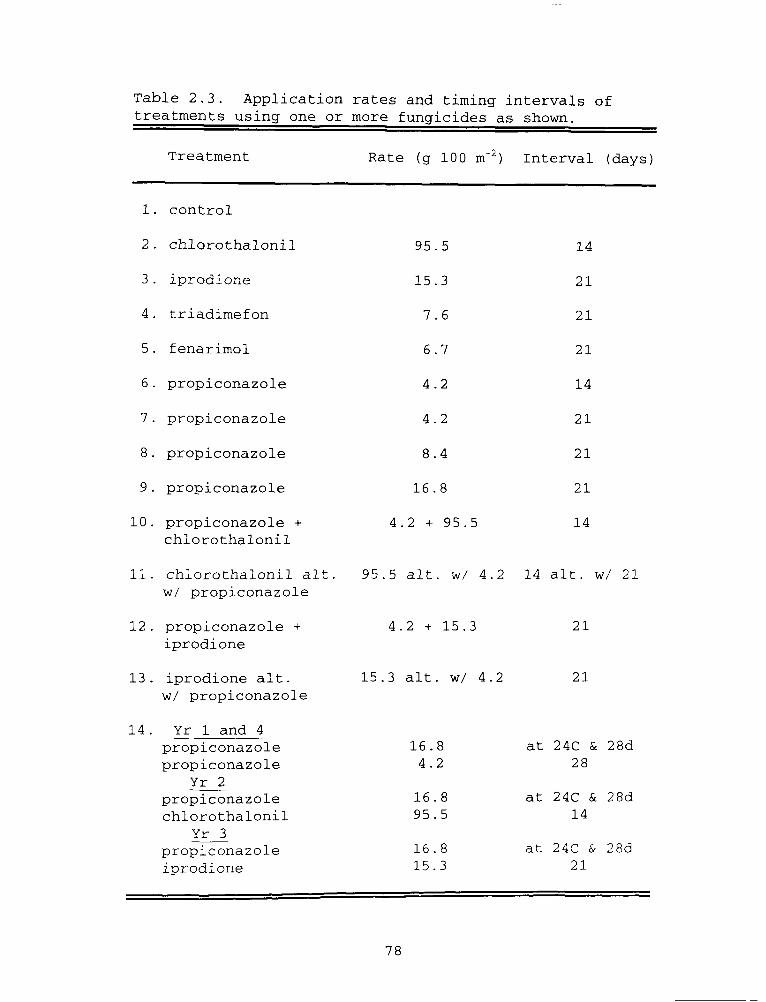
Table 2.3. Application rates and timing intervals of treatments using one or more fungicides as shown.
Treatment Rate (g 100 itf2) Interval (days)
1. control
2. chlorothalonil 95.5 14
3. iprodione 15.3 21
4. triadimefon 7.6 21
5. fenarimol 6.7 21
6. propiconazole 4.2 14
7. propiconazole 4.2 21
8. propiconazole 8.4 21
9. propiconazole 16.8 21
10. propiconazole + 4.2+95.5 14 chlorothalonil
11. chlorothalonil alt. 95.5 alt. w/ 4.2 14 alt. w/ 21 w/ propiconazole
12. propiconazole + 4.2+15.3 21 iprodione
13. iprodione alt. 15.3 alt. w/ 4.2 21 w/ propiconazole
14. Yr 1 and 4 propiconazole propiconazole
Yr 2 propiconazole chlorothalonil
Yr 3 propiconazole iprodione
16.8 4.2
16.8 95.5
16.8 15.3
at
at
at
24C & 28d 28
24C & 28d 14
24C & 28d 21
78

Table 2.4. Number of propiconazole applications appliedin 1994, 1995, 1996, and 1997.
1994
1995
1996
1997
Total
Tmt. 13& 11
1
1
2
2
6
Tmt. 14
3
2
2
3
10
Tmts. 7a,8, 9, & 12
3
3
4
4
14
Tmts. 6& 10
4
4
6
6
20
aTriadimefon and fenarimol treatments were applied atequivalent rates on the same days as Trot. 7.
Table 2.5. Propiconazole amounts in g 100-2 applied in1994, 1995, 1996, and 1997.
Tmts. 11& 13
Tmts. 7,8, & 12
Tmts.6 & 10
Trot.14
Tmt. 9
1994 4.2 12.6 16.8 42.0 50.4
1995 4.2 12.6 16.8 37.8 50.4
1996 8.4 16.8 25.2 37.8 67.2
1997 8.4 16.8 25.2 42.0 67.2
Total 25.2 58.8 84.0 159.6 235.2
79

Table 2.6. Average-percent-relative growth for each blockof ten subsamples (or fewer where noted) collected on 14October 1994 and mean-percent-relative growth for eachtreatment shown along with the fungicides for eachtreatment.
TreatmentX
1. control
2. chlorothalonil (95.5)
3. iprodione (15.3)
4. triadimefon (7.6)
5. fenarimol (6.7)
6. propiconazole (4.2)
7. propiconazole (4.2)
8. propiconazole (8.4)
9. propiconazole (16.8)
10. propiconazole (4.2) +chlorothalonil (95.5)
11. chlorothalonil (95.5) alt.wi propiconazole (4.2)
12. propiconazole (4.2) +iprodione (15.3)
13. iprodione (15.3) alt.wi propiconazole (4.2)
14. Yr 1 and 4propiconazole (16.8)propiconazole (4.2)
Yr 2propiconazole (16.8)chlorothalonil (95.5)
Yr 3propiconazole (16.8)iprodione (15.3)
XRates in g AI 100 m-2•
YIntervals between applications.
aNine subsamples collected.
bEight subsamples collected.
80
DaysY I II III IV Mean
1. 01 0.51 1.17 1.15 0.96
14 0.51 1.040.81b 0.53 0.72
21 1. 05 0.25 0.64 0.38 0.58
21 0.90 0.77 1. 05 0.79 0.88
21 1. 03 0.90 0.90 1. 42 1. 06
14 1.17 0.75 1. 03 0.77 0.93
21 0.52 0.77 0.52 0.79 0.65
21 1. 41 1. 39 0.63 1. 04 1.11
21 0.90 1. 28 0.90 0.78 0.97
14 1. 05 1. 05 0.76 1.13 1. 00
14 al t. 0.25 1. 00 1.13 1.14 0.88wi 21
21 0.78 1. 27 1. 02 1. 43" 1.13
21 0.78 1. 03 1. 28 1. 45 1.14
0.29" 1. 42 1. 04 1. 56 1. 0824C&28d
28
24C&28d14
24C&28d21

Table 2.7. Average-percent-relative growth for each block of ten subsamples (or fewer where noted) collected on 14 July 1995 and mean-percent-relative growth for each treatment shown along with the fungicides for each treatment.
Treatment Daysy II III IV Mean
1. control
2. chlorothalonil (95.5)
3. iprodione (15.3)
4. triadimefon (7.6)
5. fenarimol (6.7)
6. propiconazole (4.2)
7. propiconazole (4.2)
8. propiconazole (8.4)
9. propiconazole (16.8)
10. propiconazole (4.2) + chlorothalonil (95.5)
11. chlorothalonil (95.5) alt. w/ propiconazole (4.2)
12. propiconazole (4.2) + iprodione (15.3)
13. iprodione (15.3) alt. w/ propiconazole (4.2)
14. Yr 1 and 4 propiconazole (16.8) propiconazole (4.2)
Yr 2 propiconazole (16.8) chlorothalonil (95.5)
Yr 3 propiconazole (16.8) iprodione (15.3)
xRates in g 100 m"2. YIntervals between applications.
Nine subsamples collected.
Eight subsamples collected.
1.15 0.75 1.18 0.75 0.96
14 0.65 0.65 1.30 1.60 1.05
21 0.64 0.78 0.64b 0.78 0.71
21 1.28 1.04 1.18 1.17 1.17
21 0.90 0.13 1.29 1.14 0.87
14 0.63 0.90 1.01 1.54 1.02
21 0.89 1.16 0.52 0.39 0.74
21 0.91 1.03 0.90 1.01 0.96
21 1.13 0.76 1.26 0.51 0.91
14 0.91 1.78 0.63 2.06 1.35
14 alt. 0.39 1.03 0.91 0.38 0.68 w/ 21
21 1.29a 1.55 1.42 0.57 1.21
21 0.77 0.90 1.55 0.64 0.96
0.57 1.66 1.16 1.15 1.14a
24C&28d 28
24C&28d 14
24C&28d 21
81

Table 2.8. Average-percent-relative growth for each blockof ten subsamples collected on 20 October 1995 and mean-percent-relative growth for each treatment shown alongwith the fungicides for each treatment.
TreatmentX DaysY I II III IV Mean
1. control2. chlorothalonil (95.5)3. iprodione (15.3)4. triadimefon (7.6)5. fenarimol (6.7)6. propiconazole (4.2)
7. propiconazole (4.2)
8. propiconazole (8.4)
9. propiconazole (16.8)10. propiconazole (4.2) +
chlorothalonil (95.5)
11. chlorothalonil (95.5) alt.wi propiconazole (4.2)
12. propiconazole (4.2) +iprodione (15.3)
13. iprodione (15.3) alt.wi propiconazole (4.2)
14. Yr 1 and 4propiconazole (16.8)propiconazole (4.2)
Yr 2propiconazole (16.8)chlorothalonil (95.5)
Yr 3propiconazole (16.8)iprodione (15.3)
XRates in g 100 m-2•
Ylntervals between applications.
82
0.38 1. 01 0.77 1.16 0.8314 0.79 0.50 0.51 2.00 0.9521 0.64 0.26 0.53 1. 30 0.6821 0.76 1. 96 1. 56 1. 06 1. 3321 0.78 1. 66 1. 53 1. 93 1. 4714 1. 25 1. 84 0.53 1. 65 1. 32
21 1. 55 0.51 1. 03 2.56 1. 41
21 1. 54 0.65 0.89 1.16 1. 06
21 0.52 1. 41 1. 01 1. 91 1. 2114 1.16 0.89 1. 56 1. 94 1. 39
14 alt. 0.51 0.77 0.38 1.13 0.70wi 21
21 0.65 1. 04 0.51 0.78 0.74
21 0.64 0.91 0.66 0.51 0.68
1.28 1.78 0.78 1. 54 1. 3424C&28d
28
24C&28d14
24C&28d21

Table 2.9. Average-percent-relative growth for each blockof ten subsamples collected on 12 July 1996 (or fewerwhere noted) and mean-percent-relative growth for eachtreatment shown along with the fungicides for eachtreatment.
TreatmentX DaysY I II III IV Mean
l. control 0.44 g 2.87t 1. 66
2. chlorothalonil (95.5) 14 1.35t 1. 35
3. iprodione (15.3) 21 0.93t5.62t4.01t1.2ge 2.97
4 . triadimefon (7.6) 21 1.28g 1. 42d 1. 35
5. fenarimol (6.7) 21 1.39b2.34e 1. 87
6. propiconazole (4.2) 14 1.33eO.48g2.94a3.12t 1. 97
7. propiconazole (4.2) 21 2.20t 1. 75d 4. 94g 2. 93b 2.96
8. propiconazole (8.4) 21 2. SOh1 .71 d 1 . 36d 4 . 40c 2.49
9. propiconazole (16.8) 21 1.64c 1.17t2.42e 1. 74
10. propiconazole (4.2) 14 1.83e3.6ge1.83c2.51c 2.47chlorothalonil (95.5)
11. chlorothalonil (95.5) alt.wi propiconazole (4.2)
12. propiconazole (4.2) +iprodione (15.3)
14 alt. 1.38d2.47t1.33dO.63t 1.45wi 21
13. iprodione (15.3) alt.wi propiconazole (4.2)
14. Yr 1 and 4propiconazole (16.8)propiconazole (4.2)
Yr 2propiconazole (16.8)chlorothalonil (95.5)
Yr 3propiconazole (16.8)iprodione (15.3)
21
24C&28d28
24C&28d14
24C&28d21
XRates in 9 100 m-2.
Ylntervals between applications.aNine subsamples collected.
bEight subsamples collected.cSeven subsamples collected.
83
dSix subsamples collected.epive subsamples collected.fpour subsamples collected.
gThree subsamples collected.hTwo subsamples collected.

Table 2.10. Average-percent-relative growth for eachblock of ten subsamples collected (or fewer where noted)on 1 August 1997 and mean-percent-relative growth for eachtreatment shown along with the fungicides for eachtreatment.
TreatmentX
1. control2. chlorothalonil (95.5)3. iprodione (15.3)4. triadimefon (7.6)5. fenarimol (6.7)6. propiconazole (4.2)
7. propiconazole (4.2)
8. propiconazole (8.4)9. propiconazole (16.8)
10. propiconazole (4.2) +chlorothalonil (95.5)
11. chlorothalonil (95.5) alt.wi propiconazole (4.2)
12. propiconazole (4.2) +iprodione (15.3)
13. iprodione (15.3) alt.wi propiconazole (4.2)
14. Yr 1 and 4propiconazole (16.8)propiconazole (4.2)
Yr 2propiconazole (16.8)chlorothalonil (95.5)
Yr 3propiconazole (16.8)iprodione (15.3)
XRates in 9 100 m-2•
Ylntervals between applications.aNine subsamples collected.
84
DaysY I II III IV Mean
1. 06 1. 07 0.75 0.59" 0.8714 0.84 1. 34 1. 51 2.98 1. 6721 1.16" 1. 27 0.85 0.75"1.0121 0.89 0.74 1. 73 2.93 1. 5721 1. 05 0.63 2.06 1.40 1. 2914 1. 93 1. 60 1. 76 0.84 1. 53
21 2.05 1.16 2.19 1. 51 1. 73
21 0.92 1.14 1. 48 1. 60 1. 2921 0.90 1. 23 1. 69 0.87" 1.1814 0.79 1. 99 2.19 3.84 2.20
14 alto 0.79 0.99 1. 39 1. 39 1.14wi 21
21 1. 08 0.79 1.07 0.66b 0.90
21 0.62 0.62 0.99 1.05" 0.82
24C&28d 1.231.031.511.02" 1.2028
24C&28d14
24C&28d21
bEight subsamples collected.cSeven subsamples collected.

Table 2.11. Average-percent-relative growth for eachblock of ten subsamples collected (or fewer where noted)on 21 August 1998 and mean-percent-relative growth foreach treatment shown along with the fungicides for eachtreatment.
Trea trnentX DaysY I II III IV Mean
1. control2. chlorothalonil (95.5)3. iprodione (15.3)4. triadirnefon (7.6)5. fenarirnol (6.7)6. propiconazole (4.2)
7. propiconazole (4.2)
8. propiconazole (8.4)
9. propiconazole (16.8)
10. propiconazole (4.2) +chlorothalonil (95.5)
11. chlorothalonil (95.5) alt.wi propiconazole (4.2)
12. propiconazole (4.2) +iprodione (15.3)
13. iprodione (15.3) alt.wi propiconazole (4.2)
0.86 0.86 0.50 1.00 0.8114 1.11 1. 42 1. 29 4.15 1. 9921 0.86 0.42 0.80 0.75 0.7121 0.37 0.90 0.64 4.66 1. 64
21 0.86 0.50 1. 28 3.15 1. 45
14 2.480.97d 1.13 0.63 1. 30
21 1. 01 0.77 1.21 3.13 1. 53
21 0.76 0.26 1. 00 1. 27 0.82
21 1. 38 0.25 0.25 1. 36 0.81
14 2.02 2.702.53b4.60c 2.96
14 al t. 1. 00 1. 261. 45a 1. 89 1. 40wi 21
21 0.78 0.80 0.62 0.75 0.74
21 0.88 0.13 0.00 2.89 0.97
14. Yr 1 and 4propiconazole (16.8)propiconazole (4.2)
Yr 2propiconazole (16.8)chlorothalonil (95.5)
Yr 3propiconazole (16.8)iprodione (15.3)
24C&28d28
24C&28d14
24C&28d21
=================:::::;:b============XRates in g 100 rn-2• Seven subsarnples collected.Ylntervals between applications. cSix subsarnples collected.aEight subsarnples collected. dFour subsarnples collected.
85
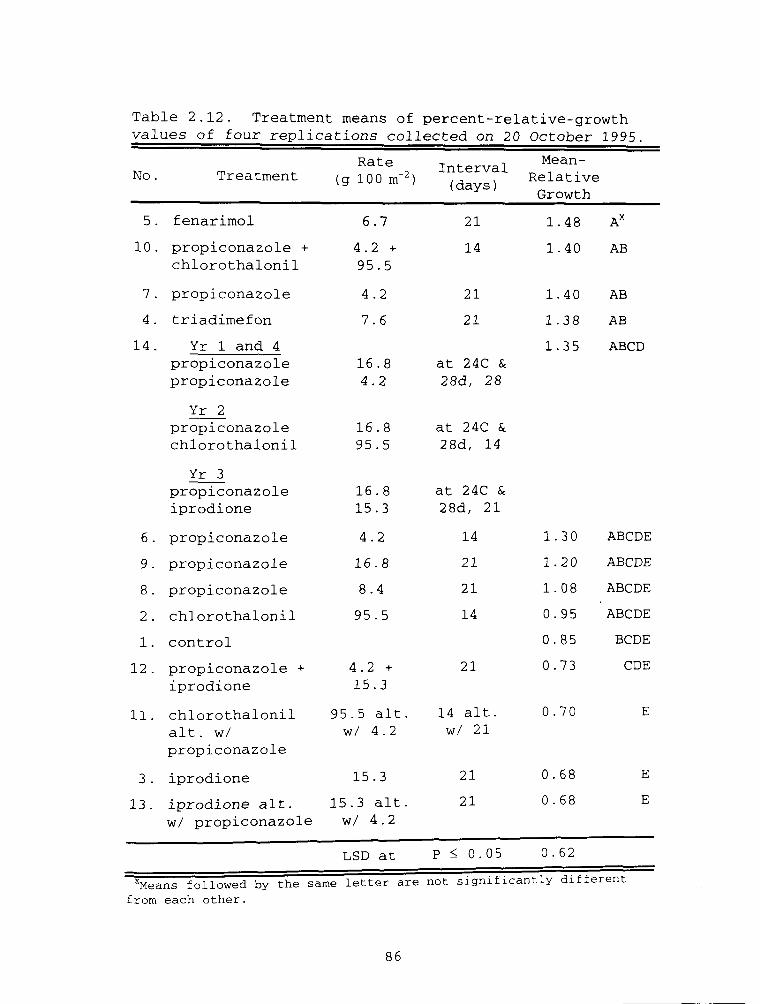
Table 2.12. Treatment means of percent-relative-growthvalues of four replications collected on 20 October 1995.
No. TreatmentRate
(g 100 m-2)Interval
(days)Mean-
RelativeGrowth
5. fenarimol10. propiconazole +
chlorothalonil
7. propiconazole4. triadimefon
14. Yr 1 and 4propiconazolepropiconazole
Yr 2propiconazolechlorothalonil
Yr 3propiconazoleiprodione
6. propiconazole9. propiconazole8. propiconazole2. chlorothalonil1. control
12. propiconazole +iprodione
11. chlorothalonilalt. wipropiconazole
3. iprodione13. iprodione alt.
wi propiconazole
6.74.2 +95.5
4.27.6
16.84.2
16.895.5
16.815.3
4.216.88.4
95.5
4.2 +15.3
95.5 altowi 4.2
15.315.3 alt.wi 4.2
LSD at
2114
2121
at 24C &28d, 28
at 24C &28d, 14
at 24C &28d, 21
14212114
21
14 al t.wi 21
2121
p S; 0.05
1.48
1.40
1.40
1.38
1.35
1.30
1.20
1.08
0.950.850.73
0.70
0.680.68
0.62
AB
ABABABCD
ABCDEABCDEABCDEABCDEBCDECDE
E
E
E
-=xMeans followed by the same letter are not significantly differentfrom each other.
86

Table 2.13. Treatment means of percent-relative-growthvalues of four replications collected on 1 August 1997.
No. TreatmentRate
(g 100 m-2)Interval
(days)
Mean-RelativeGrowth
10. propiconazole +chlorothalonil
7. propiconazole2. chlorothalonil4. triadimefon6. propiconazole5. fenarimol8. propiconazole
14. Yr 1 and 4propiconazolepropiconazole
Yr 2propiconazolechlorothalonil
Yr 3propiconazoleiprodione
9. propiconazole11. chlorothalonil
alt. wipropiconazole
3. iprodione12. propiconazole +
iprodione
1. control13. iprodione alt.
wi propiconazole
4.2 +95.5
4.295.57.64.26.78.4
16.84.2
16.895.5
16.815.3
16.895.5 alt.wi 4.2
15.34.2 +15.3
15.3 al t.wi 4.2
LSD at
14
211421142121
at 24C &28d, 28
at 24C &28d, 14
at 24C &28d, 21
2114 alt.wi 21
2121
21
p ~ 0.10
2.20
1.73
1. 67
1. 57
1. 53
1. 45
1.29
1.20
1.18
1.14
1. 01
0.90
0.870.82
0.66
AB
ABCABCBCDBCDEBCDEBCDE
BCDEBCDE
CDEDE
E
E
XMeans followed by the same letter are not significantly differentfrom each other.
87

Table 2.14. Treatment means of percent-relative-growthvalues of four replications collected on 21 August 1998.
No. TreatmentRate
(g 100 m-2)Interval
(days)Mean-
RelativeGrowth
10. propiconazole +chlorothalonil
2. chlorothalonil4. triadimefon7. propiconazole5. fenarimol
11. chlorothalonilalt. wipropiconazole
6. propiconazole14. Yr 1 and 4
propiconazolepropiconazole
Yr 2propiconazolechlorothalonil
Yr 3propiconazoleiprodione
13. iprodione alt.wi propiconazole
8. propiconazole9. propiconazole1. control
12. propiconazole +iprodione
3. iprodione
4.2 +95.5
95.57.64.26.7
95.5 alt.wi 4.2
4.2
16.84.2
16.895.5
16.815.3
15.3 alt.wi 4.2
8.416.8
4.2 +15.3
15.3
LSD at
14
14212121
14 alt.wi 21
14
at 24C &28d, 28
at 24C &28d, 14
at 24C &28d, 21
21
2121
21
21
p ~ 0.05
2.96
1. 99
1. 64
1. 53
1. 45
1.40
1. 30
1. 22
0.97
0.820.810.810.74
0.71
1.11
ABBCBCBCBC
BCBC
BC
C
C
C
C
C
XMeans followed by the same letter are not significantly differentfrom each other.
88

Table 2.15. Number of chlorothalonil applicationsapplied in 1994, 1995, 1996, and 1997.
Year
1994
1995
1996
1997
Total
Trot. 11(propiconazole alt.wi chlorothalonil)
2
2
3
3
10
89
Trot. 2(chlorothalonil alone)
and Trot. 10(propiconazole +chlorothalonil)
4
4
6
6
20

Table 2.16. Chlorothalonil amounts In g 100 m-2 applied In1994, 1995, 1996, and 1997.
Year
1994
1995
1996
1997
Total
Tmt. 11(propiconazole alt.wi chlorothalonil)
191
191
287
287
955
90
Tmt. 2(chlorothalonil alone)
and Trot. 10(propiconazole +chlorothalonil)
382
382
573
573
1910

Table 2.17. An example of application rates and timingintervals of treatments for a study that would have hadgreater efficiency than the one conducted and presented InChapter 2.
Treatment Rate (g 100 m-2) Interval (days)
1. control
2. chlorothalonil 45.3 10 alt 11
3. propiconazole 4.2 21
4. iprodione 15.3 21
5. propiconazole + 4.2 + 45.3 21chlorothalonil
6. propiconazole alt. 4.2 alt. 21 alt. wiwi chlorothalonil wi 45.3 10 or 11
7. iprodione + 15.3 + 45.3 21chlorothalonil
8. iprodione alt. 15.3 alt. 21 alt. wiwi chlorothalonil wi 45.3 10 or 11
9. propiconazole + 4.2 + 15.3 21iprodione
10. propiconazole alt. 4.2 alt. 21wi iprodione wi 15.3
91

12 14 3 8 11 9 1
N
r - - --I r----. r----' r----. r---- r - - --, r----I I I I I I I I I I I II I I I I I I I I I I II I I I I I I I I I I II I I I I I I I I I I II I I I I I I I I I I II I I I I I I I I I I II I I I I I I , I I I II I I I I I I I I I I II I I I I I I I I I I II I I I I I I I I I I II I I I I I I I I I I I,,--- -" "----,, 1.----" 1.----" ,,---- ,,-- --" "'----
r---- r---- r - - --. r----. r -- --I r - - --. r----.I I I I I I I I I I I II I I I I I I I I I I II I I I I I I I I I I II I I I I I I I I I I II I I I I I I I I I I II I I I I I I I I I I II I I I I I I I I I I II I I I I I I I I I I II I I I I I I I I I I II I I I I I I I I I I II I I I I I I I I I I I.. ---- 1.-- __ .. ----" 1. ____ 01 1.--- _" 1.----" ,,--- - ..
6 4 2 7 10 5 13
Figure 2.1. Map of Block 4 with treatment numbersabove or below each 2.1 m by 8.4 m (17.6 m2) plot with1.2 m by 3 m (3.6 m2) sampling areas outlined andmowing directions indicated by parallel arrows lnopposite directions.
92

3.5
A3
2.5
2
1.5
1
0.5
o20 Oct 95P ~ 0.05
1 Aug 97p ~ 0.10
21 Aug 98p ~ 0.05
~ Tmt 11DTmt 2• Tmt 10
- chlorothalonil alt. propiconazole- chlorothalonil- propiconazole + chlorothalonil
XTreatments sharing the same letter are not significantlydifferent.
Figure 2.2. Mean-percent-relative growth of threetreatments with four replications at three-observationdates with each of the treatments that appliedchlorothalonil.
93

List of References
1. Agrios, G. N. 1997. Plant Pathology. 4th ed. SanDiego: Academic Press. 635 p.
2. Andrade, A. C., Del Sorbo, G., Van Nistelrooy, J. G.M., and De Waard, M. A. 2000. The ABC transporterAtrB from Aspergillus nidulans mediates resistance toall major classes of fungicides and some naturaltoxic compounds. Microbiology-Uk 146:1987-1997.
3. Anonmymous. 1985. Fenarimol (Rubigan) Chemical FactSheet 2/85. Pest. Mgt. Edu. Prog., Cornell Univ./25May 2004.
4. Anonmymous. 1992. Propiconazole fungicide. (internal-corporate document) Ciba Crop Protection.
5. Anonmymous. 1994. Supplemental Labeling: Rubigan A.S. Turf and Ornamental (EPA Reg. No. 62719-142) Poaannua Management Program for Overseeded BermudagrassGreens and Tees. Dow AgriSciences.
6. Anonmymous. 2000. Syngenta merger gets green lightfrom European Commission. Syngenta/2 June 2004.
7. Anonmymous. 2000. Specimen Label: Rubigan A. S. Turfand Ornamantal Specialty Fungicide. Dow AgroSciencesLLC.
8. Anonmymous. 2002. Chemically speaking; March 2002.Fla. Pesticide Info. Office/03cmsp02 25 May 2004.
9. Appleby, A. P. 2002. Herbicide Company Genealogy.Dept. of Crop Sci., Oregon St. Univ./25 May 2004.
10. Benveniste, P. and Rahier, A. 1992. Target sites ofsterol boisynthesis inhibitors in plants. p. 207-226.In Target Sites of Fungicide Action, edited by W.Koller. Boca Raton FL: CRC Press.
11. Berg, D. and Plempel, M. 1988. Preface. p. 15-16. InSterol Biosynthesis Inhibitors: Pharmaceutical andAgrochemical Aspects: Part I: Chemistry, Mode ofAction, Toxicology and General Aspects of Sterol
94

Biosynthesis Inhibitors, edited by D. Berg and M.Plempel. New York: Ellis Horwood, Ltd. and VCH.
12. Bossche, H. V. 1988. Mode of action of pyridine,pyrimidine, and azole fungicides. p. 79-119. InSterol Biosynthesis Inhibitors: Pharmaceutical andAgrochemical Aspects: Part I: Chemistry, Mode ofAction, Toxicology and General Aspects of SterolBiosynthesis Inhibitors, edited by D. Berg and M.Plempel. New York: Ellis Horwood, Ltd. and VCH.
13. Bossche, H. V. and Janssen, P. A. 1992. Target sitesor sterol biosynthesis inhibitors: Secondaryactivities on cytochrome P-450-dependent reactions.p. 227-254. In Target Sites of Fungicide Action,edited by W. Koller. Boca Raton FL: CRC Press.
14. Buchenauer, H. 1987. Mechanism of action of trazolylfungicides and related compounds. p. 205-232. InModern Selective Fungicides: Properties,Applications, and Mechanisms of Action, edited by H.Lyr. Essex, England: Longman Scientific Tech.
15. Burpee, L. L. 2001. Growth of Sclerotinia homoeocarpaas affected by repeated exposure to propiconazole.IntI. Turfgrass Soc. Res. J. 9:645-648.
16. Couch, H. B. 2003. Strategies for preventing andmanaging fungicide resistance: Rotating fungicideswith different biochemical modes of action and usingfungicide mixtures are the two primary strategies formanaging fungicide resistance. Golf CourseManagement, 71(5), p. 111-115.
17. de Waard, M. A. 1997. Significance of ABCtransporters in fungicide sensitivity and resistance.pestic. Sci. 51:271-275.
18. de Waard, M. A. and Van Nistelrooy, J. G. M. 1990.Stepwise development of laboratory resistance to DMI-fungicides in penicillium italicum. Neth. J. plantpathol. 96:321-329.
19. de Waard, M. A., Van Nistelrooy, J. G. M., Langveld,C. R., Van Kan, J. A. L., and Del Sorbo, G. 1996.Multidrug resistance in filamentous fungi. p. 293-300. In Modern Antifungal Compounds, edited by H.
95

Lyr, P. E. Russel and H. D. Sisler. Andover, England:Intercept Press.
20. Debieu, D., Bach, J., Arnold, A., Brousset, S.,Gredt, M., Taton, M., Rahier, A., Malosse, C., andLeroux, P. 2000. Inhibition of ergosterolbiosynthesis by morpholine, piperidine, andspiroketalamine fungicides in Microdochium nivale:Effect on sterol composition and sterol Delta(8) ->Delta(7)-isomerase activity. Pestic. Biochem.Physiol. 67:85-94.
21. DeBono, M., Abbott, B. J., Turner, J. R., Howard, L.C., Gordee, R. S., Hunt, A. S., Barnhart, M., Molloy,R. M., Willard, K. E., Fukuda, D., Butler, T. F., andZeckner, D. J. 1998. Synthesis and evaluation ofLY121019: a member of a series of semisyntheticanalogues of the antifungal lipopeptide echinocandinB. p. 152-167. In Antifungal Drugs: Part II:Structural Slucidation, Synthesis, and AntifungalActivity of Natural Products and RelatedDerivatives:, edited by V. St. Georgiev. New York: N.Y. Acad. Sci.
22. Dernoeden, P. H. 1995. Turfgrass diseases and theirmanagement. p. 87-170. In Managing Turfgrass Pests,edited by T. L. Watschke, P. H. Dernoeden and D. J.Shetlar. Boca Raton FL: Lewis Pub.
23. Dismukes, W. E., Wade, J. S., Lee, J. Y., Dockery, B.K., and Hain, J. D. 1990. A randomized, double-blindtrial of nystatin therapy for the candidiasishypersensitivity syndrome. N. Engl. J. Med. 323:1717-1725.
24. Fletcher, R. A. and Hofstra, G. 1988. Triazoles aspotential plant protectants. p. 321-331. In SterolBiosynthesis Inhibitors: Pharmaceutical andAgrochemical Aspects; Part II: Sterol SynthesisInhibitors In Plant Protection. New York: EllisHorwood LTD and VCH.
25. Gasztonyi, M. and Lyr, H. 1887. Other fungicides. p.309-324. In Modern Selective Fungicides: Properties,Applications, and Mechanisms of Action, edited by H.Lyr. Essex, England: Longman Scientific Tech.
96

26. Georgopoulus, S. G. 1988. Genetics and populationdynamics. p. 12-13. In Fungicide Resistance in NorthAmerica, edited by C. J. Delph. St Paul MN: APSPress.
27. Gilstrap, D., Vargas, J., Jr., Schabenberger, 0., andGolembiewski, R. 1998. Fungicide use on DMI-resistantdollar spot. 70th Ann. Mich. Turfgrass Conf.Proceed., Vol. 27, p. 137-139.
28. Gilstrap, D., Vargas, J., Jr., Golembiewski, R.,Jones, A., and Schabenberger, O. 1997. Fungicideefficacy on demethylation inhibition (DMI) resistantSclerotinia homoeocarpa. Res. J. Int. Turfgrass Soc.8:875-881.
29. Gold, W., Staut, H. A., Pagano, J. F., and Donovick,R. 1956. Amphotericins A and B: Antifungalantibiotics produced by a Streptomycete. p. 579-586.In Antibiotics Annual, 1955-1956. New York: MedicalEncyclopedia.
30. Golembiewski, R. C. 1994. Characterization ofdemethylation inhibitor (DMI) resistant Sclerotiniahomoeocarpa. Thesis (M.S.), Mich. St. Univ., 74 p.
31. Golembiewski, R. C., Vargas Jr., J. M., Jones, A. L.,and Detweiler, A. R. 1995. Detection of demethylationinhibitor (DMI) resistance in Sclerotinia homoeocarpapopulations. plant Dis. 79:491-493.
32. Gouot, J.-M. 1988. Characteristics and populationdynamics of Botrytis cinerea and other pathogensresistant to dicarboximidies. p. 53-55. In FungicideResistance in North America, edited by C. J. Delph.St Paul MN: APS Press.
33. Grewe, F. and Buchel, K. H. 1973. Ein neuesMehltaufungizid aus der Klasse der Trityltriazole.Mitt. BioI. Bundesanst. 151:208-209.
34. Hazen, E. L. and Brown, R. 1950. Two antifungalagents produced by a soil actinomycete. Science112:423.
35. Hewitt, H. G. 1998. Fungicides in Crop Protection.New York: CAB International. 221 p.
97

36. Horvath, B. J. 2003. Epidemiology of Sclerotiniahomoeocarpa in Michigan: Geostatistical andPopulation Biological Approaches. Diss. (Ph. D.),Mich. St. Univ., 58 p.
37. Izquierdo, M. A., Neefjes, J. J., Mathari, A. E. L.,Flens, M. J., Scheffer, G. L., and Scheper, R. J.1996. Overexpression of the ABC transporter TAP inmultidrug-resistant human cancer cell lines. Brit. J.Cancer 74:1961-1967.
38. Kane, R. T. and Wilkinson, H. T. 1992. Development ofresistance and/or tolerance to fungicides by turfpathogens on Illinois golf courses. 1991 IllinoisTurfgrass Research Report, March 1992, p. 114-119.
39. Kato, T., Yamamoto, S., Kawase, Y., and Ueda, M.1975. Fungitoxic properties of a N-3pyridylimidadithiocarbonate devivative. Ann.Phytopathol. Soc. of Japan 41:1-8.
40. Kerkenaar, A. 1987. Mechanism of action of morpholinefungicides. p. 159-171. In Modern SelectiveFungicides: Properties, Applications, and Mechanismsof Action, edited by H. Lyr. Essex, England: LongmanScientific Tech.
41. Kerridge, D. and Whelen, W. L. 1984. The polyenemacrolide antibiotics and 5-fluorocytosine:molecular actions and interactions. p. 405. In Modeof Action of Antifungal Agents, edited by A. P. J.Trinci and J. F. Ryley. Cambridge and New York:Cambridge Univ. Press.
42. Kerridge, D., Fasoli, M., and Wayman, F. 1988. Drugresistance in Candida albicans and Candida glabrata.p. 245-259. In Antifungal Drugs: Part III.Biochemical Studies and Mechanism of Action ofAntifungal Agents, edited by V. St. Georgiev. NewYork: NY Acad. Sci.
43. Koller, W. 1988. Sterol demethylation inhibitors:mechanism of action and resistance. p. 79-88. InFungicide Resistance in North America, edited by C.J. Delph. St Paul MN: APS Press.
98

44. Koller, W. 1992. Antifungal agents with target sitesin sterol functions and biosynthesis. p. 119-206. InTarget Sites of Fungicide Action, edited by W.Koller. Boca Raton FL: CRC Press.
45. Koller, W. 1992. Target research in the discovery anddevelopment of antifungal inhibitors. p. 255-311. InTarget Sites of Fungicide Action, edited by W.Koller. Boca Raton FL: CRC Press.
46. Koller, W. and Scheinpflug, H. 1987. Fungalresistance to sterol biosynthesis inhibitors. PlantDis. 71:1066-1074.
47. Koller, W. and wilcox, W. F. 2001. Evidence for thepredisposition of fungicide-resistant isolates ofVenturia inaequalis to a preferential selection forresistance to other fungicides. Phytopathology91:776-781.
48. LaMondia, J. A. 2001. Resistance of the Euonymousanthracnose pathogen, Colletotrichum gloeosporioides,to selected fungicides. J. Environ. Hort. 19:47-50.
49. Lamour, K. H., Daughtrey, M. L., Benson, D. M.,Hwang, J., and Hausbeck, M. K. 2003. Etiology ofPhytophthora drechsleri and P. nicotianae (=P.parasitical diseases affecting floriculture crops.Plant Dis. 87:854-858.
50. Leroux, P., Fritz, R., Debieu, D., Albertini, C.,Lanen, C., Bach, J., Gredt, M., and Chapeland, F.2002. Mechanisms of resistance to fungicides in fieldstrains of Botrytis cinerea. Pest Manage. Sci.58:876-888.
51. Litman, T., Druley, T. E., Stein, W. D., and Bates,S. E. 2001. From MDR to MXR: New understanding ofmultidrug resistance systems, their properties andclinical significance. Cell. Molecul. Life Sci.58:931-959.
52. Loucher, F. 1988. Strategies to controldicarboximide-resistant strains of plant pathogens.p. 56-57. In Fungicide Resistance in North America,edited by C. J. Delph. St Paul MN: APS Press.
99

53. Lyr, H. 1987. Mechanism of action of triazolylfungicides and related compounds. p. 205-231. InModern Selective Fungicides: Properties,Applications, and Mechanisms of Action, edited by H.Lyr. Essex, England: Longman Scientific Tech.
54. Menn, W. G. 1985. An evaluation of fenarimol for pre-and post-emergent control of annual bluegrass (Poaannua L.) in overseeded bermudagrass greens. TexasTurfgrass Research - 1985, August 1985, p. 79-85.
55. Menn, W. G. 1986. Use of fenarimol for selectivelycontrolling Poa annua in an overseeded bermudagrassgolf green. USGA Green Section Record, 24(5)September/October, p. 11-12.
56. Menn, W. G. and Beard, J. B. 1984. Use of fenarimolfor controlling annual bluegrass (poa annua L.) Inoverseeded bermudagrass greens. Agron. Abstr.(1984) :153.
57. Mercer, E. I. 1991. Sterol biosynthesis inhibitors:Their current status and modes of action. Lipids26:584-597.
58. Mercer, E. J. 1988. The mode of action ofmorpholines. p. 120-150. In Sterol BiosynthesisInhibitors: Pharmaceutical and Agrochemical Aspects:Part I: Chemistry, Mode of Action, Toxicology andGeneral Aspects of Sterol Biosynthesis Inhibitors,edited by D. Berg and M. Plempel. New York: EllisHorwood, Ltd. and VCH.
59. Nes, W. D. 2003. Enzyme mechanisms for sterol Cmethylations. Phytochemistry 64:75-95.
60. Nicholson, J. F., Meyer, W. A., Sinclair, J. B., andButler, J. D. 1971. Turf isolates of Sclerotiniahomoeocarpa tolerant to Dyrene. phytopathologischeZeitschrift 72:169-172.
61. Petzoldt, C. H. and Perkins, A. T. 1983. Newturfgrass fungicides: Rubigan. Proc. 37th Annl. N.Y. St. Turfgrass Conf., Vol. 7, p. 26.
100

62. pijls, C. F. N. and Shaw, M. W. 1997. Weak selectionby field sprays for flutriafol resistance in Septoriatritici. Plant Pathol. 46:247-263.
63. Pommer, E.-H. 1987. Morpholine fungicides. p. 143-171. In Modern Selective Fungicides: Properties,Applications, and Mechanisms of Action, edited by H.Lyr. Essex, England: Longman Scientific Tech.
64. Reuveni, M. and Sheglov, D. 2002. Effects ofazoxystrobin, difenoconazole, polyoxin B (polar) andtrifloxystrobin on germination and growth ofAlternaria alternata and decay in red delicious applefrvit. Crop Protect. 21:951-955.
65. Rosenberg, K. A., Caruso, F. L., and Zuck, M. G.1986. Synergistic interaction between sterol-inhibitor and protectant fungicides in the treatmentof Venturia-Inaequalis. Phytopathology 76:658-658.
66. Ryder, N. S. 1988. Mode of action of allylamines. p.151-167. In Sterol Biosynthesis Inhibitors:Pharmaceutical and Agrochemical Aspects; Part I:Chemistry, Mode of Action, Toxicology and GeneralAspects of Sterol Biosynthesis Inhibitors, edited byD. Berg and M. Plempel. New York: Ellis Horwood LTDand VCH.
67. Ryder, N. S. 1988. Mechanism of action andbiochemical selectivity of allylamine antimycoticagents. p. 208-220. In Antifungal Drugs: Part III.Biochemical Studies and Mechanism of Action ofAntifungal Agents, edited by V. St. Georgiev. NewYork: N. Y. Academy of Sciences.
68. Ryley, J. F., Wilson, R. G., Gravestock, M. B., andPoyser, J. P. 1981. Experimental approaches toantifungal therapy. Adv. Pharmacol. Chemother. 18:49-176.
69. Sabine, J. R. 1977. Cholesterol. New York: M. Dekker.489 p.
70. Sawicka, M., Kalinowska, M., Skierski, J., andLewandowski, W. 2004. A review of selected anti-turnour therapeutic agents and reasons for multidrug
101

resistance occurrence. J. Pharm. Pharmacol. 56:1067-1081.
71. Scheinpflug, H. 1988. History of DMI fungicides andmonitoring for resistance. p. 76-78. In FungicideResistance in North America, edited by C. J. Delph.St Paul MN: APS Press.
72. Scheinpflug, H. and Kuck, K. H. 1987. Sterolbiosynthesis inhibiting piperazine, pyridine,pyrimidine, and azole fungicides. p. 173-204. InModern Selective Fungicides: Properties,Applications, and Mechanisms of Action, edited by H.Lyr. Essex, England: Longman Scientific Tech.
73. Schluter, G. and Schmidt, U. 1988. Toxicology ofazoles. p. 185-209. In Sterol BiosynthesisInhibitors: Pharmaceutical and Agrochemical Aspects:Part I: Chemistry, Mode of Action, Toxicology andGeneral Aspects of Sterol Biosynthesis Inhibitors,edited by D. Berg and M. Plempel. New York: EllisHorwood LTD and VCH.
74. Schulz, U. and Scheinpflug, H. 1988. Sterolbiosynthesis inhibiting fungicides: Antifungalproperties and application in cereals. p. 211-261. InSterol Biosynthesis Inhibitors: Pharmaceutical andAgrochemical Aspects: Part II: Sterol SynthesisInhibitors In Plant Protection, edited by D. Berg andM. Plempel. New York: Ellis Horwood LTD and VCH.
75. Schumann, G. L., Clark, J. M., Doherty, J. J., andClarke, B. B. 2000. Application of DMI fungicides toturfgrass with three delivery systems. p. 150-163. InFate and Management of Turfgrass Chemicals, edited byJ. M. Clark and M. P. Kenna. Washington D. C.:American Chemical Society.
76. Schwinn, F. J. 1984. Ergosterol biosynthesisinhibitors: An overview of their history andcontribution to medicine and agriculture. pestic.Sci. 15:40-47.
77. Staub, T. 1991. Fungicide resistance: Practicalexperience with antiresistance strategies and therole of integrated use. Annl. Rev. Phytopathol.29:421-442.
102

78. Staub, T. and Sozzi, D. 1984. Fungicide resistance:A continuing challenge. Plant Dis. 68:1026-1031.
79. Steffens, W. and Wienecke, J. 1981. Behavior and fateof the C14-labelled mildew fungicide fluotrimazole lnplant and soil. Z. Pflanzenkrankh 88:343-354.
80. Stergiopoulos, I., Zwiers, L. H., and De Waard, M. A.2002. Secretion of natural and synthetic toxiccompounds from filamentous fungi by membranetransporters of the ATP-binding cassette and majorfacilitator superfamily. Eur. J. Plant Pathol.108:719-734.
81. Stergiopoulos, I., van Nistelrooy, J. G. M., Kema, G.H. J., and De Waard, M. A. 2003. Multiple mechanismsaccount for variation in base-line sensitivity toazole fungicides in field isolates of Mycosphaerellagraminicola. Pest Manag. Sci. 59:1333-1343.
82. Szkolnik, M. and Gilpatrick, J. D. 1969. Apparentresistance of Venturia inaequalis to dodine in NewYork apple orchards. Plant Dis. Rep. 53:861-865.
83. van den Brule, S., Muller, A., Fleming, A. J., andSmart, C. C. 2002. The ABC transporter SpTUR2 confersresistance to the antifungal diterpene sclareol.Plant J. 30:649-662.
84. Vargas, J. M. 1998. Managing resistance: Part I.Fungicides: The strategy of preventing turfgrass-pathogen resistance by alternating fungicides isineffective. Grounds Maintenance, 33, p. 18-24.
85. Vargas, J. M., Jr. 1994. Management of TurfgrassDiseases. 2nd ed. Boca Raton FL: CRC Press. 294 p.
86. Vargas, J. M., Jr. 2002. To rotate or not to rotate?:Superintendents may not fully understand therationale for rotating fungicides. Golf CourseManagement, 70(4), p. 53-56.
87. Vargas, J. M., Jr. 2005. Management of TurfgrassDiseases. 3rd ed. Hoboken NJ: Wiley. 322 p.
103

88. Vargas, J. M., Jr. and Turgeon, A. J. 2004. Poaannua: Physiology, Culture, and Control of AnnualBluegrass. Hoboken NJ: Wiley. 165 p.
89. Vargas, J. M., Jr., Golembiewski, R., and Detweiler,A. R. 1992. Dollar spot resistance to DMI fungicides.Golf Course Management, March, p. 50-54.
90. Vincelli, P. 1997. Mixing fungicides controls diseaseon bentgrass greens: Some tank mixes are moreeffective than others. Golf Course Management, 65(9),p. 49-55.
91. Vincelli, P. 2002. New cases of DMI resistant dollarspot. College of Agriculuture, University ofKentucky. Kentucky Pest News/pn020603 27 May 2004.
92. Ware, G. W. 1978. The Pesticide Book. San Francisco:W. H. Freeman. 197 p.
93. Ware, G. W. 1994. The pesticide Book. 4th ed. FresnoCA: Thomson. 386 p.
94. Ware, G. W. 2000. The Pesticide Book. 5th ed.Bakersfield CA: Kovak Books. 418 p.
95. Weete, J. D. 1989. Structure and Function of Sterolsin Fungi. Adv. Lipid Res. 23:115-167.
96. Wong, F. 2002. New fungicides for California turf,2002-2004. Better Turf Through Agronomics, Dec., p.4.
97. Worthington, P. A. 1988. Chemistry of sterolbiosynthesis inhibitors: Piperazines, pyridines,pyrimidines, imidazoles, 1,2,4-triazoles,morpholines, piperidines, allylamines. p. 19-55. InSterol Biosynthesis Inhibitors: Pharmaceutical andAgrochemical Aspects: Part I: Chemistry, Mode ofAction, Toxicology and General Aspects of SterolBiosynthesis Inhibitors, edited by D. Berg and M.Plempel. New York: Ellis Horwood LTD and VCH.
104